Comparison of electron energy-loss and quantitative optical spectroscopy on individual optical gold antennas
-
Martin Husnik
 ,
Felix von Cube
,
Felix von Cube

Abstract
Using a rather large set of different individual metallic optical antennas, we compare directly measured electron energy-loss spectra with measured quantitative optical extinction and scattering cross-section spectra on the identical antennas. All antenna resonances lie near 1.4 µm wavelength. In contrast to other reports, we find identical resonance positions for electrons and photons to within the experimental errors. We discuss possible artifacts which can lead to seemingly different resonance positions in experiments. Our experimental results agree well with complete numerical calculations of both sorts of spectra.
Edited by Niek van Hulst
1 Introduction
To characterize individual metallic nano-antennas resonating at optical frequencies, optical spectroscopy [1] as well as electron energy-loss spectroscopy (EELS) have recently been employed [2]. EELS can be seen as the counterpart of Raman spectroscopy in optics as one measures the number of emerging electrons that have lost a certain kinetic energy. One advantage of EELS lies in its much better spatial resolution compared to optics due to the shorter de Broglie wavelength of electrons. Furthermore, EELS allows for coupling to resonances that are optically “dark” due to zero or very small electric-dipole moments. One advantage of optical spectroscopy lies in the currently much better spectral resolution. State-of-the-art EELS is limited to spectral line widths on the order of 100 meV, whereas optics can easily go to µeV. Typical metallic nano-antennas have line widths of few 10 meV.
Does one expect the same or different resonance positions when inspecting optical antennas with either incident electrons or incident photons? We should like to argue that, on the basis of the experimental literature, the answer is not really clear. Several decades ago, Kreibig and Zacharias [3] have systematically compared EELS and optical spectra of colloids of gold and silver nanoparticles in the range from about 10 to 100 nm particle diameter. Under these conditions, not only intraband (i.e., free electrons) but also interband transitions in the metal play a significant role. They found the EELS resonance positions to be systematically blue-shifted with respect to the optical extinction-resonance positions. The blue shift increased in magnitude with increasing particle diameter and reached values exceeding 800 meV for 80 nm diameter silver particles [3]. A blue shift of EELS compared to optics of about the same magnitude was also found in much later theoretical work [4] on prolate gold spheroids. Later experimental work on higher-order plasmonic resonances of silver nanorods did not show a clear correlation between the resonances of measured EELS and measured optical dark-field scattering spectra [5]. More recent experimental work on gold nanodecahedra found a blue shift of the fundamental EELS resonance compared to the fundamental optical-scattering and cathodoluminescence resonance on the order of 100 meV [6]. They compared their results to a recent paper using a simple harmonic-oscillator model [7], referring to earlier numerical calculations [8]. Within the harmonic-oscillator model [7], near-field probes reveal resonances that are red-shifted with respect to far-field probes. If one thinks of EELS as a near-field probe, experiment [6] and theory [7] actually give shifts of opposite sign. Other theoretical work found no significant shift between EELS and optics [9]. Altogether, the situation seemed unclear to us before starting our own corresponding work.
Before presenting our work, we should like to discuss several possible sources of seemingly different resonance positions between EELS and optics. First, optical spectroscopy is usually performed under ambient conditions, whereas EELS requires high-vacuum conditions. Under ambient conditions, the sample surface is often covered by a thin water film. Due to the higher refractive index of water compared to air, such film leads to a small blue-shift of EELS compared to optics. Second, due to the high-vacuum environment in EELS, the samples have to be and are usually cleaned, e.g., by an air plasma, to remove organic residues prior to bringing the sample into the high-vacuum EELS chamber. Such cleaning is neither necessary nor common for optical spectroscopy and, hence, usually not performed. Removal of organic residues leads to an apparent blue shift of the resonance when going from optics to EELS. Third, exposure with electrons for extensive periods of time can lead to carbon deposition in the process of performing an EELS experiment in a chamber with finite high-vacuum pressure, leading to a red shift of the antenna resonance with time. Fourth, one should be aware that the primary electron energy is typically as large as 100 keV whereas the resonant electron energy-loss is on the order of 1 eV. By fitting, the resonance position can be determined with a fitting error in the range of 10–20 meV for typical EELS statistics. With our state-of-the-art instrument, the absolute error of the electron energy scale is in the range of 10–20 meV, which corresponds to about 15–30 nm wavelength error at around the resonance wavelength of our below experiments. In optics, the resonance position can be determined with much better precision, provided the data quality is high. Fifth, one might get charging effects in EELS (obviously not in optics) if the underlying substrate is not sufficiently conductive. Charging the metal structure shifts the plasma energy and hence the resonance position. These effects are specially pronounced for thin structures [10].
2 Experimental methods
In our work, the samples containing individual gold optical antennas are fabricated using standard electron-beam lithography, high-vacuum evaporation of 35 nm gold onto 30 nm thin SiN membranes, and a subsequent lift-off process. The lateral antenna parameters have been chosen to result in resonance positions in the infrared to avoid possible effects of interband transitions in the metal like, e.g., in [3]. Further details are described in [1]. The experimental technique allowing for measuring quantitatively the optical scattering and extinction cross-section spectra has also been described in [1] and shall not be repeated here. As expected from theory [11], scattering and extinction do not exhibit exactly the same resonance positions [1]. The fact that we have been and are able to resolve these small differences can be taken as an indicator of the quality of the technique and our data. The EELS technique is also established [2, 12–14] and shall not be repeated here. We use a Zeiss Libra200 STEM, equipped with a monochromator, a Cs-corrector for the illumination system, and an in-column Omega-type energy filter. At 200 kV acceleration voltage, we achieve an energy resolution of 0.15 eV (FWHM of the zero-loss peak).
On the basis of our above discussion regarding artifacts leading to seemingly different resonance positions between EELS and optics, we have first performed optical experiments, next the EELS experiments, and then again optical experiments on the very same sample. Clearly, differences between the first and the second set of optical experiments indicate artifacts brought about by the sample preparation for the EELS experiments and/or by the EELS experiments themselves.
3 Experimental results
Figure 1 summarizes a representative part of our experiments by showing four different individual nano-antennas ranging from a straight wire antenna (top) towards a split-ring resonator (bottom). As observed previously [1], the optical scattering cross-section spectra taken before the EELS experiment are slightly blue-shifted with respect to the extinction cross-section spectra taken before EELS because extinction is the sum of scattering and absorption and absorption is red-shifted with respect to scattering. The same qualitative behavior is found for the optical spectra taken after the EELS experiments, however, these optical spectra tend to be blue-shifted with respect to their counterparts before EELS. In independent additional experiments, we have measured optical spectra before and after plasma cleaning in oxygen plasma for 2 min. This has resulted in comparable blue shifts (not depicted). The EEL spectra also shown in Figure 1 are generally much broader than the optical spectra due to the finite EELS resolution. The spectral maximum of the EEL spectra is blue-shifted with respect to the maximum of the optical extinction cross-section spectra taken before EELS. For the lowest three individual antennas in Figure 1, the spectral peak of EELS is slightly shifted to lower energies compared to that of the extinction cross-section after EELS. However, the straight wire antenna at the top of Figure 1 is an exception. Judging from four further samples not depicted here, we find no significant spectral shifts between the maxima of EELS and optical extinction after EELS.
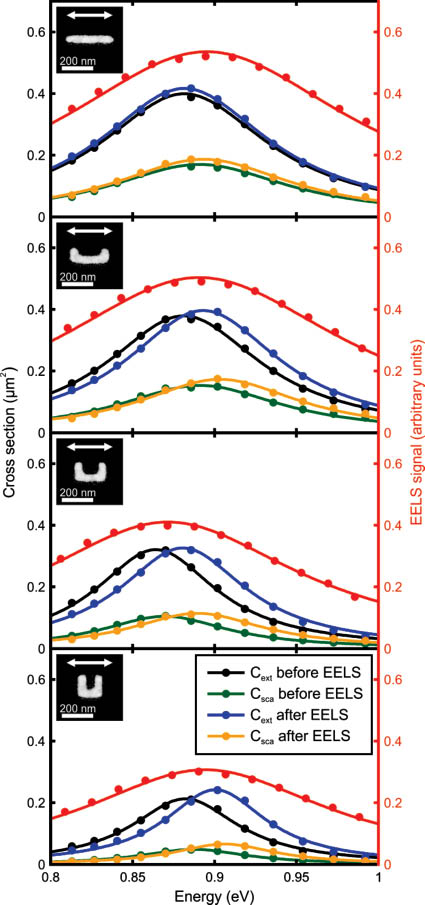
Quantitative optical spectra and electron energy-loss spectra (EELS) on four individual gold antennas as shown by the electron-micrograph insets in the upper left-hand side corner of each panel. “Energy” on the horizontal axis refers to the photon energy for the optical data and to the energy lost by the electron for the EELS data. The optical spectra have been taken before and after the EELS experiments. The color code is the same for all four panels and is given in the legend in the lowest panel. Extinction before (black), extinction after (blue), scattering before (green), scattering after (orange), and EELS (red) are shown. The linear polarization used for all optical experiments is indicated by the white double-arrows in the insets. All gold antennas have a thickness of 35 nm.
To highlight the quality of our EELS data, Figure 2 depicts EELS maps of the identical samples as in Figure 1 corresponding to the positions of the maxima of the EEL spectra shown in Figure 1. The data there are taken at the spatial maxima at the gold wire ends, which can clearly be seen in Figure 2.
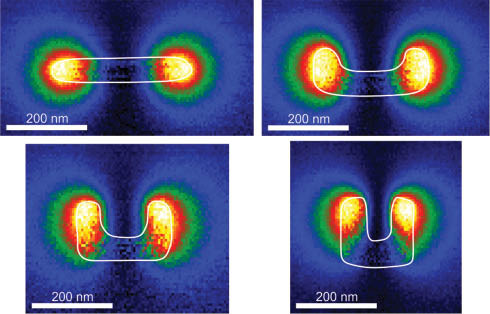
EELS maps taken on the same individual nano-antennas as in Figure 1 and at the spectral peak position apparent there. Likewise, the EEL spectra in Figure 1 are taken at the spatial locations with maximum EELS signal obvious from this figure. EEL spectra taken at several other locations (not depicted) show no significant difference in resonance position and width. The white lines highlight the edges of the antennas as extracted from the transmission-electron micrographs.
4 Theory
Finally, we compare our experiments with corresponding numerical calculations of the scattering cross-section, extinction cross-section, and EEL spectra of individual antennas. All simulations were performed by an in-house implementation of the nodal discontinuous Galerkin time-domain (DGTD) method [15]. The geometrical parameters for each structure are extracted from the experimental electron-micrographs shown as insets in Figure 1. Details on the calculations of the optical spectra and on the material parameters can be found in the supplemental material of [1]. For the simulation of the EELS experiments, we follow the approach presented in [13, 16].
5 Discussion
The results shown in Figure 3 reproduce the expected and previously observed [1] blue-shift of the scattering cross-section with respect to the extinction cross-section spectra also observed in the experiments shown in Figure 1. The calculated EEL spectra also depicted in Figure 3 show a rather small red-shift with respect to the optical extinction cross-section. Such red shift is consistent with previous theoretical work [7]. However, this red shift is smaller than the artifacts the experiments discussed above are potentially subject to. Note that the spectral width of the EEL spectra correlates with that of the optical spectra for all four antennas. As observed previously [1], the split-ring resonator has a significantly smaller linewidth than the straight wire antenna due to its smaller electric dipole, resulting in a smaller radiative damping. In our experiments shown in Figure 1, the linewidths of the EEL spectra are solely governed by the measurement apparatus rather than by the physics of the antenna. It will require next-generation transmission-electron microscopes to actually resolve such optical antenna linewidths in EELS experiments.
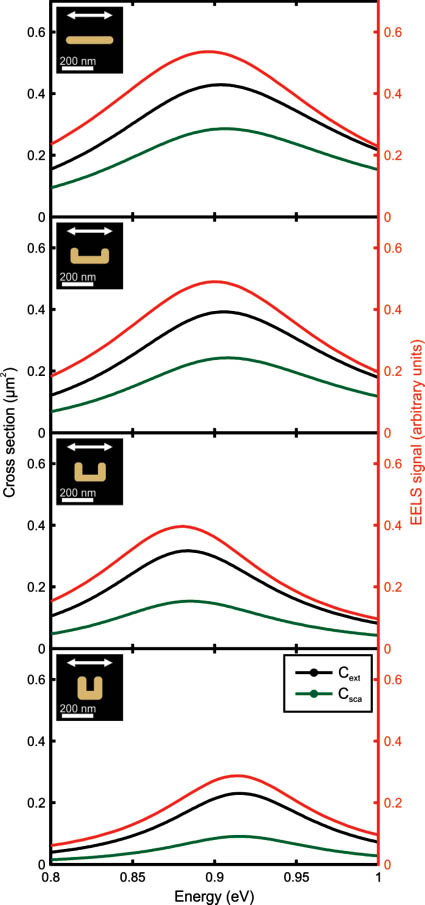
Numerical calculations represented as the experiments shown in Figure 1. The lateral geometrical parameters used are shown in the insets in the upper left-hand side inset in each panel. As in the experiments, all gold antennas have a thickness of 35 nm.
6 Conclusions
In conclusion, we have presented a careful experimental comparison of quantitative optical spectra and electron energy-loss spectra taken on identical samples. We have studied different individual optical gold antennas resonating at around telecom wavelengths for which interband transitions in the gold are expected to play no role. Our experiments show no significant spectral shifts between the extinction and the EELS data within experimental artifacts. We have discussed various possible artifacts. On this basis, broadly speaking, one should be very cautious when drawing conclusions on absolute spectral resonance positions from EELS experiments. The theory shows only a very small red-shift of the EELS spectral maximum with respect to that of the optical extinction cross-section.
We thank the Deutsche Forschungsgemeinschaft (DFG), the Land Baden-Württemberg, and the Karlsruhe Institute of Technology (KIT) for support through the DFG-Center for Functional Nanostructures (CFN). We also acknowledge support by the Karlsruhe School of Optics & Photonics (KSOP). S. Irsen and S. Linden acknowledge the financial support of the DFG-Project LI 1641/2-1. K. Busch acknowledges financial support of the DFG-Project Bu 1107/7-2.
References
[1] Husnik M, Linden S, Diehl R, Niegemann J, Busch K, Wegener M. Quantitative experimental determination of scattering and absorption cross-section spectra of individual optical metallic nanoantennas. Phys Rev Lett 2012;109:233902.10.1103/PhysRevLett.109.233902Search in Google Scholar PubMed
[2] Boudarham G, Feth N, Myroshnychenko V, Linden S, García de Abajo J, Wegener M, Kociak M. Spectral imaging of individual split-ring resonators. Phys Rev Lett 2010;105:255501.10.1103/PhysRevLett.105.255501Search in Google Scholar PubMed
[3] Kreibig U, Zacharias P. Surface plasma resonances in small spherical silver and gold particles. Z Physik 1970;231:128–43.10.1007/BF01392504Search in Google Scholar
[4] N’Gom M, Ringnalda J, Mansfield JF, Agarwal A, Kotov N, Zaluzec NJ, Norris TB. Single particle plasmon spectroscopy of silver nanowires and gold nanorods. Nano Lett 2008;8:3200–4.10.1021/nl801504vSearch in Google Scholar PubMed
[5] Guiton BS, Iberi V, Li S, Leonard DN, Parish CM, Kotula PG, Varela M, Schatz GC, Pennycook SJ, Camden JP. Correlated optical measurements and plasmon mapping of silver nanorods. Nano Lett 2011;11:3482–8.10.1021/nl202027hSearch in Google Scholar PubMed
[6] Myroshnychenko V, Nelayah J, Adamo G, Geuquet N, Rodríguez-Fernández J, Pastoriza-Santos I, MacDonald KF, Henrard L, Liz-Marzán LM, Zheludev NI, Kociak M, García de Abajo FJ. Plasmon spectroscopy and imaging of individual gold nanodecahedra: a combined optical microscopy, cathodoluminescence, and electron energy-loss spectroscopy study. Nano Lett 2012;12:4172–80.10.1021/nl301742hSearch in Google Scholar PubMed
[7] Zuloaga J, Nordlander P. On the energy shift between near-field and far-field peak intensities in localized plasmon systems. Nano Lett 2011;11:1280–3.10.1021/nl1043242Search in Google Scholar PubMed
[8] Ross BM, Lee LP. Comparison of near- and far-field measures for plasmon resonance of metallic nanoparticles. Opt Lett 2009;34:896–8.10.1364/OL.34.000896Search in Google Scholar
[9] Nelayah J, Kociak M, Stéphan O, Geuquet N, Henrard L, García de Abajo FJ, Pastoriza-Santos I, Liz-Marzán LM, Colliex C. Two-dimensional quasistatic stationary short range surface plasmons in flat nanoprisms. Nano Lett 2010;10:902–7.10.1021/nl903653xSearch in Google Scholar PubMed
[10] Shao L-H, Ruther M, Linden S, Essig S, Busch K, Weissmüller J, Wegener M. Electrochemical modulation of photonic metamaterials. Adv Mater 2010;22:5173–7.10.1002/adma.201002734Search in Google Scholar PubMed
[11] Kats MA, Yu N, Genevet P, Gaburro Z, Capasso F. Effect of radiation damping on the spectral response of plasmonic components. Opt Express 2011;19:21748–53.10.1364/OE.19.021748Search in Google Scholar PubMed
[12] Nelayah J, Kociak M, Stéphan O, García de Abajo FJ, Tencé M, Henrard L, Taverna D, Pastoriza-Santos I, Liz-Marzán LM, Colliex C. Mapping surface plasmons on a single metallic nanoparticle. Nature Phys 2007;3:348–53.10.1038/nphys575Search in Google Scholar
[13] von Cube F, Irsen S, Niegemann J, Matyssek C, Hergert W, Busch K, Linden S. Spatio-spectral characterization of photonic meta-atoms with electron energy-loss spectroscopy. Opt Mat Express 2011;1:1009–18.10.1364/OME.1.001009Search in Google Scholar
[14] von Cube F, Irsen S, Diehl R, Niegemann J, Busch K, Linden S. From isolated metaatoms to photonic metamaterials: evolution of the plasmonic near-field. Nano Lett 2013; 13:703–8.10.1021/nl3043757Search in Google Scholar PubMed
[15] Busch K, König M, Niegemann J. Discontinuous Galerkin methods in nanophotonics. Laser Photon Rev 2011;5: 773–809.10.1002/lpor.201000045Search in Google Scholar
[16] Matyssek C, Niegemann J, Hergert W, Busch K. Computing electron energy loss spectra with the Discontinuous Galerkin Time-Domain method. Phot Nano Fund Appl 2011;9: 367–73.10.1016/j.photonics.2011.04.003Search in Google Scholar
©2013 by Science Wise Publishing & De Gruyter Berlin Boston
Articles in the same Issue
- Masthead
- Masthead
- Graphical abstracts
- In this issue
- Letter
- Comparison of electron energy-loss and quantitative optical spectroscopy on individual optical gold antennas
- Review articles
- Fano-resonant metamaterials and their applications
- Nanophotonics and supramolecular chemistry
- Towards low energy consumption integrated photonic circuits based on Ge/SiGe quantum wells
- Light manipulation principles in biological photonic systems