
Payment Habits during Covid-19: Evidence from High-Frequency Transaction Data
-
Tatjana Dahlhaus


Abstract
The Covid-19 pandemic, in Canada and around the world, accelerated trends toward non-cash payments. In this paper, we assess the impact of high-frequency fluctuations in the severity of the pandemic on payment behaviour. These fluctuations are measured by daily changes in restrictions (“stringency”) and reported case counts. Our main measures of payment habits are the ratios of the value and transaction counts of cash withdrawals to debit card payments. Econometrically, we use local projections to estimate the effects on payment habits. We find evidence that consumer behaviour adjusted during the pandemic: consumers withdrew less cash relative to card payment and avoided frequent trips for cash withdrawals and point-of-sale purchases through higher transaction amounts. Based on our modelling, once stringency measures eased and case counts receded, cash use partially recovered, although not to pre-pandemic levels.
1 Introduction
In Canada, as well as on a global scale, the Covid-19 pandemic and the measures to contain it accelerated trends in the digitization of payments, shifting from cash to digital ways to pay. The rapid developments during Covid-19 have highlighted that traditional indicators of payment and consumption choice often lack immediacy and convey an incomplete picture. This paper highlights that high-frequency transaction data generated by payment infrastructures in Canada provides a timely and holistic assessment of consumers’ payment habits.
Understanding payment behaviour is essential to the core mandates of many central banks as they need to assess the state of the economy and fulfill their role in the payment system. The Bank of Canada’s role includes issuing banknotes, and supervising certain retail payments systems (Engert and Huynh 2022).
While the containment measures did not target cash use in Canada, physical distancing and restricted face-to-face interactions impacted cash payments. Due to restrictions on mobility and business hours, it might also have become more difficult to withdraw cash. Fears that banknotes contaminated with the virus could contribute to the spread of Covid-19 were also present. However, the Bank of Canada (2020) responded early during the first lockdown by encouraging retailers to maintain high levels of cash acceptance.
The Bank of Canada has relied on Notes in circulation (NIC), survey data, and low-frequency data from payment infrastructures (network data) to track the evolution of cash and payment behaviour. While these indicators remained available during the Covid-19 pandemic, the Bank of Canada and other central banks have accelerated the use of alternative data sources. The type of high-frequency data used in our paper has proven to complement previously used data and models.
For example, NIC data tracks how many banknotes of each denomination circulate, based on the demand of financial institutions for banknotes issued by the Bank of Canada. Engert and Huynh (2022) document that the NIC soared in the first months of the pandemic, as data from the Bank’s Currency department shows. The additional demand did not unwind with the end of the pandemic as NIC continues to grow at or above similar rates as before the pandemic (Bank of Canada 2022). Rösl and Seitz (2021) argue that non-transactional demand for cash explains why demand for high denominations often increases during crisis times such as the Covid-19 pandemic. However, all banknotes can be used for payments and as a store-of-value, and it can be difficult to identify which use underlies a change in NIC data. While separating NIC into denominations (e.g. $5, $10, $20 are “small” and $50, $100 are “large”) improves our understanding of the transactional versus the non-transactional use of cash, cash withdrawals at automated banking machines (ABM) linked to the domestic bank network might provide a better proxy for cash demand intended for spending by Canadian consumers.
To study the transactional use of cash, many central banks have developed detailed surveys to track consumer payment behaviour. Diary data, that is recording transactions over a fixed period, has emerged as a leading methodology (Bagnall et al. 2016). Surveys are also the traditional method to generate key economic indicators, such as consumer expenditures (Statistics Canada 2023).
From these survey data, we know that cash has unique features that allow it to co-exist with digital payment methods. For example, cash combines low cost, ease-of-use, privacy, financial inclusiveness, nearly universal acceptance, and the dual function of payment instrument and store-of-value (Chen et al. 2020). However, because they are costly to collect and require time and resources to analyze, estimates based on survey data are usually not available at a high frequency.
Our work relates to several strands of ongoing research: First, our paper contributes to the literature on payment behaviour, and how it is impacted by public health shocks. Second, it is also part of the research on how central banks can utilize alternative data sources in informing their decision making.
Henry, Rusu, and Shimoda (2024), using survey data collected at several points during the pandemic, document that an initial drop in cash use for transactions which was partially reversed after the relaxation of Covid-19 measures. Other survey reports, e.g. for the Netherlands (Jonker et al. 2022), the US (Foster, Greene, and Stavins 2024), and Germany (Deutsche Bundesbank 2022), also discuss how payments changed with the Covid-19 pandemic.
A number of studies also use high-frequency transaction data to quantify the impact of the pandemic on consumption patterns:, e.g. Aastveit et al. (2024) for Norway, Bounie, Camara, and Galbraith (2023) for France, Cavallo (2024) and Aladangady et al. (2021) for the US, Chen, Qian, and Wen (2021) for China, and Cevik (2022) for the Baltic countries. Huynh et al. (2020), Chapman and Desai (2021) and Dahlhaus et al. (2022) specifically analyse Canadian data. In Canada, Huynh et al. (2020) obtained alternative weights for the consumer price index from high-frequency expenditure network data on card payments. Earlier work by Galbraith and Tkacz (2013), Galbraith and Tkacz (2018) analyses how the localized outbreak of SARS in Toronto impacted consumption (in 2003), using data from payment systems.
Kraenzlin, Meyer, and Nellen (2020) and Bounie, Camara, and Galbraith (2023) combine data from payment systems and granular location data to construct detailed indicators of shifts in consumption and payment behaviour.
However, these papers often abstract from the role of cash and how shifts in payment behaviours may influence the reliability of those data for economic monitoring. Methodologically and thematically, our paper is closely related to the work of Aprigliano, Ardizzi, and Monteforte (2019) for Italy. By comparison, we expand our analysis beyond the first year of the pandemic.
In particular, we use a comprehensive dataset based on data for ABM withdrawals and point-of-sale (POS) debit card transactions from two payment infrastructure providers in Canada, the Interac Association and the Automated Clearing and Settlement System (ACSS).
We construct daily measures of payments habits such as the share of cash transactions and average transactions values. We discuss how these measures have evolved throughout the pandemic and support these observations with simple dummy regressions. Further, we assess the link between the Covid-19 pandemic and payment habits econometrically using local projection models at daily frequency. We obtain impulse responses for each measure of payment habits to changes in indicators of the pandemic such as new confirmed cases and the stringency of government-imposed response measures.
Our analysis shows that, with the Covid-19 pandemic, cash withdrawals, especially withdrawals from ABMs not belonging to the cardholder’s bank, dropped in comparison to debit card transactions. This decline is more pronounced for the dollar value although the average dollar values of both cash withdrawals and card transactions have not decreased. On the contrary, the average dollar value for both has increased, suggesting that consumers made fewer transactions during the pandemic, but with a higher average value. We note a particular decline in withdrawals at ABMs not associated with the cardholder’s own bank, which are often costly. We observe a trend towards a larger share of POS debit card transactions between a payer and a payee whose accounts are with different financial institutions (FI). Increased merchant acceptance of cards at the point-of-sale, as documented by Welte and Wu (2023), may be a factor in explaining this finding.
While our measures of payment habits have not returned to pre-pandemic levels, their behaviour seems to be linked to the intensity of the pandemic. For example, the use of cash increased over the summer of 2020 (when there were relatively low and stable Covid-19 case counts) and decreased again towards the end of the year (when Canada entered the second wave).
The paper proceeds as follows. In Section 2 we describe the transaction data and the Covid-19 indicators used in our analysis. Section 3 introduces our measures of payment habits and provides first insights into their evolution amid Covid-19. Section 4 shows a more formal analysis based on dummy regressions and local projection models. Section 5 concludes.
2 Data
We start this section by introducing the high-frequency transaction data based on Interac and ACSS ABM withdrawals and debit card transactions. We then present the indicators that we use to describe the severity and state of the Covid-19 pandemic.
2.1 Transaction Data
Data on cash withdrawals and debit card transactions comes from two payment infrastructure providers, Interac and the ACSS. The type and scope of transactions and the differences between the data sources can be explained from the schematic presented in Figure 1. To distinguish the roles of these infrastructures, we explain on-us transactions. Electronic payment card transactions such as cash withdrawals at ABMs and debit payments at a point-of-sale (POS) terminal involve four parties: On the so-called issuing side there are two parties: the cardholder and the financial institution (FI) where the bank account linked to the card is held. On the acquiring side, there are also two parties, the owner of the POS terminal or the ABM and the financial institution of the owner. On-us transactions involve the same financial institution on the acquiring side and the issuing side. For example, if someone withdraws cash at an ABM that belongs to the same bank that issued the card, then the transaction is on-us. If the person uses their card at a merchant who has their account with a different financial institution, then the transaction is not on-us.
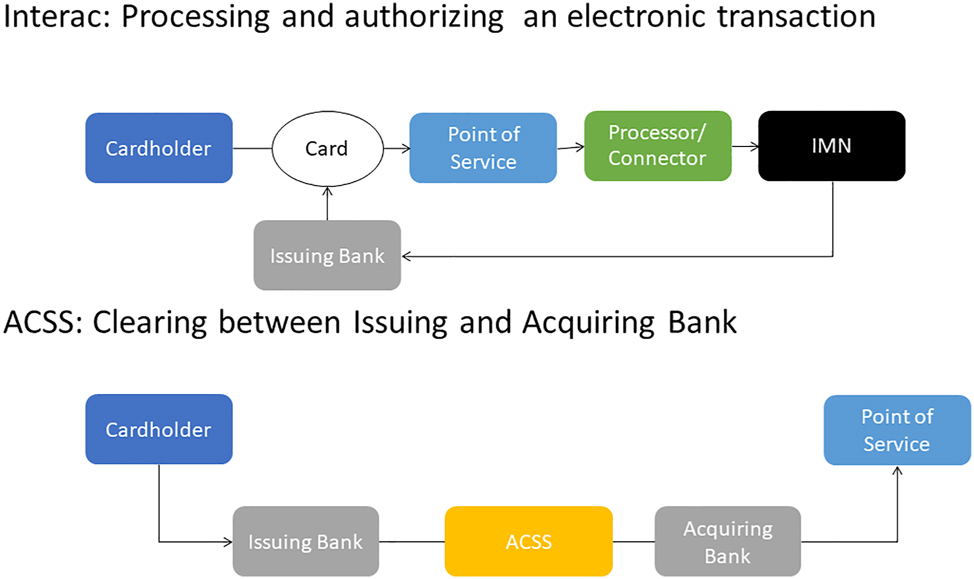
Network schematic of Interac (on-us and non-on-us) and ACSS (non-on-us).
The Interac association operates the main debit card network in Canada which runs on a shared Inter-Member network (IMN) for ABM withdrawals and on another IMN for debit purchases at the point of sale. All ABM withdrawals and debit purchases, on-us and non-on-us, made with Interac debit cards are processed through the shared IMN.[1] Merchants also need a payment processor to clear and authorize debit purchases. The ACSS further clears the non-on-us transactions that are processed and authorized by the IMN and for which the issuer and acquirer are different members of the shared network.[2] The ACSS data thus covers the subset of the non-on-us transaction in the Interac data.
We will now explain in more detail the streams, or transaction flows, used in our analysis:
Interac: Interac data contains all on-us and non-on-us transactions that the IMN processes on a given day. For cash transactions, the Interac data includes withdrawals at automated banking machines (ABMs) connected to the IMN. These ABMs could be on the premises of an FI, FI-owned offsite, or white-label ABMs.[3] The POS purchases in the Interac data set consist of Interac debit payments made at a physical payment terminal, including chip- and pin-authorized transactions and contactless Interac Flash transaction. The data are adjusted for refunds and transactions where an ABM contained less banknotes than the requested amount. Data are available for every calendar day, including weekends and holidays.
ACSS: ACSS data only accounts for non-on-us transactions. In the ACSS terminology, the transactions considered in our analysis are called Point-of-Service payments because they most commonly involve using a payment card at a physical service point which is either an ABM or a payment terminal. ABM transactions are split into two streams: the first one is the “pull” that happens when a cardholder requests a certain amount of cash from an ABM. The second one is an adjustment stream that accounts for situations where the ABM does not contain enough banknotes to cover the requested amount. Similarly, two separate streams exist for in-store debit payments, one for payments and one for refunds. Each stream provides the dollar value and the number of transactions. We construct the analysis data by subtracting refunds and adjustments from purchase quantities and requested ABM quantities, respectively.
ACSS data is available on a daily frequency for the days when the ACSS operates. The ACSS operates Monday to Friday except for holidays. Relative to the time when the cardholder initiates the transaction at the Point-of-Services, the ACSS clears the transaction with a delay.
The distinction between on-us and non-on-us transactions, or between ACSS and Interac data, is economically important and can impact payment behaviour. First, when a cardholder withdraws cash, they will generally pay no or lower fees for on-us withdrawals, captured only in the Interac data, compared to non-on-us withdrawals, captured in both Interac and ACSS data. According to the Financial Consumer Agency of Canada (2022) fees for non-on-us withdrawals can be as high as $9. Second, because ACSS clears the transaction with a delay, financial institutions may prefer on-us transactions for settlement speed. On-us transactions also avoid the risk that the other financial institution cannot meet its obligation, see Northcott (2002). The businesses where the transactions are made could also benefit from faster settlement of on-us transactions.
2.2 Covid-19 Indicators
To measure the pandemic’s intensity and evolution, we consider two indicators: Government stringency and Covid-19 cases. The data for Government stringency and Covid-19 cases is taken from the Covid-19 dataset collection maintained by Our World in Data (Mathieu et al. 2020). The Covid-19 government stringency index is part of the Oxford Covid-19 Government Response tracker (see Hale et al. 2020).[4] It is a composite measure of nine response indicators, i.e. school closures, workplace closures, cancellation of public events, restrictions on public gatherings, closures of public transport, stay-at-home requirements, public information campaigns, restrictions on internal movements, and international travel controls, rescaled to a value from 0 to 100 (100 = strictest).[5] Daily data for confirmed Covid-19 cases originate from the Covid-19 Data Repository by the Center of Systems Science and Engineering (CSSE) at Johns Hopkins University (JHU).
Figure 2 shows the evolution of these indicators over our sample period (January 1st, 2019–May 31st, 2022). The first wave of the pandemic in the spring of 2020 lead to strict government measures that were eased partially over the summer due to relatively stable new case counts. In the fall Canada entered the second wave as new cases and the positivity rate increased.
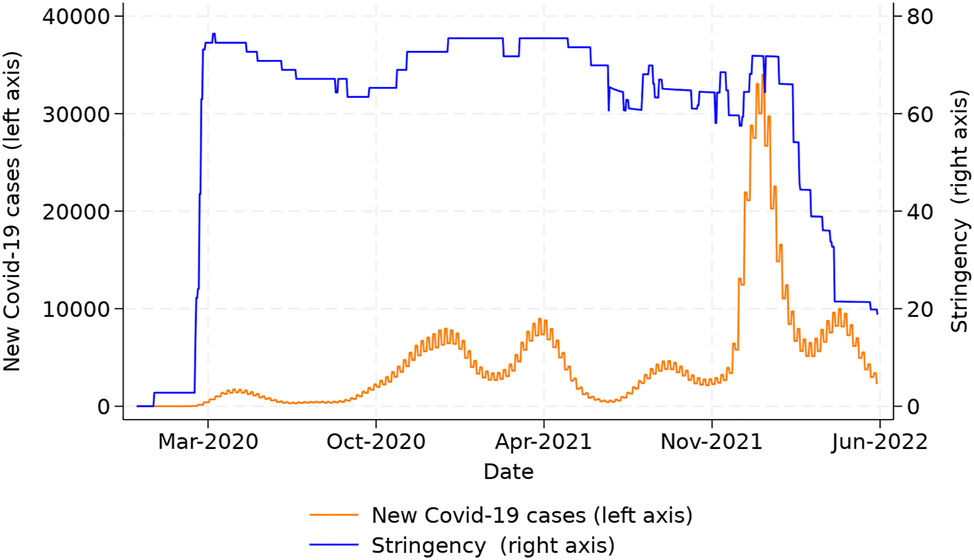
Covid-19 indicators: daily new Covid-19 cases and stringency.
3 Measures of Payment Habits and First Insights
3.1 Cash-Card Ratios
The ratio of cash withdrawals to card transactions (cash-card ratio) is constructed by dividing the amount of ABM cash transactions by the amount of POS debit transactions. The cash-card ratio has been used as a proxy for the share of cash transactions at the point-of-sale (see e.g. Ardizzi, Nobili, and Rocco 2020). We observe that the cash-card ratio is higher in the Interac data than in the ACSS data (Figure 3), before and during the pandemic. This is explained by our later discussion of the ACSS-Interac ratios, namely, the proportion of on-us ABM withdrawals in 2019 was about three to four times larger than the proportion of on-us POS payments in the same time period. Before the pandemic, the value of banknotes withdrawn relative to debit card payments was about 0.43 in the Interac data, while the ratio was approximately 0.13 in the ACSS data. With the onset of the pandemic in March 2020, the value and volume ratios dropped in both data series but remain below pre-pandemic averages until the end of our sample. Their behavior also seems to be linked to the evolution of the pandemic. For example, the cash-card ratio increased somewhat over the summer of 2020 (when there were relatively low and stable Covid-19 case counts) and decreased again towards the end of the year (when Canada entered the second wave).
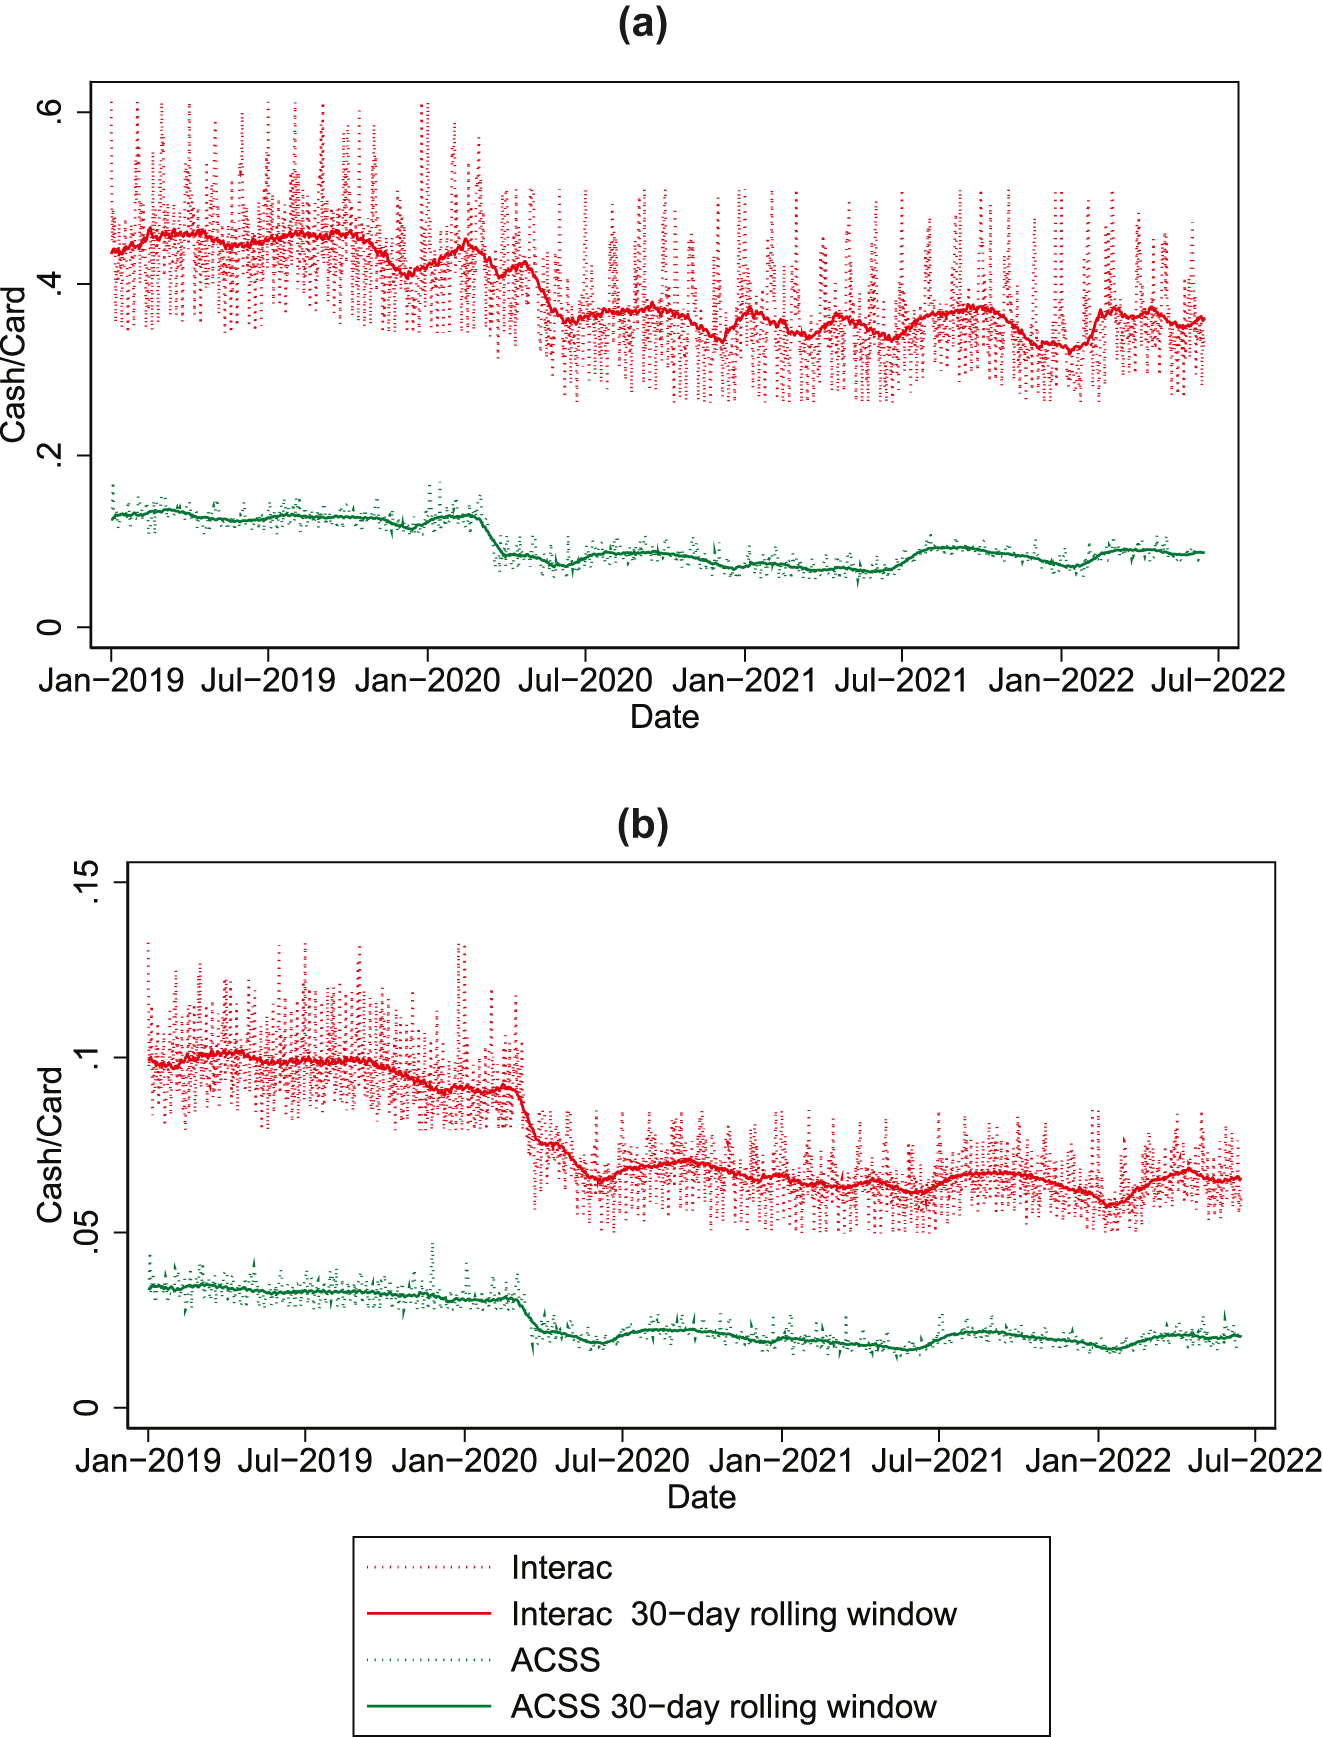
Cash-card ratios. Notes: Daily values are winsorized at the 2.5 and 97.5 percentiles for presentation purposes. Percentiles are computed separately for the periods before and during the pandemic.
We compare the cash-card ratio in the high-frequency data to survey data from Canada. The Bank of Canada conducted diary studies of consumer payments in 2017, 2020 and 2021, each time in the month of November. For 2017, Henry, Huynh, and Welte (2018) estimate the value share of cash transactions at the point-of-sale at 16 % and the volume share at 33 %, relative to debit card shares of 26 % for the value and 24 % for the volume. From these estimates, the cash-card value ratio would be about 0.63, obtained by dividing the cash value share by the debit value share.
Several factors may explain the higher cash-card ratio in the survey data than in the Interac data (where it was 0.43 in 2019): First, while Henry, Huynh, and Welte (2018) report that ABM withdrawals are the most common way to obtain banknotes, bank teller withdrawals and cash-back withdrawals during a debit card purchase also play a significant role. Second, using withdrawals in the cash-card ratio ignores the possibility that the same banknote is used in several cash transactions before it is deposited at an FI. On the other hand, there are also factors that would support a lower cash-card ratio constructed from point-of-sale transactions in the survey data than the cash-card ratio constructed from ABM withdrawals. First, individuals also withdraw and hold cash for non-transactional purposes (savings, precautionary motives). Second, cash is also used for person-to-person transactions. Third, Henry, Huynh, and Welte (2018) observe a downward trend in the value share of cash transactions which might indicate that the cash-card ratio at the point-of-sale in 2019 might have been lower than in the 2017 survey. Indeed, the cash-card ratio was higher in the 2013 survey data, with 0.92. Both the survey data and the Interac data indicate that the cash-card ratio fell during the pandemic. In Henry, Shimoda, and Zhu (2022), the cash-card ratio is 0.37 for November 2020 and recovered almost to pre-pandemic level with 0.58 for November 2021. The cash-card ratio in the Interac data was around 0.35 for November 2020 and November 2021, remaining below the pre-pandemic level of 0.43. Our data ends in May 2022, when the cash-card ratio also remained at around 0.35. We remark that the Interac data would indicate that the cash-card ratio remained low although it recovered in the survey data by 2021. The elevated cash-card ratio in the 2021 survey data could thus be explained by consumers who use up cash that they had previously withdrawn either for transactional or non-transactional reasons. In addition to the factors that might explain the gap between the pre-pandemic cash-card ratio, cash withdrawals might represent intended or planned cash purchases or intentions to hold cash for non-transactional purposes, while the survey data represents actual cash purchases. Henry, Shimoda, and Zhu (2022) also show that average cash holdings dropped between November 2020 and November 2021.
3.2 Average Transaction Values
Average transaction values are another aspect of payment habits. They are calculated as the transaction value for a given day divided by the transaction volume for the same day. In 2019, a typical ABM withdrawal amount was around $178 in the Interac data and about $145 in the ACSS data (see Figure 4). The data show an upward shift in the average withdrawal between January and February 2020. The gap between Interac and ACSS withdrawals markedly increased at the onset of the pandemic. Also, both series seem to co-move with the intensity of the pandemic. By contrast, the typical debit card transaction processed by Interac was around $39, close to the typical value of $38 for the ACSS. On average, both POS averages increase and remain highly correlated over our sample period.
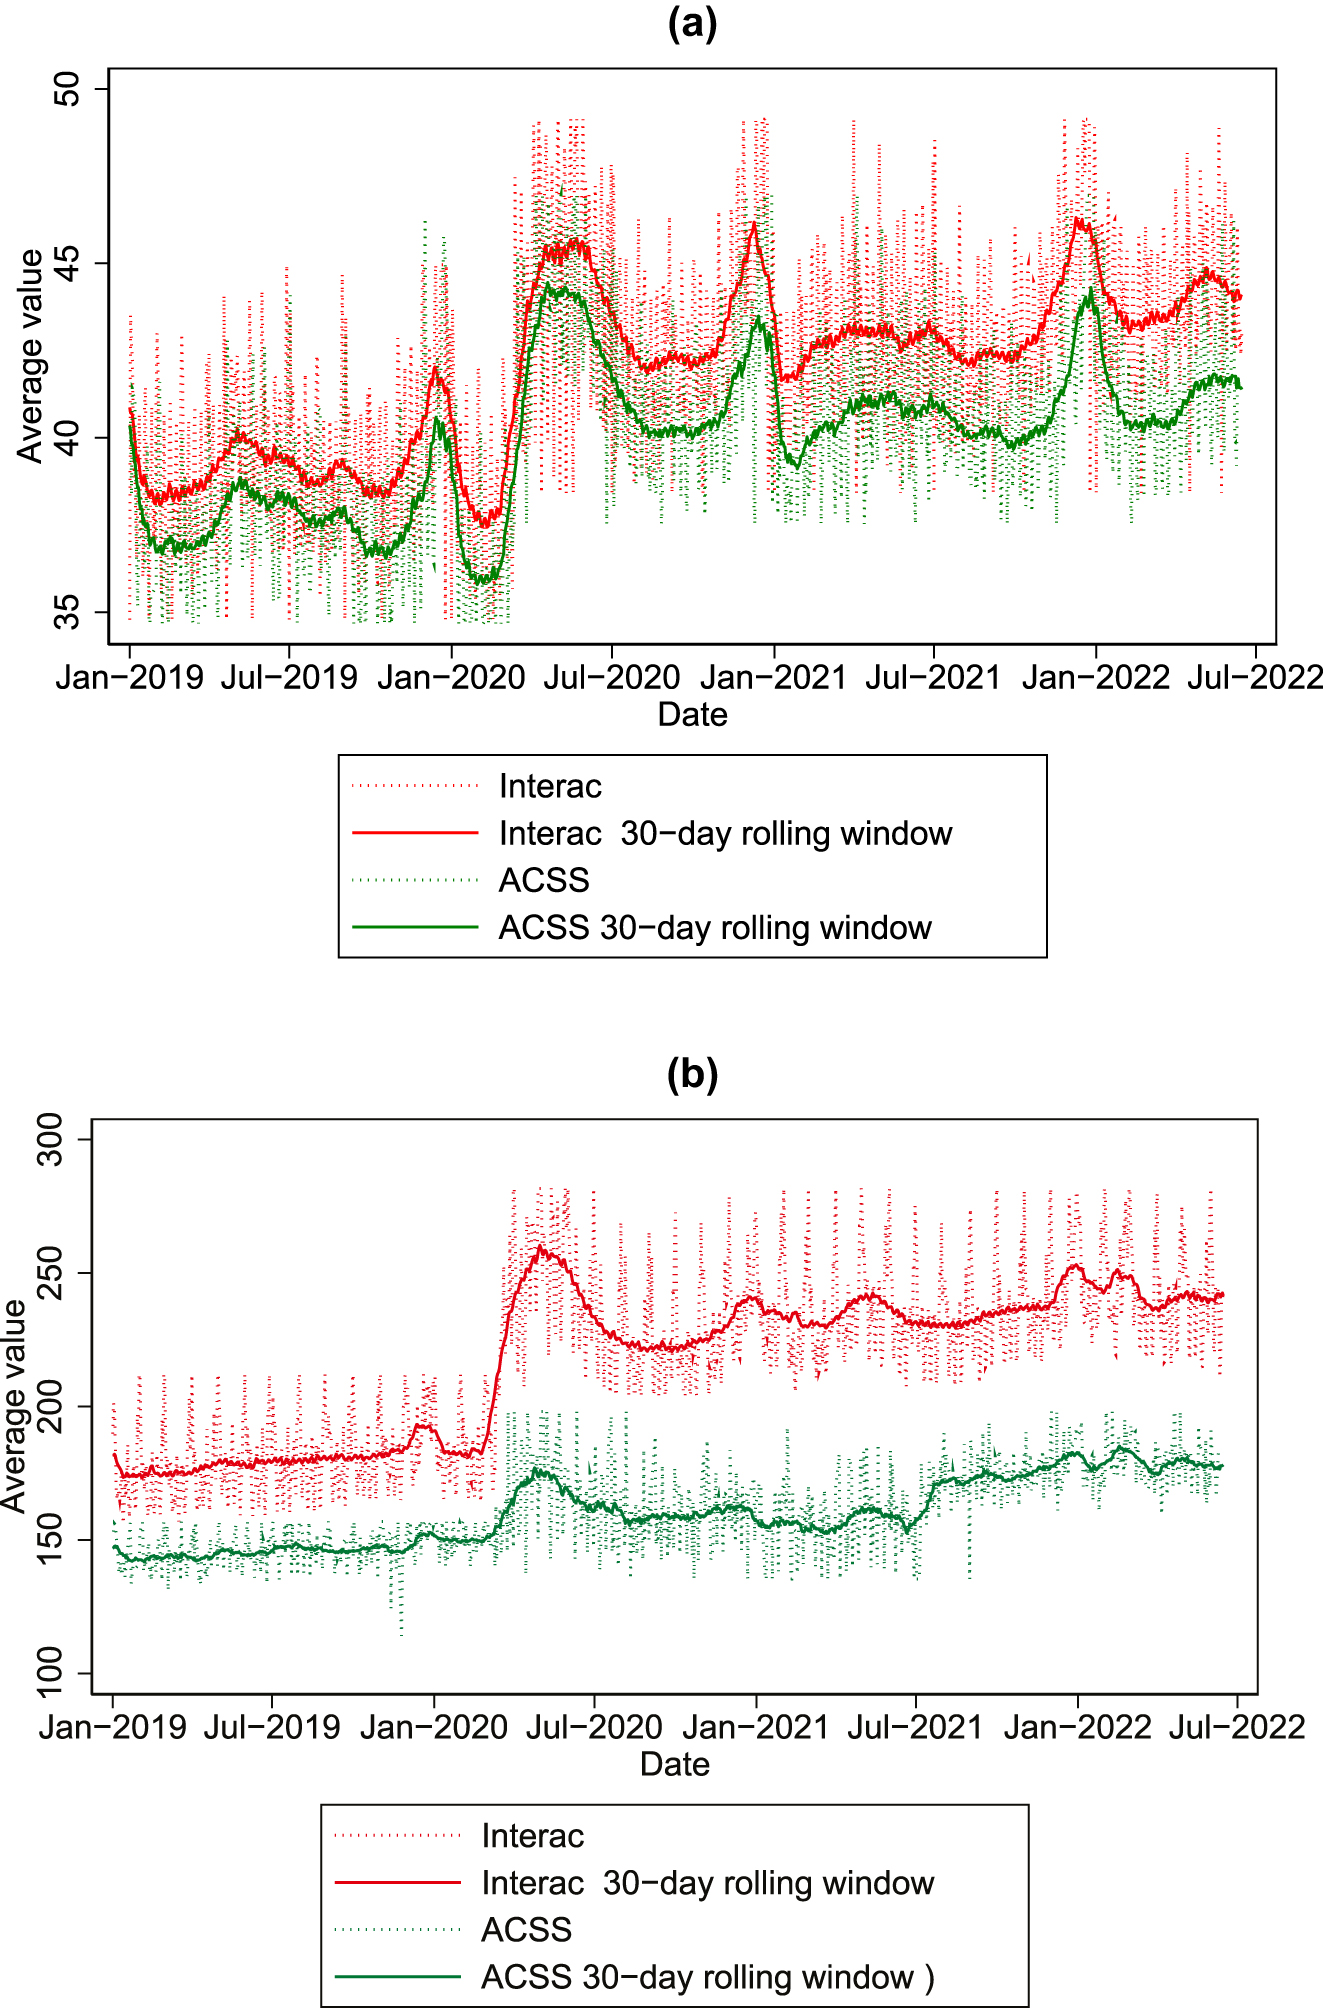
Average transaction values. Notes: Daily values are winsorized at the 2.5 and 97.5 percentiles for presentation purposes. Percentiles are computed separately for the periods before and during the pandemic.
3.3 ACSS-Interac Ratios
We calculate the ACSS-Interac ratios for ABM withdrawals and POS transactions to gauge the non-on-us transactions. To do so, we create a second harmonized data set from the Interac streams by aggregating processed amounts by the day that they would have been cleared by the ACSS. For example, we aggregate Interac transactions from Saturdays, Sundays and Monday and use them as the Tuesday observations. Tuesday’s transactions are used as Wednesday observations. This data set allows us to compare Interac and ACSS data at the daily frequency and to calculate the ratios.
Figure 5 shows the ACSS-Interac ratios over time. The ratio demonstrates that less than 25 % of ABM transaction accounted for in the Interac data clear through the ACSS. A likely explanation is that cardholders can often avoid account fees and other charges if they withdraw at an ABM affiliated with the issuer of their card. Also, bank-owned ABMs might allow for higher withdrawal amounts since the owner of the white-label ABM might set the maximum withdrawal amount below the maximum set by the card issuer.
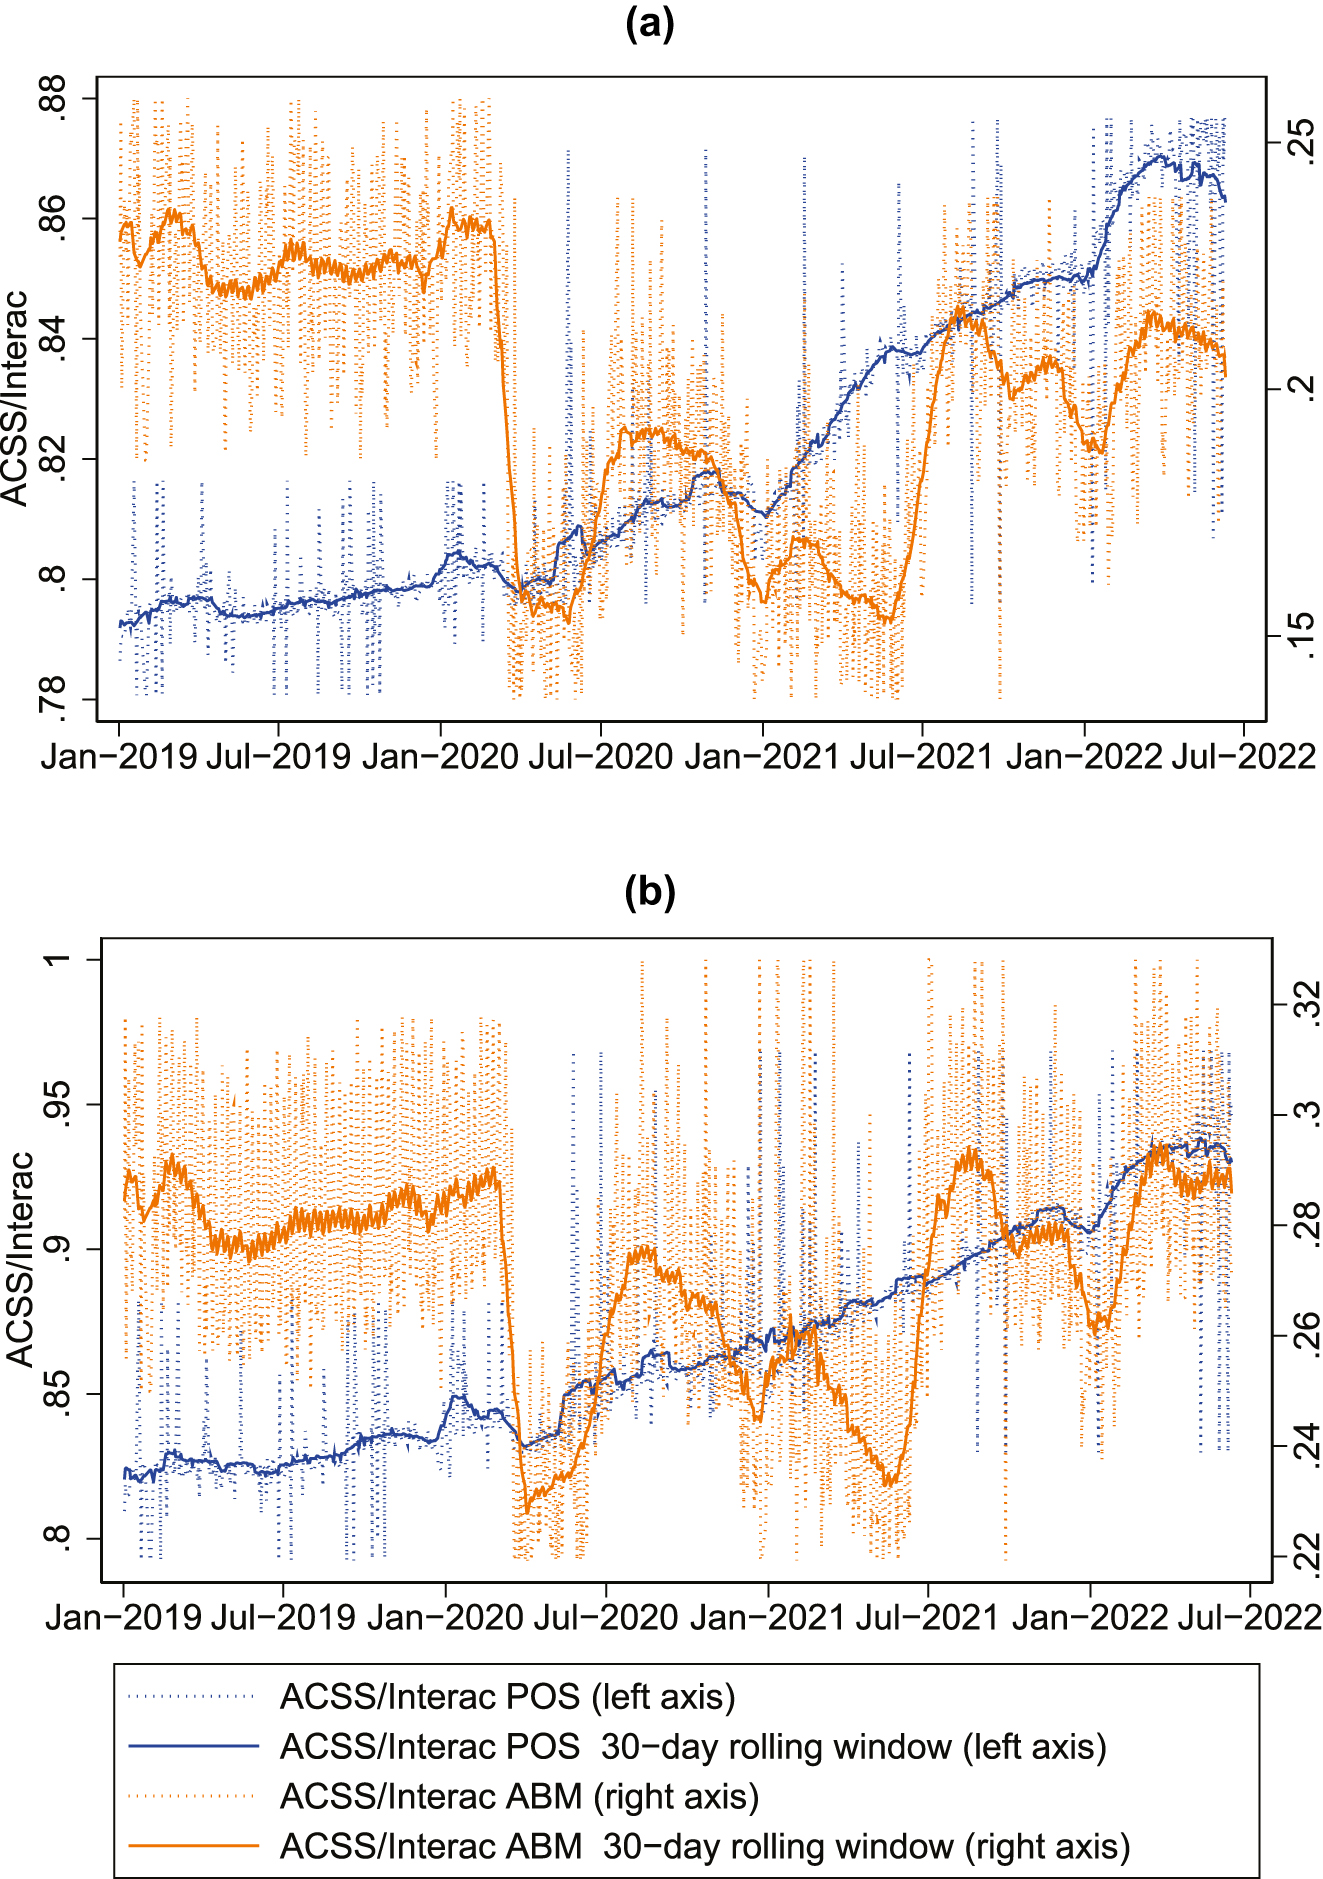
ACSS transactions as a share of Interac transactions. Notes: Daily values are winsorized at the 2.5 and 97.5 percentiles for presentation purposes. Percentiles are computed separately for the periods before and during the pandemic.
During the pandemic, the ACSS-Interac ratios for ABM cash plunged during the first lockdown, increased during the re-opening and fell again during the second lockdown (Figure 5, red lines). Turning to POS debit payments, the share of non-on-us POS debit transaction had been quite steady around 80 % for the value. While the volume share averaged around 83 % in 2019, it increased during the second half of that year. The cardholder is usually unaware of which FI will acquire a card payment, but changes in the concentration on the issuing or acquiring side can still drive this share of non-on-us card payments. In contrast to cash, the ACSS-Interac ratio for these transactions steadily increased over the course of the pandemic (Figure 5, blue lines).
This means that a larger share of POS debit card transactions is settled between accounts that are not with the same IMN-member. A possible factor is the increase in the share of card accepting businesses, as documented by Welte and Wu (2023). The larger share of non-on-us POS debit card transactions could arise if a particular financial institution gained a larger market share on the acquiring side while not gaining a similar share on the issuing side. Such a gain may arise from a large number of commercial banking clients that started accepting debit cards during the pandemic. It could also arise from a payment aggregator that has an account at the financial institution. A payment aggregator is a type of merchant payment service provider. In some cases, the card payments processed by the payment aggregator’s clients are first deposited into the payment aggregator’s account and not directly into the merchant’s account. In contrast to the traditional Interac model where debit card payments are usually deposited into the merchant’s account, the service provider acts as “merchant of record” for the transaction (Stripe 2023).
4 Empirical Approach
To analyze the changes in payment habits throughout the Covid-19 pandemic econometrically, we use two approaches. First, we employ a static dummy regression. Then, we estimate a local projection model to assess the dynamic effects of our Covid-19 indicators.
4.1 Static Model: Dummy Regressions
We use a simple dummy regression to explore the change in the variables of interest during different phases of the pandemic. This allows us to quantify the shift in each Covid-19 phase compared to the pre-pandemic period (2019 to early 2020) that we observed in the previous section.
We roughly define six phases: lockdown 1 (March 2020–June 2020), reopening 1 (July 2020–October 2020), lockdown 2 (November 2020–June 2021), reopening 2 (July 2021–December 2021), lockdown 3 (January 2022–February 2022) and re-opening 3 (March 2022 onwards).[6] We construct 6 dummies, one for each phase. We control for seasonal patterns and trends by including day-of-week, week-of-month, and month-of-year dummies.[7] We regress the variables of interest described in the former section on the Covid-19 phase dummies, seasonal dummies, and a constant over a daily sample covering January 1st, 2019–May 31st, 2022.
The cash-card ratios both in value and volume terms decreased over the pandemic and average transaction values increased during the pandemic (Table 1). With the first lockdown, cash-card value ratios were about 4 pp lower for Interac and ACSS transactions and reached a low point during the third lockdown, decreasing by 12 pp for Interac and 5 pp for ACSS transactions. Similar observations hold for the cash-card volume ratios. By comparing the coefficient of lockdown 3 and reopening 3 in Table 1, the cash-card value ratios show a small recovery of 1.5 pp when the pandemic restrictions are relaxed from March 2022 onward. In the dummy regression, the cash-card volume ratios appear to be stable after November 2020.
Dummy regressions of selected variables: cash-card ratios and average transaction values.
| Cash-card value ratio | Cash-card volume ratio | log(ABM average value) | log(POS average value) | ||
|---|---|---|---|---|---|
| Lockdown 1 | Interac | −0.044a | −0.024a | 0.303a | 0.131a |
| ACSS | −0.042a | −0.011a | 0.124a | 0.115a | |
| Reopening 1 | Interac | −0.089a | −0.027a | 0.209a | 0.092a |
| ACSS | −0.044a | −0.011a | 0.080a | 0.076a | |
| Lockdown 2 | Interac | −0.092a | −0.031a | 0.262a | 0.101a |
| ACSS | −0.056a | −0.013a | 0.027a | 0.075a | |
| Reopening 2 | Interac | −0.091a | −0.031a | 0.256a | 0.097a |
| ACSS | −0.040a | −0.013a | 0.173a | 0.075a | |
| Lockdown 3 | Interac | −0.115a | −0.035a | 0.308a | 0.137a |
| ACSS | −0.054a | −0.015a | 0.202a | 0.118a | |
| Reopening 3 | Interac | −0.088a | −0.032a | 0.309a | 0.123a |
| ACSS | −0.040a | −0.012a | 0.200a | 0.086a | |
| # of observations | 849 | 849 | 849 | 849 |
-
Notes: aDenotes significance at the 1 % level based on standard errors robust against heteroskedasticity and autocorrelation (HAC) in the residuals. Daily sample from January 1st, 2019–May 31st, 2022.
For cash withdrawals, the average value increased by about 30 % in the Interac data and by about 12 % in the ACSS data during the first lockdown. Similarly, the average value of a POS debit card payment increased by 13 % and 11 % for the Interac data and ACSS data, respectively, during the first lockdown and remains elevated.
Overall, the ACSS-Interac ratio decreased over the pandemic for cash and increased for card transactions. For cash, the ratio decreased by up to 6 pp and by up to 3 pp for the value and the volume, respectively. For cards, the ratio increased by up to 7 pp for the value and by up to 11 pp for the volume (Table 2).
Dummy regressions of selected variables: ACSS-interac ratios.
| ABM value | ABM volume | POS value | POS volume | |
|---|---|---|---|---|
| Lockdown 1 | −0.058a | −0.029a | 0.002 | 0.017 |
| Reopening 1 | −0.039a | −0.018 | 0.014 | 0.028a |
| Lockdown 2 | −0.061a | −0.007 | 0.031a | 0.056a |
| Reopening 2 | −0.021a | −0.011 | 0.049a | 0.072a |
| Lockdown 3 | −0.034a | −0.011 | 0.074a | 0.092a |
| Reopening 3 | −0.013a | 0.017 | 0.072a | 0.110a |
| # of observations | 849 | 849 | 849 | 849 |
-
Notes: aDenotes significance at the 1 % level based on standard errors robust against heteroskedasticity and autocorrelation (HAC) in the residuals. Daily sample from January 1st, 2019–May 31, 2022.
While these simple regressions confirm the directional impact of the pandemic on payment behaviours, that is a decline in cash and an increase in transaction size, they have several short-comings which our dynamic model in the next sections will address. First, the dummies are based on our assessment of when restrictions tightened or relaxed. Second, a long and strict lockdown, such as lockdown 2, might have lasting effects that carry over into the reopening period. This might for example explain why the coefficients of lockdown 2 and reopening 2 are very similar in Table 1. Third, binary variables for lockdowns and reopenings do not capture the intensity of the pandemic or of the containment measures. For example, stringency was sustained at a high level in reopening 1.
4.2 Dynamic Model: Local Projections
To evaluate the dynamic effects of the pandemic and their persistence, we use local projections models (Jordà 2005). We obtain impulse responses, c h , of our variables of interest to the Covid-19 indicators by estimating the following regressions over our daily sample from January 1st, 2019–May 31st, 2022:
where y t+h is our variable of interest (cash-card value and volume ratios, logarithms of average ABM and POS transaction values, ACSS-Interac ABM value and volume ratios, and ACSS-Interac POS value and volume ratios), x t is one of the two exogenous Covid-19 indicators (logarithm of Covid-19 cases or logarithm of the government stringency index), and p is the number of lags. The confidence bands for the impulse responses c h are constructed as based on standard errors robust against heteroskedasticity and autocorrelation (HAC) in the residuals, (Jordà 2005). We assume that the Covid-19 indicators are exogenous since it is unlikely that transactions affect these indicators (by affecting the virus’ transmission) at the daily frequency. However, endogeneity concerns can become relevant at lower frequencies.
As before, we control for seasonal patterns by including day-of-week, day-of-month, week-of-month, and month-of-year dummies. To render the responses of ACSS and Interac variables comparable in terms of timing, we use the Interac data harmonized to business-day frequency. The estimation includes 10 lags, corresponding to two weeks.[8] We consider horizons of up to 200 business days.
We find that consumer behaviour adjusted to the intensity of the pandemic. Following an increase in pandemic intensity, consumers withdrew less cash compared to card payments which could reflect a reduced use of cash for point-of-sale transactions. Consumers also made relatively more withdrawals from ABMs that are linked to their FI (on-us). They also increased the amounts of their cash withdrawals and POS purchases to avoid frequent trips.
We now discuss the impulse responses in more detail.
Figure 6 shows impulse responses for the cash-card value and volume ratios to the two Covid-19 indicators. In the interpretation of the results, a positive impulse response function means that the values increase when the pandemic measure (stringency or published case counts) is more intense, but that the values decrease when its intensity lessens. To compute the aggregate effects of the changes in intensity one would add up positive values for upward shocks and negative values for downward shocks. To put the estimates into perspective, the stringency index rose by a factor of 5 from one day to the other on March 11, 2020. By contrast, stringency was reduced in a more gradual way and the largest relative day-over-day drop was a relative reduction of about 2/3, observed in early 2021. Reported case counts fluctuated, but overall seem to have risen faster than fallen in most waves. Neither stringency nor case counts returned to pre-pandemic levels over the time period covered by the data (Jan 2020 to May 2022).
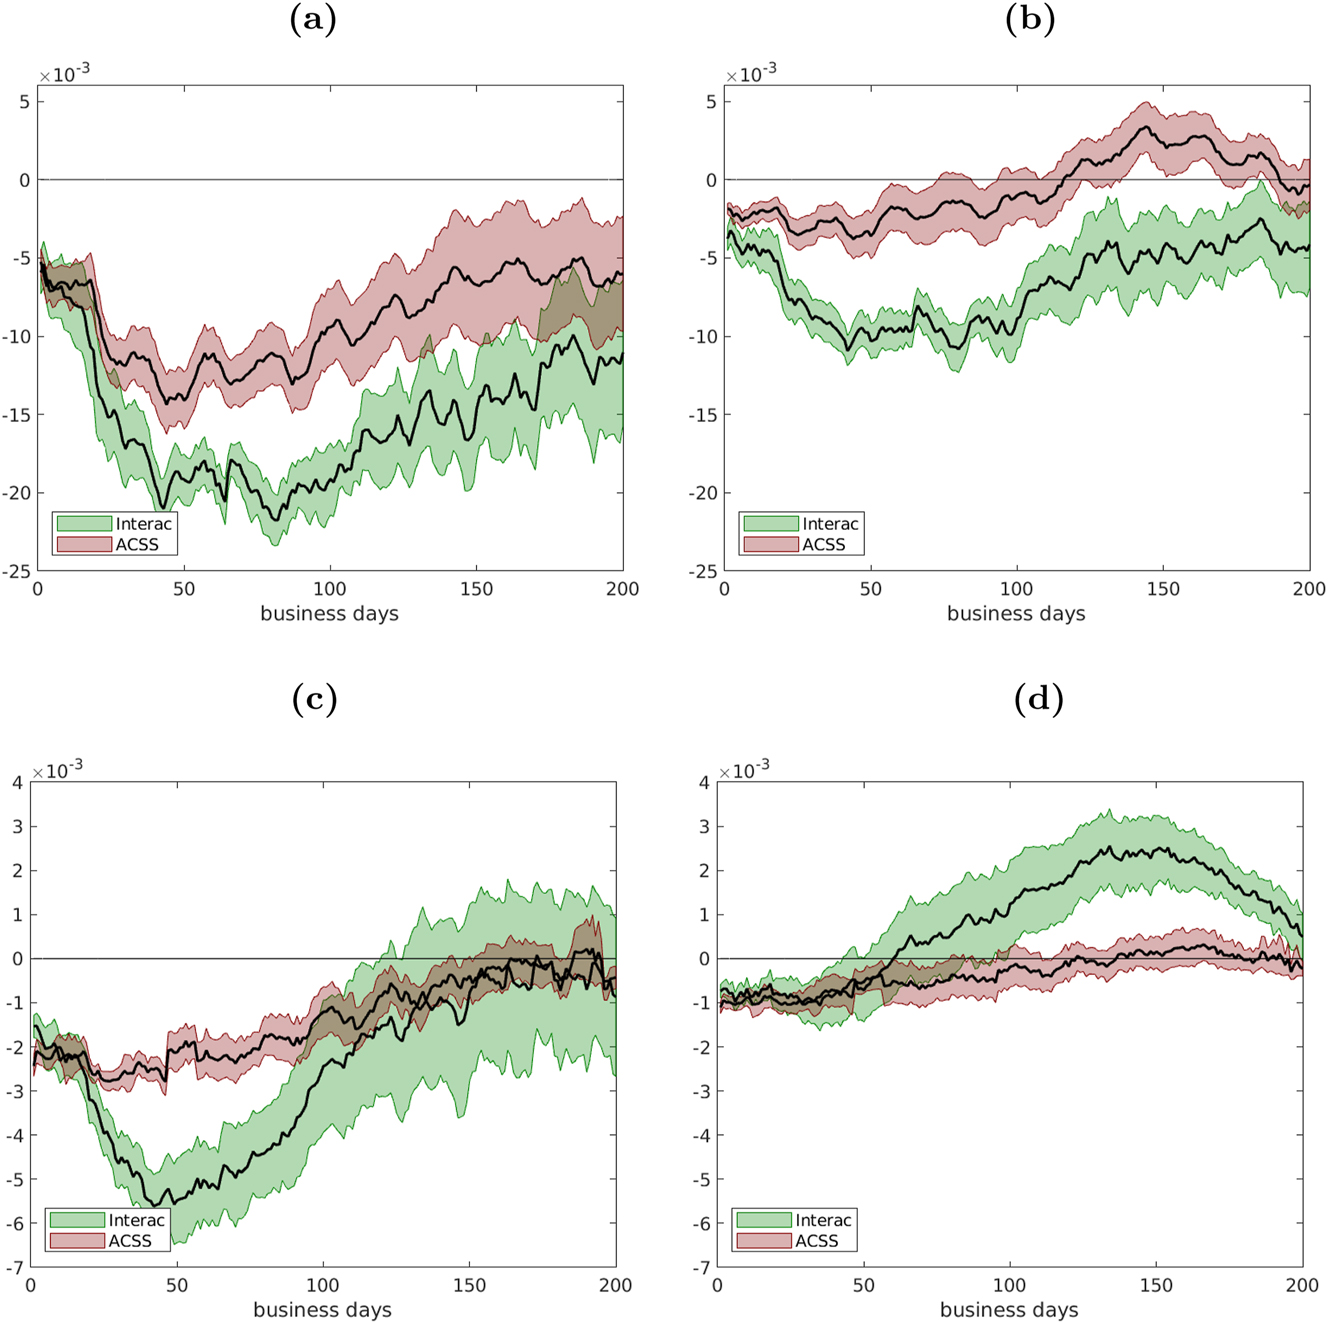
Impulse responses of cash-card value and volume ratios for Interac and ACSS transactions.
Following a doubling in the stringency index, the Interac cash-card value ratio decreases by between about 0.5 pp and 2.5 pp over the horizon of 200 business days, corresponding roughly to one year, see Figure 6. The impulse response is still negative and significant at the end of the horizon. The effect on the ACSS cash-card value ratio is quantitatively similar, but happens on a smaller scale. While increasing case counts have a negative effect on the Interac cash-card value ratio (ranging impulse responses between −0.5 pp and −0.1 pp), the impulse responses of the ACSS cash-card value ratio are smaller overall, revert to positive value after about 100 business days and then approach zero. We will discuss the different behaviour of Interac and ACSS data later in this section.
The impulse response function of the volume ratio to an increase in stringency is qualitatively similar, but by the end of the horizon of 200 business days, only the response of ACSS transactions is significantly different from zero. While the point estimate of the response of the Interac volume ratio is also still negative, the confidence interval is large. We cannot reject the hypothesis that the effect is not persistent. The impulse responses of the volume ratios to published case counts behaves similarly, and are not significantly different from zero after 200 days.
A possible interpretation is that the intensity of stringency measures has a greater and longer lasting effect than information on the intensity of the pandemic based on publicly available case counts. Also, the value of cash withdrawals relative to the value of card payments is more sensitive to stringency than their relative volumes. Indeed, Henry, Shimoda, and Zhu (2022) also observe that the value share of cash payments fluctuated stronger between 2020 and 2021 than their volume share.
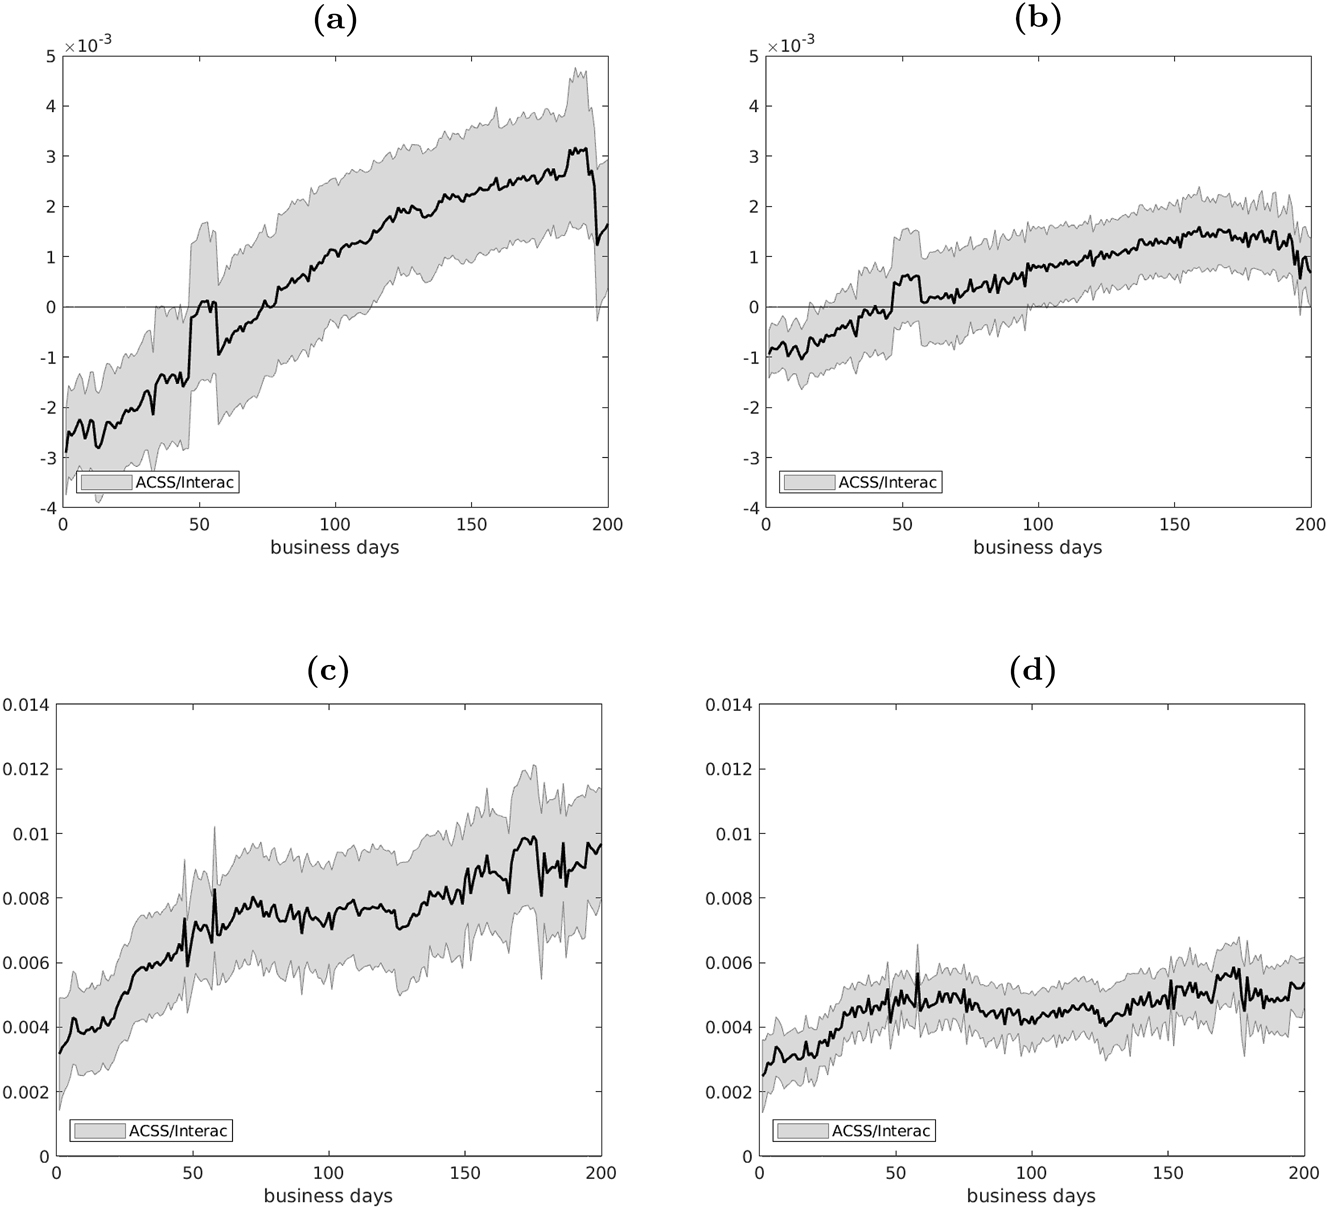
Turning to the dynamic responses of ABM average transaction values, we find that following a 100 % percent change in the stringency index, the ABM average transaction value measured by Interac increases by about eight percent (see Figure 7, panel (a)); the effect remain positive for about 100 business days and disappears at the end of the horizon. The response of ABM average transaction values based on ACSS is smaller but monotonically increasing and remains significantly positive at the end of the horizon.
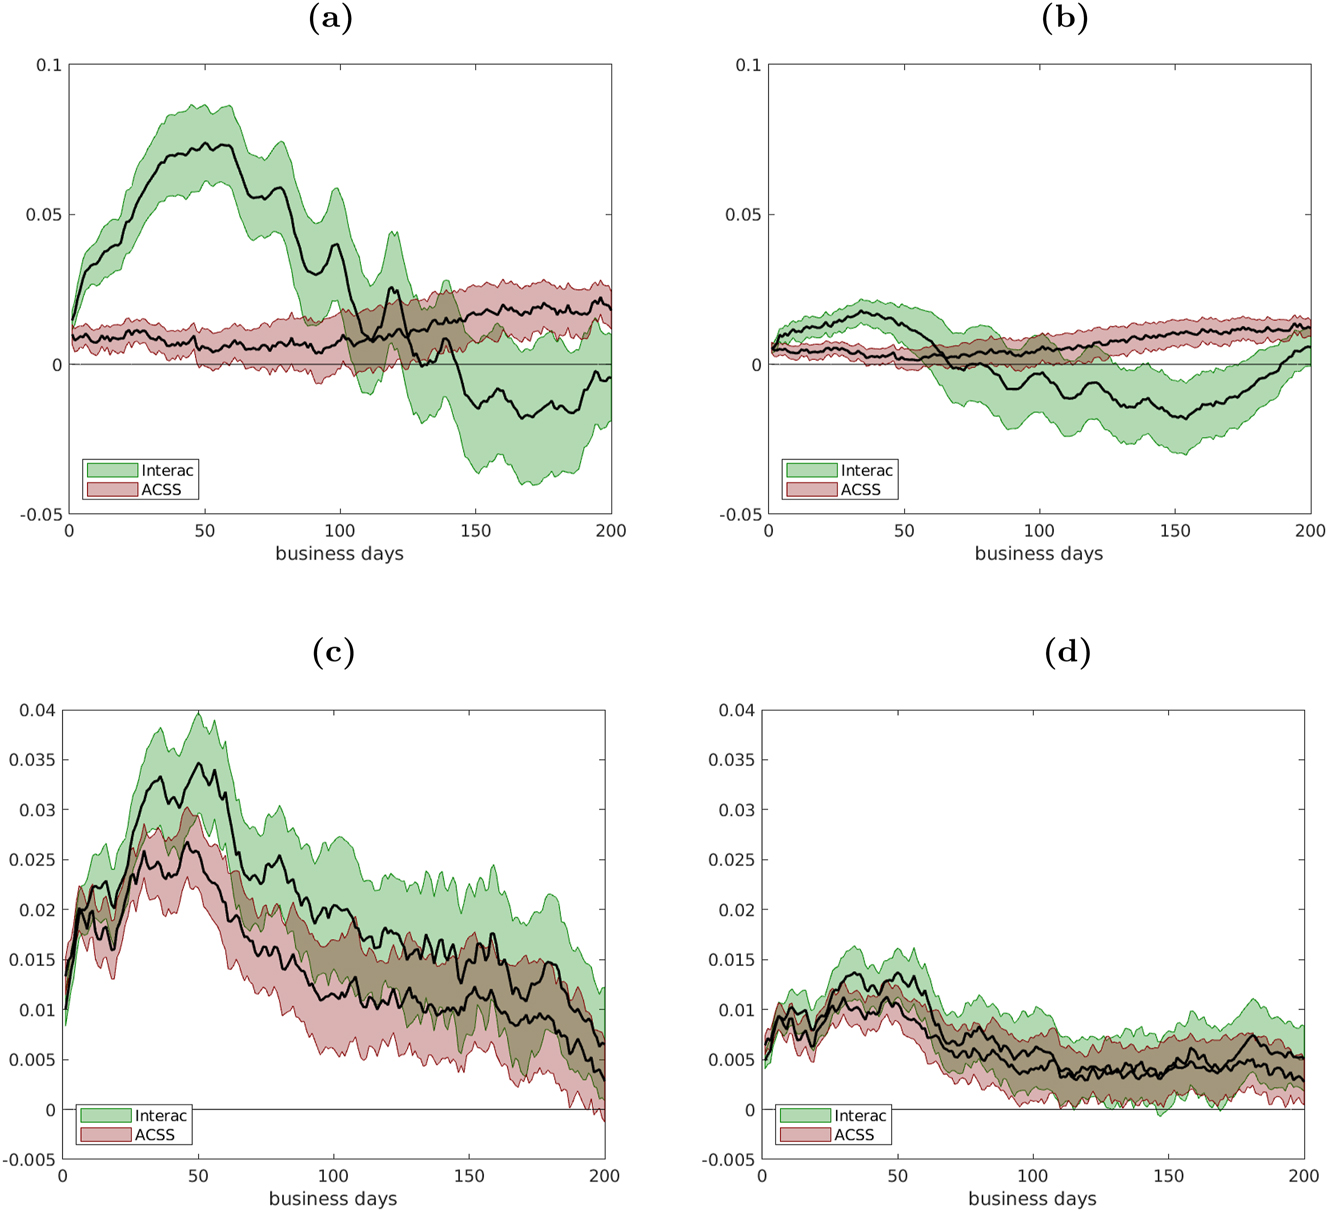
Impulse responses of ABM and POS average transaction values for Interac and ACSS transactions.
Similar responses arise, although slightly less pronounced, following a percent change in Covid-19 cases. The difference between the dynamic responses of ABM average transaction values measured by ACSS and Interac are in line with the point made earlier; following the pandemic there were relatively more and higher-valued on-us ABM withdrawals versus non-on-us.
POS average transaction values obtained from ACSS and Interac behave similarly in response to a change in stringency and cases (Figure 7, panel (c) and (d)). While persistently positive, the responses start to revert after about 40 business days, and decline to small, but positive values at the end of the 200 business day horizon.
We now discuss the responses of the ACSS-Interac ratios reflecting the behavior of non-on-us transactions over the pandemic (Figures 8 and 9). Again, we find that stringency measures have a larger impact than information about cases. A change in stringency decreases the ACSS-Interac ratio for ABM withdrawals both in value and volume terms for about 50–100 business days. Afterwards, the effect is in the opposite direction and falls to zero at the end of the horizon. Due to the wide confidence intervals around the impulse responses, we cannot reject that the effects on the value share are sometimes statistically insignificant. The response to case counts is less pronounced. The ACSS-Interac ratio for ABM value responds with a slight drop that is not significant for the first 100 business days which then reverts over the next 100 days. The response of the same ratio for ABM volume is similar, with the difference that it is statistically significant for the first two weeks.
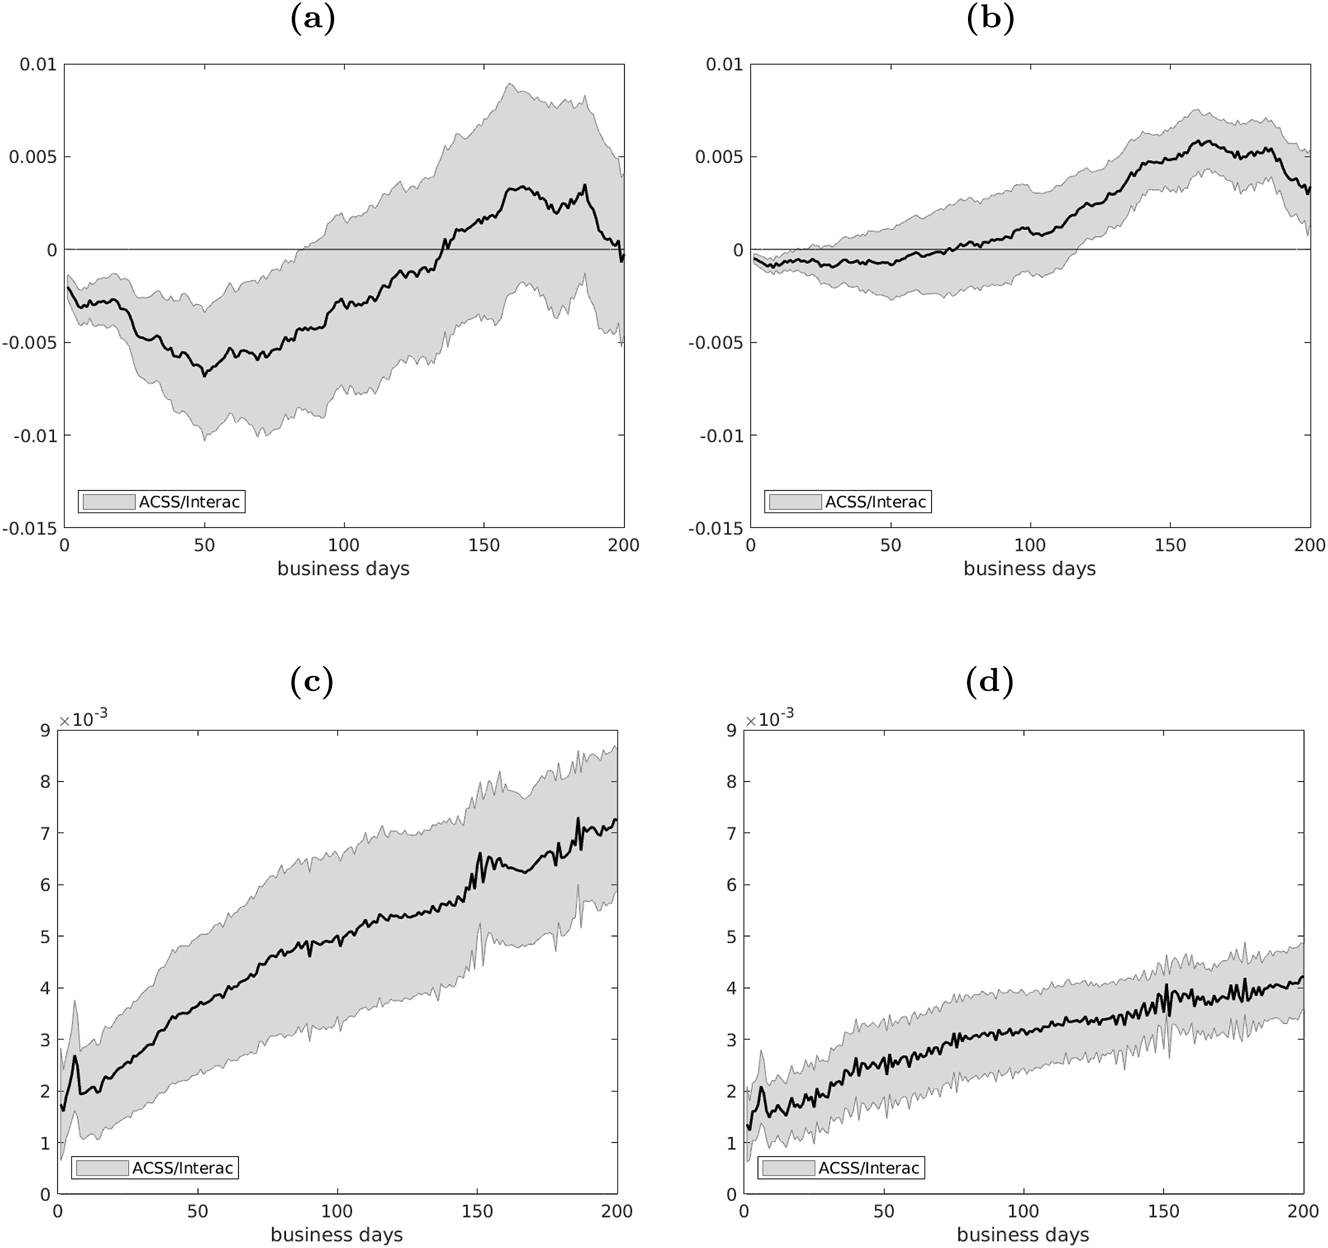
Impulse responses of ACSS-Interac value ratios for ABM and POS transactions.
Impulse responses of ACSS-Interac volume ratios for ABM and POS transactions.
The smaller share of non on-us transactions could be explained by reduced mobility which kept consumer close to their “home-bank.” It is also possible that they planned their withdrawals to avoid paying fees or that they could not access the white-label ABMs often located inside of businesses.
The ACSS-Interac POS ratio increases with the intensity of the pandemic and the effect increases over the time horizon (reflecting the trend observed in the ACSS-Interac POS ratio). The observed dynamic responses of the ACSS-Interac ratio, therefore, support our claim that the differences in responses between ACSS and Interac data over the pandemic are related to the distinct behaviour of non-on-us and on-us transactions throughout the pandemic.
Acknowledgments
The views expressed in this paper are those of the authors and do not represent the views of the Bank of Canada. We thank Eric Chue, Walter Engert, Allan Gregory, Kim Huynh, Francisco Rivadeneyra, Leo Sabetti, Rodrigo Sekkel and seminar participants at the Bank of Canada for useful comments and suggestions.
References
Aastveit, K. A., T. M. Fastbø, E. Granziera, K. S. Paulsen, and K. N. Torstensen. 2024. “Nowcasting Norwegian Household Consumption with Debit Card Transaction Data.” Journal of Applied Econometrics 39 (7): 1220–44, https://doi.org/10.1002/jae.3076.Search in Google Scholar
Aladangady, A., S. Aron-Dine, W. Dunn, L. Feiveson, P. Lengermann, and C. Sahm. 2021. “From Transaction Data to Economic Statistics: Constructing Real-Time, High-Frequency, Geographic Measures of Consumer Spending.” In Big Data for Twenty-First-Century Economic Statistics. NBER Chapters, 115–45. National Bureau of Economic Research, Inc.10.7208/chicago/9780226801391.003.0005Search in Google Scholar
Aprigliano, V., G. Ardizzi, and L. Monteforte. 2019. “Using Payment System Data to Forecast Economic Activity.” International Journal of Central Banking 15 (4): 55–80.Search in Google Scholar
Ardizzi, G., A. Nobili, and G. Rocco. 2020. “A Game Changer in Payment Habits: Evidence from Daily Data during a Pandemic.” Questioni di Economia e Finanza (Occasional Papers) 591. Bank of Italy. Also available at: https://www.bancaditalia.it/pubblicazioni/qef/2020-0591/QEF_591_20.pdf.10.2139/ssrn.3826478Search in Google Scholar
Bagnall, J., D. Bounie, K. P. Huynh, A. Kosse, T. Schmidt, S. Schuh, and H. Stix. 2016. “Consumer Cash Usage: a Cross-Country Comparison with Payment Diary Survey Data.” International Journal of Central Banking 12 (4): 1–62.Search in Google Scholar
Bank of Canada. 2020. “Update: Bank of Canada Asks Retailers to Continue Accepting Cash.” Also available at: https://www.bankofcanada.ca/2020/05/bank-canada-asks-retailers-continue-accepting-cash/.Search in Google Scholar
Bank of Canada. 2022. “Bank of Canada Note Liabilities (Formerly K1).” Also available at: https://www.bankofcanada.ca/rates/banking-and-financial-statistics/bank-of-canada-note-liabilities-formerly-k1/.Search in Google Scholar
Bounie, D., Y. Camara, and J. W. Galbraith. 2023. “Consumer Mobility and Expenditure during the Covid-19 Containments: Evidence from French Transaction Data.” European Economic Review 151: 104326. https://doi.org/10.1016/j.euroecorev.2022.104326.Search in Google Scholar
Cavallo, A. 2024. “Inflation with Covid Consumption Baskets.” IMF Economic Review 72: 902–17. https://doi.org/10.1057/s41308-023-00213-y.Search in Google Scholar
Cevik, S. 2022. “Show Me the Money: Tracking Consumer Spending with Daily Card Transaction Data during the Pandemic.” IMF Working Paper (235). Also available at: https://www.imf.org/en/Publications/WP/Issues/2022/12/02/Show-Me-the-Money-Tracking-Consumer-Spending-with-Daily-Card-Transaction-Data-During-the-526278.10.5089/9798400226915.001Search in Google Scholar
Chapman, J., and A. Desai. 2021. “Using Payments Data to Nowcast Macroeconomic Variables during the Onset of COVID-19.” Journal of Financial Market Infrastructures 29 (1): 1–29. https://doi.org/10.21314/JFMI.2021.004.Search in Google Scholar
Chen, H., W. Engert, K. Huynh, G. Nicholls, M. Nicholson, and J. Zhu. 2020. “Cash and COVID-19: The Impact of the Pandemic on Demand for and Use of Cash.” Bank of Canada Staff Discussion Paper (2020-6). Also available at: https://www.bankofcanada.ca/2020/07/staff-discussion-paper-2020-6/.Search in Google Scholar
Chen, H., W. Qian, and Q. Wen. 2021. “The Impact of the Covid-19 Pandemic on Consumption: Learning from High-Frequency Transaction Data.” AEA Papers and Proceedings 111: 307–28. https://doi.org/10.1257/pandp.20211003.Search in Google Scholar
Dahlhaus, T., D. Hyun, A. Poulin-Moore, J. Trujillo, S. Sheikh, and B. Straus. 2022. “COVID-19, Containment and Consumption.” Also available at: https://ideas.repec.org/p/bca/bocadp/22-5.html.Search in Google Scholar
Deutsche Bundesbank. 2022. “Payment Behaviour in Germany in 2021.” Deutsche Bundesbank Reports and Studies. Also available at: https://www.bundesbank.de/en/publications/reports/studies/payment-behaviour-in-germany-in-2021-894118.Search in Google Scholar
Engert, W., and K. Huynh. 2022. “Cash, COVID-19 and the Prospects for a Canadian Digital Dollar.” Bank of Canada Staff Discussion Papers (2022-17). Also available at: https://www.banqueducanada.ca/2022/08/document-analyse-personnel-2022-17/.Search in Google Scholar
Financial Consumer Agency of Canada. 2022. “ATM Fees.” Also available at: https://www.canada.ca/en/financial-consumer-agency/services/banking/atm-fees.html.Search in Google Scholar
Foster, K., C. Greene, and J. Stavins. 2024. “2023 Survey and Diary of Consumer Payment Choice.” Federal Reserve Bank of Atlanta Research Data Reports (2024-1). Also available at: https://www.atlantafed.org/banking-and-payments/consumer-payments/survey-and-diary-of-consumer-payment-choice.Search in Google Scholar
Galbraith, J., and G. Tkacz. 2013. “Analyzing Economic Effects of September 11 and Other Extreme Events Using Debit and Payments System Data.” Canadian Public Policy 39 (1): 119–34. https://doi.org/10.3138/CPP.39.1.119.Search in Google Scholar
Galbraith, J. W., and G. Tkacz. 2018. “Nowcasting with Payments System Data.” International Journal of Forecasting 34 (2): 366–76. https://doi.org/10.1016/j.ijforecast.2016.10.002.Search in Google Scholar
Hale, T., S. Webster, A. Petherick, T. Phillips, and B. Kira. 2020. “Oxford COVID-19 Government Response Tracker.” Technical Report. Blavatnik School of Government. Also available at: https://www.bsg.ox.ac.uk/research/covid-19-government-response-tracker.Search in Google Scholar
Henry, C., K. Huynh, and A. Welte. 2018. “2017 Methods-Of-Payment Survey Report.” Bank of Canada Staff Discussion Paper (2018-17). Also available at: https://www.bankofcanada.ca/2018/12/staff-discussion-paper-2018-17/.Search in Google Scholar
Henry, C., M. Shimoda, and J. Zhu. 2022. “2021 Methods-Of-Payment Survey Report.” Bank of Canada Staff Discussion Paper (2022-23). Also available at: https://www.bankofcanada.ca/2022/12/staff-discussion-paper-2022-23/.Search in Google Scholar
Henry, C., D. Rusu, and M. Shimoda. 2024. “2022 Methods-Of-Payment Survey Report: Cash Use over 13 Years.” Discussion Papers 2024-01. Bank of Canada. Also available at: https://ideas.repec.org/p/bca/bocadp/24-01.html.Search in Google Scholar
Huynh, K., H. Lao, P. Sabourin, and A. Welte. 2020. “What Do High-Frequency Expenditure Network Data Reveal about Spending and Inflation during COVID-19?” Bank of Canada Staff Analytical Note (2020-20). Also available at: https://www.bankofcanada.ca/2020/09/staff-analytical-note-2020-20/.Search in Google Scholar
Jonker, N., C. van der Cruijsen, M. Bijlsma, and W. Bolt. 2022. “Pandemic Payment Patterns.” Journal of Banking & Finance 143: 106593. https://doi.org/10.1016/j.jbankfin.2022.106593.Search in Google Scholar
Jordà, O. 2005. “Estimation and Inference of Impulse Responses by Local Projections.” The American Economic Review 95 (1): 161–82. https://doi.org/10.1257/0002828053828518.Search in Google Scholar
Kraenzlin, S., C. Meyer, and T. Nellen. 2020. “COVID-19 and Regional Shifts in Swiss Retail Payments.” Swiss Journal of Economics and Statistics 156 (14). https://doi.org/10.1186/s41937-020-00061-x.Search in Google Scholar
Mathieu, E., H. Ritchie, L. Rodés-Guirao, C. Appel, C. Giattino, J. Hasell, B. Macdonald, et al.. 2020. “Coronavirus Pandemic (COVID-19).” Our World in Data. Also available at: https://ourworldindata.org/coronavirus.Search in Google Scholar
Northcott, C. A. 2002. “Estimating Settlement Risk and the Potential for Contagion in canada’s Automated Clearing Settlement System.” Also available at: https://www.bankofcanada.ca/2002/12/working-paper-2002-41/.Search in Google Scholar
Rösl, G., and F. Seitz. 2021. “Cash and Crises: No Surprises by the Virus.” Goethe University Frankfurt, Institute for Monetary and Financial Stability Working Paper Series (150). Also available at: https://www.imfsfrankfurt.de/fileadmin/user_upload/IMFS_WP/IMFS_WP_150_web.pdf.Search in Google Scholar
Statistics Canada. 2023. “User Guide for the Survey of Household Spending, 2021.” Statitstics Canada Household Expenditures Research Paper Series. Also available at: https://www.publications.gc.ca/pub?id=9.925759&sl=0.Search in Google Scholar
Stripe. 2023. “Merchant of Record (Mor): What it Is and what it Does for Businesses.” Also available at: https://stripe.com/en-ca/resources/more/merchant-of-record#benefits-of-having-a-merchant-of-record.Search in Google Scholar
Welte, A., and J. Wu. 2023. “The Acceptance of Cash by Canadian Merchants: Evidence from the 2021 – 22 Merchant Acceptance Survey.” Journal of Payments Strategy & Systems 17 (3): 238–49. https://doi.org/10.69554/fwun1691.Search in Google Scholar
Supplementary Material
This article contains supplementary material (https://doi.org/10.1515/jbnst-2024-0013).
© 2024 the author(s), published by De Gruyter, Berlin/Boston
This work is licensed under the Creative Commons Attribution 4.0 International License.
Articles in the same Issue
- Frontmatter
- Original Articles
- Payment Habits during Covid-19: Evidence from High-Frequency Transaction Data
- Unintended Consequences of the 2015 Refugee Surge on Residential Building Permits in Germany
- Under Debate
- A Carbon Wealth Tax: Modelling, Empirics, and Policy
- Comment to “A Proposal for a Carbon Wealth Tax: Modelling, Empirics, and Policy” (DOI https://doi.org/10.1515/jbnst-2024-0078) by Willi Semmler and José Pedro Bastos Neves
- Comment to “A Proposal for a Carbon Wealth Tax: Modelling, Empirics, and Policy” (DOI https://doi.org/10.1515/jbnst-2024-0078) by Willi Semmler and José Pedro Bastos Neves
- Reply to the Comments by Hans-Helmut Kotz and Friedrich Heinemann to “A Proposal for a Carbon Wealth Tax: Modelling, Empirics, and Policy” (DOI https://doi.org/10.1515/jbnst-2024-0078)
- Data Observer
- Linked Employer–Employee Data from XING and the Mannheim Enterprise Panel
- Data on Repeated Offerings in the German Housing Market Based on RWI-GEO-RED
- Miscellaneous
- Annual Reviewer Acknowledgement