
A comparative proteomic analysis for adventitious root formation in lotus root (Nelumbo nucifera Gaertn)
-
Cheng Libao


Abstract
Adventitious roots (ARs) directly affect lotus seedling growth and product quality because principal root is not well developed. However, the details of AR formation at the molecular level have not been determined in lotus. Therefore, three stages were chosen to identify the change of proteins abundant during rhizome formation, using isobaric tags for relative and absolute quantization coupled with liquid chromatography–tandem mass spectrometry to gain insight into the molecular mechanisms involved in AR formation. We totally obtained 323,375 spectra during AR formation. After filtering to eliminate low-scoring spectra, 66,943 spectra, including 53,106 unique spectra, were identified. These unique spectra matched 28,905 peptides, including 24,992 unique peptides, which were assembled into 6686 proteins. In the C0/C1 and C1/C2 stages, 66 and 32 proteins showed enhanced abundance, and 173 and 73 proteins showed decreased abundance, respectively. Seventeen important AR formation-related proteins from the three stages were identified, and the expressions of nine genes from the above-identified proteins were assessed by qRT-PCR. This article provides a comprehensive understanding of the changes in metabolism during AR formation, and is helpful to accelerate the progress of breeding in fulture in lotus root.
1 Background
Lotus (Nelumbo nucifera Gaertn), a member of the family Nymphaeaceae, is an aquatic herb vegetable with only one genus, Nelumbo, and two species: N. nucifera (Asia, Australia, Russia) and N. lutea (eastern and southern North America) [1, 2]. Lotus originates from China and India, and has been widely cultivated in China, Japan and other Southeast Asian countries for multiple purposes. The products are very popular in the daily diet because of their richness in nutrients. China exports the processed products of lotus to Japan, Korea, Europe, and the United States as a type of off-season vegetable. In addition, Nodus nelumbinis rhizomatis (node of the lotus rhizome), germ, stamens, and lotus root stems are also used as important ingredients in traditional medicine [3].
Lotus adventitious roots (ARs) play an important role in water uptake and nutrition absorption because the principal root is not well developed. With its unique characteristics, ARs are formed on the stem of seedlings or at the internode of the rhizome underground. For ARs emerging from seedlings, a few ARs are located on the stem, which support seedling growth and development until the rhizome is formed. The number of ARs at the internode of the rhizome is more than that observed at the seedlings stage, suggesting more nutrition is needed for product formation. Liu et al. [4] reported that ARs are usually formed on stems, leaves or hypocotyls in plants. AR formation is related to cell dedifferentiation, which shifts from normal morphogenetic pathways to functions associated with the development of root primordia [5]. Three developmental processes have been observed for AR formation, namely the sink establishment phase, the recovery phase and the maintenance phase [6]. Therefore, AR formation is traditionally believed to be a complex postembryonic organogenic development process [7]. Evidence shows that changes at the physiological, biochemical and molecular levels occur during AR development [8]. The formation of ARs is a heritable quantitative trait affected by internal and external factors, such as the developmental program or environmental stimuli [9].
The critical roles of plant hormones in the regulation of AR occurrence have been identified in the last 10 years. Auxin promotes AR formation by affecting cell division and primordium formation [10], or by mediating the expression of auxin-responsive genes, which further regulate AR development [11]. The accumulation of auxin is improved in postembryonic rhizogenesis, and sufficient auxin is necessary for AR induction [12, 13]. Enhancing the endogenous free IAA content or decreasing IAA oxidase activity promotes the development of AR [14, 15]. Interaction between auxin and ethylene is involved in regulating diverse root development. The interdependency of auxin and ethylene for AR formation has already been determined. Application of auxin on Rumex palustris induced AR formation by enhancing the production of the ethylene precursor 1-aminocyclopropane-1-carboxylic acid (ACC) [16]. Conversely, exogenous ethylene treatment induces auxin synthesis in root tips [17]. In addition, Rovere et al. [18] reported that cytokinin also participates in formation of AR in Arabidopsis by tuning auxin transport and biosynthesis. Therefore, AR formation is regulated by multiple phytohormones, and the process might be very complex.
Genomics is a valuable tool to understand AR formation. Many critical proteins could regulate IAA transport to the stem after auxin synthesis in shoot apex and leaves [19]. These IAA transport proteins are classified into two types: influx carriers and efflux carriers. AUX1 and LAX are IAA influx carriers, and downregulated expression of AUX1 and LAX inhibited the induction of lateral roots because of a reduction in the transport of auxin [20]. Lateral root development requires the expression of PIN proteins [21]. It is reported that OSPINI is a putative auxin efflux carrier, and is expressed in the vascular tissues and root primordia. Further analysis showed that OsPIN1 is necessary for auxin dependent AR emergence [22]. A gene encoding a protein containing a LOB-domain plays an important role in AR formation. Liu et al. [23] found that ARL1 is induced by auxin and ethylene, and is involved in auxin-mediated cell dedifferentiation, and in the initial cell division in the pericycle cells adjacent to the peripheral vascular cylinder in the stem.
AR formation of lotus affects plant development and product quality, especially in plants whose principal root is not well developed [24]. Lotus is commonly produced by asexual propagation, so mutation through hybridization and variation fixed by asexual propagation is the main way to create new varieties. However, the number of ARs in the seedling stage derived from hybrid is very low, which leads to a longer seedling period and postponed organ production. Therefore, monitoring the changes in protein expression would be helpful to understand the mechanism of AR formation, which could accelerate the progress of lotus breeding. Isobaric tags for relative and absolute quantitation (iTRAQ) coupled with liquid chromatography-tandem mass spectrometry (LC–MS/MS) have been established as an efficient approach to study plant growth and developmental processes, with reproducible results [25]. In this article, proteomic changes were analyzed by iTRAQ and LC–MS/MS in three developmental stages of AR formation with the aim of providing a comprehensive understanding of the processes of AR formation at the molecular level.
2 Materials and methods
2.1 Plant materials
Lotus root seeds were harvested from the open cultivated field of YangZhou University, which is located in South-Eastern China. One hundred seeds were placed in a container with water at 10 cm deep for germination. The containers were placed in a light incubator with temperature 26°C/day and 20°C/night (a diurnal cycle of 16 h light/8 h darkness and a light intensity of 200 m−2s−2) during the whole experimental period. When the plants grew to the 1–2 leaves stage (about 5 days after germination), ARs started to form at the hypocotyls. For the analysis of protein expression, three developmental stages (0 day: germinated, 5 days: AR formed, 10 days: maximum number of AR) were chosen to monitor the changes in expressed proteins.
2.2 Protein extraction and iTRAQ labeling LC-MS/MS
Lotus generally contains low amounts of protein, so we carried out the protein extraction according to the protocol described by Hurkman and Tanaka [26], with some minor modifications. Hypocotyls from three stages (induction stage, initial stage and expression stage) were collected. For extraction of proteins, 2 g of hypocotyls were placed in liquid nitrogen and ground into powder with a pestle and mortar. After homogenizing the powdered hypocotyls, 2 mL of ice-cold phenol was added and the samples were incubated at 4°C for 30 min. Two milliliters of extraction buffer (pH 8.0) [250 mM sucrose, 25 mM Tris–HCl (pH 8.0), 1 mM PMSF, 10 mM EDTA and 1 mM DTT] were then added and the samples were centrifuged at 16,000×g at 4°C for 30 min. The phenol phase was transferred to another tube and the proteins were precipitated by the addition of an equal volume of extraction buffer. The procedure was repeated twice. The final phenol phase was added with 3–4 mL cold solution of 100 mM acetamide in methanol, and the mixtures were placed at −20°C for at least 2 h, and then were centrifuged at 16,000×g at 4°C for 30 min, and the supernatant discarded.
Finally, Bradford protein quantification and SDS-PAGE were used to determine the protein concentrations, taking bovine serum albumin as the standard (Bradford 1976). Then, 100 µg protein from three AR development stages was digested with Trypsin Gold (protein:trypsin=20:1), and then placed at 37°C for 4 h. The above step was repeated with an 8-h digestion, and 0.5 M TEAB was added to reconstitute the digested peptides, according to the manufacturer’s instructions (Applied Biosystems). One unit of iTRAQ reagent was thawed and reconstituted in 24 µL of isopropanol. The digested peptides were labeled using the isobaric tags at room temperature for 2 h, and then dried and pooled after vacuum centrifugation. To fractionate the labeled peptides, strong cationic exchange (SCX) chromatography was applied with a Shimadzu LC-20AB high-pressure liquid chromatography (HPLC) pump system. Digested peptides of each sample were reconstituted in about 4 mL of buffer A [pH 2.7, 25 mM NaH2PO4 in 25% acetonitrile (ACN)], and then loaded onto a 4.6 9 250-mm Ultremex SCX column containing 5-µm particles (Phenomenex). A 1 mL/min flowing rate was used to elute peptides using the following processes: buffer A for 10 min, then buffer B (pH 2.7, 25 mM NaH2PO4, 1 M KCl in 25% ACN) for 11 min, 35%–80% buffer B for 1 min before equilibrating with buffer A for 10 min before the next injection; the whole system was kept in 80% buffer B for 3 min. Absorbance at 214 nm was used to monitor the eluent; fractions were collected each minute and then pooled as 10 fractions. Samples were dried using a vacuum and desalted using a Strata X C18 column.
2.3 LC–ESI–MS/MS analysis
Each fraction was resuspended in a certain volume of buffer A (2% ACN, 0.1% FA) and centrifuged at 20,000×g for 10 min. In each fraction, the final concentration of peptide was about 0.5 µg/µL on average; 10 µL of supernatant was loaded on a Shimadzu LC-20AD nano-HPLC by the auto sampler onto a 2-cm C18 trap column (inner diameter, 200 μm), and the peptides were eluted onto a revolving 10-cm analytical C18 column (inner diameter, 75 μm) made in-house. The samples were loaded at 15 μL/min for 4 min, then the 44-min gradient was run at 400 nL/min starting from 2% to 35% B (98%ACN, 0.1%FA), followed by a 2-min linear gradient to 80%, and maintenance at 80% B for 4 min, and finally returned to 2% in 1 min. Data acquisition was performed with a Triple TOF 5600 System (AB SCIEX, Concord, ON, Canada) fitted with a Nanospray III source (AB SCIEX) and a pulled quartz tip as the emitter (New Objectives, Woburn, MA, USA). Data were acquired using an ion spray voltage of 2.5 kV, curtain gas of 30 PSI, nebulizer gas of 15 PSI, and interface heater temperature of 150°C. The MS was operated with an RP of greater than or equal to 30 000 FWHM for TOF MS scans. For IDA, survey scans were acquired in 250 ms and as many as 30 product ion scans were collected if they exceeded a threshold of 120 counts per second (counts/s) and with a 2+ to 5+ charge-state. Total cycle time was fixed to 3.3 s. The Q2 transmission window was 100 Da for 100%. Four time bins were summed for each scan at a pulse frequency value of 11 kHz by monitoring the 40 GHz multichannel TDC detector with a four-anode channel detect ion. A sweeping collision energy setting of 35±5 eV adjusted rolling collision was applied to all precursor ions for collision-induced dissociation. Dynamic exclusion was set for 1/2 of the peak width (18 s), and then the precursor was refreshed off the exclusion list.
2.4 Protein identification, quantification and bioinformatics analysis
We used the Mascot protein identification software, which was declared the gold standard for bioinformatics by the Frost/Sullivan research organization. The MGF files were searched using Mascot version 2.3.02 against the NCBInr, SwissProt and UniProt database. The peptide and protein data were extracted using high peptide confidence and top one peptide rank filters. For the protein relative quantity, a more than 2-fold change in abundance and a p-value <0.05 identified a differentially abundant protein. Proteins were confirmed by BLAST against the NCBI, and then gene ontology analysis was performed by Blast2 GO. Using the Kyoto Encyclopedia of Genes and Genomes (KEGG) tool, the differentially expressed proteins were further annotated into biological pathways. The differentially abundant proteins were classified according to their function using Blast2 Go with default parameters (https://blast2go.com).
2.4.1 Quantitative PCR
Quantitative RT-PCR (qPCR) analysis was performed to quantify the transcriptional level of 10 novel protein genes during AR formation. Total RNA from five time points (0, 2, 4, 6 and 8 days) during AR formation was extracted from hypocotyls using an RNA extraction mini kit (QIAGEN, Germany). DNase I was used to digest DNA during RNA extraction to eliminate DNA contamination. A total of 1–2 µg of RNA was used in cDNA synthesis, according to the manufacturer’s instructions (Promega, USA). The quantitative RT-PCR reaction was performed using the Mx 3000P machine (STRATAGENE, http://www.stratagene.com). The SYBR Green Master Mix was used to quantify the mRNA level, according to the manufacturer’s instructions (Tiangen, China). According to the results of a BLAST search, primers were designed for nine lotus genes (Table 1). β-Actin was used as the internal standard and amplified with the primers, forward: 5′-AACCTCCTCCTCATCGTACT-3′, and reverse: 5′-GACAGCATCAG CCATGTTCA-3′. Amplification was performed in a 20-μL reaction mixture, containing 0.16 mM dNTPs, 0.1 μM forward and reversed primers, respectively, 1 mM MgCl2, 0.4 U Taq polymerase (Tiangen, China), and 1 μL cDNA. The PCR program comprised 30 cycles of 94°C for 10 min, 94°C for 1 s, 52–60°C for 30 s, 72°C for 60 s; and a final extension at 72°C for 10 min. Triplicate samples were used for quantitative RT-PCR.
Primers for nine genes related to AR formation (encoding pectin methylesterase, peroxidase 3, L-ascorbate peroxidase 2, peroxidase 2, CDPK2, peroxidase 7, Glutathione S-transferase, indole-3-acetic acid synthase and salicylic acid-binding protein 2).
| Primers | Forward primers (5′-3′) | Reverse primers (5′-3′) |
|---|---|---|
| Pectin methylesterase | AGTCACAACCCTCGTTCTTC | GGTTCAGTCGAATGATGGTG |
| Peroxidase 3 | CTCCACCCACCTTCAACTTT | CTGAGAGGCTTCGACATTTG |
| L-ascorbate peroxidase 2 | ACTAAGGGTTCGGACCATCT | CGAAGAAAGCATCCTCATCC |
| Peroxidase 2 | CGAACCTTTCCACACTCATC | AGCGTAGCTTGGATGGATGT |
| Peroxidase 7 | AAGAAGAGCAACCTGCCCAG | ATCTTCACCATGGCAGCAGC |
| Calcium sensing receptor | CGGAGAATGACAAGAGCAAG | CCATCAGTCACAATCCAGCA |
| Calcium-dependent protein kinase 2 | AGGAAGGAAAGGTGTACAGG | GTCAGCATCTTCCTAACCAG |
| Indole-3-acetic acid synthetase GH3 | AATCCGAGACAAAGACGC | GCTTTGGAAGGAATCAGG |
| Salicylic acid-binding protein 2 | GGCGTGGCTAGATACTCAAT | ATCTCCTTCACCTGTTGCAC |
| Glutathione S-transferase | TGGTTAGAAGTGGAAGCG | GCCAGGCTGTAGAAATCT |
These primers were designed according to the gene sequences using primer 5.0.
3 Results
3.1 Analysis of lotus AR formation under normal growth conditions
ARs are very important for lotus growth and development; therefore, proteomic changes during AR formation in hypocotyls were assessed in a local traditional species (Taikong lotus) using iTRAQ coupled with LC-MS/MS. Initially AR formation was assessed under 26°C/day and 20°C/night conditions. We observed that AR formation could be divided into three phases including phase I (no ARs stage: about 0–5 days), phase II (ARs stage: about 5–10 days) and phase III (maximum number of ARs stage: more than 10 days). During phase I, ARs began to form, which is traditionally referred to as the induction of AR formation. The ARs began to emerge at 5 days, and the number of ARs significantly increased in phase II. The number of ARs did not change after 10 days of growth. Therefore, the three key time points of 0 days (C0 stage), 5 days (C1 stage) and 10 days (C2 stage) were used for further analysis of proteomic changes during AR formation in the hypocotyls (Figure 1).
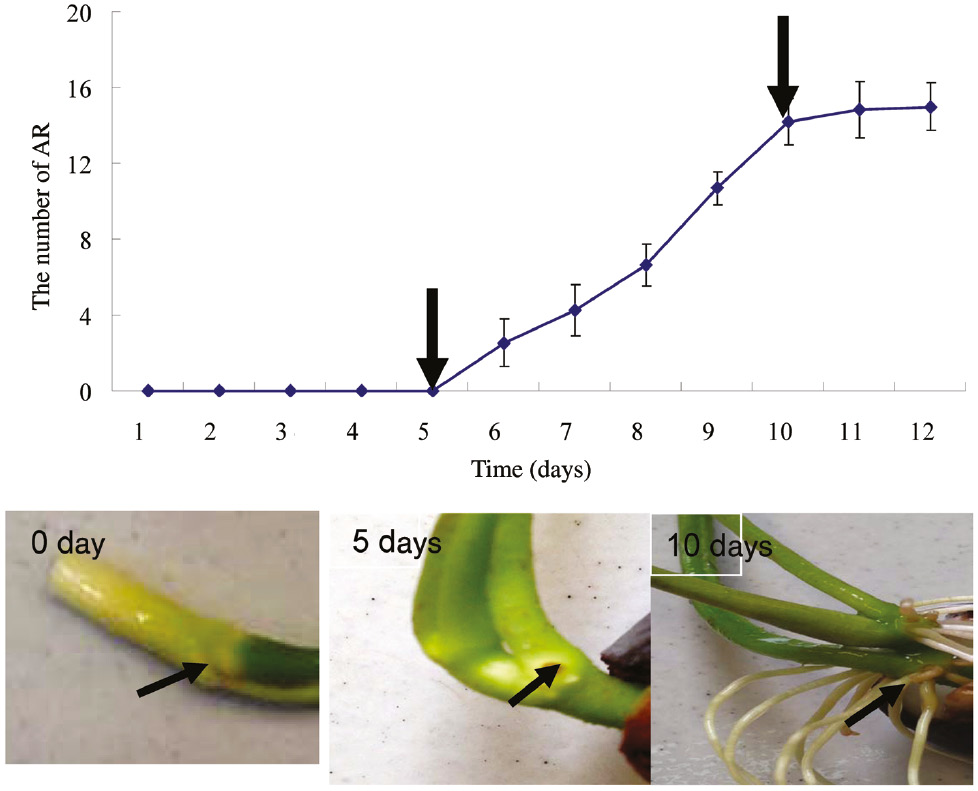
Analysis of lotus AR formation. One hundred lotus seeds were selected and placed in a container with water at 10 cm in depth for germination. The seedlings with consistent growth were chosen for further analysis of AR formation.
3.2 Identification and quantification of proteins
Proteins were extracted from the hypocotyls of 0 day, 5 days and 10 days grown lotus seedlings under normal growth condition. After determining the protein concentrations, 100 μg was used for protein separation and identification by iTRAQ and LC-MS/MS. To reduce the probability of false peptide identification, only peptides at the 95% confidence interval, as assessed by a Mascot probability analysis greater than “identity”, were counted as identified, and each confident protein identification involved at least one unique peptide. The error distribution of the theoretical values and true values of the relative molecular weights for all matching peptides are shown in Figure 2A; 323,375 spectra during AR formation were obtained. All the spectra were filtered to eliminate low-scoring spectra, resulting in 66,943 spectra, including 53,106 unique spectra, being identified. These unique spectra were matched to 28,905 peptides, among which 24,992 were unique (Figure 2B). Based on these identified peptides, 6686 proteins were assembled (e.g. see Supplementary Material, File. 1). The molecular mass distribution of the proteins showed that about 14% of the proteins were larger than 100 kDa, and about 6% were 10–20 kDa. Eighty percent of the proteins were between 20 kDa and 100 kDa (Figure 2C).
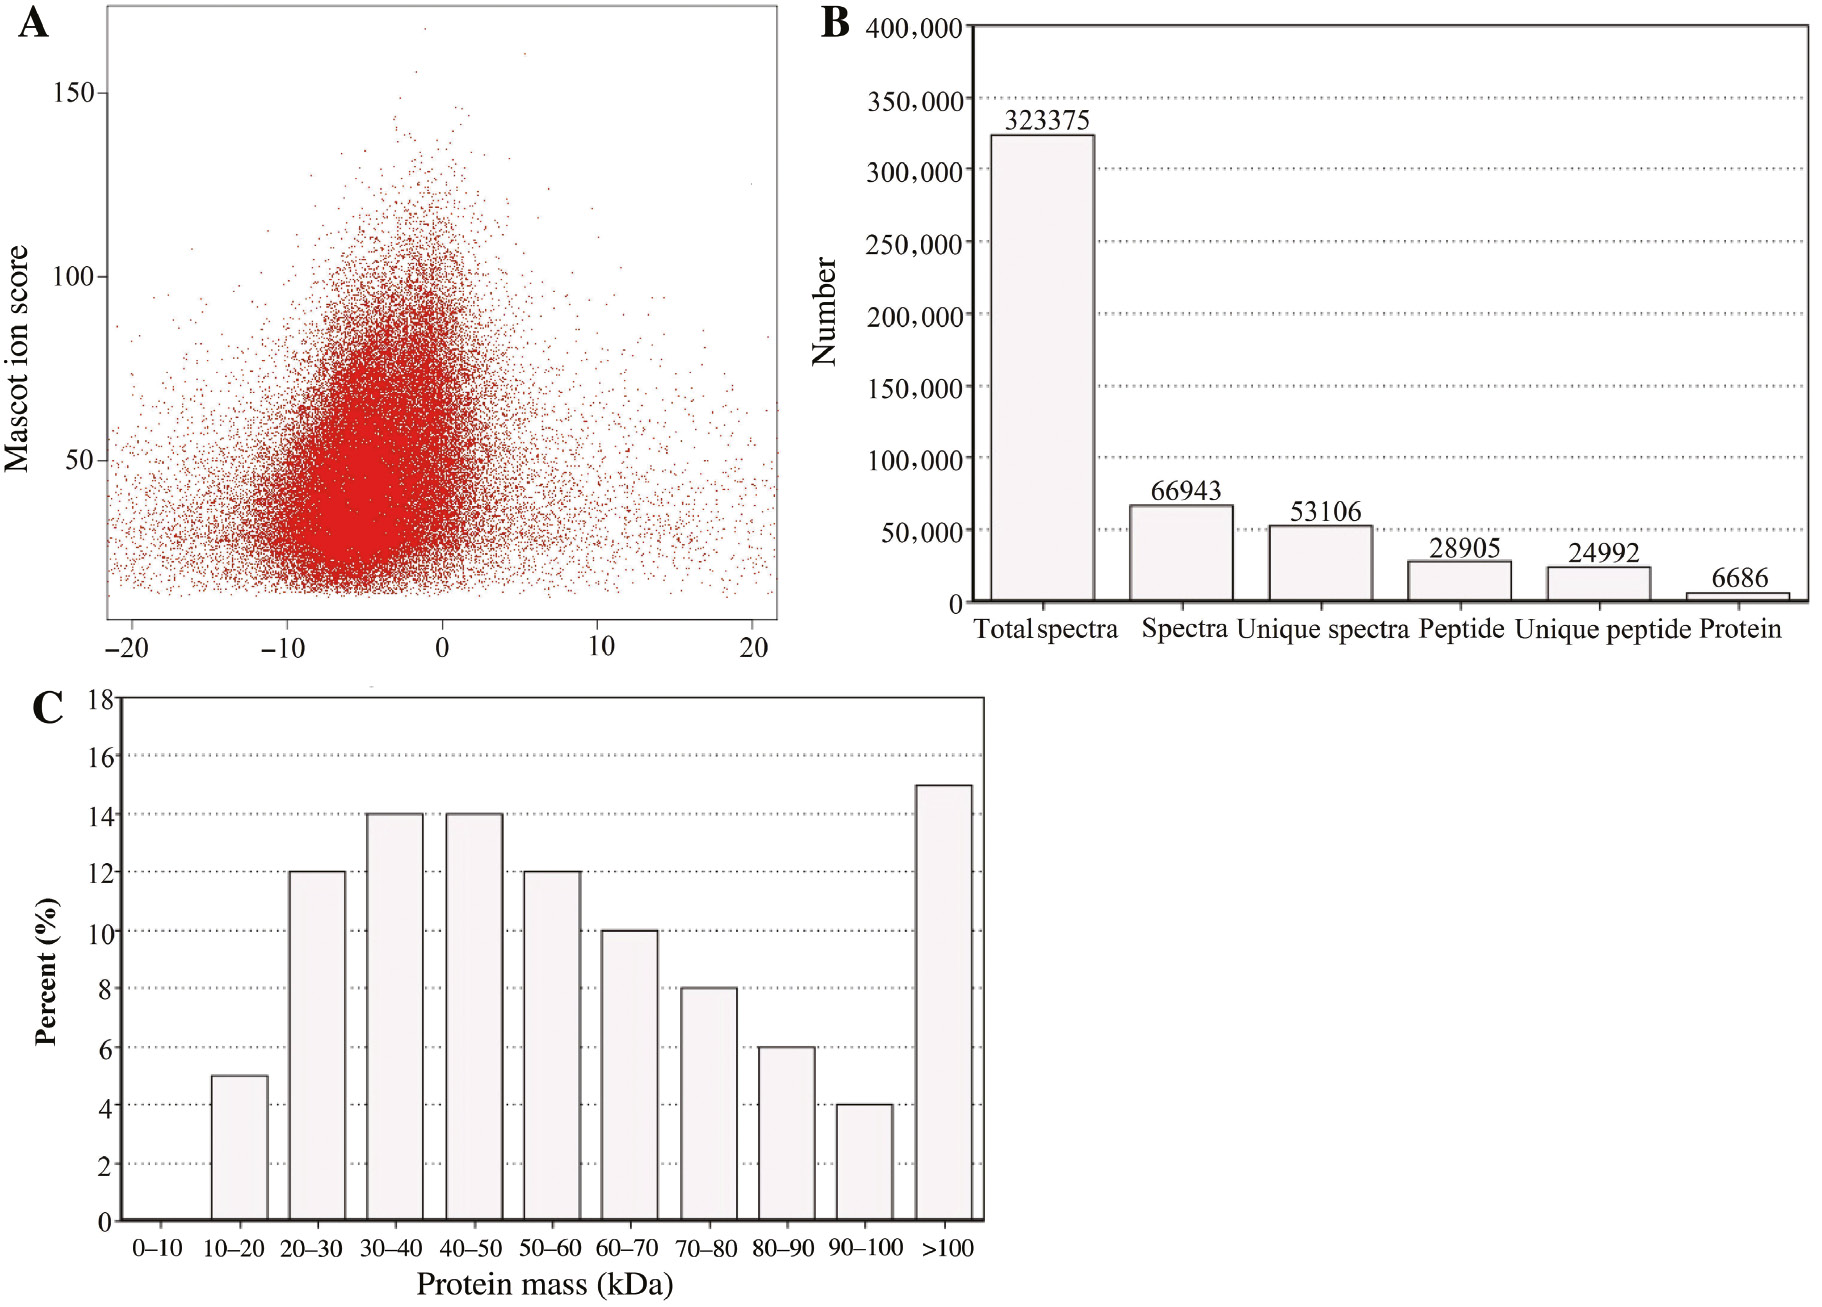
Detailed information on protein identification by iTRAQ analysis. (A) analysis of the error distribution of spectra matches quality of lotus during AR formation. (B) identification of the proteome relevant to AR formation. Total spectra, spectra and unique spectra represent the total number of secondary spectra, the spectra number that were matched and unique peptides that were matched, respectively. Peptide, unique peptide and protein represent the number of identified peptides, the number of unique peptides identified and the final number of identified proteins, respectively. (C) Relative molecular mass of identified proteins related to AR formation. The x-axis represents the molecular weights of identified proteins (unit: kDa); the y-axis represents the distribution of these identified proteins according to their molecular mass.
3.3 Protein annotation and classification
Protein functions were annotated by comparison against the existing NCBI database. First, GO functional annotation analysis was performed to study the identified proteins. All proteins were classified into three processes: biological process, cellular component and molecular function. For the biological process, the proteins involved in cellular and metabolic processes were the largest group, with 16.48% and 16.41% of the total identified proteins, respectively. Only 0.04% of proteins were observed to take part in locomotion. For the cellular component category, 23.94% of identified proteins were associated with metabolism of cell parts, and 19.33% were associated with the membrane. We observed that 44.89% of the proteins had catalytic activity, suggesting that the process of AR formation is very complex. For protein orthologous classification, all identified proteins were compared with the database of Cluster of Orthologous Groups (COG) to predict possible protein function (Table 3). The annotated proteins could be classified into 24 clusters. The largest cluster (1124 proteins) of proteins was ‘general function prediction only’, followed by ‘posttranslational modification, protein turnover, chaperones’ and ‘translation, ribosomal structure and biogenesis’. The smallest cluster (three proteins) was relevant to ‘nuclear structure’ (Figure 3).
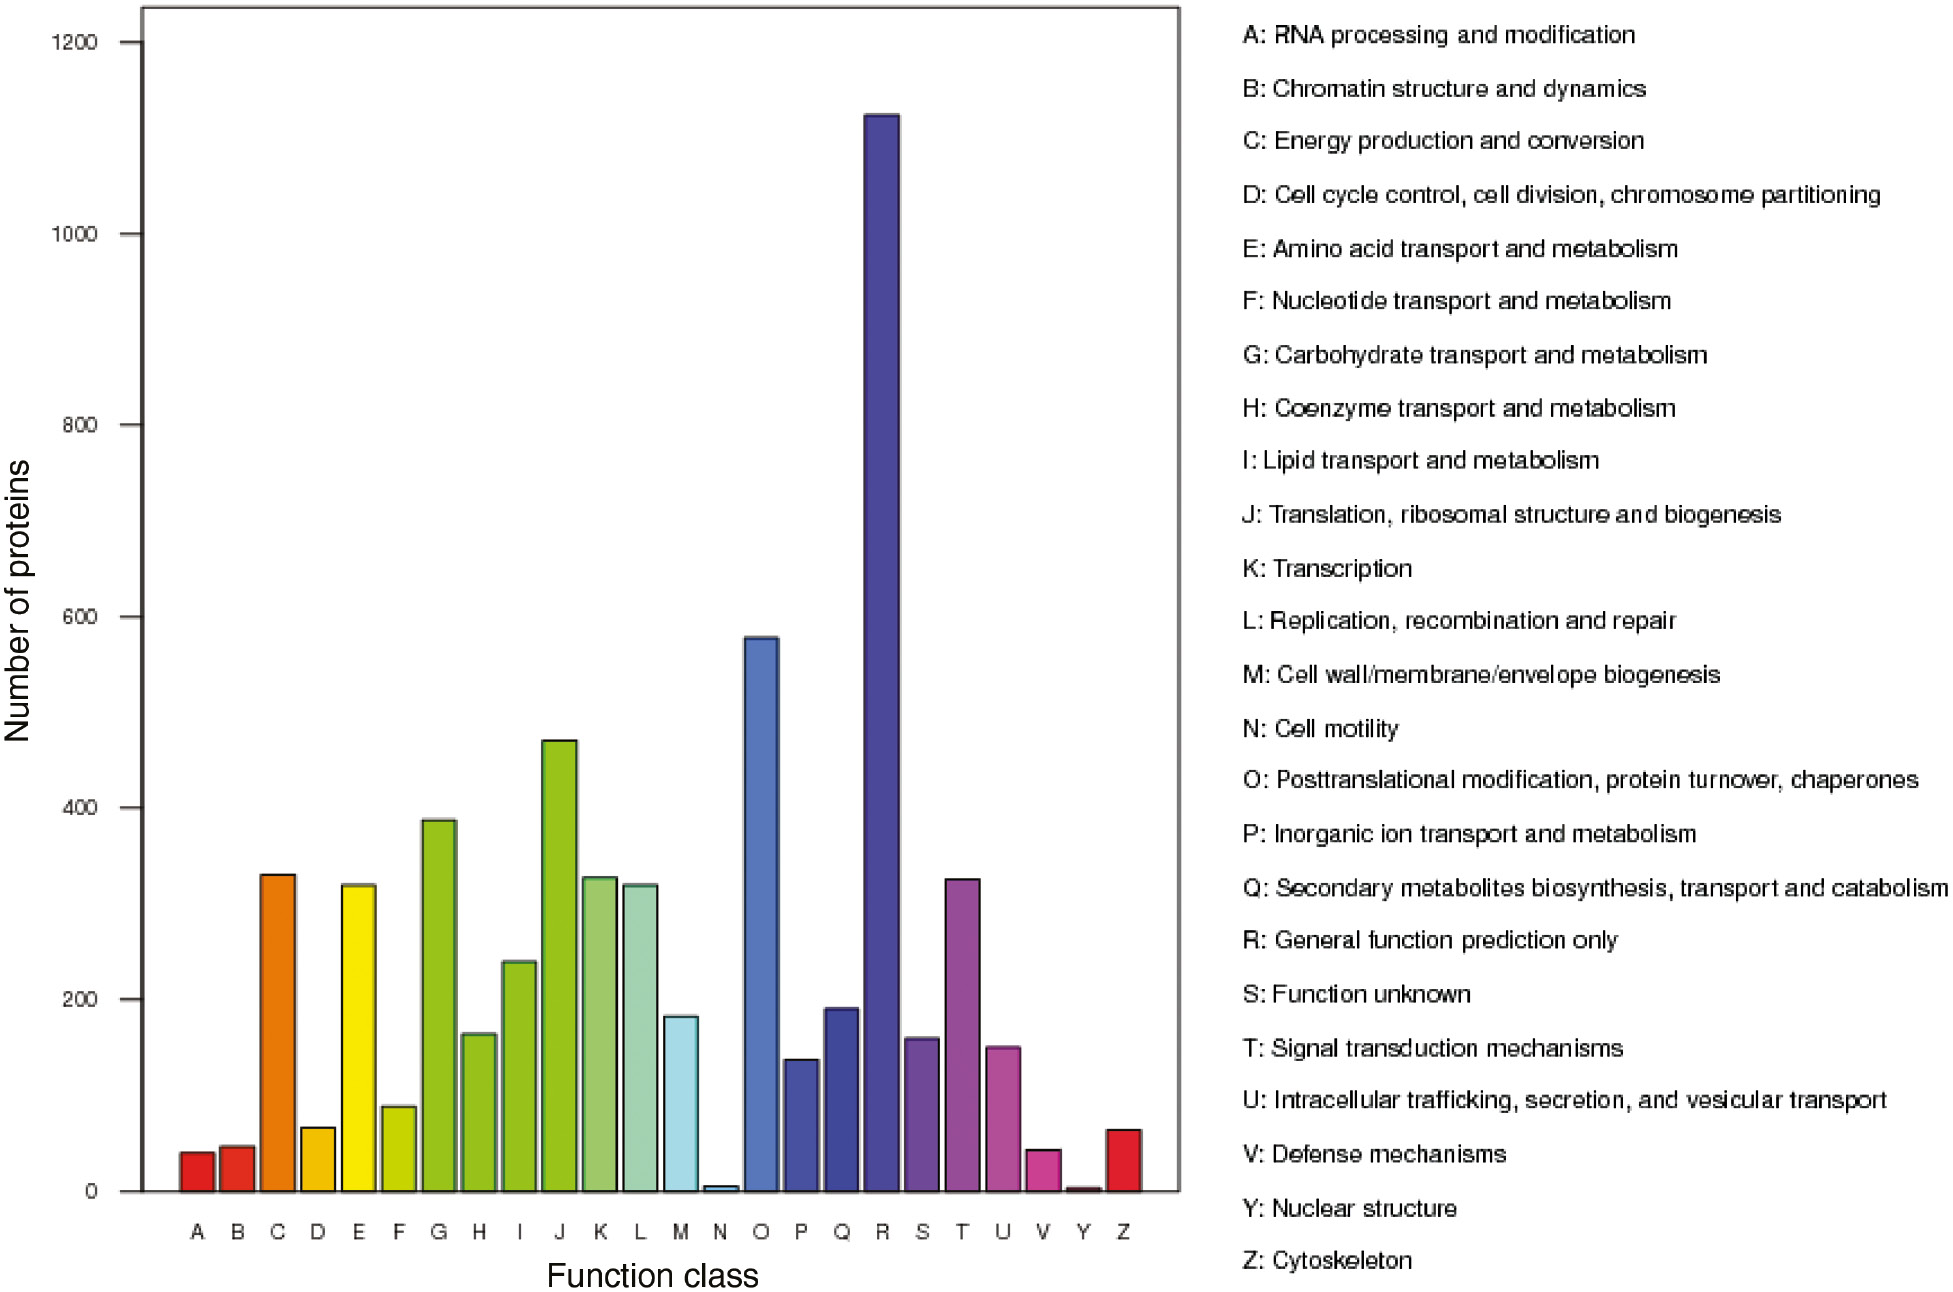
Classification of proteins by COG according to protein function in plant metabolism.
3.4 Identification of differentially abundant proteins during AR formation
Based on protein classification and annotation, differentially abundant proteins were identified from the three developmental stages during AR formation to uncover the changes in metabolism at the molecular level. A greater than 2-fold difference in protein abundance and a p-value <0.05 were used as a threshold to judge whether a protein’s change in abundance was significant. In the C0/C1 stages, 239 differentially abundant proteins were identified, among which 66 were upregulated and 173 were downregulated. In the C1/C2 stages, 105 differentially abundant proteins were identified, including 32 upregulated proteins and 73 downregulated proteins. Thus, there were more differentially abundant proteins in the C0/C1 compared with the C1/C2 stages, which suggested that the initial stage of AR formation is more complex than the late stage of AR formation (Figure 4).
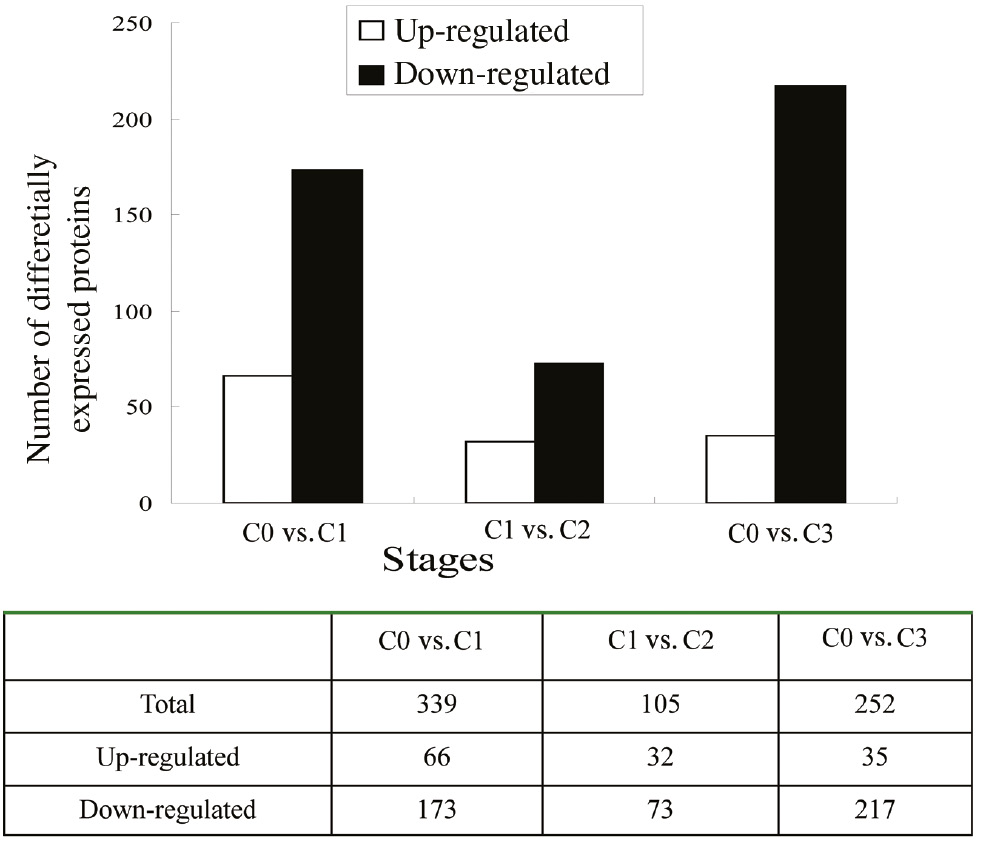
The number of differentially abundant proteins in three different stages.
The differentially abundant proteins were selected to monitor changes in metabolism during AR formation. Proteins in the C0/C1 stages could be mainly classified into 12 categories of energy metabolism, protein and amino metabolism, coenzyme metabolism, lipid metabolism, antioxidant activity, calcium regulation, cell/wall/membrane biogenesis, ion transport, secondary metabolites, plant hormone, hydrolysis and defense mechanisms. Proteins in the C1/C2 stages could be mainly classified into 14 categories, such as energy metabolism, protein and amino acid metabolism, nucleotide metabolism, carbohydrate metabolism, lipid transport and metabolism, transcription, cell wall/membrane biogenesis, posttranslational modification, inorganic ion transport, secondary metabolites, antioxidant activity, plant hormone, defense mechanisms and no function predicted. Many proteins were downregulated in the C0/C1 and C1/C2 stages. Most of the downregulated proteins in the C0/C1 stages are involved in the synthesis of substances, and those in the C1/C2 stages were related to cell growth and differentiation, translation, RNA process, and modification (Table 3).
3.5 Proteins related to AR formation
All the proteins were checked in the C0/C1 and C1/C2 stages during AR formation. The data showed that most of the proteins changed in abundance in above two stages were different, suggesting that the metabolic processes might be different in the C0/C1 and C1/C2 stages. To test whether the expression patterns in this article represented all the well-defined proteins, the data sets were compared with previous reports. We found 17 identified proteins that were relevant to AR formation. These proteins and their biological functions are listed in Table 4. Among them, three proteins, pectin methylesterase, peroxidase 3 and glutathione S-transferase, showed enhanced expression levels in the C0/C1 and C1/C2 stages, and 13 proteins, including S-adenosylmethionine synthase, L-ascorbate peroxidase 2, peroxidase 2, peroxidase 7, cationic peroxidase 1, peroxidase 51, calcium sensing receptor, calcium-binding protein, calcium-dependent protein kinase 2, indole-3-acetic acid synthetase GH3, salicylic acid-binding protein 2, exordium protein and multicopper oxidase LPR1, showed increased abundance only in the C0/C1 stages; no significant changes in their expressions were found in the C1/C2 stages. One protein (Phospholipase D) showed decreased abundance in the C1/C2 stages of AR development.
3.6 Expression analysis of nine genes by qRT-PCR
Nine genes encoding proteins involved in AR formation (pectin methylesterase, peroxidase 3, l-ascorbate peroxidase 2, peroxidase 2, peroxidase 7, calcium sensing receptor, calcium-dependent protein kinase 2, indole-3-acetic acid synthetase GH3, salicylic acid-binding protein 2 and glutathione S-transferase) were analyzed by quantitative RT-PCR. The expressions of eight genes were enhanced in the C0/C1 stage during AR formation. The abundance profiles of pectin methylesterase, calcium-dependent protein kinase 2, peroxidase 7 and salicylic acid-binding protein were very similar. The mRNA level of these genes was improved at 4 days, and then decreased. The peroxidase 3, L-ascorbate peroxidase 2 and indole-3-acetic acid synthetase GH3 genes showed significantly enhanced expression at 10 days. Only one gene (encoding peroxidase 2) showed decreased expression during all AR formation stages (Figure 5). The above results indicated a correspondence of the results from qRT-PCR analysis with the iTRAQ analysis.
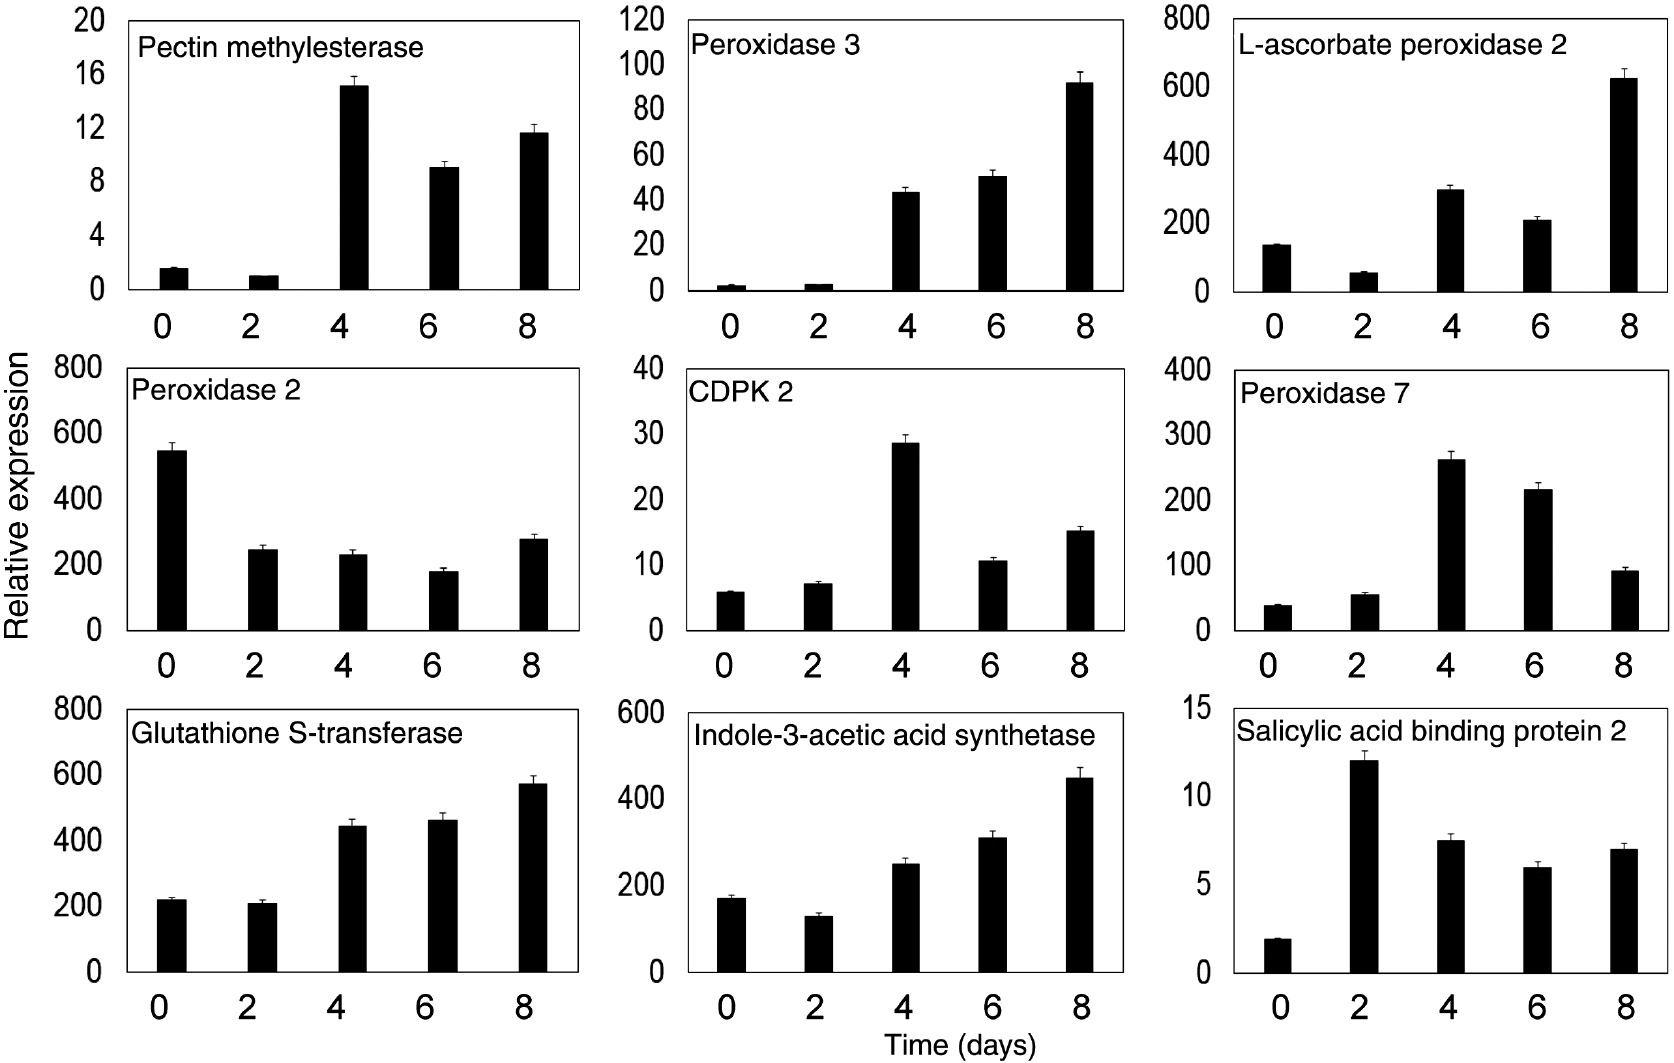
Expression analysis of nine important genes by real-time PCR. The genes encoded pectin methylesterase, peroxidase 3, L-ascorbate peroxidase 2, peroxidase 2, CDPK2, peroxidase 7, Glutathione S-transferase, indole-3-acetic acid synthase and salicylic acid-binding protein 2. Actin was used as an internal standard. Data are from three replicates.
4 Discussion
4.1 Protein identification in three stages during AR formation
Recently, the iTRAQ technique coupled with LC–MS/MS has identified regulatory mechanism [25]. There is evidence that the formation of AR in lotus (Nelumbo nucifera) is strictly regulated by many exogenous factors, especially by plant hormones [27].
AR formation is classified into three stages: the induction stage, the initiation stage and the expression stage [28, 29]. In the induction stage, new meristematic cells related to AR are established [9]. Root meristems and primordia are formed, and the root emerges from the stem in the initial and expression stages [29]. In this experiment, lotus root was cultivated in an illuminated incubator under 26°C/day and 22°C/night conditions. Three obvious developmental stages (no AR, occurrence of AR and maximum AR) were observed (Figure 1), and these three stages were used to analyze the changes in the abundance of proteins during AR formation; 323,375 spectra for AR formation were obtained. All the spectra were filtered to eliminate low-scoring spectra, and 66,943 spectra, including 53,106 unique spectra, were identified. These unique spectra were matched to 28,905 peptides, among which 24,992 were unique. Based on these identified peptides, 6686 unique proteins were identified (e.g. see Supplementary Material, File. 1), and these genes’ function were annotated accordingt to GO and COG classification (Figure 3, Table 2). We observed that many proteins showed significant changes in their abundance during AR development. The higher number of proteins in the C0/C1 stages suggested that regulation from the no AR stage (C0) to the occurrence of the AR stage (C1) is more complex compared with that of the other (C1/C2) developmental stages (Figure 4).
GO categories of proteins during AR formation.
| Function | Percent (%) | Number | |
|---|---|---|---|
| Biological process | Biological adhesion | 0.15 | 36 |
| Biological regulation | 5.46 | 1328 | |
| Biogenesis | 5.44 | 1323 | |
| Cellular process | 16.48 | 4008 | |
| Developmental process | 4.67 | 1135 | |
| Establishment of localization | 4.44 | 1081 | |
| Growth | 1.18 | 288 | |
| Immune system process | 1.01 | 246 | |
| Localization | 4.66 | 1134 | |
| Locomotion | 0.04 | 10 | |
| Metabolic process | 16.61 | 4039 | |
| Multi-organism process | 2.09 | 508 | |
| Multicellular organismal process | 4.57 | 1111 | |
| Negative regulation of biological process | 1.16 | 283 | |
| Positive regulation of biological process | 1.19 | 289 | |
| Regulation of biological process | 4.96 | 1206 | |
| Reproduction | 2.59 | 631 | |
| Reproductive process | 2.47 | 601 | |
| Response to stimulus | 8.34 | 2028 | |
| Rhythmic process | 0.12 | 30 | |
| Signaling | 1.76 | 428 | |
| Single-organism process | 10.6 | 2578 | |
| Cellular component | Cell | 23.94 | 4997 |
| Cell junction | 1.4 | 293 | |
| Cell part | 23.94 | 4997 | |
| Extracellular matrix | 0.03 | 6 | |
| Extracellular region | 2.08 | 434 | |
| Extracellular region part | 0.02 | 4 | |
| Macromolecular complex | 4.54 | 947 | |
| Membrane | 10.27 | 2143 | |
| Membrane part | 3.06 | 638 | |
| Membrane-enclosed lumen | 1.63 | 340 | |
| Nucleoid | 0.15 | 32 | |
| Organelle | 8.23 | 4035 | |
| Organelle part | 8.23 | 1717 | |
| Symplast | 1.39 | 290 | |
| Molecular function | Antioxidant activity | 1.35 | 97 |
| Binding | 40.78 | 2939 | |
| Catalytic activity | 44.89 | 3235 | |
| Electron carrier activity | 1.75 | 126 | |
| Enzyme regulator activity | 1.19 | 86 | |
| Metallochaperone activity | 0.04 | 3 | |
| Molecular transducer activity | 0.71 | 51 | |
| Nucleic acid binding transcription factor activity | 0.47 | 34 | |
| Nutrient reservoir activity | 0.21 | 9 | |
| Protein binding transcription factor activity | 0.18 | 13 | |
| Protein tag | 0.01 | 1 | |
| Receptor activity | 0.28 | 20 | |
| Structural molecule activity | 3.5 | 252 | |
| Translation regulator activity | 0.03 | 2 | |
| Transporter activity | 4.7 | 339 |
4.2 Proteins related to anaerobic adaptation
Adaptation to submergence is very important for the survival of lotus. In this article, we found that several proteins, including ADH and calcium-dependent protein, which are related to submergence, showed increased abundance during AR formation (Table 3). Some species are also sensitive to flooding, and their productivity is seriously affected by exposure to anaerobic stress [30]. However, most aquatic plants (including lotus root) exposed to submergence show high resistance [31]. According to our results, the regulation of the expressions of the genes encoding these submergence adaptation-related proteins is essential for the formation of ARs. ADH (alcohol dehydrogenase) plays an important role in low oxygen tolerance. The expression and activity of ADH are thought to be an indicator of oxygen limitation [32]. Therefore, enhanced expression of ADH during AR development would be essential for lotus roots to adapt to submergence conditions.
Proteins whose abundance was enhanced in stages C0/C1 or C1/C2. The proteins whose abundance differed by more than 2.0-fold with a p-value <0.05 were considered differentially abundant proteins.
| Pathway | Accession | Description | Cova | Spectrumb | Unique Spectrumc | Peptidee | Unique Peptided | Fold Ratee |
|---|---|---|---|---|---|---|---|---|
| C0/C1 stages (up-regulated) | ||||||||
| Energy metabolism | XP_010269111.1 | NADPH dependent codeinone reductase 2 | 26.2 | 10 | 7 | 6 | 5 | 2.1 |
| XP_010265138.1 | Ribulose bisphosphate carboxylase small chain | 40.1 | 29 | 29 | 7 | 7 | 2.3 | |
| XP_010275511.1 | Phosphoenolpyruvate carboxykinase | 42 | 62 | 34 | 21 | 11 | 2.2 | |
| XP_010271245.1 | Alcohol dehydrogenase 1 | 10.9 | 5 | 5 | 3 | 3 | 3.2 | |
| XP_010266011.1 | Glycerate dehydrogenase | 14 | 7 | 7 | 5 | 5 | 2.2 | |
| Protein and amino metabolism | XP_010277599.1 | Serine–glyoxylate aminotransferase | 23.7 | 11 | 11 | 7 | 7 | 2.3 |
| XP_010273997.1 | Phenylalanine ammonia-lyase | 18.3 | 20 | 18 | 12 | 11 | 2.8 | |
| XP_010273014.1 | Phospho-2-dehydro-3-deoxyheptonate aldolase 1 | 33.6 | 34 | 25 | 13 | 11 | 3.9 | |
| XP_010265597.1 | Chorismate mutase 2 | 24.1 | 9 | 9 | 6 | 6 | 2.2 | |
| XP_010255557.1 | Sorbitol dehydrogenase | 25.8 | 13 | 13 | 7 | 7 | 2.1 | |
| XP_010253676.1 | Aquaporin PIP2-4 | 12.9 | 10 | 10 | 3 | 3 | 2.1 | |
| XP_010274074.1 | UDP-glucuronate 4-epimerase 6 | 16 | 8 | 6 | 5 | 4 | 2 | |
| XP_010242550.1 | Pyruvate, phosphate dikinase | 9.5 | 15 | 6 | 8 | 2 | 3.2 | |
| XP_010256671.1 | Sedoheptulose-1,7-bisphosphatase | 30.8 | 25 | 25 | 10 | 10 | 2.4 | |
| XP_010265852.1 | Beta-glucosidase 12 | 9.2 | 11 | 11 | 5 | 5 | 4 | |
| XP_010247826.1 | Oxygen-evolving enhancer protein 2 | 56.5 | 53 | 53 | 12 | 12 | 2.1 | |
| XP_010264200.1 | Pectin methylesterase | 14.9 | 8 | 6 | 6 | 4 | 2.9 | |
| XP_010269195.1 | Glucan 1,3-beta-glucosidase A | 13 | 8 | 8 | 5 | 5 | 3.5 | |
| XP_010275771.1 | Cinnamoyl-CoA reductase 1 | 14.8 | 5 | 5 | 4 | 4 | 3.2 | |
| XP_010249125.1 | Miraculin | 23.2 | 9 | 9 | 4 | 4 | 3.2 | |
| Coenzyme metabolism | XP_010270954.1 | S-adenosylmethionine synthase 5 | 58.3 | 82 | 17 | 7 | 5 | 2.4 |
| Lipid metabolism | XP_010242026.1 | Carboxylesterase 18 | 18.7 | 11 | 11 | 5 | 5 | 2.2 |
| XP_010272594.1 | Phospholipase D | 14.3 | 12 | 10 | 8 | 6 | 2.2 | |
| XP_010255571.1 | Hydroxymethylglutaryl-CoA synthase | 23.4 | 15 | 7 | 9 | 4 | 2.1 | |
| XP_010244418.1 | Carboxylesterase 15 | 41.7 | 23 | 23 | 11 | 11 | 3.7 | |
| XP_010276877.1 | 4-coumarate–CoA ligase 2 | 25.6 | 12 | 12 | 9 | 9 | 3 | |
| XP_010252045.1 | Omega-hydroxypalmitate O-feruloyl transferase | 14.4 | 7 | 7 | 5 | 5 | 3 | |
| Antioxidant activity | XP_010243339.1 | Peroxidase 3 | 30.4 | 20 | 9 | 8 | 4 | 4 |
| XP_010253495.1 | L-ascorbate peroxidase 2 | 43.2 | 29 | 29 | 7 | 7 | 3.2 | |
| XP_010264469.1 | Peroxidase 2 | 32.2 | 42 | 31 | 8 | 6 | 3 | |
| XP_010246463.1 | Peroxidase 7 | 15.4 | 6 | 6 | 4 | 4 | 2.8 | |
| XP_010256953.1 | Cationic peroxidase 1 | 40.7 | 26 | 13 | 8 | 6 | 2.2 | |
| XP_010277087.1 | Peroxidase 51 | 43.3 | 33 | 18 | 11 | 8 | 2.1 | |
| Calcium regulation | XP_010262208.1 | Calcium sensing receptor | 17.1 | 6 | 6 | 5 | 5 | 2.7 |
| XP_010276712.1 | calcium-binding protein | 31 | 32 | 22 | 6 | 3 | 2.6 | |
| XP_010276092.1 | calcium-dependent protein kinase 2 | 55.1 | 53 | 15 | 18 | 8 | 2.4 | |
| Cell/wall/membrane biogenesis | XP_010270121.1 | Fasciclin arabinogalactan protein 7 | 7 | 6 | 6 | 2 | 2 | 2.2 |
| XP_010246719.1 | Galacturonosyltransferase 8 | 12.8 | 14 | 7 | 6 | 8 | 2.5 | |
| XP_010260346.1 | Fasciclin arabinogalactan protein 13 | 4.3 | 3 | 3 | 1 | 1 | 2.1 | |
| XP_010266624.1 | Dihydroflavonol-4-reductase | 3.7 | 2 | 2 | 1 | 1 | 2.5 | |
| XP_010263488.1 | Caffeoyl-CoA O-methyltransferase | 50.4 | 20 | 20 | 8 | 8 | 3.4 | |
| XP_010262443.1 | Protein AIG1 | 9.9 | 3 | 3 | 3 | 3 | 2.4 | |
| XP_010269471.1 | Glutathione S-transferase | 44 | 20 | 19 | 8 | 7 | 3.6 | |
| XP_010273790.1 | Plasma membrane-type-like isoform X1 | 25.8 | 36 | 23 | 19 | 12 | 2.9 | |
| Ion transport | XP_010241603.1 | Bifunctional purple acid phosphatase | 37.2 | 28 | 28 | 12 | 12 | 2.8 |
| Secondary metabolites | XP_010247389.1 | S-norcoclaurine synthase | 26.4 | 11 | 8 | 4 | 3 | 6.6 |
| XP_010241050.1 | Caffeic acid 3-O-methyltransferase 1 | 36.4 | 26 | 26 | 9 | 9 | 2.2 | |
| XP_010252185.1 | Beta-amyrin 28-oxidase | 22.1 | 15 | 15 | 9 | 9 | 2.1 | |
| XP_010259992.1 | Chalcone–flavonone isomerase 2 | 43.3 | 31 | 31 | 13 | 13 | 2 | |
| XP_010253990.1 | (S)-N-methylcoclaurine 3-hydroxylase isozyme 2 | 12.6 | 6 | 6 | 5 | 5 | 3.8 | |
| XP_010252045.1 | Trans-cinnamate 4-monooxygenase | 22.4 | 20 | 20 | 9 | 9 | 2.8 | |
| XP_010268688.1 | Naringenin,2-oxoglutarate 3-dioxygenas | 42.7 | 38 | 30 | 12 | 10 | 2.2 | |
| XP_010255604.1 | Leucoanthocyanidin dioxygenase | 44 | 37 | 21 | 12 | 7 | 3.5 | |
| Hormone | XP_010277152.1 | Indole-3-acetic acid synthetase GH3 | 5.8 | 5 | 5 | 3 | 3 | 3.1 |
| XP_010255101.1 | Salicylic acid-binding protein 2 | 18 | 11 | 11 | 6 | 6 | 2 | |
| XP_010273025.1 | Exordium protein | 27.3 | 16 | 15 | 7 | 6 | 3.2 | |
| Hydrolysis | XP_010248217.1 | Lichenase-like | 48.5 | 74 | 66 | 9 | 8 | 3.2 |
| XP_010272552.1 | Extradiol ring-cleavage dioxygenase | 19.2 | 7 | 7 | 4 | 4 | 2.4 | |
| XP_010247383.1 | S-norcoclaurine synthase | 74.1 | 24 | 21 | 8 | 7 | 2.4 | |
| Defense mechanisms | XP_010249615.1 | Leucine-rich repeat receptor-like protein kinase | 4.8 | 5 | 5 | 4 | 4 | 2.4 |
| XP_010243810.1 | Multicopper oxidase LPR1 | 9.7 | 4 | 4 | 2 | 2 | 4.3 | |
| XP_010273385.1 | ABC transporter B family member 9 | 6 | 10 | 5 | 5 | 4 | 2.3 | |
| XP_010272006.1 | MLP-like protein | 62.3 | 56 | 56 | 8 | 8 | 2.2 | |
| XP_010277584.1 | Linoleate 9S-lipoxygenase 5 isoform X1 | 30.5 | 50 | 43 | 21 | 18 | 3.2 | |
| XP_010263453.1 | Epidermis-specific secreted glycoprotein EP1 | 33.1 | 50 | 32 | 11 | 9 | 2.4 | |
| XP_010273219.1 | Annexin D4 | 45 | 48 | 48 | 13 | 13 | 3 | |
| C1/C2 stages (up-regulated) | ||||||||
| Energy metabolism | XP_010252353.1 | Cytochrome b5 isoform A | 36.3 | 9 | 9 | 3 | 3 | 2.8 |
| XP_010265627.1 | NADP-dependent glyceraldehyde-3-phosphate dehydrogenase | 36.3 | 22 | 5 | 12 | 3 | 2.7 | |
| XP_010244709.1 | Mannitol dehydrogenase | 13.9 | 6 | 6 | 4 | 4 | 2.4 | |
| XP_010271245.1 | Cinnamyl alcohol dehydrogenase 1 | 10.9 | 5 | 5 | 3 | 3 | 3.0 | |
| Protein and amino acid metabolism | XP_010277599.1 | Serine–glyoxylate aminotransferase | 23.7 | 11 | 11 | 7 | 7 | 2.7 |
| XP_010253912.1 | Phenylalanine ammonia-lyase | 15.3 | 14 | 3 | 8 | 2 | 2.6 | |
| XP_010263680.1 | Succinate dehydrogenase | 26.7 | 29 | 6 | 11 | 3 | 2.5 | |
| Nucleotide metabolism | XP_010253459.1 | Adenylate kinase 1 | 16.5 | 5 | 5 | 4 | 4 | 2.6 |
| Carbohydrate metabolism | XP_010261671.1 | Pectinesterase-like | 6.7 | 5 | 5 | 3 | 3 | 3.6 |
| Lipid transport and metabolism | XP_010276877.1 | 4-coumarate-CoA ligase 2 | 25.6 | 12 | 12 | 9 | 9 | 2.6 |
| ADD74168.1 | Chalcone synthase | 31.4 | 39 | 3 | 10 | 1 | 2.6 | |
| Transcription | XP_010275981.1 | DEAD-box ATP-dependent RNA helicase 7 | 9.7 | 7 | 7 | 5 | 5 | 2.8 |
| XP_010274056.1 | Ras GTPase-activating protein-binding protein 1 | 15 | 7 | 6 | 5 | 4 | 2.8 | |
| XP_010270322.1 | Transcription factor BTF3 homolog | 43.6 | 24 | 7 | 6 | 2 | 2.5 | |
| Cell wall/membrane biogenesis | XP_010253312.1 | Aquaporin TIP1-3 | 6.4 | 2 | 2 | 1 | 1 | 2.8 |
| XP_010279359.1 | L-Ala-D/L-amino acid epimerase isoform X7 | 21.7 | 9 | 9 | 7 | 7 | 2.7 | |
| XP_010255576.1 | Rhamnose biosynthetic enzyme 1 | 21.9 | 22 | 22 | 7 | 7 | 2.7 | |
| XP_010266164.1 | Protein GRIP isoform X1 | 9.7 | 8 | 8 | 6 | 6 | 2.5 | |
| Posttranslational modification | XP_010277120.1 | Subtilisin-like protease | 8.2 | 11 | 8 | 10 | 8 | 2.5 |
| Inorganic ion transport | XP_010279275.1 | ATP sulfurylase 1 | 15.8 | 13 | 7 | 7 | 2 | 2.6 |
| XP_010257051.1 | Ferritin-3 | 37.7 | 15 | 11 | 8 | 5 | 2.6 | |
| XP_010248503.1 | Boron transporter 2 | 2.8 | 2 | 2 | 2 | 2 | 2.7 | |
| Secondary metabolites | XP_010252061.1 | Chalcone–flavonone isomerase 3 | 37.3 | 17 | 17 | 6 | 6 | 2.5 |
| Antioxidant activity | XP_010272777.1 | Peroxidase 3 | 38.5 | 19 | 10 | 9 | 6 | 2.6 |
| XP_010264470.1 | Peroxidase P7 | 23.8 | 8 | 8 | 5 | 5 | 2.9 | |
| Hormone | XP_010245464.1 | Exordium-like 2 | 8.1 | 2 | 2 | 2 | 2 | 2.1 |
| XP_010273164.1 | Abscisic acid receptor PYR1-like isoform X1 | 15.1 | 5 | 2 | 3 | 1 | 2.7 | |
| XP_010270531.1 | 1-aminocyclopropane-1-carboxylate oxidase | 17.6 | 6 | 6 | 5 | 5 | 2.5 | |
| Defense mechanisms | XP_010257546.1 | Dirigent protein 22 | 19.3 | 7 | 5 | 3 | 2 | 2.6 |
| XP_010269470.1 | Glutathione S-transferase | 6 | 2 | 2 | 1 | 1 | 3.3 | |
| Function predicated | XP_010277288.1 | Anamorsin homolog | 16.8 | 8 | 8 | 3 | 3 | 2.6 |
| XP_010248963.1 | Kirola-like | 18.4 | 6 | 6 | 3 | 3 | 2.7 | |
Reactive oxygen species (ROS) production increases under abiotic stresses, including anaerobic stress [33]. ROS cause oxidative damage to membrane lipids, proteins and nucleic acids. Thus, ROS detoxification forms an important defense against abiotic stresses. Detoxifying enzymes include superoxide dismutase, catalase and enzymes of the ascorbate-glutathione cycle. We found that many peroxidases showed increased abundance under anaerobic condition (Table 3). Peroxidase is an antioxidant enzyme that is usually upregulated to reduce forms of antioxidants to prevent the formation of ROS [34]. There is evidence that these antioxidant enzymes have critical roles in the adaptation to anaerobic stress in some plants [35, 36]. In this article, we also observed that glutathione S-transferases (GSTs) were upregulated in lotus roots under anaerobic conditions. Some studies have shown that GSTs mainly function by catalyzing the conjugation of GSH to a variety of electrophilic, hydrophobic substrates to produce more water-soluble conjugates [37, 38]. Increased levels of GSTs would improve the low oxygen adaptation ability in the seedlings of lotus root. The plant plasma membrane has been implicated as the primary site of injury, because of a transition in the molecular ordering of membrane lipids. As mentioned above, ROS produced by low oxygen stress also damage the plasma membrane. Therefore, upregulation of peroxidases and GST help to protect plants from ROS damage.
4.3 Plant hormone metabolism during AR formation
AR formation is affected by various environmental and endogenous factors [28, 39]. Plant hormones are widely believed to regulate the growth and developmental processes of plants. Formation of AR is affected by plant hormones, among which auxin has been proven to regulate AR formation [22]. Leyser [40] showed that auxin is involved in shoot and root branching, and in vascular differentiation. Application of exogenous 1-Naphthaleneacetic acid (NAA) results in higher percentages of rooting, larger numbers of ARs and heavier root dry weight [41]. Auxin plays an essential role in the induction stage rather than the initial stage of AR formation, and metabolism relevant to AR formation is very sensitive to auxin in the induction stage [42]. Auxin signal perception and transduction are reduced in Arabidopsis PLD2 mutants [29]. Further analysis revealed that phosphatidic acid accumulation via phospholipase D is required for AR formation, and in cucumber, this process is an early signaling event during AR formation induced by auxin [43]. In the present article, indole-3-acetic acid synthetase and phospholipase D showed enhanced abundance from the induction stage to the initial stage, indicating that IAA and phospholipase D are involved in AR formation, which might be critical for AR induction in lotus (Table 3, Figure 4). However, we observed that low concentrations of IAA promoted AR formation, and AR formation was inhibited by high concentrations of exogenous IAA (data not shown). Therefore, maintaining the balance of IAA metabolism in lotus is important for AR formation.
Oxidative decarboxylation of IAA by plant peroxidases is thought to be a major degradation reaction involved in controlling the in vivo level of IAA [44]. We observed increased abundances of l-ascorbate peroxidase 2, peroxidase 2, cationic peroxidase 1, peroxidase 51 peroxidase P7 and peroxidase 3 in C0/C1 stages, and peroxidase P7 and peroxidase 3 showed increased abundance in stages C1/C2 (Table 3). These peroxidases possibly play roles in the regulation of IAA content through oxidation during AR formation in lotus. Enhancing IAA level in induction stage and decreasing IAA levels in the initial stage and expression stages probably benefited the formation of AR. At the same time, peroxidase activity was remarkably enhanced in IBA-treated tissues, compared with the control, during the formation of AR in soybean hypocotyl [45]. This suggested that a interaction might exist in the regulation between peroxidase and IAA during AR formation.
1-aminocyclopropane-1-carboxylate oxidase is a critical enzyme in ethylene synthesis. In this experiment, we found that the abundance of 1-aminocyclopropane-1-carboxylate oxidase increased in the C1/C2 stages, while no significant change was found in C0/C1 stages (Table 3), suggesting that ethylene might not be necessary for induction of AR formation. Ethylene is considered a critical plant hormone in ethylene-mediated growth promotion. Ethylene not only mediates a range of different biotic and abiotic stress responses [46], but is also involved in plant growth and development. Phatak et al. reported that ethylene has a positive effect on AR formation in tomato [47]. In sunflower, Liu and Reid [48] observed that both endogenous auxin and ethylene promote AR formation. A further study provided evidence that root growth is facilitated by the induced death of epidermal cells of the node external to the tip of the root primordium until root occurrence, and that this process is mediated by ethylene action [49]. The analysis by application of inhibitors of ethylene biosynthesis and perception, as well as of the precursor aminocyclopropane-1-carboxylic acid, showed that ethylene is a stimulator for AR formation in petunia cuttings [42]. However, Coleman et al. [50] believed that ethylene plays a negative role in AR formation.
Recently, ethylene and auxin interaction was observed to be involved in lateral root (including AR) development [51]. Ethylene increases the sensitivity of the root-forming tissues to endogenous indole acetic acid, which directly results in initiating AR formation [17]. We found that protein related to IAA synthesis was enhanced abundant only in C0/C1 stages, and protein involved in ethylene synthesis was improved abundance only in C1/C2 stages. Therefore, we believe that IAA was a promoter of AR induction, and that the synthesis of ethylene is related to AR development (Table 3, Figure 5).
4.4 Ca2+ signal transduction
Ca2+ is an intracellular second messenger that regulates plant cell physiology and cellular responses to the environment. Cytosolic Ca2+ is mobilized from both intracellular and extracellular sources to allow plant cells to adapt to growth stimuli. Recently, many reports have documented the relationship between Ca2+and AR formation. Cytosolic Ca2+ is a downstream component of the H2O2 signaling pathway and depends on the auxin response for AR development [52]. In addition, Ca2+ and CaM participate in AR development, which is induced by NO and H2O2 in marigold [53]. Ca2+-dependent protein kinases are considered as Ca2+ sensors and are a family of serine/threonine proteins. Ca2+ dependent protein kinase (CDPK) is involved in AR development, where it acts as a downstream messenger in the signaling pathway triggered by auxins to promote AR formation [54]. The expressions of CDPK2, calcium-binding protein and calcium sensing receptor in lotus were studied in detail, and we concluded that these proteins play an important role in AR formation, according to their expression profiles.
In addition, pectin methylesterase, s-adenosylmethionine synthase and glutathione S-transferase increased their abundances in stages C0/C1. Pectin methylesterase belongs to a large multigene family in Arabidopsis, which is involved in various physiological processes, including cell elongation [55], cell diffraction [56] and microsporogenesis [57]. Wu et al. [58] observed that pectin methylesterase activity is required for cell wall remodeling during heat stress in soybean, which maintains plasma membrane integrity and coordinates with heat shock protein to confer thermotolerance. Antisense mRNA expressed in transgenic pea hairy roots prevented the normal separation of root border cells from the root tip into the external environment, which ultimately affects root development [59]. In the pectin methylesterase atpme3-1 mutant, the number of ARs is affected, suggesting that expression of atpme3-1 is highly correlated with AR development. The present study could not confirm whether pectin methylesterase participates in AR formation through Ca2+ regulation. According to expression of CDPK2, calcium-binding proteins and calcium sensing receptors, we concluded that Ca2+might regulate the activity of pectin methylesterase or other downstream genes to control AR formation (Tables 3 and 4).
Proteins relevant to adventitious root formation in lotus.
| ID | C0/C1 | C1/C2 | Function annotation |
|---|---|---|---|
| XP_010264200.1 | 2.9 | 3.6 | Pectin methylesterase |
| XP_010270954.1 | 2.4 | 0.8 | S-adenosylmethionine synthase |
| XP_010272594.1 | 2.2 | 0.6 | Phospholipase D |
| XP_010243339.1 | 4.0 | 2.5 | Peroxidase 3 |
| XP_010253495.1 | 3.2 | 1.0 | L-ascorbate peroxidase 2 |
| XP_010264469.1 | 3.0 | 0.5 | Peroxidase 2 |
| XP_010246463.1 | 2.8 | 0.5 | Peroxidase 7 |
| XP_010256953.1 | 2.2 | 0.6 | Cationic peroxidase 1 |
| XP_010277087.1 | 2.1 | 0.8 | Peroxidase 51 |
| XP_010262208.1 | 2.7 | 0.9 | Calcium sensing receptor |
| XP_010276712.1 | 2.6 | 0.1 | calcium-binding protein |
| XP_010276092.1 | 2.4 | 0.2 | calcium-dependent protein kinase 2 |
| XP_010269471.1 | 3.6 | 3.3 | Glutathione S-transferase |
| XP_010277152.1 | 3.1 | 1.0 | Indole-3-acetic acid synthetase GH3 |
| XP_010255101.1 | 2.0 | 0.7 | Salicylic acid-binding protein |
| XP_010273025.1 | 3.2 | 0.9 | Exordium protein |
| XP_010243810.1 | 4.3 | 0.2 | Multicopper oxidase LPR1 |
5 Conclusion
Three expression libraries were constructed and analyzed from three developmental stages for AR formation, using iTRAQ coupled with LC–MS/MS. After comparison with the existing databases, 32,3375 spectra for AR formation were obtained, among which 24,992 unique peptides were identified. Based on these identified peptides, 6686 proteins were assembled. In the C0/C1 and C1/C2 stages, 239 and 105 differentially abundant proteins were identified, respectively. Expressions of nine genes were studied by qRT-PCR to verify the results of iTRAQ. The qRT-PCR results revealed that gene expression was highly correlated with the LC–MS/MS analysis.
Acknowledgments
The authors thank Edanz Group Ltd for their editorial assistance. They also extend their thanks to members of the Beijing Institute of Genomics for their cooperation in obtaining the high-throughput sequence assembly of the Chinese water chestnut. This work was supported by the Natural Science Foundation of Jiangsu Province, China (BK20151307), Natural Science Fund for Colleges and Universities in Jiangsu Province, China (14KJB210012), and the China Postdoctoral Science Foundation funded project (2013M541738), and Interdisciplinary subject Fund of Yangzhou University, China (jcxk2015-15).
References
1. Shen-Miller J. Sacred lotus, the long-living fruits of China Antique. Seed Sci Res 2002;14:131–43.10.1079/SSR2002112Suche in Google Scholar
2. Ming R, VanBuren R, Liu YL, Yang M, Han YP, Li LT. Genome of the long-living sacred lotus (Nelumbo nucifera Gaertn.). Genome Biol 2013;14:R41.10.1186/gb-2013-14-5-r41Suche in Google Scholar PubMed PubMed Central
3. Terashima M, Awano K, Honda Y, Yoshino N, Mori T, Fujita H, et al. “Arteries within the artery” after kawasaki diease-A lotus root appearance by intravascular ultrasound. Circulation 2002;106:887.10.1161/01.CIR.0000030708.86783.92Suche in Google Scholar PubMed
4. Liu RX, Chen SM, Jiang JF, Zhu L, Zheng C, Han S, et al. Proteomic changes in the base of chrysanthemum cuttings during adventitious root formation. BMC Genomics 2013;14:919.10.1186/1471-2164-14-919Suche in Google Scholar PubMed PubMed Central
5. Li SW, Leng Y, Feng L, Zeng XY. Involvement of abscisic acid in regulatin antioxidativedefense systems and IAA-oxidase activity and improving adventitious rooting in mung bean [Vigna radiata (L.)Wilczek] seedlings under cadmium stress. Environ Sci Pollut Res 2014;21:525–37.10.1007/s11356-013-1942-0Suche in Google Scholar PubMed
6. Ahkami A, Scholz U, Steuernagel B, Strickert M, Haensch KT, Druege U, et al. Comprehensive transcriptome analysis unravels the existence of crucial genes regulating primary metabolism during adventitious root formation in petunia hybrida. PLoS One 2014;9:e100997.10.1371/journal.pone.0100997Suche in Google Scholar PubMed PubMed Central
7. Geiss G, Gutierrez L, Bellini C. Adventitious root formation: new insights and perspectives. Annu Plant Rev 2009;37:127–56.10.1002/9781444310023.ch5Suche in Google Scholar
8. Sorin C, Bussell JD, Camus I, Ljung K, Kowalczyk M, Geiss G, et al. Auxin and light control of adventitious rooting in Arabidopsis require ARGONAUTE1. Plant Cell 2005;17:1343–59.10.1105/tpc.105.031625Suche in Google Scholar PubMed PubMed Central
9. DaCosta CT, deAlmeida MR, Ruedell CM, Schwambach J, Maraschin FS, Fett-Neto AG. When stress and development go hand in hand: main hormonal controls of adventitious rooting in cuttings. Front Plant Sci 2013;4:133.10.3389/fpls.2013.00133Suche in Google Scholar
10. Kohli A, Sreenivasulu N, Lakshmanan P, Kumar PP. The phytohormone crosstalk paradigm takes center stage in understanding how plants respond to abiotic stresses. Plant Cell Rep 2013;32:945–57.10.1007/s00299-013-1461-ySuche in Google Scholar PubMed
11. Okushima Y, Fukaki H, Onoda M, Teologis A, Tasaka M. ARF7 and ARF19 regulate lateral root formation via direct avtivation of LBD/ASL genes in Arabidopsis. Plant Cell 2007;19:118–30.10.1105/tpc.106.047761Suche in Google Scholar PubMed PubMed Central
12. Pluss R, Jenny T, Meier H. IAA-induced adventitious root formation in greenwood cuttings of Populus tremula and formation of 2-indolone-3-acetylaspartic acid, a new metabolite of exogeneously applied indole-3-acetic aci. Physiologia Plantarum 1989;75:89–96.10.1111/j.1399-3054.1989.tb02068.xSuche in Google Scholar
13. Ludwig-Muller J, Vertocnik A, Town CD. Analysis of indole-3-butyric acid induce adventitious root formation on Arabidopsis stem segments. J Exp Bot 2005;56:2095–105.10.1093/jxb/eri208Suche in Google Scholar PubMed
14. Nag S, Saha K, Choudhuri MA. Role of auxin and polyamines in adventitious root formation in relation to changes in compounds involved in rooting. J Plant Growth Regul 2001;20:182–94.10.1007/s003440010016Suche in Google Scholar
15. Rout GR. Effect of auxins on adventitious root development from single node cuttings of Camellia sinensis (L.) Kuntze and associated biochemical changes. Plant Growth Regul 2006;48:111–7.10.1007/s10725-005-5665-1Suche in Google Scholar
16. Stepanova AN, Yun J, Likhacheva AV, Alonso JM. Multilevel interactions between ethylene and auxin in Arabidopsis roots. Plant Cell 2007;19:2169–85.10.1105/tpc.107.052068Suche in Google Scholar PubMed PubMed Central
17. Visser E, Cohen JD, Barendse G, Blom C, Voesenek L. An ethylene-mediated increase in sensitivity to auxin induces adventitious root formation in flooded rumex palustris sm. Plant Physiol 1996;112:1687–92.10.1104/pp.112.4.1687Suche in Google Scholar PubMed PubMed Central
18. Rovere FD, Fattorini LS. Angeli D, Veloccia A, Falasca G, Altamura MM. Auxin and cytokinin control formation of the quiescent centre in the adventitious root apex of Arabidopsis. Ann Bot 2013;112:1395–407.10.1093/aob/mct215Suche in Google Scholar PubMed PubMed Central
19. Sieberer T, Leyser O. Plant science-Auxin transport, but in which direction? Science 2006;312:858–60.10.1126/science.1127659Suche in Google Scholar PubMed
20. Marchant A, Bhalerao R, Casimiro I, Eklöf J, Casero PJ, Bennett M, et al. AUX1 promotes lateral root formation by facilitating indole-3-acetic acid distribution between sink and source tissues in the Arabidopsis seedling. Plant Cell 2002;14:589–97.10.1105/tpc.010354Suche in Google Scholar PubMed PubMed Central
21. Sauer M, Balla J, Luschnig C, Wisniewska J, Reinöhl V, Friml J, et al. Canalization of auxin flow by Aux/IAA-ARF-dependent feedback regulation of PIN polarity. Gen Dev 2006;20:2902–11.10.1101/gad.390806Suche in Google Scholar PubMed PubMed Central
22. Xu M, Zhu L, Shou HX, Wu P. A PIN1 Family Gene, OsPIN1, involved in auxin-dependent adventitious root emergence and tillering in Rice. Plant Cell Physiol 2005;46:1674–81.10.1093/pcp/pci183Suche in Google Scholar PubMed
23. Liu HJ, Wang SF, Yu XB, Yu J, He XW, Zhang SL, et al. ARL1, a LOB-domain protein required for adventitious root formation in rice. Plant J 2005;43:47–56.10.1111/j.1365-313X.2005.02434.xSuche in Google Scholar PubMed
24. Hodge A, Berta G, Doussan C, Merchan F, Crespi M. Plant root growth, architecture and function. Plant Soil 2009;321:153–87.10.1007/s11104-009-9929-9Suche in Google Scholar
25. Zhang XL, Qi MF, Xu T, Lu XJ, Li TL. Proteomics profiling of ethylene-induced tomato flower pedicel abscission. J Prot 2015;121:67–87.10.1016/j.jprot.2015.03.023Suche in Google Scholar PubMed
26. Hurkman WJ, Tanaka CK. Solubilization of plant membrane proteins for analysis by two-dimensional gel electrophoresis. Plant Physiol 1986;81:802–6.10.1104/pp.81.3.802Suche in Google Scholar PubMed PubMed Central
27. Rasmussen A, Hosseini SA, Hajirezaei MR, Druege U, Geelen D. Adventitious rooting declines with the vegetative to reproductive switch and involves a changed auxin homeostasis. J Exp Bot 2015;66:1437–52.10.1093/jxb/eru499Suche in Google Scholar PubMed PubMed Central
28. Kevers C, Hausman JF, Faivre-Rampant O, Evers D, Gaspar T. Hormonal control of adventitious rooting: progress and questions. J Appl Bot Angew Bot 1997;71:71–9.Suche in Google Scholar
29. Li SW, Xue L, Xu S, Feng H, An L. Mediators, genes and signaling in adventitious rooting. Bot Rev 2009;75:230–47.10.1007/s12229-009-9029-9Suche in Google Scholar
30. Vartapetian BB, Jackson MB. Plant adaptations to anaerobic stress. Ann Bot 1997;79:3–30.10.1093/oxfordjournals.aob.a010303Suche in Google Scholar
31. Ishizawa A, Murakami S, Kawakami Y, Kuramochi H. Growth and energy status of arrowhead tubers, pondweed turions and rice seeding under anoxic conditions. Plant Cell Environ 1999;22:505–14.10.1046/j.1365-3040.1999.00439.xSuche in Google Scholar
32. Jung SH, Lee JY, Lee DH. Use of SAGE technology to reveal changes in gene expression in Arabidopsis leaves undergoing cold stress. Plant Mol Biol 2003;52:553–67.10.1023/A:1024866716987Suche in Google Scholar
33. Qi BY, Yang Y, Yin YL, Xu M, Li HG. De novo sequencing, assembly, and analysis of the Taxodium ‘Zhongshansa’ roots and shoots transcriptome in response to short-term waterlogging. BMC Plant Biol 2014;14:201.10.1186/s12870-014-0201-ySuche in Google Scholar
34. Blokhina O, Virolainen E, Fagerstedt KV. Antioxidants, oxidative damage and oxygen deprivation stress. Ann Bot London 2003;91:179–94.10.1093/aob/mcf118Suche in Google Scholar
35. Lin KR, Weng C, Lo H, Chen J. Study of the root antioxidative system of tomatoes and eggplants under waterlogged conditions. Plant Sci 2004;167:355–65.10.1016/j.plantsci.2004.04.004Suche in Google Scholar
36. Foyer CH, Souriau NE, Perret S, Lelandais M, Kunert K, Pruvost C, et al. Overexpression of glutathione reductase but not glutathione synthetase leads to increases in antioxidant capacity and resistance to photoinhibition in poplar trees. Plant Physiol 1995;109:1047–57.10.1104/pp.109.3.1047Suche in Google Scholar
37. Marrs KA. The functions and regulation of glutathione S-transferases in plants. Ann Rev Plant Physiol. Plant Mol Biol 1996;47:127–58.10.1146/annurev.arplant.47.1.127Suche in Google Scholar
38. Moons A. Regulatory and functional interactions of plant growth regulators and plant glutathione S-transferases (GSTs). Vitam Horm 2005;72:155–202.10.1016/S0083-6729(05)72005-7Suche in Google Scholar
39. Pop TI, Pamfil D, Bellini C. Auxin control in the formation of adventitious roots. Not Bot Horti Agrobot Cluj Napoca 2011;39:307–16.10.15835/nbha3916101Suche in Google Scholar
40. Leyser O. Auxin signalling: the beginning, the middle and the end. Curr Opin Plant Biol 2001;4:382–6.10.1016/S1369-5266(00)00189-8Suche in Google Scholar
41. Yan YH, Li JL, Zhang XQ, Yang WY, Wan Y, Ma YM, et al. Effect of naphthalene acetic acid on adventitious root development and associated physiological changes in stem cutting of hemarthria compressa. PLoS One 2014;9:e90700.10.1371/journal.pone.0090700Suche in Google Scholar PubMed PubMed Central
42. Druege U, Franken P, Lischewski S, Ahkami AH, Zerche S, Hause B, et al. Transcriptomic analysis reveals ethylene asstimulator and auxin as regulator of adventitious root formation in petunia cuttings. Front Plant Sci 2014;5:494.10.3389/fpls.2014.00494Suche in Google Scholar PubMed PubMed Central
43. Lanteri ML, Laxalt AM, Lamattina L. Nitric oxide triggers phosphatidic acid accumulation via phospholipase D during auxin-induced adventitious root formation in cucumber. Plant Physiol 2008;147:188–98.10.1104/pp.107.111815Suche in Google Scholar PubMed PubMed Central
44. Savitsky PA, Gazaryan IG, Tishkov VI, Lagrimini LM, Ruzgas TR, Gorton L. Oxidation of indole-3-acetic acid by dioxygen catalysed by plant peroxidases: specificity for the enzyme structure. Biochem J 1999;340:579–83.10.1042/bj3400579Suche in Google Scholar
45. Chou CH, Huang YC, Liu ZH. Peroxidase genes differentially respond to auxin during the formation of adventitious roots in soybean hypocotyl. Plant Growth Regul 2010;60:151–61.10.1007/s10725-009-9431-7Suche in Google Scholar
46. Grichko VP, Glick BR. Ethylene and flooding stress in plants. Plant Physiol Biochem 2001;39:1−9.10.1016/S0981-9428(00)01213-4Suche in Google Scholar
47. Phatak SC, Jaworski CA, Liptay A. Flowering and adventitious root growth of tomato cultivars as influenced by ethephon. Hortscience 1981;16:181–2.10.21273/HORTSCI.16.2.181Suche in Google Scholar
48. Liu JH, Reid DM. Auxin and ethylene-stimulated adventitious rooting in relation to tissue sensitivity to auxin and ethylene production in sunflower hypocotyls. J Exp Bot 1992;43:1191–8.10.1093/jxb/43.9.1191Suche in Google Scholar
49. Mergemann H, Sauter M. Ethylene induces epidermal cell death at the site of adventitious root emergence in rice. Plant Physiol 2000;124:609–14.10.1104/pp.124.2.609Suche in Google Scholar PubMed PubMed Central
50. Coleman WK, Huxter TJ, Reid DM, Thorpe TA. Ethylene as an endogenous inhibitor of root regeneration in tomato leaf disc cultures in vitro. Physiol Plant 1980;48:519–25.10.1111/j.1399-3054.1980.tb03298.xSuche in Google Scholar
51. Negi S, Ivanchenko MG, Muday GK. Ethylene regulates lateral root formation and auxin transport in Arabidopsis thaliana. Plant J 2008;55:175–87.10.1111/j.1365-313X.2008.03495.xSuche in Google Scholar PubMed PubMed Central
52. Li SW, Xue LG. The interaction between H2O2 and NO, Ca2+, cGMP, and MAPKs during adventitious rooting in mung bean seedlings. In Vitro Cell Dev Biol Plant 2010;46:142–8.10.1007/s11627-009-9275-xSuche in Google Scholar
53. Liao WB, Zhang ML, Huang GB, Yu JH. Ca2+ and CaM are involved in NO- and H2O2-induced adventitious root development in marigold. J Plant Growth Regul 2012;31:253–64.10.1007/s00344-011-9235-7Suche in Google Scholar
54. Lanteri ML, Pagnussat GC, Lamattina L. Calcium and calcium-dependent protein kinases are involved in nitric oxideand auxin-induced adventitious root formation in cucumber. J Exp Bot 2006;57:1341–51.10.1093/jxb/erj109Suche in Google Scholar PubMed
55. Jiang L, Yang SL, Xie LF, Puah CS, Zhang XQ, Yang WC, et al. VANGUARD1 encodes a pectin methyl-esterase that enhances pollen tube growth in the Arabidopsis style and transmitting tract. Plant Cell 2005;17:584–96.10.1105/tpc.104.027631Suche in Google Scholar PubMed PubMed Central
56. Siedlecka A, Wiklund S, Péronne MA, Micheli F, Lesniewska J, Sethson I, et al. Pectin methylesterase inhibits intrusive and symplastic cell growth in developing wood cells of Populus. Plant Physiol 2008;146:554–63.10.1104/pp.107.111963Suche in Google Scholar PubMed PubMed Central
57. Lacoux J, Gutierrez L, Dantin F, Beaudoin B, Roger D, Laine E. Antisense transgenesis of tobacco with a flax pectin methylesterase affects pollen ornamentation. Protoplasma 2003;222:205–9.10.1007/s00709-003-0019-1Suche in Google Scholar PubMed
58. Wu HC, Hsu SF, Luo DL, Chen SJ, Huang WD, Lur HS, et al. Recovery of heat shock-triggered released apoplastic Ca2+accompanied by pectin methylesterase activity is required for thermotolerance in soybean seedlings. J Exp Bot 2010;61:2843–52.10.1093/jxb/erq121Suche in Google Scholar PubMed PubMed Central
59. Wen F, Zhu Y, Hawes MC. Effect of pectin methylesterase gene expression on pea root development. Plant Cell 1999;11: 1129–40.10.1105/tpc.11.6.1129Suche in Google Scholar PubMed PubMed Central
Supplemental Material:
The online version of this article (DOI: https://doi.org/10.1515/znc-2016-0170) offers supplementary material, available to authorized users.
©2017 Walter de Gruyter GmbH, Berlin/Boston
Artikel in diesem Heft
- Frontmatter
- Aspernolides L and M, new butyrolactones from the endophytic fungus Aspergillus versicolor
- Synthesis, in-vitro cytotoxicity of 1H-benzo[f]chromene derivatives and structure–activity relationships of the 1-aryl group and 9-position
- Biodegradation of micropollutant naproxen with a selected fungal strain and identification of metabolites
- A comparative proteomic analysis for adventitious root formation in lotus root (Nelumbo nucifera Gaertn)
- Curviflorside and curviflorin, new naphthalene glycoside and flavanol from Plicosepalus curviflorus
- Termiglaucescin, a new polyhydroxy triterpene glucoside from Terminalia glaucescens with antioxidant and anti-inflammatory potential
- Influence of structure of lactones with the methylcyclohexene and dimethylcyclohexene ring on their biotransformation and antimicrobial activity
- Effects of Hypericum perforatum extract on oxaliplatin-induced neurotoxicity: in vitro evaluations
- Bioenergetic strategy of microalgae for the biodegradation of tyrosol and hydroxytyrosol