
Bioenergetic strategy of microalgae for the biodegradation of tyrosol and hydroxytyrosol
-
Aikaterini Papazi


Abstract
Olive mill wastewater has significant polluting properties due to its high phenolic content [mainly tyrosol (trs) and hydroxytyrosol (htrs)]. Growth kinetics and a series of fluorescence induction measurements for Scenedesmus obliquus cultures showed that microalgae can be tolerant of these phenolic compounds. Changes in the cellular energy reserves and concentration of the phenolic compounds adjust the “toxicity” of these compounds to the microalgae and are, therefore, the main parameters that affect biodegradation. Autotrophic growth conditions of microalgae and high concentrations of trs or htrs induce higher biodegradation compared with mixotrophic conditions and lower phenolic concentrations. When microalgae face trs and htrs simultaneously, biodegradation begins from htrs, the more energetically demanding compound. All these lead to the conviction that microalgae have a “rational” management of cellular energy balance. Low toxicity levels lead to higher growth and lower biodegradation, whereas higher toxicity levels lead to lower growth and higher biodegradation. The selection of appropriate conditions (compatible to the bioenergetic strategies of microalgae) seems to be the key for a successful biodegradation of a series of toxic compounds, thus paving the way for future biotechnological applications for solving complicated pollution problems, like the detoxification of olive mill wastewater.
1 Introduction
Phenolic compounds are known hazardous pollutants, even at low concentrations. Some of them are suspected to be endocrine disrupters and have adverse effects on humans and other organisms in the natural ecosystem at concentrations even lower than those in the adopted emission standards [1]. Therefore, they need to be removed from industrial effluents and obsolete standards need to be modified. The management of wastewater containing high concentrations of phenolic compounds represents major economic and environmental challenges to most industries [2].
The bioremoval of phenolics by bacteria [3], [4], [5] and fungi [6], [7] has been studied extensively. On the contrary, the use of algae has only been investigated during the last decades [8], [9], [10], [11], [12], [13], [14], [15]. Biodegradation is a multivariable process during which many biotic and abiotic factors are involved. Numerous factors affect the degradation ability or metabolism of microorganisms by either preventing or stimulating the growth of organisms. These factors may include temperature [16], pH [17], oxygen content and availability (aeration and agitation) [18], initial cell concentration [19], pollutant concentration [8], physical and chemical properties of contaminants [10], [11], exogenously supplied energy source [9], and light intensity for photosynthetic organisms [9], [20]. To achieve maximum degradation of toxic phenolic compounds, each of these factors has to be optimized for the selected organism.
In recent work, we have shown that the unicellular green alga Scenedesmus obliquus follows an interesting bioenergetic strategy to biodegrade phenolic compounds such as phenol, monochlorophenols, monobromophenols, monoiodophenols [9], dichlorophenols [11], mononitrophenols, and monomethylphenols [8], [10]. The selection of the appropriate conditions was the key for increasing biodegradation.
Based on the previous results, we proposed a complete model for the bioenergetic strategy of the biodegradation of phenolic compounds by unicellular green algae. Previous work showed [8], [9], [10], [11] that energy reserves play a crucial role in the biodegradation yield. Microalgae utilize two main detoxification strategies. The main purpose of both strategies (lower or higher toxicity of the phenolic compounds) is the detoxification of the algal medium environment. Algal cells seem to be tolerant of the lower toxicity molecules and invest their energy mainly toward algal growth rather than biodegradation. Thus, after incubation, the culture has more cells than at the starting point, and each cell has to “face” a lower quantity of toxic molecules. Therefore, cell tolerance increases without investing additional energy into biodegradation, because the increasing growth is the strategy to face toxicity. On the other hand, under conditions of high toxicity, microalgae consume more energy in detoxifying its culture environment (biodegradation) than the energy they “invest” on growth. In this article, for the first time, we apply this model to the phenolic compounds present in the olive mill wastewater (OMW). Tyrosol (trs) and hydroxytyrosol (htrs) are two of the main phenolic compounds present in OMW. Both are strongly resistant to air/oxygen, bacterial, and enzymatic degradation, and are highly polluting.
The aim of the present contribution was to investigate, in-depth, the bioenergetic strategy used by the unicellular green alga S. obliquus to biodegrade trs and htrs, and to optimize their biodegradation using the previously reported model [11] by changing the microalgal energy status.
2 Materials and methods
2.1 Organism and culture conditions
Axenic cultures of the unicellular green alga S. obliquus, wild type D3 [21] were autotrophically grown in liquid culture medium [22] and maintained for 1 week in controlled temperature (30°C) and light (150 μmol m−2 s−1) conditions. The cultures were continuously percolated with air for CO2 supply and sedimentation avoidance.
In all the experiments, inoculums of the above cultures were distributed into 125 mL hermetically sealed bottles (diameter 5 cm, height 9.5 cm) until a concentration of approximately 1 μL packed cell volume (PCV) per mL culture medium was achieved (see Section 2.2). The final culture volume in each bottle was 50 mL and the rest was atmospheric air at the beginning of the experiment. The experiments were performed in a temperature-controlled chamber (30°C) at a light intensity of approximately 60 μmol m−2 s−1.
Four series of experiments were carried out using treatments of Scenedesmus cultures exogenously supplied with trs (C8H10O2) (Sigma-Aldrich, Munich, Germany) and/or htrs (C8H10O3) (Cayman, Ann Arbor, MI, USA). The first series of experiments took place under mixotrophic conditions (5 g L−1 glucose was added in the culture medium) with four different concentrations of trs (0.05, 0.1, 0.15, and 0.3 mM) compared with the control (no addition of trs). The second series of experiments was carried out in an autotrophic culture medium, exogenously supplied with the lower (0.05 mM) and the higher (0.3 mM) trs concentrations mentioned previously.
The third series of experiments was carried out in an autotrophic culture medium supplied with two different concentrations of htrs (0.05 and 0.3 mM). Htrs was dissolved in ethanol, whereas trs was dissolved in deionized water. The corresponding ethanol concentration was also added in control cultures to take into consideration the influence of ethanol. Thus, there were two different controls, one for the concentration of 0.05 mM of htrs (control 0.05 mM) and one for the concentration of 0.3 mM of htrs (control 0.3 mM). Specifically, control 0.05 mM contained 0.05% (v/v) ethanol, whereas control 0.3 mM contained 0.3% (v/v) ethanol.
The last series of experiments was carried out using both phenolic compounds (trs and htrs) at the same time. One treatment was supplied simultaneously with 0.05 mM trs and 0.05 mM htrs, whereas the other was supplied with 0.3 mM trs and 0.3 mM htrs. Both treatments were compared with their corresponding controls (control 0.05 mM and control 0.3 mM). Differential concentration of ethanol was added in the culture medium in each experimental treatment, as explained previously.
Sampling took place daily, at the same time, in sterile conditions using sterile needles without opening the bottles. To achieve complete solubility of the cells in the culture medium, cultures were shaken manually before each sampling.
2.2 Determination of growth
The culture’s growth rate was estimated by measuring the PCV of the culture according to the method of Kotzabasis et al. [23]. Briefly, the PCV of a cell suspension was determined by centrifugation at 1500 g for 5 min using hematocrit tubes (Techno Plastic Products AG, Trasadingen, Switzerland) and expressed as microliters of PCV (mL culture)−1.
2.3 Fluorescence induction measurements
The Handy Plant Efficiency Analyser, HandyPEA (Hansatech Instruments, King’s Lynn, Norfolk, UK) was used for the fluorescence induction measurements. The maximum yield of photochemistry (Fv/Fm), the functional antenna size per active reaction center (ABS/RC), the dissipation energy per active reaction center (DIo/RC), the density of active photosynthetic reaction centers (RC/CSo), the primary photochemistry (PSIo), and a photosynthetic index [PI(abs)] were measured according to the JIP method of Strasser and Strasser [24]. This method is based on the measurement of a fast fluorescence transient with a 10 μs resolution in a time span of 40 μs to 1 s. Fluorescence was measured at 12-bit resolution and excited by three light-emitting diodes providing a saturated light intensity of 3000 μmol m−2 s−1 of red (650 nm) light. The Handy PEA data sampling operates at a maximum frequency of 100 kHz only for the first 300 μs and then the frequency decreases. This method allows the dynamic measurement of a photosynthetic sample at a given physiological state.
2.4 Determination of phenolic compounds
The determination of phenolics (trs and htrs) in the culture medium was carried out using two different procedures. The first one was evaluation by spectrophotometric method using the Folin-Ciocalteu method [25]. Briefly, 2.5 mL portion of Folin-Ciocalteu reagent 0.2 N (Sigma-Aldrich, Munich, Germany) was mixed with 0.5 mL of the sample. The reaction was kept in the dark for 5 min. Then, 2 mL of a sodium carbonate solution (75 g L−1) was added to the mixture and the reaction was kept in the dark for 1 h. The absorbance was measured at 765 nm in spectrophotometer Lambda 20 (Perkin Elmer, Waltham, MA, USA). Gallic acid (Sigma-Aldrich, Munich, Germany) was used as a phenolic compound standard for the calibration curve. The above-mentioned determination was used in the experiments in which only one phenolic compound (trs or htrs) existed in the algal culture. The phenolic compound was expressed as grams of gallic acid equivalents per liter (g GAE L−1) [26].
When more than one phenolic compound was included in the algal culture (trs and htrs), high-performance liquid chromatography (HPLC) was used for the qualitative and quantitative determination of each of the two compounds. Culture samples were centrifuged for 5 min at 1500 g and the supernatants injected directly into HPLC. The analyses were performed following an isocratic method with a Shimadzu Liquid Chromatography apparatus LC 10AD (Shimadzu, Kyoto, Japan) equipped with a diode array detector (Shimadzu SPD-M10A) and a narrow-bore column C18, 2.1×150 mm, 5 μm particle size hypersil (Supelco, Bellefonte, PA, USA). The mobile phase was methanol/water (1:9 v/v) at a flow rate of 0.2 mL min−1. Detection was carried out by measuring absorbance at 280 nm. Quantification of the compounds was determined after calibration against known quantities of the phenolic compounds.
2.5 Data analysis
Each treatment has 18 separate repetitions. Six repetitions were used for each tested method. The standard deviation (Stdev) was represented in the error bars of each graph.
3 Results
3.1 Biodegradation of trs under mixotrophic conditions
The influence of trs in the mixotrophic cultures of S. obliquus was tested using four different concentrations of the phenolic compound (see Section 2.1). Under these conditions, the growth kinetic curves (Supplementary Material, Figure 1A) for 5 days of incubation time showed that there was no inhibition of algal growth. This can be deduced by comparing trs to control culture (no trs addition). To determine stress effects due to trs, we further investigated the molecular structure and function of the photosynthetic apparatus (Supplementary Material, Figures 1B and 2). There are a series of known responses in the molecular structure and function of the photosynthetic apparatus that confirms the presence of stress effects. In particular, abiotic stress conditions such as ozone elevation [27], high UV-B radiation [28], [29], and high salinity [30] led to a decrease of the reaction center’s density (RC/CSo), an increment of the functional antenna size (ABS/RC) and, subsequently, an enhancement of the nonphotochemical dissipation energy (DIo/RC), a decrease of the PSIo, and the photosynthetic efficiency (Fv/Fm).
Contrary to the above-mentioned stress responses, in the present experiments, the normalized (to Fo) fluorescence induction curves for the fifth incubation day (Supplementary Material, Figure 2A) were typical ones and the presence of trs did not lead to differentiation over the control treatment. Detailed analysis of the JIP test parameters indicated that the density of the active reaction centers (RC/CSo) (Supplementary Material, Figure 2C), the functional antenna size (ABS/RC) (Supplementary Material, Figure 2D), the PSIo (Supplementary Material, Figure 2E), the dissipation energy (DIo/RC) (Supplementary Material, Figure 2F), the [PI(abs)] (Supplementary Material, Figure 2B), and the photosynthetic efficiency (Fv/Fm) (Supplementary Material, Figure 1B) were quite similar between trs treatments and control.
Trs biodegradation is shown in Figure 1. The lower trs concentrations led to higher biodegradation percentages (Figure 1A). These results may lead to misleading conclusions because, in absolute values, 17.2% biodegradation of the 0.3 mM trs was higher than 34.3% of the 0.05 mM. To clarify the bioenergetic strategy underlying the biodegradation values, we present the removed amount of the phenolic compound in terms of PCV for the fifth incubation day (Figure 1B).
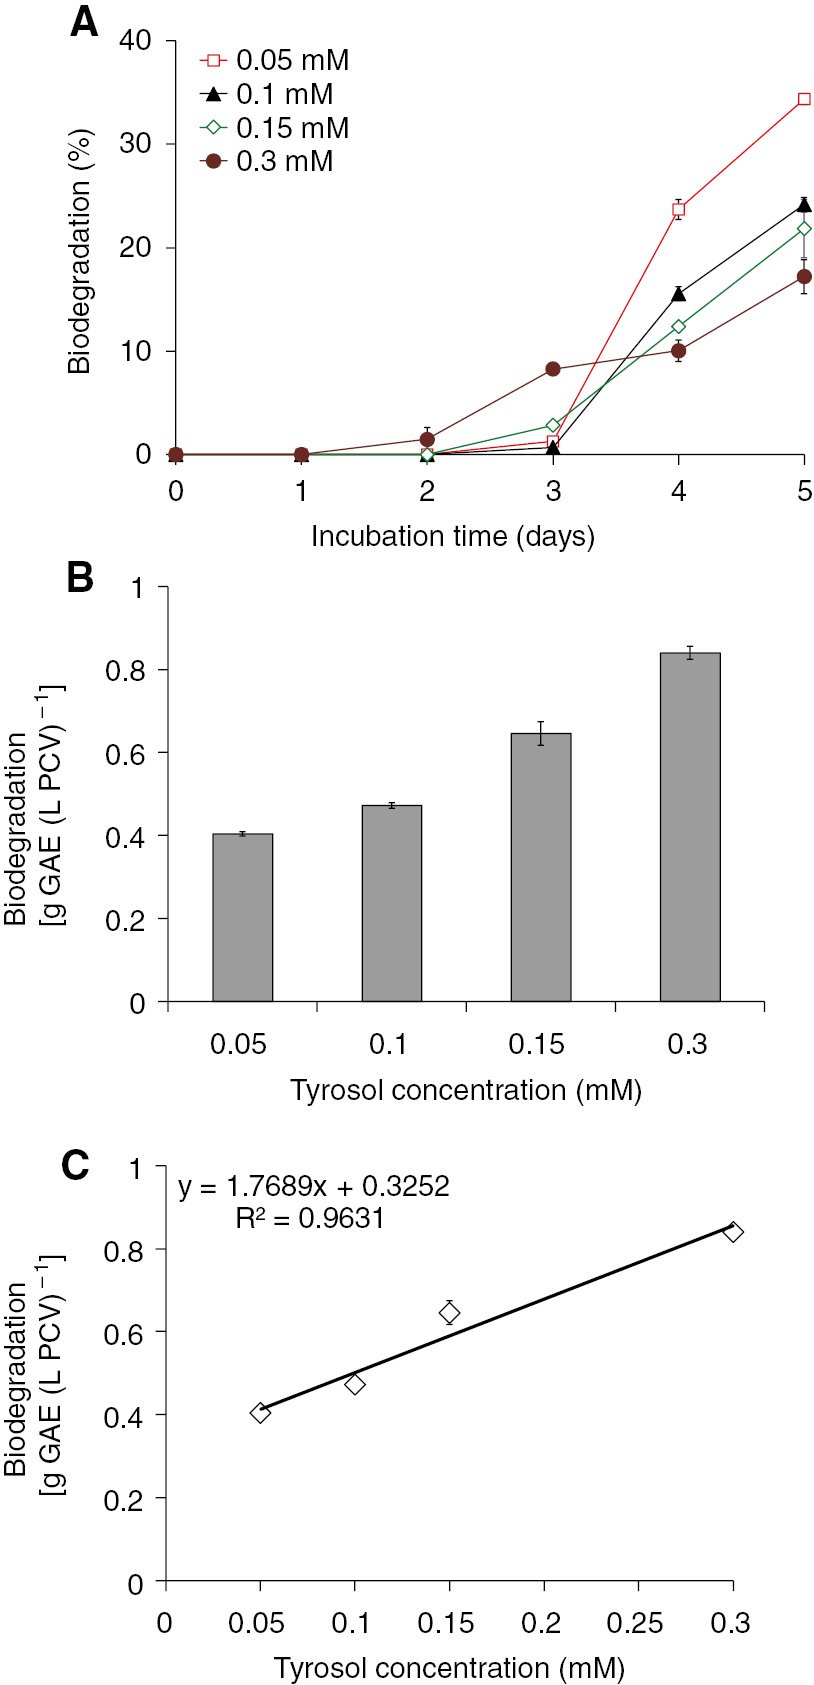
Biodegradation of several trs concentrations from S. obliquus cultures growing in a closed system under mixotrophic conditions. (A) Kinetics of trs biodegradation expressed as a percentage of the initial trs level. (B) Biodegradation of trs in the fifth incubation day expressed as grams of GAE per PCV. (C) Linear correlation between the initial trs concentration and the biodegraded trs per PCV.
Trs concentration and algal biomass seem to be the most important parameters affecting biodegradation. It became obvious that algal cells use more energy for biodegradation at the highest trs concentrations compared with the energy used for lower trs concentrations. In Figure 1C, there is a linear correlation between the initial trs concentration and the biodegradation per PCV under mixotrophic conditions (no energy limitation). Under these circumstances, we can predict the biodegradation yield on the basis of the initial trs concentration. This prediction, however, can be accurate provided that microalgal energy levels will always be in abundance.
To assess if there was any biodegradation that was not attributable to microalgae, the same experiment was carried out without any algal cells. The results confirmed that the measured biodegradation was exclusively due to the presence of the green alga. No biodegradation was noted in the absence of green algae (data not shown).
Consequently, it was found that the green alga S. obliquus is able to biodegrade trs under mixotrophic conditions. The results showed that the yield of trs removal per PCV was more efficient in the higher concentrations tested (Figure 1B). However, the absolute biodegradation values were not so high in the fifth day of incubation (biodegradation lower than 50%) and therefore the biodegradation yields have to be improved.
As found previously [8], [9], [10], [11], energy reserves play a crucial role in the biodegradation yield. The microalgae utilize two main detoxification strategies. The main purpose of both strategies (lower or higher toxicity of the phenolic compounds) is the detoxification of the algal medium environment. Algal cells seem to be tolerant in the lower toxicity molecules and invest their energy mainly to algal growth rather than biodegradation. As a result, after incubation, a higher number of cells, compared with the initial number, were counted. Furthermore, each cell had to “face” a lower quantity of toxic molecules. Therefore, the cell tolerance increases without investment of additional energy to biodegradation. Increasing growth is the strategy for facing the toxicity. On the other hand, under higher toxicity, the microalgae consume more energy to directly detoxify its culture environment (biodegradation) while “investing” less energy on growth [11].
The results of the above-mentioned experimental series clearly show that under these growth conditions (mixotrophic growth), trs is not toxic for algal culture. The absence of toxicity was evidenced by the lack of algal growth inhibition (Supplementary Material, Figure 1A) as well as by the absence of the typical stress characteristics in the molecular structure and function of the photosynthetic apparatus (Supplementary Material, Figures 1B and 2). To test whether algal cells change their strategy for trs biodegradation, we changed the culture conditions (autotrophic growth) by diminishing the availability of the cellular energy level.
3.2 Biodegradation of trs under autotrophic conditions
The last mentioned strategy led to the repetition of the tests for the trs biodegradation by the green alga S. obliquus in the absence of any exogenously supplied glucose (autotrophic conditions). The influence of trs in the autotrophic cultures of S. obliquus was tested using two different concentrations of the phenolic compound (the “low” 0.05 mM and the “high” 0.3 mM).
Under these conditions, the biomass increase (Supplementary Material, Figure 3A) and the molecular structure and function of the photosynthetic apparatus (Supplementary Material, Figures 3B and 4) were reinvestigated to detect any stress effect caused by trs in the absence of any exogenously supplied energy source (glucose). The growth kinetic curves (Supplementary Material, Figure 3A) exhibited trends identical to the control. No inhibition in the autotrophic algal growth caused by trs was detected. Moreover, the fluorescence induction curves of the fifth incubation day (Supplementary Material, Figure 4A) confirmed the previous observation. They were typical curves and did not exhibit any difference between trs and control treatments. Further analysis of the JIP test parameters supported the hypothesis that trs did not affect, in any adverse way, the molecular structure and function of the photosynthetic apparatus even in autotrophic cultures (Supplementary Material, Figures 3B and 4B–F).
Trs at the lower concentration (0.05 mM) was biodegraded up to 73.5%, whereas at the higher concentration (0.3 mM) it was only up to 15% (Figure 2A). Contrary to this, if biodegradation was expressed as the amount of the phenolic compound removed per PCV and for the fifth incubation day (Figure 2B), then it can be seen that an increased amount of trs was removed at higher concentrations. The same trend was established in either autotrophic or mixotrophic conditions. Furthermore, it seems that the higher the biodegradation difficulty, the higher the biodegradation yield. The difficulty was increased either by increasing the trs concentration or by decreasing the energy reserves (autotrophic vs. mixotrophic conditions). The ability of the cells to biodegrade trs was higher in autotrophic conditions compared with the mixotrophic ones (Figure 2B) in each tested trs concentration. However, the autotrophic/mixotrophic biodegradation ratio per PCV (Figure 2C) was lower at 0.3 mM compared with 0.05 mM. A possible explanation could be that the energy reserves are lower under autotrophic conditions and that the biodegradation at 0.3 mM trs demands more energy than at 0.05 mM. As a result, energy consumption under autotrophic conditions was faster in the higher trs concentrations, whereas the lower ratio of autotrophic/mixotrophic biodegradation represents the energy limitation.
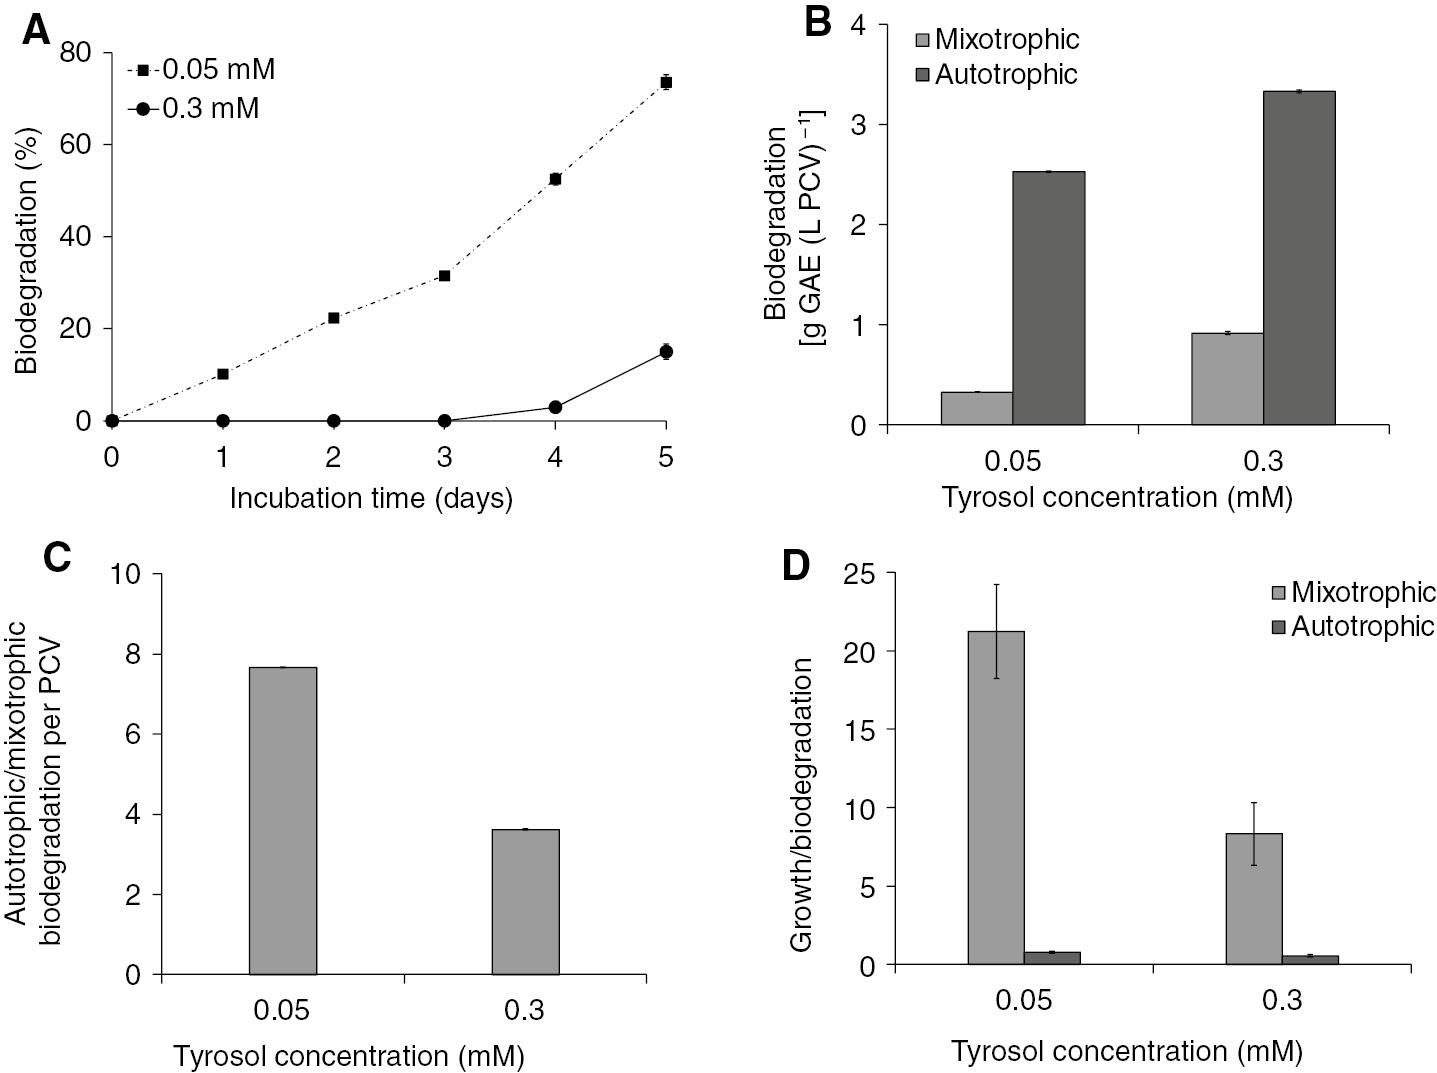
Biodegradation of two different trs concentrations (0.05 and 0.3 mM) from S. obliquus cultures growing in a closed system under autotrophic conditions. (A) Kinetics of trs biodegradation expressed as a percentage of the initial trs level. (B) Comparison among autotrophic and mixotrophic biodegradation of trs in the fifth incubation day expressed as grams of GAE per PCV. (C) Autotrophic/mixotrophic biodegradation ratio. (D) Growth/biodegradation ratio between autotrophic and mixotrophic conditions.
Interesting conclusions could be drawn by observing the growth/biodegradation ratio (Figure 2D). Under mixotrophic conditions, microalgae invest more energy into growth than into biodegradation. This energy strategy increased the number of algal cells that had to react with the phenolic compound. As a result, each cell had to “face” a lower quantity of trs. On the other hand, under autotrophic conditions, more energy was invested into biodegradation and therefore growth was maintained at lower levels.
3.3 Biodegradation of htrs under autotrophic conditions
The above-mentioned observations led us to testing the bioenergetic biodegradation strategy under conditions with higher biodegradation difficulty through the use of htrs under autotrophic conditions. Compared with trs, htrs has an additional hydroxyl group in the phenolic ring. As a result, microalgae need more energy for the fission of the additional bond, a requirement that increases the biodegradation difficulty.
The influence of htrs in the autotrophic Scenedesmus cultures was tested using two different concentrations of htrs (0.05 and 0.3 mM). Under these conditions, the biomass increase (Supplementary Material, Figure 5A) and the molecular structure and function of the photosynthetic apparatus (Supplementary Material, Figures 5B and 6) confirmed once again that the presence of htrs did not stress the cultures. Growth kinetic curves (Supplementary Material, Figure 5A) showed that there was no inhibition in the algal growth due to the presence of htrs compared with the corresponding control cultures (no htrs addition).
The previous observation is in agreement with the fluorescence induction measurements in control and htrs treatments. The fluorescence induction curves for the fifth incubation day (Supplementary Material, Figure 6A) were typical ones and did not exhibit any significant differentiation among the algal treatments. More detailed analyses of the JIP test parameters also showed that the density of the active reaction centers (RC/CSo) (Supplementary Material, Figure 6C), antenna size (ABS/RC) (Supplementary Material, Figure 6D), PSIo (Supplementary Material, Figure 6E), dissipation energy (DIo/RC) (Supplementary Material, Figure 6F), [PI(abs)] (Supplementary Material, Figure 6B), and photosynthetic efficiency (Fv/Fm) (Supplementary Material, Figure 5B) were not significantly different between htrs treatments and the corresponding controls.
At lower concentrations (0.05 mM), htrs was biodegraded by up to 18.3%, whereas at higher concentrations (0.3 mM), it was biodegraded by approximately 33% (Figure 3A). When biodegradation of htrs was expressed as htrs removed on per PCV basis, then it followed the same trend as for trs, that is, higher htrs concentration resulted in higher biodegradation yield (Figure 3B). The scenario of increasing the biodegradation yield in the case of higher biodegradation difficulty (higher htrs initial concentration) was again confirmed.
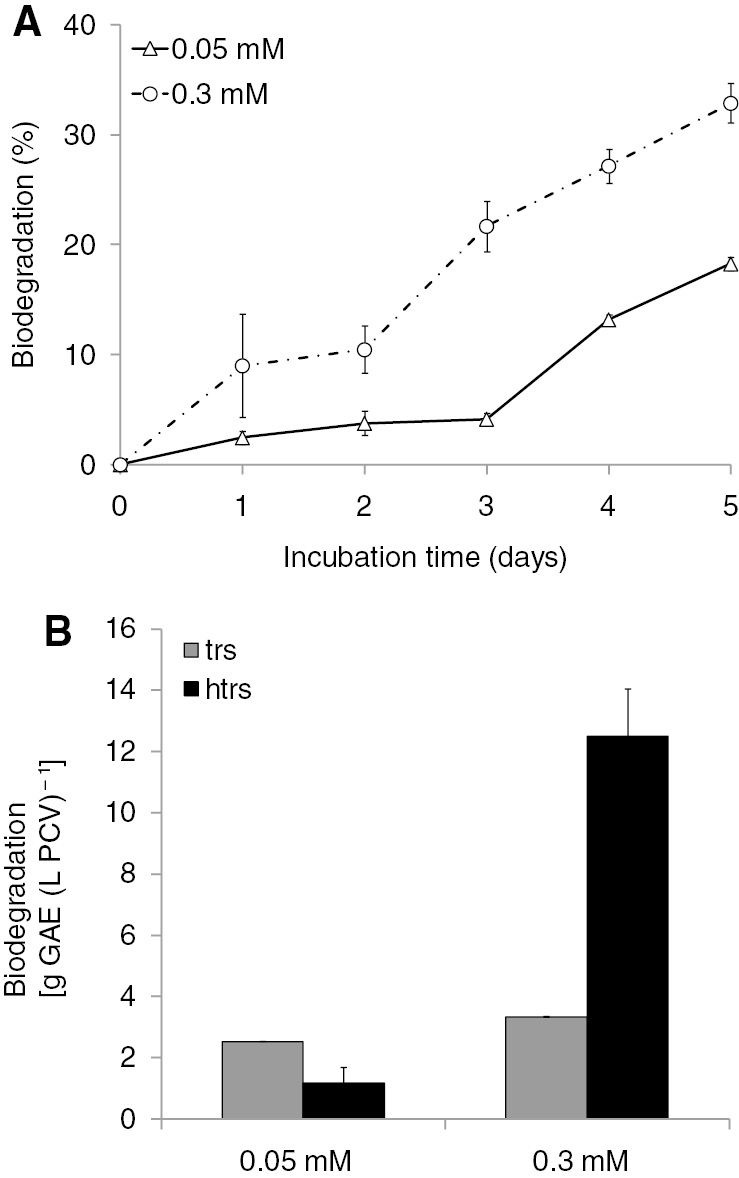
Biodegradation of two different htrs concentrations (0.05 and 0.3 mM) from S. obliquus cultures growing in a closed system under autotrophic conditions. (A) Kinetics of htrs biodegradation expressed as a percentage of the initial htrs level. (B) Comparison among trs and htrs biodegradation in the fifth incubation day expressed as grams of GAE per PCV.
A comparison of the biodegradation data between trs and htrs (the latter exhibiting increased difficulty of biodegradation) showed that at a higher concentration (0.3 mM) htrs was biodegraded significantly more than trs, whereas at a lower concentration (0.05 mM) the trend was reversed (Figure 3B).
However, this could be attributed to the small quantity of ethanol that existed in the culture medium as htrs was dissolved in ethanol (see Section 2.1). As a result, in the lower concentration of 0.05 mM htrs, the culture contains traces of ethanol and it is possible that the microalgae initially preferred consuming ethanol as an “easier” carbon source and when the ethanol was depleted the microalgae then invested its energy toward htrs biodegradation. That could cause a delay in the biodegradation of htrs in the lower concentration of 0.05 mM compared with the corresponding trs treatment at the same concentration.
3.4 Combinational biodegradation of trs and htrs under autotrophic conditions
The influence of simultaneously adding trs and htrs in the autotrophic cultures of S. obliquus was tested using two different treatments. The first consisted of 0.05 mM trs and 0.05 mM htrs, whereas the second consisted of 0.3 mM trs and 0.3 mM htrs. Under these conditions, the biomass increase (Supplementary Material, Figure 7A) and the molecular structure and function of the photosynthetic apparatus (Supplementary Material, Figures 7B and 8) again showed that the phenolic mixture did not exert any stress effect in the microalgal cultures.
Biomass increase did not differ significantly among tested treatments irrespective of the presence or absence of the phenolic mixture of trs and htrs in each tested concentration (Supplementary Material, Figure 7A). Similarly, fluorescence induction curves (Supplementary Material, Figure 8A) and the JIP test parameters (Supplementary Material, Figure 7B and 8B–F) did not differ significantly between any of the phenolic mixtures and the corresponding controls.
Biodegradation of trs and htrs is shown in Figure 4. Htrs was preferentially biodegraded compared with trs in all tested combinations of concentrations (Figure 4A and B). Trs appeared as a less biodegradable compound at lower concentrations (0.05 mM), whereas at higher concentrations (0.3 mM trs) it seemed to have increased compared with the quantity added in the culture at the onset of the experiment. This can be attributed to the conversion of htrs to trs before the complete mineralization.
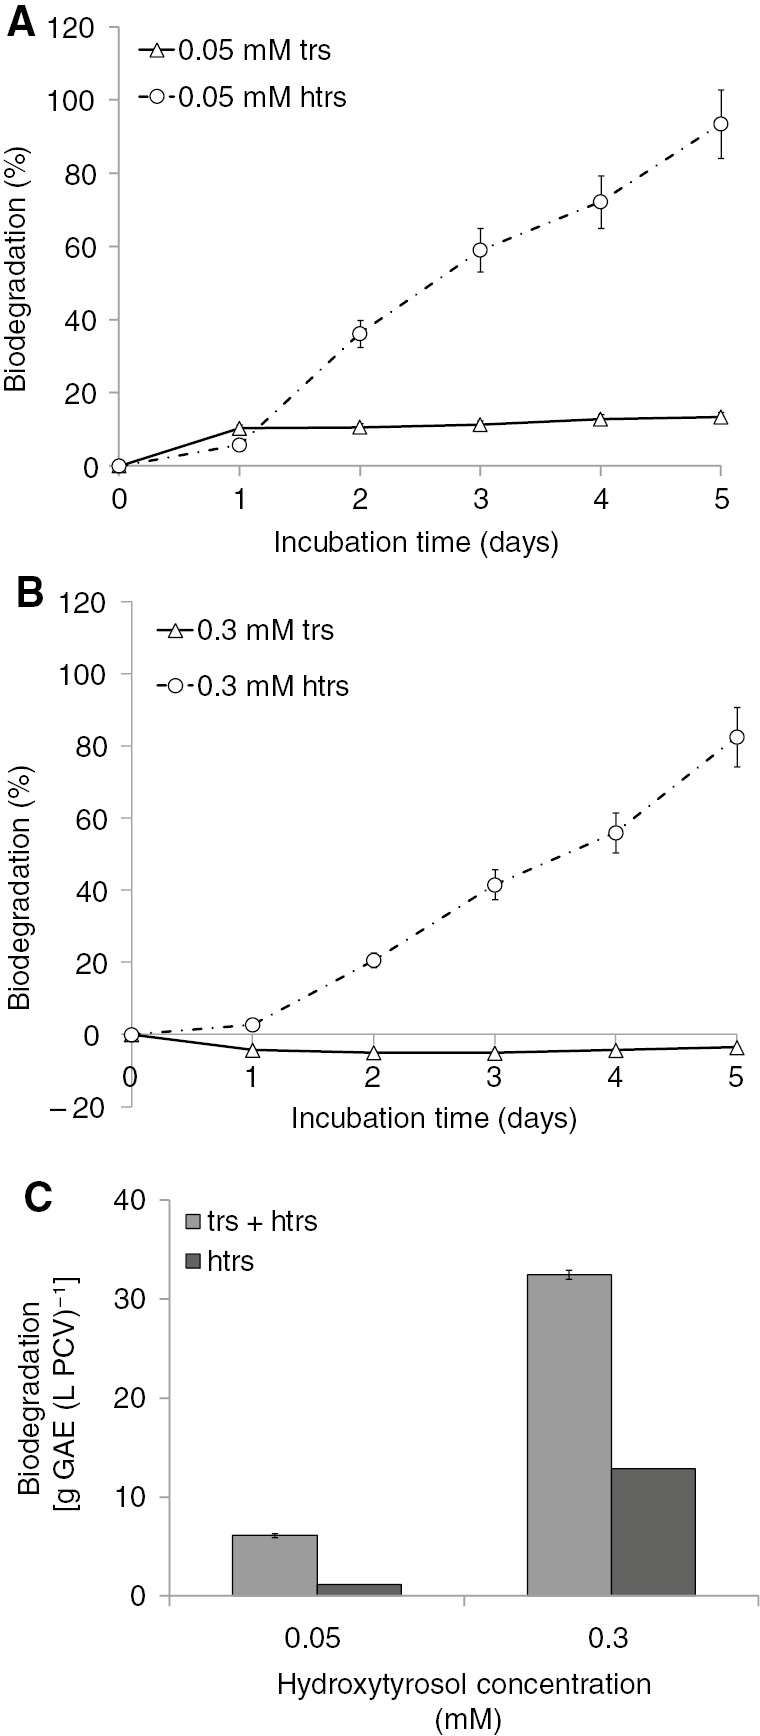
Biodegradation of simultaneously supplied trs and htrs at various concentrations in autotrophic S. obliquus cultures. (A) Kinetics of trs and htrs biodegradation (expressed as a percentage) for the lower concentration of 0.05 mM of each phenolic compound. (B) Kinetics of trs and htrs biodegradation (expressed as a percentage) for the higher concentration of 0.3 mM of each phenolic compound. (C) Comparison of htrs biodegradation among trs presence or trs absence from the culture medium in the fifth incubation day expressed as grams of GAE per PCV.
The percentage of htrs biodegradation after 5 days was approximately 93.5% at 0.05 mM and 83.5% at the higher concentration (0.3 mM). However, the amount of phenolic compounds removed per PCV (Figure 4C) showed that the higher concentration led to higher biodegradation efficiency. Again, the microalgae biodegraded primarily the most energetically demanding compound (htrs) and the higher biodegradation yield was linked to higher concentration (Figure 4A and B). Moreover, the yield of htrs biodegradation was higher in the simultaneous presence of trs and htrs (phenolic mixture) than in the unique presence of the compound (Figure 4C). This fact could be attributed to the higher difficulty that was established in the culture when both compounds were present simultaneously. As a result, the microalgae diverted more energy into detoxifying their environment, starting with the most energetically demanding phenolic compound (htrs). Trs was the compound that biodegraded to a lesser extent in the presence of htrs. In higher concentrations of the phenolic compound mixtures, trs increased instead of decreasing. This could be explained on the basis of the observation that after the bond fission of one hydroxyl group, htrs was converted to trs, which was further accumulated, and this continued until all htrs was depleted from the culture medium. After that time point, trs biodegradation increased because trs was the only substrate left. This finding is in agreement with the previously reported bioenergetic biodegradation strategy of green algae [11]. The most “annoying” phenolic compound, that is, the most energetically demanding one, takes priority for algal biodegradation. The exogenously supplied carbon source, the concentration, and the toxicity of the phenolic compounds are parameters that can be modified, changing the algal cultivation conditions as well as its biodegradation.
4 Discussion
The bioenergetic strategy of the microalgae S. obliquus for the biodegradation of trs and htrs is presented in a simplified model (Figure 5). Energy reserves are the switch for the selection of an appropriate biodegradation pathway. In mixotrophic conditions (Figure 5A, left side) there exist sufficient energy reserves. The strategy of microalgae is to invest energy into growth instead of biodegradation. As a result, more cells have to face a smaller quantity of the toxic compound. On the other hand, in autotrophic conditions (Figure 5A, right side), microalgae select an absolutely different strategy. This can be concluded from the fact that energy reserves in autotrophic conditions were noticeably lower than those in mixotrophic conditions. As a result, microalgae direct their energy to biodegradation and maintain their growth at survival levels. In higher toxicity levels [two phenolic compounds (trs and htrs) in autotrophic conditions; Figure 5B], microalgae direct their energy to biodegrading the more energetically demanding phenolic compound, htrs. The concentration of trs increases beyond that originally added, because it seems that trs is also an intermediate product derived from the biodegradation of htrs (following fission of the hydroxyl substitute). When the htrs concentration approaches a critical level, then the trs biodegradation starts.
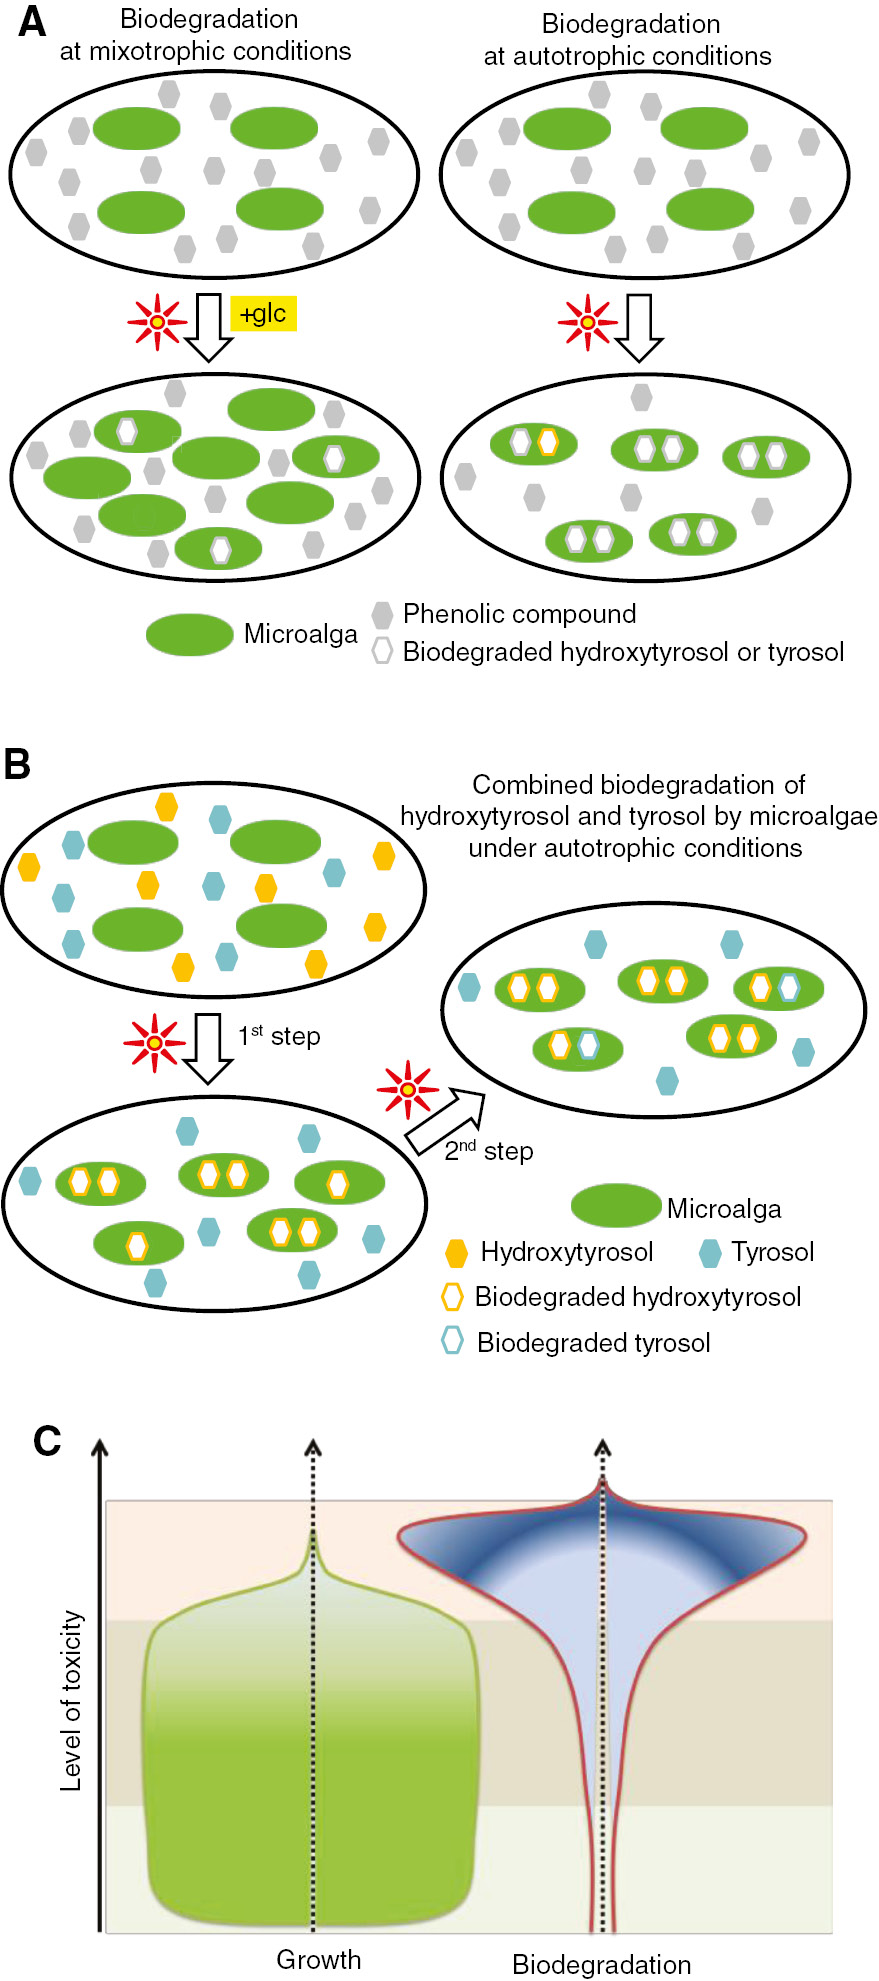
Simplified biodegradation models of microalgae. (A) Bioenergetic strategy of microalgae for the biodegradation of phenolic compounds under mixotrophic and autotrophic conditions. (B) Combined biodegradation of htrs and trs under autotrophic conditions. (C) Cellular energy management among biodegradation and growth under increasing toxicity levels. The three parallel zones (light green, gray, and pink) indicate different management of energy in relation to the concentration of phenolic compound (e.g. trs). The first zone (low concentrations of xenobiotics) represents the full development of the culture and very low biodegradation. In the third zone (high concentrations of xenobiotics), there is increased stress and all the energy reserves are invested into biodegradation, essentially stopping the growth. In the middle zone (relatively high concentrations of xenobiotics), high biodegradation can be observed at the expense of growth, unless a win-win situation for growth and biodegradation (such as in the present contribution) is possible.
The above-mentioned results lead to the conviction that microalgae maintain an energy balance. Low toxicity levels lead to higher growth and lower biodegradation, whereas higher toxicity levels lead to lower growth and higher biodegradation, unless a win-win situation for growth and biodegradation (such as in the present contribution) is possible. This is the case when the biodegradation product is again invested into cellular metabolism and cellular energy production (Figure 5C). This fact permits the manipulation of the biodegradation of toxic compounds changing the energy reserves of the microalga. It is important to determine the critical energy level that permits algae to survive with a functional metabolism while, at the same time, it maintains an appropriate activation energy to start bond fission and as a result biodegradation.
The selection of the appropriate conditions (compatible to the bioenergetic strategies of microalgae) seems to be the switch for an effective biodegradation of several toxic compounds, paving the way for future biotechnological applications for solving complicated pollution problems such as those produced by OMW.
5 Conclusions
The use of the microalga S. obliquus for the biodegradation of trs and htrs has shown several advantages:
Trs and htrs can be biodegraded by microalgae.
Growth kinetics and a series of fluorescence induction measurements showed that microalgae are tolerant to these phenolic compounds.
Changes in the cellular energy reserves and the concentration of the phenolic compounds adjust the “toxicity” of these compounds to the microalgae and therefore are the main parameters that affect biodegradation.
In agreement with previous findings, the autotrophic growth conditions of microalgae and high concentrations of trs or htrs induce higher biodegradation than mixotrophic conditions and lower phenolic concentrations, respectively. In case microalgae have to face trs and htrs simultaneously, the biodegradation starts from the more energetically demanding compound, htrs.
Based on previous results, it can be concluded that microalgae have a “rational” management scheme of cellular energy balance. Lower toxicity levels lead to higher growth and lower biodegradation, whereas higher toxicity levels lead to lower growth and higher biodegradation. A win-win situation for growth and biodegradation (such as in the present contribution) is possible when the biodegradation product of the toxic compound is invested again to cellular metabolism and cellular energy production.
The selection of the appropriate conditions (compatible to the bioenergetic strategies of microalgae) seems to be the switch for a successful biodegradation of a series of toxic compounds, paving the way for future biotechnological applications for solving complicated pollution problems such as the detoxification of OMW.
Acknowledgments
This project was funded through AgroETAK, MIS 453350 to AP (no. 3317/95) administered by the Hellenic Agricultural Organization – DEMETER under the “Research, Technological Development & Innovation Projects” – in the framework of the Operational Program “Human Resources Development”. This is in turn co-financed by the European Union Social Fund and by Greece through the National Strategic Reference Framework (ESPA, Research Funding Program 2007–2013).
References
1. Schafer TE, Lapp CA, Hanes CM, Lewis JB, Wataha JC, Schuster GS. Estrogenicity of bisphenol A and bisphenol A dimethacrylate in vitro. J Biomed Mater Res 1999;45:192–7.10.1002/(SICI)1097-4636(19990605)45:3<192::AID-JBM5>3.0.CO;2-ASearch in Google Scholar
2. Al-Khalid T, El-Naas MH. Aerobic biodegradation of phenols: a comprehensive review. Crit Rev Environ Sci Technol 2012;42:1631–90.10.1080/10643389.2011.569872Search in Google Scholar
3. Diaz E. Bacterial degradation of aromatic pollutants: a paradigm of metabolic versatility. Int Microbiol 2004;7:173–80.Search in Google Scholar
4. Janssen DB, Dinkla IJ, Poelarends GJ, Terpstra P. Bacterial degradation of xenobiotic compounds. Evolution and distribution of novel enzyme activities. Environ Microbiol 2005;7:1868–82.10.1111/j.1462-2920.2005.00966.xSearch in Google Scholar
5. Kobayashi H, Rittmann BE. Microbial removal of hazardous organic compounds. Environ Sci Technol 1982;16:170–83.10.1021/es00097a002Search in Google Scholar
6. Gusse AC, Miller PD, Volk TJ. White-rot fungi demonstrate first biodegradation of phenolic resin. Environ Sci Technol 2006;40:4196–9.10.1021/es060408hSearch in Google Scholar
7. Santos VL, Linardi VR. Biodegradation of phenol by a filamentous fungi isolated from industrial effluents – identification and degradation potential. Proc Biochem 2004;39:1001–6.10.1016/S0032-9592(03)00201-2Search in Google Scholar
8. Papazi A, Assimakopoulos K, Kotzabasis K. Bioenergetic strategy for the biodegradation of p-cresol by the unicellular green alga Scenedesmus obliquus. PLoS One 2012;7:e51852.10.1371/journal.pone.0051852Search in Google Scholar
9. Papazi A, Kotzabasis K. Bioenergetic strategy of microalgae for the biodegradation of phenolic compounds: exogenously supplied energy and carbon sources adjust the level of biodegradation. J Biotechnol 2007;129:706–16.10.1016/j.jbiotec.2007.02.021Search in Google Scholar
10. Papazi A, Kotzabasis K. Inductive and resonance effects of substituents adjust the microalgal biodegradation of toxical phenolic compounds. J Biotechnol 2008;135:366–73.10.1016/j.jbiotec.2008.05.009Search in Google Scholar
11. Papazi A, Kotzabasis K. “Rational” management of dichlorophenols biodegradation by the microalga Scenedesmus obliquus. PLoS One 2013;8:e61682.10.1371/journal.pone.0061682Search in Google Scholar
12. Petroutsos D, Katapodis P, Christakopoulos P, Kekos D. Removal of p-chlorophenol by the marine microalga Tetraselmis marina. J Appl Phycol 2007;19:485–90.10.1007/s10811-007-9160-0Search in Google Scholar
13. Petroutsos D, Katapodis P, Samiotaki M, Panayotou G, Kekos D. Detoxification of 2,4-dichlorophenol by the marine microalga Tetraselmis marina. Phytochemistry 2008;69:707–14.10.1016/j.phytochem.2007.09.002Search in Google Scholar
14. Semple KT, Cain RB. Biodegradation of phenols by the alga Ochromonas danica. Appl Environ Microbiol 1996;62:1265–73.10.1128/aem.62.4.1265-1273.1996Search in Google Scholar
15. Tikoo V, Scragg AH, Shales SW. Degradation of pentachlorophenol by microalgae. J Chem Tech Biotechnol 1997;68:425–31.10.1002/(SICI)1097-4660(199704)68:4<425::AID-JCTB649>3.0.CO;2-OSearch in Google Scholar
16. Margesin R, Fonteyne PA, Redl B. Low-temperature biodegradation of high amounts of phenol by Rhodococcus spp. and Basidiomycetous yeasts. Res Microbiol 2005;156:68–75.10.1016/j.resmic.2004.08.002Search in Google Scholar
17. Graham N, Jiang CC, Li XZ, Jiang JQ, Ma J. The influence of pH on the degradation of phenol and chlorophenols by potassium ferrate. Chemosphere 2004;56:949–56.10.1016/j.chemosphere.2004.04.060Search in Google Scholar
18. Meloa JS, Kholib S, Patwardhanb AW, D’Souza SF. Effect of oxygen transfer limitations in phenol biodegradation. Proc Biochem 2005;40:625–8.10.1016/j.procbio.2004.01.049Search in Google Scholar
19. Jiang L, Ruan Q, Li R, Li T. Biodegradation of phenol by using free and immobilized cells of Acinetobacter sp. BS8Y. J Bas Microbiol 2012;53:224–30.10.1002/jobm.201100460Search in Google Scholar
20. Chowdhury P, Moreira J, Gomaa H, Ray AK. Visible-solar-light-driven photocatalytic degradation of phenol with dye-sensitized TiO2: parametric and kinetic study. Ind Eng Chem Res 2012;51:4523–32.10.1021/ie2025213Search in Google Scholar
21. Gaffron H. Der auffalende Unterschied in der Physiologie nahe verwandter Algenstaemme nebst Bemerkungen über die Lichtatmung. Biol Zentralbl 1939;43:402–10.Search in Google Scholar
22. Bishop NL, Senger H. Preparation and photosynthetic properties of synchronous cultures of Scenedesmus. In: San Pietro A, editor. Methods in enzymology, New York: Academic Press, Vol. 23, 1971:130–43.Search in Google Scholar
23. Kotzabasis K, Schuring MP, Senger H. Occurence of protochlorophyll and its phototransformation to chlorophyll in mutant C-2A′ of Scenedesmus obliquus. Physiol Plant 1989;75:221–6.10.1111/j.1399-3054.1989.tb06172.xSearch in Google Scholar
24. Strasser BJ, Strasser RJ. Measuring fast fluorescence transients to address environmental questions: the JIP test. In: Mathis P, editor. Photosynthesis: from light to biosphere, Dordrecht: Kluwer Academic Press, Vol. V, 1995:977–80.10.1007/978-94-009-0173-5_1142Search in Google Scholar
25. Singleton V, Rossi J. Colorimetry of total phenolics with phosphomolybdic-phosphotungstic acid reagents. Am J Enol Viticult 1965;16:144–53.10.5344/ajev.1965.16.3.144Search in Google Scholar
26. Leouifoudi I, Zyad A, Amechrouq A, Oukerrou MA, Mouse HA, Mbarki M. Identification and characterisation of phenolic compounds extracted from Moroccan olive mill wastewater. Food Sci Technol 2014;34:249–57.10.1590/fst.2014.0051Search in Google Scholar
27. Navakoudis E, Lütz C, Langebartels C, Lütz-Meindl U, Kotzabasis K. Ozone impact on the photosynthetic apparatus and the protective role of polyamines. Biochim Biophys Acta 2003;1621:160–9.10.1016/S0304-4165(03)00056-4Search in Google Scholar
28. Lütz C, Navakoudis E, Seidlitz HK, Kotzabasis K. Simulated solar irradiation with enhanced UV-B adjust plastid- and thylakoid-associated polyamine changes for UV-B protection. Biochim Biophys Acta 2005;1710:24–33.10.1016/j.bbabio.2005.09.001Search in Google Scholar PubMed
29. Sfichi L, Ioannidis N, Kotzabasis K. Thylakoid-associated polyamines adjust the UV-B sensitivity of the photosynthetic apparatus by means of light-harvesting complex II changes. Photochem Photobiol 2004;80:499–506.10.1562/2004-01-RA-130.1Search in Google Scholar
30. Demetriou G, Neonaki C, Navakoudis E, Kotzabasis K. Salt stress impact on the molecular structure and function of the photosynthetic apparatus – the protective role of polyamines. Biochim Biophys Acta 2007;1767:272–80.10.1016/j.bbabio.2007.02.020Search in Google Scholar PubMed
Supplemental Material:
The online version of this article (DOI: https://doi.org/10.1515/znc-2016-0214) offers supplementary material, available to authorized users.
©2017 Walter de Gruyter GmbH, Berlin/Boston
Articles in the same Issue
- Frontmatter
- Aspernolides L and M, new butyrolactones from the endophytic fungus Aspergillus versicolor
- Synthesis, in-vitro cytotoxicity of 1H-benzo[f]chromene derivatives and structure–activity relationships of the 1-aryl group and 9-position
- Biodegradation of micropollutant naproxen with a selected fungal strain and identification of metabolites
- A comparative proteomic analysis for adventitious root formation in lotus root (Nelumbo nucifera Gaertn)
- Curviflorside and curviflorin, new naphthalene glycoside and flavanol from Plicosepalus curviflorus
- Termiglaucescin, a new polyhydroxy triterpene glucoside from Terminalia glaucescens with antioxidant and anti-inflammatory potential
- Influence of structure of lactones with the methylcyclohexene and dimethylcyclohexene ring on their biotransformation and antimicrobial activity
- Effects of Hypericum perforatum extract on oxaliplatin-induced neurotoxicity: in vitro evaluations
- Bioenergetic strategy of microalgae for the biodegradation of tyrosol and hydroxytyrosol