Purpureone, an antileishmanial ergochrome from the endophytic fungus Purpureocillium lilacinum
-
Bruno Ndjakou Lenta
 ,
Jules Ngatchou
,
Jules Ngatchou

Abstract
The ethyl acetate extracts prepared from the mycelia of three endophytic fungi Purpureocillium lilacinum, Aspergillus sp., and Fusarium sp., isolated from the roots of Rauvolfia macrophylla (Apocynaceae) were screened for their antiprotozoal activity in vitro against Plasmodium falciparum (NF54), Leishmania donovani, Trypanosoma brucei rhodesiense, and Trypanosoma cruzi. Amongst these extracts, the one from P. lilacinum showed potent antileishmanial activity against L. donovani (IC50 value of 0.174 μg mL−1) with good selectivity (SI=94.9) toward the L6 cell line, whereas the other extracts were inactive and not selective. The fractionation and purification of the active extract from P. lilacinum by column chromatography over silica gel yielded a new ergochromone derivative (1), together with six known compounds: (22E,24R)-stigmasta-5,7,22-trien-3-β-ol (2), (22E,24R)-stigmasta-4,6,8(14),22-tetraen-3-one (3), emodin (4), chrysophanol (5), aloe-emodin (6), and palmitic acid, whose structures were elucidated spectroscopically. Compound 1 was tested in vitro for its antiparasitic activities against the above listed parasites and for its antimicrobial activity against Staphylococcus aureus, Bacillus cereus, Listeria monocytogenes, Escherichia coli, Providencia stuartii, Klebsiella pneumoniae, and Pseudomonas aeruginosa. The compound displayed potent antileishmanial activity against L. donovani with an IC50 value of 0.63 μg mL−1 (0.87 μm) with good selectivity (SI=49.5) toward the L6 cell line. It also exhibited good antibacterial activity against three of the tested microbial strains B. cereus, E. coli ATCC879, and P. stuartii ATCC29916 with minimum inhibitory concentrations below 62.6 μg mL−1. Compound 1 is thus a promising active compound that could be investigated for antileishmanial and antimicrobial drug development.
1 Introduction
Endophytic fungi are organisms ubiquitously found in plants and residing intercellularly or intracellularly, at least for a portion of their lives without causing apparent symptoms of infection. They play important physiological and ecological roles in their host life. Research has shown that the symbiosis of many fungi with host plants produce bioactive metabolites in chemical defenses against pathogenic organisms. In the past two decades, many valuable bioactive compounds including terpenoids, steroids, xanthones, quinones, phenols, isocoumarines, benzopyranones, tetralones, cytochaslasins, and enniatins with antimicrobial, insecticidal, cytotoxic, antiparasitic, and anticancer activities have been successfully discovered from the endophytic fungi and may have potential for use in modern medicine and plant protection [1]. Considering that 6 of 20 of the most commonly prescribed medications are of fungal origin [2], [3] and that only 5% of the endophytic fungi have been described [4], [5] they may play a key role in the search for drugs against parasitic diseases such as malaria, leishmaniasis, and trypanosomiasis where conventional therapy faces problems due to resistance of the parasites to existing drugs. In the case of leishmaniasis and trypanosomiasis, drugs are outdated, complicated to administer, and can cause severe adverse reactions [6], [7], [8]. Consequently, newer and efficient drugs are needed. One of the rational approaches in the search for new drugs is the exploration of plants endophytes. They offer an enormous potential for new products if selected plants are from unique environmental settings such as Rauvolfia macrophylla (Apocynaceae), a Cameroonian medicinal plant used in traditional medicine to treat malaria and other parasitic diseases [9]. Previous investigation of this plant reported the isolation of several alkaloids [10]. However, to the best of our knowledge, no report has been published on its endophytic fungi. In a continuing search for antiparasitic compounds from Cameroonian medicinal plants and their endophytes, we have investigated the ethyl acetate extract of the mycelium of Purpureocillium lilacinum, which was found to possess potent antileishmanial activity against Leishmania donovani with IC50 value of 0.174 μg mL−1. We report here the isolation and the structure elucidation of a new ergochromone derivative (1), isolated from an active fraction of the extract together with the evaluation of its antiparasitic and antimicrobial activities.
2 Results and discussion
Three endophytic fungi were isolated from R. macrophylla (Apocynaceae). The taxonomic classification of these endophytes and their internal transcribed spacer (ITS) sequences were amplified by applying polymerase chain reaction (PCR), sequenced and analyzed in a BLAST-based approach. All obtained sequences showed hits against the databases with high identities (99%–100%) and sequence coverage (99%–100%). The strain T26 was classified on species level as P. lilacinum, whereas T23 belonged to the genus Fusarium and T18 was classified as Aspergillus strain (Table 1). The ITS sequences in these two genera were 100% equal on the DNA level for quite many species. Therefore a classification on species level was here not possible.
BLAST-based taxonomic assignments of the strains T26, T23, and T18 based on their ITS sequences.
| Strain ID | Used primer | Sequence length | Best hit | Identities (%) | Coverage (%) |
|---|---|---|---|---|---|
| T26 | ITS1 | 439 bp | Purpureocillium lilacinum | 99 | 99 |
| ITS4 | 508 bp | Purpureocillium lilacinum | 99 | 100 | |
| T23 | ITS1 | 422 bp | Fusarium | 99 | 100 |
| ITS4 | 439 bp | Fusarium | 100 | 100 | |
| T18 | ITS1 | 455 bp | Aspergillus | 99 | 100 |
| ITS4 | 418 bp | Aspergillus | 99 | 100 |
The ethyl acetate extracts prepared from the mycelia of these three endophytic fungi, P. lilacinum, Aspergillus sp., and Fusarium sp., isolated from the roots of R. macrophylla (Apocynaceae) were screened for their antiprotozoal activity against Plasmodium falciparum (NF54), L. donovani, Trypanosoma brucei rhodesiense, and Trypanosoma cruzi. The extract from the mycelium of P. lilacinum showed potent antileishmanial activity in vitro against L. donovani (IC50 value of 0.174 μg mL−1) with good selectivity (SI=94.9) toward the L6 cell line. It was subjected to successive column chromatography over silica gel, which yielded a new ergochromone derivative (1), together with six known compounds: (22E,24R)-stigmasta-5,7,22-trien-3-β-ol (2) [11] (22E,24R)-stigmasta-4,6,8(14),22-tetraen-3-one (3) [11], emodin (4) [12] chrysophanol (5) [12]), aloe-emodin (6) [12] (Fig. 1), and palmitic acid [13].
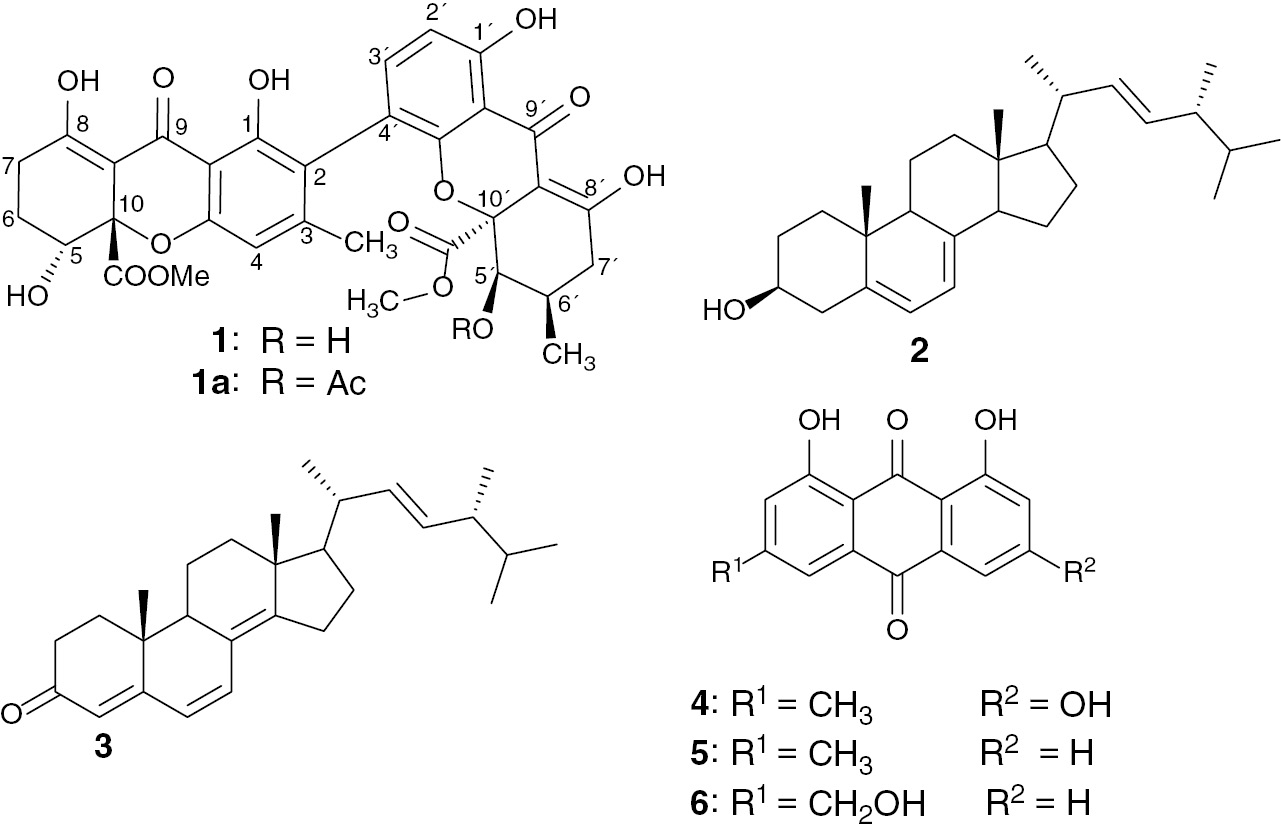
Structures of compounds 1–6 and neosartorin (1a).
Compound 1 was obtained as a yellow amorphous powder. It gave a positive ferric chloride test, indicating its phenolic nature. The molecular formula C32H30O14, corresponding to 18 double-bond equivalents, was deduced from the electrospray ionization (ESI)-high resolution mass spectrometry (HRMS) which showed a pseudo-molecular ion peak [M+Na]+ at m/z=661.1528 (calcd. 661.15333 for C32H30O14Na, [M+Na]+). The IR spectrum of 1 indicated the presence of characteristic functional groups at 3337 (OH), 2948 (C–H), 1720 and 1613 (C=O), 1570 (C=C), 1230 and 1073 (C–O–C) cm−1.
The broad band-decoupled 13C NMR spectrum of compound 1 (Table 2) displayed signals corresponding to 32 carbon atoms, which were assigned using distortionless enhancement by polarization transfer and heteronuclear single-quantum coherence spectra to three CH2 groups (δC=23.1, 24.4, and 32.6 ppm); five CH groups, among them two aliphatic oxymethines (δC=67.0 and 71.3 ppm) and three aromatic CH (δC=107.7, 109.0, 140.1 ppm); two methyl groups including one aromatic CH3 (δC=21.2 ppm) and another aliphatic (δC=17.5 ppm); two methoxy groups (δC=53.4 and 53.5 ppm); and 20 quaternary carbons of which two C atoms of ester groups (δC=171.4 and 171.5 ppm) and two carbonyl of xanthones hydrogen bounded to two adjacent hydroxyl groups (δC=187.0 and 187.5 ppm). In the 1H NMR spectrum (Table 2), signals of four chelated hydroxyl groups at δH=11.63, 11.71, 13.98, 13.99 ppm, and two broad singlets at δH=2.79 and 2.67 ppm exchangeable by D2O, were observed. The 1H NMR spectrum also exhibited resonances of two ortho-coupled aromatic protons at δH=7.25 ppm (1H, d, J=8.4 Hz) and 6.60 ppm (1H, d, J=8.4 Hz); one aromatic singlet at δH=6.50 ppm (1H, s); two oxymethines at δH=4.13 ppm (brd, J=1.7 Hz) and 4.34 ppm (dd, J=4.3 Hz, J=2.0 Hz); two methoxy groups at δH=3.74 ppm (3H, s) and 3.75 ppm (3H, s); two signals of methyl groups at δH=2.13 ppm (3H, s) and 1.19 ppm (3H, d, J=6.7 Hz); and other aliphatic H atoms between δH=1.90–2.95 ppm. The presence of two conjugated carbonyl groups at δC=187.0 and 187.5 ppm hydrogen bonded to two adjacent hydroxyl groups at δH=11.71, 13.98, 11.63, and 13.99 ppm (characteristic shifts of a keto-enol structure), as well as the analysis of the long-range correlations of the heteronuclear multiple-bond correlation (HMBC) experiments, suggested the presence of two tetrahydroxanthone rings [14] as shown in Fig. 2. Analysis of these data revealed some similarities with that of neosartorin (1a) [15]. The difference between these two compounds was indeed the presence of the signal of two nonchelated hydroxyl groups (δH=2.67 and 2.79 ppm) in compound 1and the lack of the signals of the acetyl group of compound 1a. Therefore, the locations of the hydroxyl groups were unambiguously deduced from the correlations observed in the HMBC spectrum between the hydroxyl protons at δH=2.67 and 2.79 ppm and the carbons C-5′ (δC=71.3 ppm) and C-5 (δC=67.0 ppm), respectively. The relative stereochemistry of compound 1 was determined on the basis of 1H–1H correlation spectroscopy (COSY) and nuclear Overhauser effect spectroscopy (NOESY) correlations. The correlations observed in the NOESY spectrum between H-5 and the two protons of the C-6 methylene group and the coupling constant of 4.25 Hz and 2.0 Hz are consistent with the equatorial orientation of H-5. The pseudoaxial orientation of the methylene hydrogen H-7′ (δH=2.55 ppm, dd, J=12.1, 19.0 Hz) was suggested by the vicinal coupling constant J6′,7′=12.1 Hz, and consequently suggested the pseudoequatorial orientation of another diastereotopic hydrogen H-7′ (δH=2.42 ppm, m). The small coupling constant of H-5′ (br d, J=1.7 Hz) and correlation observed in the NOESY spectrum between H-5′ and H-6′ suggest the equatorial orientation of H-5′. Methoxycarbonyl moieties at C-10 and C-10′ are in a cis position with respect to protons H-5 and H-5′, respectively, as shown by the presence observation of nuclear Overhauser effect crosspeaks between the CH3 protons of these groups and protons H-5 and H-5′. These data clearly indicated that compound 1is a new ergochrome from P. lilacinum with the structure as shown.
1H (500 MHz) and 13C (125 MHz) NMR spectral data of compound 1 in DMSO.
| Position | δC | δH (multiplicity, J in Hz) |
|---|---|---|
| 1 | 159.5 | – |
| 2 | 118.5 | – |
| 3 | 149.0 | – |
| 4 | 107.7 | 6.50 (s) |
| 4a | 157.3 | – |
| 5 | 67.0 | 4.34 (dd, J=4.25 Hz, 2.0 Hz) |
| 6 | 23.1 | 1.96 (m), 2.30–2.40 (m) |
| 7 | 24.4 | 2.85 (m), 2.14–2.18 (m) |
| 8 | 178.9 | – |
| 8a | 98.9 | – |
| 9 | 187.0 | – |
| 9a | 104.0 | – |
| 10 | 84.4 | – |
| 11 | 171.5 | – |
| 12 | 53.5 | 3.74 (s) |
| 13 | 21.2 | 2.13 (s) |
| 1′ | 159.7 | – |
| 2′ | 109.0 | 6.60 (d, J=8.4 Hz) |
| 3′ | 140.1 | 7.25 (d, J=8.4 Hz) |
| 4′ | 117.6 | – |
| 4a′ | 156.8 | – |
| 5′ | 71.3 | 4.13 (brd, J=1,7 Hz ) |
| 6′ | 28.5 | 2.11–2.15 (m) |
| 7′ | 32.6 | 2.42 (m), 2.55 (dd, J=19.0, 12.1 Hz) |
| 8′ | 178.8 | – |
| 8a′ | 100.0 | – |
| 9′ | 187.5 | – |
| 9a′ | 107.0 | – |
| 10′ | 83.9 | – |
| 11′ | 171.4 | – |
| 12′ | 53.4 | 3.75 (s) |
| 13′ | 17.5 | 1.19 (d, J=6.7 Hz) |
| 1-OH | 11.63 | |
| 5-OH | 2.67 | |
| 8-OH | 13.99 | |
| 1′-OH | 11.71 | |
| 5′-OH | 2.79 | |
| 8′-OH | 13.98 |
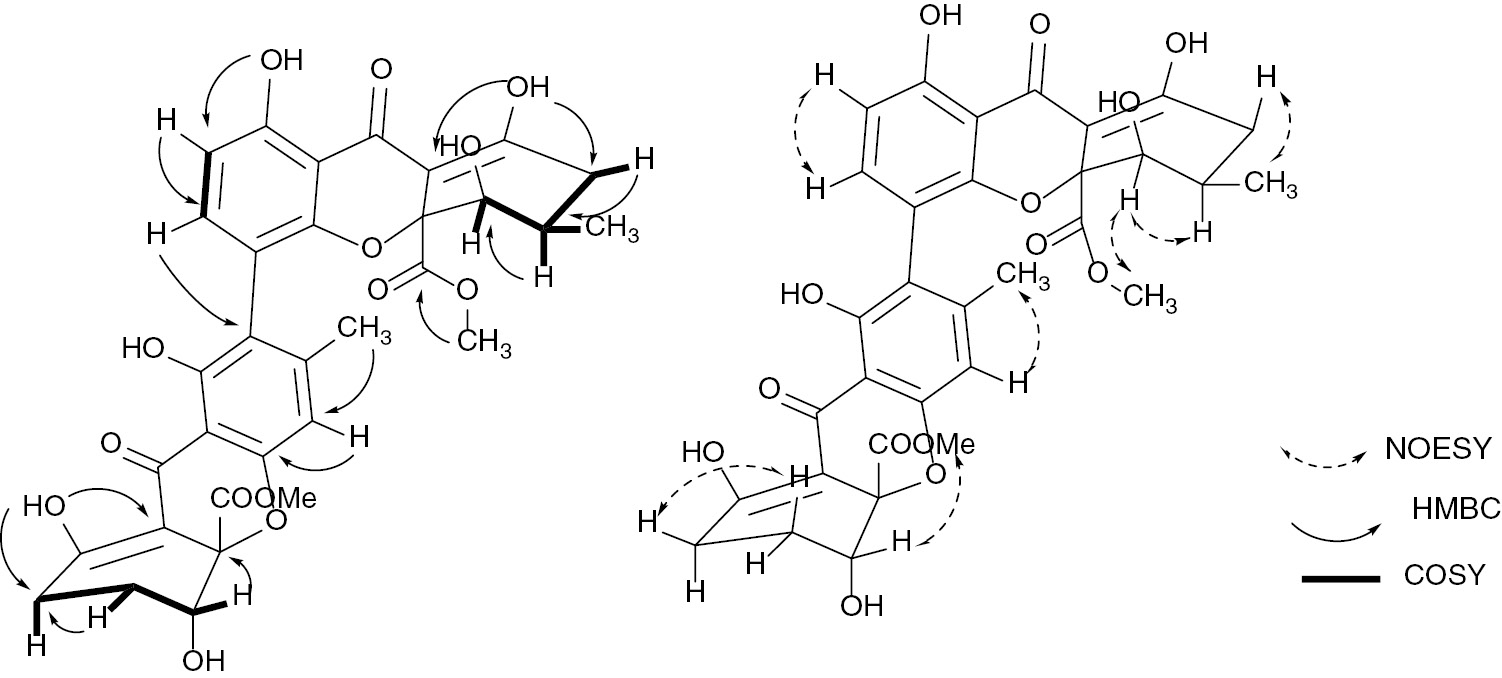
Selected HMBC, and COSY, and NOESY correlations observed in compound 1.
The antiprotozoal activities of the ethyl acetate extracts from the mycelia of P. lilacinum, Aspergillus sp., and Fusarium sp., and compound 1 were evaluated in vitro against four parasitic protozoa: P. falciparum, L. donovani, T. brucei rhodesiense, and T. cruzi. The cytotoxic potential of these samples on mammalian L6 cells was also assessed and the selectivity index (SI: IC50 L6 cells/IC50 parasite) was calculated (Table 3).
Antiprotozoal and cytotoxic activities in vitro of extracts (Ext.) and compound 1.
| Sample | IC50a (μg mL−1) | Selectivity index | |||||||
|---|---|---|---|---|---|---|---|---|---|
| P. falciparum NF54 | L. donovani | T. b. rhodesiense | T. cruzi | L6 cells | P. falciparum NF54 | L. donovani | T. b. rhodesiense | T. cruzi | |
| Ext. P. lilacinum | 5.53 | 0.174 | 15.93 | 13.26 | 16.51 | 2.98 | 94.86 | 1.03 | 1.24 |
| Ext. Fusarium sp. | 3.96 | 13.87 | 26.32 | 13.68 | >100 | >25.25 | >7.27 | >3.79 | >7.30 |
| Ext. Aspergillus sp. | 27.35 | 18.61 | 30.93 | 59.61 | 72.97 | 2.67 | 3.92 | 2.36 | 1.22 |
| Compound 1 | 8.07 | 0.633 | 28.8 | 14.41 | 31.36 | 3.88 | 49.54 | 1.01 | 2.18 |
| Chloroquineb | 0.002 | ||||||||
| Miltefosineb | 0.145 | ||||||||
| Melarsoprolb | 0.003 | ||||||||
| Benznidazoleb | 0.531 | ||||||||
| Podophyllotoxinb | 0.006 | ||||||||
aThe IC50 values are the means of two independent assays; the individual values vary less than a factor of 2. bReference compound.
All the tested samples exhibited growth inhibiting activity against L. donovani. In fact, the extract from the mycelium of P. lilacinum, and the new compound 1 exhibited potent antileishmanial activity with IC50 values below 0.29 μg mL−1 and good selectivity (SI>49). The activity of the extract (IC50=0.174 μg mL−1) was comparable with that of the reference miltefosine (IC50=0.145 μg mL−1) in vitro, whereas the tetrahydroxanthone 1 was almost potent as miltefosine with an SI value of 49.5. The pure compound was less selective than the crude extract where it was isolated. This might be due to the synergism of the extract constituents. The extracts from the Aspergillus sp. and the Fusarium sp. exhibited only moderate activity.
Apart from the extract of the Aspergillus strain, other tested samples were active against P. falciparum but showed poor selectivity toward L6 cell lines. The ethyl acetate extracts from Fusarium sp. and P. lilacinum were the most active ones with IC50 values of 3.96 μg mL−1 and 5.53 μg mL−1, respectively.
Concerning the antitrypanosomal assays, all samples exhibited moderate growth inhibitory activity against both T. brucei rhodesiense and T. cruzi albeit with limited selectivity (SI<10). A previous study indicated that the ethanol extract of P. lilacinum UFMGCB 1510 from the soil of Antarctic Peninsula displayed high trypanocidal against T. cruzi and moderate activity against L. amazonensis [16].
The extract, sub-fractions T2 and T3 from P. lilacinum, and compound 1 were also evaluated for their antibacterial activity with respect to the measurement of the zone of inhibition and minimum inhibitory concentration (MIC) against Staphylococcus aureus, Bacillus cereus, Listeria monocytogenes, Escherichia coli, Providencia stuartii, Klebsiella pneumoniae, and Pseudomonas aeruginosa in liquid medium (Tables 4 and 5). All the tested samples exhibited antibacterial activity at least against one strain of the tested microorganisms with compound 1showing the best potency (62.5 ≤ MIC ≤ 150 μg mL−1). The ratio MIC/minimum bactericidal concentration (MBC) below 2 indicated their bactericidal properties. Although these activities are lower than those of the reference molecule gentamicin on the same strains, these results are significant because the tested strains are resistant to antibiotics.
Antimicrobial activity of extract of P. lilacinum, its sub-fractions T2 and T3 and compound 1.
| Microorganisms | Zone of inhibition (ZOI) (mm) | ||||
|---|---|---|---|---|---|
| Extract | Fraction T2 | Fraction T3 | Compound 1 | Gentamicina | |
| S. aureus | – | – | – | – | 9.7 ± 1.5 |
| B. cereus | 12.6 ± 1.1 | 10.6 ± 0.5 | 13.6 ± 0.5 | 10.6 ± 1.1 | 22.3 ± 2.1 |
| K. pneumonia | – | – | – | – | 17.7 ±2.5 |
| L. monocytogenes | 17.6 ± 1.1 | 13.3 ± 1.6 | 14.0 ± 1.0 | 12.3 ± 0.5 | 28.3 ± 3.5 |
| E. coli | – | – | – | – | – |
| E. coli ATCC 8739 | 14.0 ± 1.0 | 10.7 ± 1.6 | 11.7 ± 1.5 | 13.0 ± 1.0 | 19.6 ± 2.1 |
| K. pneumoniae ATCC 1296 | 14.7 ± 1.5 | 8.0 ± 1.0 | 10.7 ± 1.1 | 8.7 ± 1.2 | 25.7 ± 2.5 |
| P. stuartii ATCC | 14.6 ± 1.5 | 10.3 ± 1.5 | 14.3 ± 1.1 | 12.3 ± 0.6 | 27.3 ± 1.5 |
| P. aeruginosa ATCC PA01 | 12.3 ± 0.6 | 11.7 ± 0.6 | 12.6 ± 0.6 | 10.0 ± 1.0 | 22.3 ± 2.1 |
–: Inactive. aReference compound.
Antimicrobial activity of extract of P. lilacinum, its sub-fractions T1–T3 and compound 1.
| Bacterial strains | Inh. par.a (μg mL−1) | Extract | Fraction F2 | Fraction F3 | Compound 1 | Gentamicin |
|---|---|---|---|---|---|---|
| B. cereus | MIC | 500 | 500 | 500 | 125 | <7.81 |
| MBC | 500 | 500 | 500 | 125 | <7.81 | |
| MBC/MIC | 1 | 1 | 1 | 1 | 1 | |
| L. monocytogene | MIC | – | 250 | 250 | 62.5 | <7.81 |
| MBC | – | 250 | 250 | 62.5 | <7.81 | |
| MBC/MIC | – | 1 | 1 | 1 | 1 | |
| E. coli ATCC | MIC | 250 | 250 | – | 62.5 | <7.81 |
| MBC | 250 | 250 | – | 62.5 | <7.81 | |
| MBC/MIC | 1 | 1 | – | 1 | 1 | |
| K. pneumoniae ATCC | MIC | 500 | 250 | – | 250 | <7.81 |
| MBC | 500 | 250 | – | 250 | <7.81 | |
| MBC/MIC | 1 | 1 | – | 1 | 1 | |
| P. stuartii ATCC | MIC | 125 | 250 | – | 62.5 | <7.81 |
| MBC | 500 | 250 | – | 125 | <7.81 | |
| MIC/MBC | 2 | 1 | – | 2 | 1 | |
| P. aeruginosa ATCC | MIC | 125 | 62.5 | 125 | 125 | <7.81 |
| MBC | 125 | 62.5 | 125 | 125 | <7.81 | |
| MBC/MIC | 1 | 1 | 1 | 1 | 1 |
aInhibition parameters.
The results obtained from this study, both the new ergochromone and the biological activities, are of interest. So far ergochromes were detected as secondary metabolites of Claviceps Spp., Penicillium oxalicum, Aspergillus ochraceus, A. fumigatiaffinis, Neosartorya fischeri, and various lichen species [17], [18]. A few bioactive metabolites have been isolated from P. lilacinum, including paecilotoxins, pyridone alkaloid paecilomide, and acremoxanthone [19]. This is the first isolation of an ergochrome from the mycelium of P. lilacinum. In addition, the low toxicity of compound 1 against a mammalian (L6) cell line is interesting and indicated that it could be considered as lead compound to be investigated for the formulation of new antileishmanial drugs. Xanthones have been reported to possess antileishmanial and cytotoxic activity [20]. Previous studies showed that the antileishmanial activity of xanthones involves complexation of heme, inhibiting the hemozoin formation [21], [22].
The interesting antibacterial activity of compound 1 confirmed the antimicrobial potential of ergochromes, a class of secondary metabolites that have shown good activity even on clinical resistant strains of bacteria [17].
All these results highlight the bioactive potency of ergochromones and justify the interest of the investigation of endophytic fungi as potential sources of new antiparasitic agents.
3 Materials and methods
3.1 General experimental procedures
All reagents were of analytical grade. Silica gel Merck 60 (0.063–0.200 mm) was used for column chromatography. Percolated aluminum backed silica gel 60 F254 sheets were used for thin-layer chromatography. Spots were visualized under UV light (254 nm and 365 nm) or using a solution of molybdate/Ce4+ reagent followed by heating. Optical rotation was determined by using a JASCO DIP-3600 polarimeter. UV Spectra were recorded on a UV-3100 PC spectrophotometer. IR spectra were recorded on a JASCO FT/IR-410 spectrophotometer. The 1H NMR and 13C NMR spectra were recorded on a Bruker DRX spectrometer operating at 500 MHz and 125 MHz, respectively, with tetramethylsilane as an internal standard. HRMS were recorded on a Bruker Daltonics Micro ToF spectrometer.
3.2 Isolation of endophytic fungi
The endophytic fungi Aspergillus sp., Fusarium sp., and P. lilacinum were isolated from the stem bark of R. macrophylla (Apocynaceae) collected at the Mount Kalla in the Center Region of Cameroon. The stems of R. macrophylla were surface sterilized using the methods of Pimentel et al. [23], [24]. The stems were cleaned with distilled water for 10 min to remove impurities and surface debris. After air-drying, the cleaned stems were cut into small pieces and then sterilized in a sterile hood by immersion in 70° ethanol for 1 min, 2.4% sodium hypochlorite solution for 4 min, 70° ethanol for 30 s, and then washed three times with sterile distilled water for 1 min. The surface-sterilized samples were dried on sterile blotting paper, then cut into pieces (1 mm2) and aseptically placed in petri dishes containing sterile potato dextrose agar (PDA medium), supplemented with chloramphenicol (250 mg L−1) to inhibit bacterial growth. All plates were incubated at room temperature until mycelium grew out hyphal tips that were cut and transferred to PDA. All the isolated endophytic fungi were stored on PDA tubes at 4°C.
3.3 Identification of endophytic fungi
The endophytic fungi were identified by sequencing of the ITS ribosomal DNA region. Fungal cultures were grown in liquid potato dextrose broth (24 g L−1, pH 7) for 5–7 days at room temperature. After centrifugation (12 000×g, 10 min, room temperature), the mycelium pellet was shock frozen and grinded with a pestle in liquid nitrogen. The fungal DNA was isolated from this powder using the DNeasy Plant Minikit (Qiagen, Hilden, Germany). PCR mixtures to amplify the ITS regions contained 2.5 μL of 10 × PCR buffer (Promega, Fitchburg, MA, USA), 0.5 μL of dNTP mixture (10 mmol⋅L−1 each, NEB, Ipswich, MA, USA), 0.5 μL of each primer (10 μmol L−1, ITS1 (5′-TCC GTA GGT GAA CCT GCG G-3′) and ITS4 (5′-TCC TCC GCT TAT TGA TAT GC-3′; [25]), 0.5 μL of Pfu DNA polymerase (3 U μL−1, Promega), and 2 μL of isolated DNA in a total volume of 25 μL. PCRs were carried out with an initial denaturation at 95°C, followed by 35 cycles of denaturation at 95°C for 45 s, annealing at 52°C for 30 s and elongation at 72°C for 150 s. Final elongation proceeded at 72°C for 5 min. The resulting PCR products were purified using the QIAquick PCR purification kit (Qiagen) and sequenced via Sanger sequencing at the Centre for Biotechnology (CeBiTec, Bielefeld, Germany). For taxonomic classification, a BLASTn approach using the databases UNITE ITS and nr was performed. Hits showed high identities (98%–100%) and sequence coverage (99%–100%).
3.4 Fermentation, extraction, and isolation of compounds
The isolated endophytic fungal strains were introduced into test tubes containing sterile distilled water, supplemented with tween 80, to dissociated spores. Each inoculum was introduced in five flasks containing each sterilized solid medium made of rice as the base (100 g rice, 100 mL distilled water, sterilized for 1 h in an autoclave). The flasks were incubated at room temperature for 3 weeks. After incubation, the cultures were extracted at room temperature with ethyl acetate (2×5 L, 24 h each). The filtrates were concentrated under vacuum at room temperature to afford 12 g, 7.5 g, and 16 g of P. lilacinum, Aspergillus sp., Fusarium sp. crude extracts, respectively. A part of P. lilacinum extract (11 g) was submitted to repeated column chromatography over silica gel (0.063–0.200 mm) and eluted with mixtures of petroleum ether-EtOAc and EtOAc-MeOH, with a gradient of increasing polarity and resulted in 93 fractions of 150 mL each that were combined on the basis of their thin-layer chromatography profile to yield three fractions labeled T1–T3. Fractions T1 (3 g) was a complex mixture of oil and was not further study. Fractions T2 (2,1 g) was subjected to chromatography over silica gel (0.063–0.200 mm) eluting with gradient mixtures of petroleum ether–AcOEt (1:0 to 4:1), and yielded palmitic acid (6.1 mg), (22E,24R)-stigmasta-5,7,22-trien-3-β-ol (2, 11 mg), and (22E,24R)-stigmasta-4,6,8(14),22-tetraen-3-one (3, 8 mg). Column chromatography over silica gel (0.063–0.200 mm) of fraction T3 (4.1 g), eluting with gradient mixtures of petroleum ether-AcOEt (4:1 to 1:1) yielded two sub-fractions T31 and T32. Further purification of sub-fraction T31 by column chromatography over silica gel (0.063–0.200 mm) eluting with petroleum ether–ethyl acetate (1:1) mixture afforded aloe-emodin (6, 4 mg) and chrosphasol (5, 3 mg). Sub-fraction T32 was subjected to column chromatography over silica gel (0.063–0.200 mm) eluting with a gradient mixture of petroleum ether–ethyl acetate (6:4) and yielded emodin (4, 7.2 mg) and a yellow amorphous powder that was purified by column chromatography over sephadex LH20 eluting with a MeOH–CH2Cl2 (4:1) mixture and yielded purpureone (1, 180 mg).
3.5 Purpureone (1)
Yellow powder. –
3.6 Biological assays
3.6.1 Antiparasitic assay
In vitro activity against T. cruzi, T. brucei rhodesiense, L. donovani, P. falciparum, and cytotoxicity assessment using L6 cells (rat skeletal myoblasts) was determined using a 96-well plate format as previously described [26]. Data were analyzed with the graphic program Softmax Pro (Molecular Devices, Sunnyvale, CA, USA), which calculated IC50 values by linear regression from the sigmoidal dose inhibition curves.
3.6.2 Antibacterial assay
3.6.2.1 Disk diffusion method
The agar disk diffusion method was used to assess the sensitivity of 9 bacterial strains to each test sample. This susceptibility test was performed as described by the standard protocol of CLSI-M-A9 [27]. The bacterial strains comprised E. coli ATCC 8739, K. pneumoniae ATCC 11296, P. stuartii ATCC 29916, and P. aeruginosa PA01 obtained from American Type Culture Collection; clinical isolates S. aureus, K. pneumoniae, L. monocytogenes, and E. coli obtained from the Centre Pasteur du Cameroon and which cause diarrheal infections; and B. cereus reference strain obtained from the collection of the Microbiology Laboratory, Institute of Food Research, Reading, UK. The test was performed by inoculating a suspension of the overnight tested microorganism (108 cells mL−1) on the Muller Hinton Agar. Extract and compound solutions were prepared by dissolving 2 mg of each extract or compound in 0.5 mL of DMSO 2% giving a concentration of 1 mg mL−1 for each suspension. Gentamicin, used as standard antibiotic was dissolved to give the same concentration. Filter paper disks (diameter 6 mm) were impregnated with 10 μL of extract and gentamicin solution and placed on the inoculated plates. After 45 min, these plates were incubated at 37°C for 24 h and the zone of inhibition was measured in mm. All tests were performed in triplicate.
3.6.2.2 Micro-dilution method
Each extract or compound having led to the inhibition zone on bacteria growth after diffusion method was then investigated for the determination of the MIC and MBC. The micro-dilution method was used according to the standard protocol of CLSI-M11-A8 [28]. All tests were performed in nutrient broth supplemented with glucose and red phenol (BNGP). The investigated extracts were diluted to 100 μL of broth at first well of 96 wells of microplate. A serial doubling dilution of the extract was prepared over the range from 2000 to 7.81 μg mL−1. Overnight broth cultures of each strain were prepared and the final concentration in each well was adjusted to 2×10⁻⁶ cells mL−1. The concentrations of extract or compound were finally in the range from 10 to 0.04 mg mL−1. Microplates were incubated at 37°C for 24 h. The MIC was defined as the lowest concentration of the extract at which the microorganism does not demonstrate visible growth. The microbial growth was determined by a color change of phenol red from red to yellow. MBCs were determined by inoculation of 100 μL of culture medium at greater than or equal to the MICs onto agar plate and incubated for 24 h. The MBC was considered the lowest concentration of sample that allowed the survival of 0.01% of the initial inoculum [29].
3.7 Supplementary information
NMR and ESI-HRMS spectra of compound 1are given as Supplementary Information available online (http://dx.doi.org/10.1515/znb-2016-0128).
Acknowledgments
The authors wish to acknowledge the Alexander von Humboldt Foundation for providing a fellowship to B. N. Lenta at Bielefeld University. They thank M. Cal, M. Jud, and S. Keller (Swiss TPH) for parasite assay results. They also thank the analytical service of the Department of Chemistry at Bielefeld University and Dr. M. Letzel of the University of Münster for recording ESIMS, NMR, and HR-ESIMS. The bioinformatics support of the BMBF-funded project “Bielefeld-Gießen Resource Center for Microbial Bioinformatics – BiGi (Grant number 031A533)” within the German Network for Bioinformatics Infrastructure (de.NBI) is gratefully acknowledged.
References
[1] L. Zhou, J. Zhao, T. Shan, X. Cai, Y. Peng, Mini Rev. Med. Chem.2010, 10, 977.10.2174/138955710792007178Suche in Google Scholar
[2] J. B. Gloer in Applications of Fungal Ecology in the Search for New Bioactive Natural Products in The Mycota. Environmental and Microbial Relationships (Eds.: D. T. Wicklow, B. E. Soderstrom), Springer-Verlag, New York, 1997, p. 249.Suche in Google Scholar
[3] N. A. J. C. Furtado, M. T. Pupo, I. Carvalho, V. L. Campo, M. C. T. Duarte, J. K. Bastos, J. Braz. Chem. Soc.2005, 16, 1448.10.1590/S0103-50532005000800026Suche in Google Scholar
[4] D. L. Hawksworth, Mycol. Res.1991, 95, 641.10.1016/S0953-7562(09)80810-1Suche in Google Scholar
[5] D. L. Hawksworth, Mycol. Res.2001, 105, 1422.10.1017/S0953756201004725Suche in Google Scholar
[6] J. A. Castro, Hum. Exp. Toxicol. 2006, 25, 471.10.1191/0960327106het653oaSuche in Google Scholar PubMed
[7] S. L. Croft, K. Seifert, V. Yardley, Indian J. Med. Res.2006, 123, 399.Suche in Google Scholar
[8] R. Brun, R. Don, R. T. Jacobs, M. Z. Wang, M. P. Barrett, Future Microbiol. 2011, 6, 677.10.2217/fmb.11.44Suche in Google Scholar PubMed
[9] N. B. Lenta, C. Vonthron-Sénécheau, S. R. Fongang, F. Tantangmo, S. Ngouela, M. Kaiser, E. Tsamo, R. Anton, B. Weniger, J. Ethnopharmacol.2007, 111, 8.10.1016/j.jep.2006.10.036Suche in Google Scholar PubMed
[10] M. M. A. Amer, W. E. Court, Planta Med. 1980, 40, 8.10.1055/s-2008-1074994Suche in Google Scholar
[11] E. S Elkhayat, S. R. M. Ibrahim, G. A. Mohamed, S. A. Ross, Nat. Prod. Res.2016, 30, 814.10.1080/14786419.2015.1072711Suche in Google Scholar PubMed
[12] R. Liu, A. Li, A. Sun, J. Chrom. A.2004, 1052, 217.10.1016/j.chroma.2004.08.101Suche in Google Scholar PubMed
[13] J. Q. Gu, C. M. Eppler, G. Montenegro, S. D. Timmins, B. N. Timmermann, Z. Naturforsch.2005, 60c, 527.10.1515/znc-2005-7-803Suche in Google Scholar
[14] H. H. F. Koolen, L. S. Menezes, M. P. Souza, F. M. A. Silva, F. G. O. Almeida, A. Q. L. De Souza, A. Nepel, A. Barison, F. H. Da Silva, D. E. Evangelista, A. D. L. De Souza, Braz. Chem. Soc.2013, 24, 880.Suche in Google Scholar
[15] B. Proksa, D. Uhrín, T. Liptaj, M. Šturdíková, Phytochemistry1998, 48, 1161.10.1016/S0031-9422(98)00169-1Suche in Google Scholar
[16] V. N. Gonçalves, C. R. Carvalho, S. Johann, G. Mendes, T. M. A. Alves, C. L. Zani, P. A. S. Junior, S. M. F. Murta, A. J. Romanha, C. L. Cantrell, C. A. Rosa, L. H. Rosa, Polar Bio2015, 38, 1143.10.1007/s00300-015-1672-5Suche in Google Scholar
[17] A. R. B. Ola, A. Debbab, A. H. Aly, A. Mandi, I. Zerfass, A. Hamacher, M. U. Kassack, H. Brötz-Oesterhelt, T. Kurtan, P. Proksch, Tetrahedron Lett. 2014, 55, 1020.10.1016/j.tetlet.2013.12.070Suche in Google Scholar
[18] T. Wezeman, S. Brase, K. S. Masters, Nat. Prod. Rep.2015, 32, 6.10.1039/C4NP00050ASuche in Google Scholar PubMed
[19] A. Madariaga-Mazón, M. González-Andrade, M. del Carmen González, A. E. Glenn, C. M. Cerda-García-Rojas, R. Mata, J. Nat. Prod.2013, 76, 1454.10.1021/np4002477Suche in Google Scholar PubMed
[20] A. E. Hay, J. Merza, A. Landreau, M. Litaudon, F. Pagniez, P. Le Pape, P. Richomme, Fitoterapia2008, 79, 42.10.1016/j.fitote.2007.07.005Suche in Google Scholar PubMed
[21] J. X. Kelly, M. V. Ignatushchenko, H. G. Bouwer, D. H. Peyton, D. J. Hinrichs, R. W. Winter, M. Riscoe, Mol. Biochem.2003, 126, 43.10.1016/S0166-6851(02)00248-7Suche in Google Scholar
[22] M. V. Ignatushchenko, Antimalarial and Antileishmanial Action of Xanthones: Host-Parasite Differences in Heme Metabolism as Chemotherapeutic Targets, PhD thesis, Oregon Health Sciences University, Portland, OR (USA) 1998, pp 140.Suche in Google Scholar
[23] I. C. Pimentel, C. Glienke-Blanco, J. Gabardo, R. M. Stuart, J. L. Azevedo, Braz. Arch. Biol. Technol.2006, 49, 705.10.1590/S1516-89132006000600003Suche in Google Scholar
[24] R. Khan, S. Shahzad, M. I. Choudhary, S. A. Khan, A. Pakistan J. Bot. 2010, 42, 1281.Suche in Google Scholar
[25] T. J. White, T. Bruns, S. Lee, J. W. Taylor, Amplification and direct sequencing of fungal ribosomal RNA genes for phylogenetics, in PCR Protocols: A Guide to Methods and Applications (Eds.: M. A. Innis, D. H. Gelfand, J. J. Sninsky, T. J. White), Academic Press, New York, 1990, p. 315.10.1016/B978-0-12-372180-8.50042-1Suche in Google Scholar
[26] I. Orhan, B. Sener, M. Kaiser, R. Brun, D. Tasdemir. Mar Drugs2010, 8, 47.10.3390/md8010047Suche in Google Scholar PubMed PubMed Central
[27] CLSI, Performance Standards for Antimicrobial Disk Susceptibility Tests, Approved Standard, 7th edition, CLSI document M02-A11. Clinical and Laboratory Standards Institute, Wayne, PA (USA) 2012.Suche in Google Scholar
[28] CLSI, Methods for Dilution Antimicrobial Susceptibility Tests for Bacteria That Grow Aerobically, Approved Standard, 9th edition, CLSI document M07-A9. Clinical and Laboratory Standards Institute, Wayne, PA (USA) 2012.Suche in Google Scholar
[29] O. S. Voundi, M. Nyegue, I. Lazar, D. Raducanu, F. Ndoye, S. Marius, F. X. Etoa, Foodborne Pathog. Dis.2015, 12, 551.10.1089/fpd.2014.1892Suche in Google Scholar PubMed
Supplemental Material:
The online version of this article (DOI: 10.1515/znb-2016-0128) offers supplementary material, available to authorized users.
©2016 Walter de Gruyter GmbH, Berlin/Boston
Artikel in diesem Heft
- Frontmatter
- In this Issue
- Li2Pt3Se4: a new lithium platinum selenide with jaguéite-type crystal structure by multianvil high-pressure/high-temperature synthesis
- RE4B4O11F2 (RE = Sm, Tb, Ho, Er): four new rare earth fluoride borates isotypic to Gd4B4O11F2
- Regioselective C-3 arylation of coumarins with arylhydrazines via radical oxidation by potassium permanganate
- Two new POM-based compounds containing a linear tri-nuclear copper(II) cluster and an infinite copper(II) chain, respectively
- Environmentally benign synthesis of methyl 6-amino-5-cyano-4-aryl-2,4-dihydropyrano[2,3-c]pyrazole-3-carboxylates using CeO2 nanoparticles as a reusable and robust catalyst
- Synthesis and structural characterization of Ca12Ge17B8O58
- Synthesis of some new hydrazide-hydrazones related to isatin and its Mannich and Schiff bases
- Purpureone, an antileishmanial ergochrome from the endophytic fungus Purpureocillium lilacinum
- Syntheses and crystal structures of two new silver–organic frameworks based on N-pyrazinesulfonyl-glycine: weak Ag···O/N interaction affecting the coordination geometry