The importance of LDH/Albumin, LDH/Lymphocyte, and LDH/Platelet ratios in the evaluation of COVID-19 B.1.1.7 variant
-
Gamze Avcioglu

 ,
Yavuz Otal
und
Fadime Gullu Haydar
,
Yavuz Otal
und
Fadime Gullu Haydar

Abstract
Objectives
The aim is to investigate the usefulness of lactate dehydrogenase (LDH)/Albumin, LDH/Lymphocyte and LDH/Platelet ratios on the prognosis of coronavirus disease (COVID-19) Alpha (B.1.1.7) variant pneumonia.
Methods
A total of 113 patients who were diagnosed with COVID-19 pneumonia and 60 healthy control group were included in this study. The cases were divided into 2 as classic COVID-19 group, and COVID-19 B.1.1.7 variant group. Complete blood count (CBC) and biochemical parameters of the patients were analyzed retrospectively. Patients with COVID-19 B.1.1.7 variant group were also grouped according to the length of stay in the hospital and the days of hospitalization.
Results
LDH/Albumin, LDH/Platelet, and LDH/Lymphocyte ratios were found to be higher in COVID-19 B.1.1.7 variant group when compared to the control group (p<0.001). The ferritin, neutrophils/lymphocyte (NLR) ratio, procalcitonin (PCT) and LDH/Albumin had the highest area under the curve (AUC) values in the COVID-19 B.1.1.7 variant group (0.950, 0.802, 0.759, and 0.742, respectively). Albumin, Lymphocytes and hemoglobin values were significantly higher in the COVID-19 B.1.1.7 variant group than in the classic COVID-19 group (p<0.05).
Conclusions
LDH/Albumin and LDH/Lymphocyte ratios may be useful for clinicians in predicting the risk of progression to pneumonia in COVID-19 B.1.1.7 variant patients.
Introduction
The COVID-19 pandemic started to appear in China/Wuhan at the end of 2019 and many people lost their lives [1]. Hospitalization and quarantine periods are prolonged because of the high transmission and severe symptoms of the COVID-19 virus. SARS-COV-2 still continues its disease-causing effects through various mutations. Numerous variants have been identified so far, which provided evidence for altered characteristics of the COVID-19 virus [2]. According to the World Health Organization (WHO) classification, a few variants e.g., Alpha (B.1.1.7), Beta (B.1.351), Gamma (P.1), Delta (B.1.617.2), and Delta Plus (AY.1 or B.1.617.2.1) emerged temporarily with spikes in infection rates in the countries where they first appeared [2], [3], [4], [5], [6].
It was shown in many previous studies that COVID-19 and its variants cause high morbidity and mortality [7], [8], [9]. For this reason, it is important that healthcare services are provided regularly and adequately. In this respect, to make early clinical intervention and treatment possible, it is important to find reliable predictors for disease severity and mortality.
It has great importance to determine the predictor parameters for the infection in COVID-19 cases. The LDH, particularly high levels of LDH, were associated with worse outcomes in COVID-19 cases [7]. It was speculated that there are significant differences in LDH levels in COVID-19 cases. Low levels of albumin and lymphocyte are associated with morbidity and mortality in COVID-19 [8, 10, 11]. There is a need for parameters to help to understand the clinical progression of COVID-19 pneumonia and contribute to elucidating the pathophysiology of the disease. This study was planned based on the idea that LDH/Albumin, LDH/Lymphocyte, and LDH/Platelet ratios may be useful in evaluating the severity of the disease in patients with the COVID-19 B.1.1.7 variant.
The aim of this study was to make a comprehensive analysis of the clinical, laboratory and demographic characteristics of COVID-19 patients admitted to Ankara City Hospital and to compare their data with the classic COVID-19, COVID-19 B.1.1.7 variant and healthy control groups. In addition, the role of LDH/Albumin, LDH/Lymphocyte, and LDH/Platelet ratios in the progression of patients in the COVID-19 B.1.1.7 variant group to COVID-19 pneumonia and in the pathogenesis of COVID-19 pneumonia was investigated.
Materials and methods
Study design and participants
The present study was designed retrospectively and was approved by the Ethics Committee of Ankara City Hospital (E2-21-857). In the control group, patients who applied to Ankara City Hospital for routine control and had no known health problems were included. Between February and April 2021, patients with a diagnosis of classic COVID-19 and patients with a diagnosis of COVID-19 B.1.1.7 variant hospitalized in Ankara City Hospital’s COVID-19 unit were included in the study group. The diagnostic criteria of the WHO temporary guideline were used in the study [1]. The demographic, clinical, laboratory data and radiological findings of the patients were obtained from electronic medical records and case record forms. The albumin, glucose, urea, creatinine, ferritin, ALT, AST, GGT, LDH, CRP, procalcitonin (PCT), D-dimer, troponin-I and CBC parameters of Group B.1.1.7 and the classic COVID-19 group were analyzed. CBC was analyzed using the ADVIA 2120 Hematology System (Siemens Healthcare Diagnostics, Erlangen, Germany). An Atellica Solution Immunoassay & Clinical Chemistry Analyzer (Siemens Healthcare Diagnostics, Erlangen, Germany) was used for measuring biochemical parameters. PT, APTT and D-dimer were measured using the Sysmex CS-5100 System (Siemens Healthcare Diagnostics, Erlangen, Germany). COVID-19 B.1.1.7 variant and classic COVID-19 groups were compared according to demographic data, radiological characteristics, laboratory findings, and clinical characteristics.
Diagnostic criteria
Oro/nasopharyngeal swab samples for RT-PCR, routine blood tests, and chest computed tomography (CT) were requested from the patients for the diagnosis of COVID-19. Those with a fever and respiratory symptoms, signs of pneumonia on CT, or clinical signs based on positive SARS-CoV-2 PCR results according to the WHO temporary guideline for the diagnosis of COVID-19 [1]. Those with positive B.1.1.7 variant analysis results for SARS-CoV-2 PCR were included in the study. Among the COVID-19 patients, the classic COVID-19 group was named Group N, and the COVID-19 B.1.1.7 variant group was named Group V.
Exclusion criteria
Patients who underwent mechanical ventilation, deceased patients, patients hospitalized in the intensive care unit (ICU), pregnant women and individuals younger than 18 years were not included in the study.
Statistical analysis
The Statistical Package for Social Sciences for Windows, Version 22 (IBM, Armonk, NY, USA) was used for the statistical analyses. The normality of variables was evaluated with the Kolmogorov–Smirnov test. Descriptive analysis was indicated using mean ± standard deviation (SD) for the parameters normally distributed, and median interquartile range, (IQR) was used for non-normally distributed variables. Normally distributed parameters were compared using one way ANOVA test. Non-normally distributed variables were compared with the Kruskal-Wallis test. Comparisons for categorical variables were performed using the Chi-square test or the Fisher’s exact test. The receiver operation characteristic (ROC) curve was used to determine the efficacy of various parameters to predict the prognosis in the COVID-19 B.1.1.7 group. The optimal cut-off values of the PCT, ferritin, troponin-I, LDH, LDH/Albumin, LDH/Platelet, LDH/Lymphocyte and NLR ratios were calculated by applying the ROC analysis. A value of p<0.05 was considered to be statistically significant.
Results
Demographic, clinical, and treatment results
A total of 113 patients, 64 of whom were diagnosed with classic COVID-19 and 49 of whom were diagnosed with COVID-19 B.1.1.7 variant and 60 healthy subjects were included in the study. The median age of the COVID-19 B.1.1.7 group was found to be 48 (38.5–64.5), and that of the classic COVID-19 group was 73 (59–80), and 65 of the COVID-19 patients were male (p<0.001). Ground-glass opacity was found in the CT results of 44 patients in total, and ground-glass opacity was more dominant in the classic COVID-19 group (67.2%) than in the COVID-19 B.1.1.7 variant group (6.1%) (p<0.001). The median length of hospitalization was 10 days for both COVID-19 patient groups. The number of individuals who died was one and the patient who died was excluded from the study (Table 1).
Demographic characteristics of the COVID-19 groups.
| Variables | Total (n=113) | COVID-19 B.1.1.7 variant group (n=49) | Classic COVID-19 group (n=64) | p-Value |
|---|---|---|---|---|
| Age, years | 45 (33–60) | 48 (38.5–64.5) | 73.0 (59–80) | <0.001 |
| Gender, male/female | 65/48 | 26/23 | 39/25 | 0.446 |
| Abnormalities on chest CT, % | 54 (47.8) | 10 (20.4) | 44 (72.1) | <0.001 |
| Ground-glass opacity, % | 44 (38.9) | 3 (6.1) | 41 (67.2) | <0.001 |
| Viral pneumonia, % | 10 (8.8) | 7 (21.9) | 3 (4.9) | 0.090 |
| Pulmonary parenchyma infiltration, % | 2 (1.8) | 2 (4.1) | 0 | N/A |
| Length of hospital stay, day, median | 10 (7–18) | 10 (6–15.5) | 10 (7–21.5) | 0.620 |
| Death, % | 1 (0.9) | 1 (2.0) | 0 | N/A |
| Oxygen therapy, % | 3 (2.7) | 3 (6.1) | 0 | N/A |
| Comorbidities | 85 (75.2) | 31 (63.3) | 54 (84.4) | 0.015 |
| Systemic hypertension, n (%) | 52 (46.0) | 17 (34.7) | 35 (54.7) | 0.038 |
| Diabetes mellitus, n (%) | 35 (30.9) | 8 (16.3) | 27 (42.2) | 0.004 |
| Congestive heart disease, n (%) | 12 (10.6) | 4 (8.2) | 8 (12.5) | 0.548 |
| Ischemic heart disease, n (%) | 12 (10.6) | 1 (2.0) | 11 (17.2) | 0.012 |
| Chronic renal disease, n (%) | 2 (1.8) | 1 (2.0) | 1 (1.6) | 0.681 |
| Cancer, n (%) | 8 (7.1) | 3 (6.1) | 5 (7.8) | 0.515 |
| Cerebrovascular events, n (%) | 4 (3.6) | 1 (2.0) | 3 (4.7) | 0.632 |
| Chronic obstructive pulmonary disease, n (%) | 5 (4.4) | 1 (2.0) | 4 (6.3) | 0.386 |
|
|
||||
| signs and symptoms | ||||
|
|
||||
| Fever, % | 35 (30.9) | 12 (24.5) | 23 (35.9) | 0.222 |
| Dry cough, % | 32 (28.3) | 18 (36.7) | 14 (21.9) | 0.095 |
| Myalgia, % | 6 (5.3) | 5 (10.2) | 1 (1.6) | 0.084 |
| Dyspnea, % | 22 (19.5) | 6 (12.2) | 16 (25) | 0.100 |
| Weakness, % | 17 (15.0) | 10 (20.4) | 7 (10.9) | 0.191 |
|
|
||||
| Treatment | ||||
|
|
||||
| Chloroquine, % | 17 (15.0) | 7 (14.3) | 10 (15.6) | 0.530 |
| Favipiravir, % | 69 (61.1) | 49 (100) | 20 (31.3) | <0.001 |
| Steroid, % | 29 (25.7) | 11 (22.5) | 18 (28.1) | 0.523 |
| Colchicine, % | 20 (17.7) | 8 (16.3) | 12 (18.8) | 0.807 |
-
p-Values less than 0.05 were considered significant and highlighted in bold.
RT-PCR results were positive (100%) in all of the COVID-19 B.1.1.7 variant group. RT-PCR test was positive in 67.2% (n=21) of the classic COVID-19 group. The most common complaints at admission to the hospital in both COVID-19 groups were fever (30.9%), dry cough (28.3%) and shortness of breath (19.5%), respectively.
The comorbidity was detected in 85 (75.2%) patients in total, and comorbidity was higher in patients in the classic COVID-19 group (p=0.015). The most common comorbidities were systemic hypertension (46, 30.9, 10.6, and 10.6%), diabetes, congestive heart disease, and ischemic heart disease, respectively. Favipiravir (n=69) was used predominantly in the treatment and steroid (n=29) was used secondarily. In B.1.1.7 group patients, steroid treatment was used in addition to the Favipiravir treatment (Table 1).
Analysis of LDH/Albumin, LDH/Lymphocyte, and LDH/Platelet ratios in COVID-19 B.1.1.7 variant group patients
It was shown that the LDH, LDH/Albumin, LDH/Lymphocytes, and LDH/Platelet parameters were significant and higher in COVID-19 B.1.1.7 variant group patients when compared to the control group (p<0.001) (Table 2). There was a statistically significant difference between the COVID-19 B.1.1.7 variant group and the classic COVID-19 group in terms of LDH/Lymphocyte ratio (p=0.037) (Figure 1).
Blood routine parameters characteristics of patients group according to admission.
| Variables | Control group (n=60) | Group 1 (n=49) | Group 2 (n=49) | Group 3 (n=49) | p-Value | Pairwise comparison |
|---|---|---|---|---|---|---|
| Age, years | 40 (29–72) | 48 (38.5–64.5) | 48 (38.5–64.5) | 48 (38.5–64.5) | 0.004 a | C vs. G1, p=0.020 |
| C vs. G3, p=0.020 | ||||||
| G2 vs. G3, p=1.000 | ||||||
| Gender, female/male | 26/34 | 23/26 | 23/26 | 23/26 | 0.974b | – |
| Albumin, g/L | 46 (44–48) | 44 (41–47) | 40 (36–43) | 39 (34–43) | <0.001 a | C vs. G1, p=0.007 |
| C vs. G3, p<0.001 | ||||||
| G2 vs. G3, p=1.000 | ||||||
| Total protein, g/L | 72 (68–72) | 67 (64–69.5) | 60 (58–64) | 62 (58–66) | <0.001 a | C vs. G1, p=0.033 |
| C vs. G3, p<0.001 | ||||||
| G2 vs. G3, p=1.000 | ||||||
| WBC, ×109/L | 7.2 (6.7–10.1) | 5.8 (4.3–7.5) | 6.8 (4.6–8.7) | 7.4 (5.9–9.9) | <0.001 a | C vs. G1, p<0.001 |
| C vs. G3, p=1.000 | ||||||
| G2 vs. G3, p=0.508 | ||||||
| Neutrophils, ×109/L | 4.7 (3.1–6.9) | 3.4 (2.6–5.1) | 4.3 (2.4–6.3) | 4.4 (3.3–7.3) | 0.029 a | C vs. G1, p=0.094 |
| C vs. G3, p=1.000 | ||||||
| G2 vs. G3, p=1.000 | ||||||
| Lymphocytes, ×109/L | 2.0 (1.5–2.7) | 1.3 (0.9–1.7) | 1.3 (0.9–2.2) | 1.9 (1.3–2.4) | <0.001 a | C vs. G1, p<0.001 |
| C vs. G3, p=1.000 | ||||||
| G2 vs. G3, p=0.076 | ||||||
| RBC, ×1012/L | 4.8 (4.5–5.2) | 4.9 (4.4–5.1) | 4.5 (4.4–4.8) | 4.5 (4.1–4.7) | <0.001 a | C vs. G1, p=1.000 |
| C vs. G3, p=0.002 | ||||||
| G2 vs. G3, p=1.000 | ||||||
| Hemoglobin, g/dL | 13.8 (12.7–14.5) | 14.1 (12.9–14.9) | 13.4 (12.4–14.3) | 13.2 (11.8–13.9) | 0.025 a | C vs. G1, p=1.000 |
| C vs. G3, p=0.292 | ||||||
| G2 vs. G3, p=1.000 | ||||||
| Hematocrit, % | 43.9 (40.7–44.9) | 41.6 (39.2–44.9) | 39.6 (36.8–42.3) | 38.2 (35.9–41.9) | 0.001 a | C vs. G1, p=1.000 |
| C vs. G3, p=0.004 | ||||||
| G2 vs. G3, p=1.000 | ||||||
| Platelet, ×109/L | 250 (100–304) | 188 (155–220) | 242 (157–305) | 253 (199–344) | <0.001 a | C vs. G1 p<0.001 |
| C vs. G3, p=1.000 | ||||||
| G2 vs. G3, p=0.934 | ||||||
| N/L | 2.0 (1.4–4.9) | 2.2 (1.7–4.2) | 2.2 (1.4–8.1) | 2.2 (1.5–5.4) | 0.718a | – |
| CRP, g/L | 0.04 (0.02–0.07) | 0.03 (0.01–0.04) | 0.02 (0.01–0.05) | 0.01 (0.01–0.03) | 0.001 a | C vs. G1, p=0.283 |
| C vs. G3, p=0.001 | ||||||
| G2 vs. G3, p=1.000 | ||||||
| Procalcitonin, µg/L | 0.03 (0.03–0.07) | 0.04 (0.03–0.08) | 0.03 (0.03–0.06) | 0.03 (0.03–0.04) | 0.034 a | C vs. G1, p=0.674 |
| C vs. G3, p=0.780 | ||||||
| G2 vs. G3, p=0.624 | ||||||
| D-dimer, mg/L | 0.4 (0.2–0.7) | 0.4 (0.3–0.9) | 0.4 (0.3–0.9) | 0.5 (0.3–0.6) | 0.367a | – |
| Troponin-I H, ng/L | 2 (2–5) | 2.5 (2.5–7) | 2.5 (2.5–4) | 2.5 (2.5–4.5) | 0.068a | – |
| Amylase, U/L | 59 (51.3–82.8) | 62.5 (48–78.5) | 68 (56–79.5) | 74 (55–72) | 0.408a | – |
| Lipase, U/L | 30 (25–37) | 42.5 (31–49.3) | 46 (33.5–58.5) | 48.5 (42–72) | <0.001 a | C vs. G1, p<0.001 |
| C vs. G3, p<0.001 | ||||||
| G2 vs. G3, p=1.000 | ||||||
| CK, U/L | 131 (102–154) | 71 (49–127) | 65 (41–90) | 40 (29–65) | <0.001 a | C vs. G1, p=0.004 |
| C vs. G3, p<0.001 | ||||||
| G2 vs. G3, p=0.209 | ||||||
| aPTT, s | 24.5 (22.2–25.9) | 24.6 (23.1–26.3) | 24 (21.9–25.1) | 23.5 (22.1–26.1) | 0.350a | – |
| PT, s | 11.9 (10.9–12.8) | 11.7 (11.3–12.8) | 11.8 (11.4–12.6) | 11.9 (11.5–13.1) | 0.506a | – |
| AST, U/L | 17.5 (14–23.8) | 30 (21–40.5) | 36 (24–61) | 31 (22.3–46) | <0.001 a | C vs. G1, p<0.001 |
| C vs. G3 p<0.001 | ||||||
| G2 vs. G3, p=1.000 | ||||||
| ALT, U/L | 23 (16–37.8) | 26 (20–41.5) | 38 (27–91) | 48 (30–79) | <0.001 a | C vs. G1, p=1.000 |
| C vs. G3 p<0.001 | ||||||
| G2 vs. G3, p=1.000 | ||||||
| ALP, U/L | 65 (60–80) | 67 (64–69.5) | 60 (58–64) | 62 (58–66) | 0.926a | – |
| GGT, U/L | 20 (15–32.8) | 26 (17–50) | 42 (18.5–66) | 36 (22.3–95) | 0.001 a | C vs. G1, p=0.765 |
| C vs. G3, p=0.002 | ||||||
| G2 vs. G3, p=1.000 | ||||||
| LDH, U/L | 198 (172–244) | 271 (242–343) | 301 (243–338) | 278.5 (240–312) | <0.001 a | C vs. G1, p<0.001 |
| C vs. G3, p<0.001 | ||||||
| G2 vs. G3, p=0.737 | ||||||
| LDH/Albumin | 4.3 (3.7–5.2) | 6.5 (5.2–7.7) | 7.6 (5.6–9.2) | 7.1 (5.8–8.4) | <0.001 a | C vs. G1, p<0.001 |
| C vs. G3 p<0.001 | ||||||
| G2 vs. G3, p=1.000 | ||||||
| LDH/PLT | 0.7 (0.6–1.0) | 1.5 (1.2–2.1) | 1.3 (0.9–1.9) | 1.1 (0.8–1.5) | <0.001 a | C vs. G1, p<0.001 |
| C vs. G3, p=0.005 | ||||||
| G2 vs. G3, p=0.330 | ||||||
| LDH/LYM | 88.5 (67.6–146) | 224 (135–314) | 199 (115–396) | 155 (107–233) | <0.001 a | C vs. G1, p<0.001 |
| C vs. G3, p=0.003 | ||||||
| G2 vs. G3, p=0.307 | ||||||
| Ferritin, μg/L | 58 (34–88) | 146 (56–243) | 212 (71–448) | 158 (70–378) | <0.001 a | C vs. G1, p<0.001 |
| C vs. G3, p<0.001 | ||||||
| G2 vs. G3, p=1.000 | ||||||
| Glucose, mg/dL | 100 (85–113) | 102 (81–117) | 105 (80–151) | 105 (84–143) | 0.420a | – |
| Urea, mg/dL | 29 (22–39) | 29.5 (24–36) | 38 (27–45) | 36 (26–45) | 0.001 a | C vs. G1, p=1.000 |
| C vs. G3, p=0.018 | ||||||
| G2 vs. G3, p=1.000 | ||||||
| Creatinine, mg/dL | 0.7 (0.6–0.9) | 0.8 (0.7–0.9) | 0.8 (0.7–0.9) | 0.8 (0.6–0.9) | 0.245a | – |
| Total bilirubin, mg/dL | 0.8 (0.7–0.8) | 0.4 (0.4–0.6) | 0.4 (0.3–0.5) | 0.4 (0.3–0.5) | <0.001 a | C vs. G1, p<0.001 |
| C vs. G3, p<0.001 | ||||||
| G2 vs. G3, p=1.000 | ||||||
| Conjugated bilirubin, mg/dL | 0.3 (0.2–0.4) | 0.2 (0.1–0.2) | 0.1 (0.1–0.2) | 0.1 (0.1–0.2) | <0.001 a | C vs. G1, p<0.001 |
| C vs. G3, p<0.001 | ||||||
| G2 vs. G3, p=1.000 |
-
Descriptive statistics were presented as median (IQR). aKruskal−Wallis test. bChi square test. Bonferroni correction was used for pairwise comparisons. The significance level was set at p<0.05. LYM, lymphocyte; PLT, platelet. p-Values less than 0.05 were considered significant highlighted in bold.
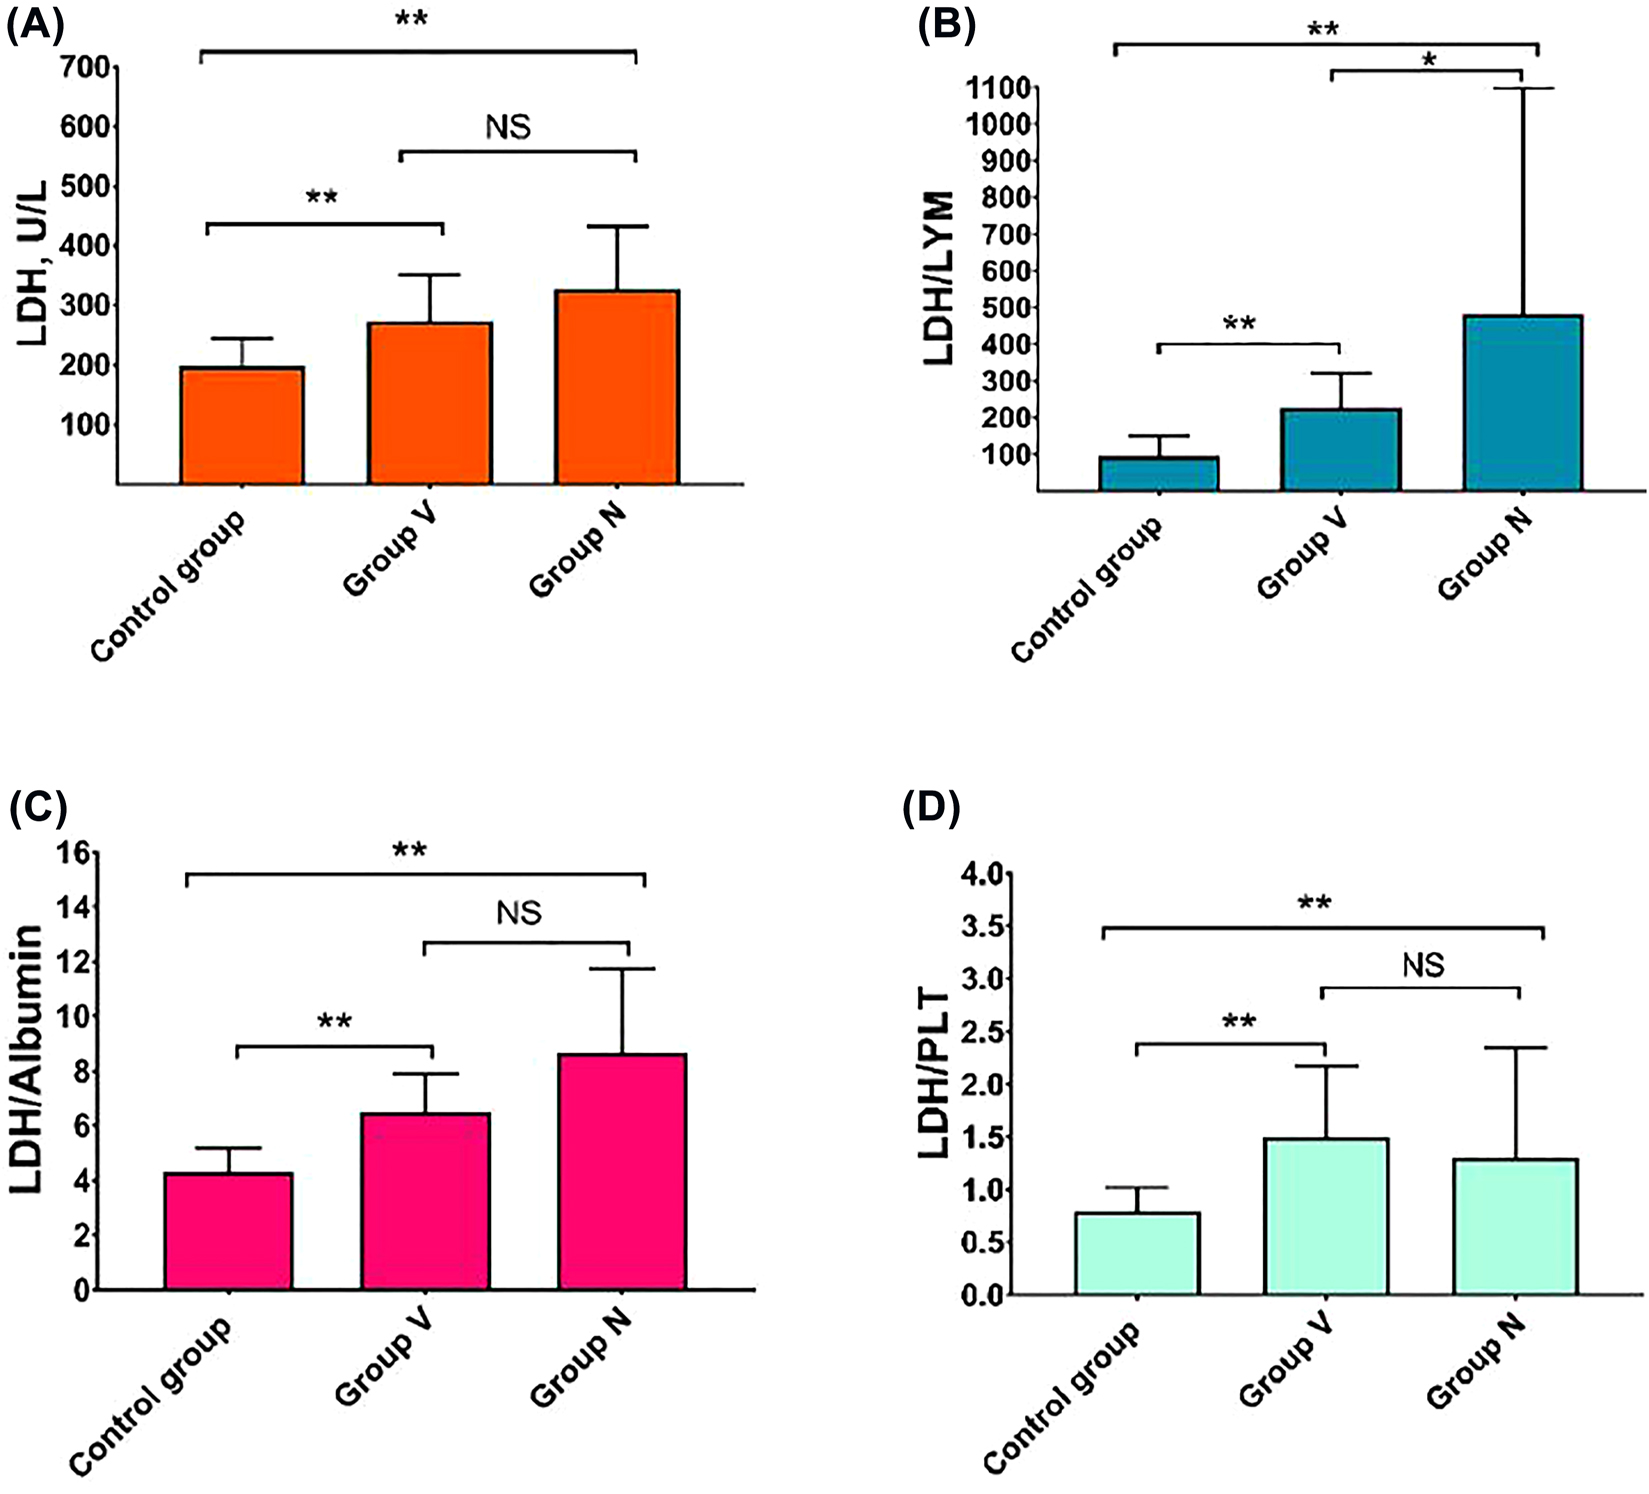
Comparison of LDH (A), LDH/LYM (B), LDH/Albumin (C), LDH/PLT (D) levels of control group, Group V and Group N groups. p-Values less than 0.001 were considered significant highlighted in double asterisk.
NS, not significant; PLT, platelet; and LYM, lymphocytes.
Laboratory findings of Group N and Group V
Significant differences were detected between all groups except for ALT levels (p<0.05) (Table 2). There were significant differences between the classic COVID-19 group and COVID-19 B.1.1.7 variant group in all parameters except AST, GGT, LDH, and creatinine (p<0.05). The WBC, Neutrophils, PLT, NLR, CRP, PCT, D-dimer, troponin-I, GGT, LDH/Lymphocyte, ferritin, glucose, creatinine and urea values were significantly higher in the classic COVID-19 group than in COVID-19 B.1.1.7 variant group (p<0.05). Albumin, hemoglobin and lymphocytes, values were significantly higher in the COVID-19 B.1.1.7 variant group than in the classic COVID-19 group (p<0.05) (Table 2). Albumin, WBC, neutrophils, lymphocytes, PLT, AST, ferritin, LDH, LDH/Albumin, LDH/Lymphocyte, and LDH/Platelet parameters were found to be statistically significant between the control group and COVID-19 B.1.1.7 variant group (p<0.05) (Table 2).
The ROC analysis of routine blood parameters in predicting patients in the COVID-19 variant group B.1.1.7
The ROC Curve Analysis was used to determine the efficacy of various parameters to predict the prognosis in the COVID-19 B.1.1.7 variant group. The COVID-19 B.1.1.7 variant group was set as the positive group, and the classic COVID-19 group was set as the negative group. According to ROC Curve analysis, the ferritin, NLR ratio, PCT and LDH/Albumin had the highest AUC values in the COVID-19 B.1.1.7 variant group (0.950, 0.802, 0.759, and 0.742, respectively, as seen in Figure 2). The AUC, optimal cut-off, and sensitivity and specificity values of laboratory parameters are given in Table 3.
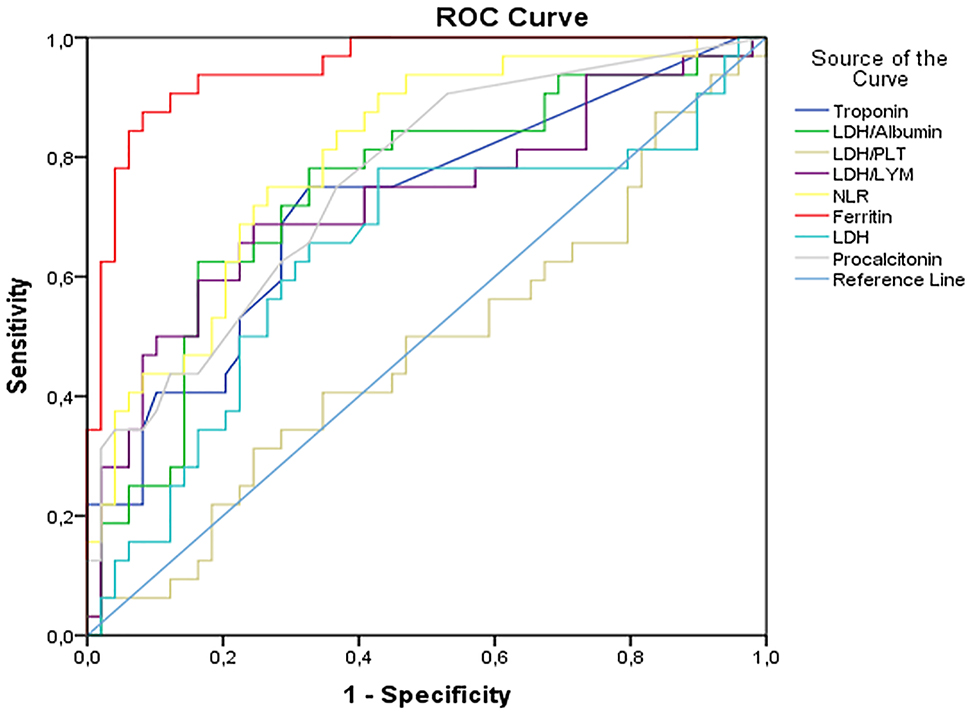
The ROC curves of LDH/Albumin, LDH/PLT, LDH/LYM, LDH, NLR, ferritin, procalcitonin, and troponin in predicting severe SARS-CoV-2 infection, on admission.
PLT, platelet; LYM, lymphocytes; NLR, neutrophils-to-lymphocytes ratio.
The value of blood routine parameters in diagnosis of patients with COVID-19 B.1.1.7 variant group on admission.
| Variables | Cut-off value | AUC (95% CI) | Sensitivity, % | Specificity, % | p-Value |
|---|---|---|---|---|---|
| LDH, U/L | ≥244 | 0.823 (0.738–0.908) | 75.5 | 72.5 | <0.001 |
| NLR | ≥2.03 | 0.548 (0.424–0.673) | 61.2 | 50.0 | 0.436 |
| Ferritin, μg/L | ≥71.5 | 0.752 (0.648–0.856) | 71.4 | 70.0 | <0.001 |
| Procalcitonin, μg/L | ≥0.035 | 0.623 (0.505–0.740) | 53.1 | 70.0 | 0.048 |
| Troponin, ng/L | ≥2.25 | 0.633 (0.507–0.759) | 95.9 | 50.0 | 0.033 |
| LDH/Albumin | ≥5.22 | 0.854 (0.777–0.931) | 77.1 | 75.0 | <0.001 |
| LDH/PLT | ≥1.06 | 0.914 (0.858–0.971) | 83.3 | 82.5 | <0.001 |
| LDH/LYM | ≥142.5 | 0.844 (0.761–0.927) | 75.0 | 75.0 | <0.001 |
-
AUC, area under the curve; PLT, platelet; NLR, neutrophils-to-lymphocytes ratio; LYM, lymphocyte. Asymptotic significance less than 0.05 were considered significant. p-Values less than 0.05 were considered significant highlighted in bold.
Discussion
The COVID-19 pandemic still continues to affect the whole world with its variants and might cause an extensive clinical spectrum from subclinical disease to respiratory failure. LDH is an intracellular enzyme in cells of almost all organ systems. LDH values may increase due to decreased oxygenation as a result of multiple organ damage and upregulation of the glycolytic pathway [12].
In this study, when the COVID-19 B.1.1.7 variant group was compared with the healthy control group, it was shown that especially the LDH/Albumin, LDH/Lymphocyte and LDH/Platelet ratios were very useful in predicting the disease. These evaluated rates, as well as the age, presence of comorbidity, and symptoms at presentation may contribute to elucidating the pathogenesis of the disease in the COVID-19 B.1.1.7 variant group.
Due to the increase in lactate as a result of infection and tissue damage, the extracellular pH becomes acidic, triggering the activation of metalloproteases and increasing macrophage-mediated angiogenesis [13]. Severe infections might cause cytokine-mediated tissue damage and LDH release. Elevated LDH can be expected in patients with severe COVID-19 infection because LDH is present in lung tissue [7]. In this study, when the COVID-19 B.1.1.7 variant group and the healthy control group were compared, it was found that the LDH, LDH/Albumin, LDH/Lymphocytes, and LDH/Platelet parameters were significant and higher than the control group (p<0.001).
The predictive value of LDH for severe COVID-19 patients was emphasized in some previous studies [14, 15]. In this study, the optimal cut-off was found to be 293 U/L for LDH (sensitivity and specificity 78.1 and 57.1%, respectively), which is consistent with the study by Poggialia et al. [15]. Moreover, our study found that LDH/Albumin and LDH/Lymphocyte, parameters can be used as predictive diagnostic tools to identify subjects with the COVID-19 B.1.1.7 variant (p<0.05). In cases of COVID-19 with chest tomography findings, the diagnosis of COVID-19 is definitive. However, the RT-PCR test may be negative in COVID-19 B.1.1.7 variant cases that do not have tomographic findings, and evaluating blood parameters may help diagnosis. High LDH/Albumin, LDH/Platelet, and LDH/Lymphocyte ratios in COVID-19 cases may contribute to the diagnosis of the COVID-19 B.1.1.7 variant. Since there is no definitive cure for COVID-19 yet and the importance of early isolation is indisputable, these rates can help clinicians with their ease of application and early diagnosis and mortality estimation.
We think that the high LDH/Albumin and LDH/Lymphocyte ratios in the COVID-19 B.1.1.7 variant provide important information about the clinical course of the disease, as well as showing that there is recovery after treatment. These rates can give an idea for clinicians about the prognosis of the disease.
It was reported in various studies in the literature that serum albumin, lymphocytes, and platelet values were found to be low in COVID-19 patients [7, 12, 16, 17]. Lymphopenia, elevated ferritin, procalcitonin and NLR were reported to be predictors of severe prognosis [18]. In our study, lymphopenia, high NLR, ferritin, procalcitonin levels were detected in both COVID-19 groups, which is consistent with the results of these studies [18, 19]. Moreover, our study found that ferritin, NLR, and procalcitonin parameters can be used as predictive diagnostic tools to identify subjects with the COVID-19 B.1.1.7 variant (AUC values were 0.950, 0.802, and 0.759, respectively).
Changes were detected in some laboratory parameters in the COVID-19 B.1.1.7 variant group when the laboratory results were evaluated. When the laboratory parameters of the COVID-19 B.1.1.7 variant group were compared to the control group, the albumin, Lymphocytes, PLT parameters decreased, and the urea, creatinine, Troponin I, PCT, NLR, AST, ALT, ferritin, LDH, LDH/Albumin, LDH/Lymphocytes, and LDH/Platelet parameters were elevated in COVID-19 B.1.1.7 variant group in line with the meta-analysis study [12, 19]. Although the NEU and CRP values were higher in the classic COVID-19 group in line with the meta-analysis when compared to the control group, they were found to be lower in the COVID-19 B.1.1.7 variant group [12]. In their meta-analysis, Ji et al. reported that inflammatory markers increased according to the severity of COVID-19. In this study, inflammatory markers WBC, CRP and PCT were found to be lower in the COVID-19 B.1.1.7 variant group compared to the classical COVID-19 group. Therefore, this study suggests that the prognosis of the COVID-19 B.1.1.7 variant is milder than that of the classic COVID-19 group, similar to the results of the meta-analysis by Ji et al. [20].
In the present study, the most commonly used drug was found to be Favipiravir in the treatment of COVID-19 patients. Hydroxychloroquine was used in limited cases. Although their use was controversial at the beginning of the pandemic, these drugs were used widely for treatment as the experience was gained in time, and were added to the treatment with steroids in some patients within the indication.
When the comorbid disease states of COVID-19 cases were examined in this study, the most common comorbid diseases were found to be systemic hypertension, Diabetes mellitus, congestive heart disease, ischemic heart disease, chronic renal disease, cancer, cerebrovascular events, and chronic obstructive pulmonary disease [1, 21], [22], [23], [24], [25]. Fever, cough, shortness of breath, and fatigue were the most common symptoms in the symptomatology. One of the hospitalized cases died of all these additional diseases and symptoms. One case that was recorded was an intubated patient who had bilateral lung involvement and died as a result of cardiac ischemia and respiratory failure with ischemic heart disease comorbidity.
The limitation of this study was the small sampling size. We included all COVID-19 patients who met the diagnostic criteria and were hospitalized due to the variant. Could the COVID-19 B.1.1.7 variant group accompany by undiagnosed diseases cause the deterioration of pneumonia? Does it play a role in the pathogenesis of the disease? Comprehensive studies may be necessary in this regard.
Conclusions
The LDH/Albumin, LDH/Platelet and LDH/Lymphocyte ratios increased in COVID-19 B.1.1.7 variant patients. The LDH/Albumin, LDH/Lymphocyte ratios, ferritin and procalcitonin may be useful for clinicians in predicting the risk of progression to pneumonia in COVID-19 B.1.1.7 variant patients.
Acknowledgments
The author acknowledges the Department of Biochemistry Laboratory for their support.
-
Research funding: None declared.
-
Author contributions: All authors have accepted responsibility for the entire content of this manuscript and approved its submission.
-
Competing interests: Authors state no conflict of interest.
-
Informed consent: Informed consent was obtained from all individuals included in this study.
-
Ethical approval: The present study was designed retrospectively and was approved by the Ethics Committee of Ankara City Hospital (E2-21-857).
References
1. Organization, WH. Clinical management of severe acute respiratory infection ( SARI) when COVID-19 disease is suspected: interim guidance, 13 March 2020. World Health Organization; 2020. https://apps.who.int/iris/bitstream/handle/10665/331446/WHO-2019-nCoV-clinical-2020.4-eng.pdf?sequence=1&isAllowed=y.Suche in Google Scholar
2. Harvey, WT, Carabelli, AM, Jackson, B, Gupta, RK, Thomson, EC, Harrison, EM, et al.. SARS-CoV-2 variants, spike mutations and immune escape. Nat Rev Microbiol 2021;19:409–24. https://doi.org/10.1038/s41579-021-00573-0.Suche in Google Scholar PubMed PubMed Central
3. Vaidyanathan, G. Coronavirus variants are spreading in India—what scientists know so far. Nature 2021;593:321–2. https://doi.org/10.1038/d41586-021-01274-7.Suche in Google Scholar PubMed
4. Faria, NR, Mellan, TA, Whittaker, C, Claro, IM, Candido, DdS, Mishra, S, et al.. Genomics and epidemiology of the P. 1 SARS-CoV-2 lineage in Manaus, Brazil. Science 2021;372:815–21.10.1126/science.abh2644Suche in Google Scholar PubMed PubMed Central
5. Tegally, H, Wilkinson, E, Giovanetti, M, Iranzadeh, A, Fonseca, V, Giandhari, J, et al.. Detection of a SARS-CoV-2 variant of concern in South Africa. Nature 2021;592:438–43.10.1038/s41586-021-03402-9Suche in Google Scholar PubMed
6. Volz, E, Mishra, S, Chand, M, Barrett, JC, Johnson, R, Geidelberg, L, et al.. Assessing transmissibility of SARS-CoV-2 lineage B. 1.1. 7 in England. Nature 2021;593:266–9.10.1038/s41586-021-03470-xSuche in Google Scholar PubMed
7. Lax, SF, Skok, K, Zechner, P, Kessler, HH, Kaufmann, N, Koelblinger, C, et al.. Pulmonary arterial thrombosis in COVID-19 with fatal outcome: results from a prospective, single-center, clinicopathologic case series. Ann Intern Med 2020;173:350–61. https://doi.org/10.7326/m20-2566.Suche in Google Scholar PubMed PubMed Central
8. Garibaldi, BT, Fiksel, J, Muschelli, J, Robinson, ML, Rouhizadeh, M, Perin, J, et al.. Patient trajectories among persons hospitalized for COVID-19: a cohort study. Ann Intern Med 2021;174:33–41. https://doi.org/10.7326/m20-3905.Suche in Google Scholar
9. Tao, R-J, Luo, X-L, Xu, W, Mao, B, Dai, R-X, Li, C-W, et al.. Viral infection in community acquired pneumonia patients with fever: a prospective observational study. J Thoracic Dis 2018;10:4387. https://doi.org/10.21037/jtd.2018.06.33.Suche in Google Scholar PubMed PubMed Central
10. Control CfD, Prevention. People who are at higher risk for severe illness; 2020. Available at: https://www.cdc.gov/coronavirus/2019-ncov/community/guidance-business-response.html2020.Suche in Google Scholar
11. Cai, Q, Chen, F, Wang, T, Luo, F, Liu, X, Wu, Q, et al.. Obesity and COVID-19 severity in a designated hospital in Shenzhen, China. Diab Care 2020;43:1392–8.10.2337/dc20-0576Suche in Google Scholar PubMed
12. Henry, BM, Aggarwal, G, Wong, J, Benoit, S, Vikse, J, Plebani, M, et al.. Lactate dehydrogenase levels predict coronavirus disease 2019 (COVID-19) severity and mortality: a pooled analysis. Am J Emerg Med 2020;38:1722–6. https://doi.org/10.1016/j.ajem.2020.05.073.Suche in Google Scholar PubMed PubMed Central
13. Martinez-Outschoorn, UE, Prisco, M, Ertel, A, Tsirigos, A, Lin, Z, Pavlides, S, et al.. Ketones and lactate increase cancer cell “stemness,” driving recurrence, metastasis and poor clinical outcome in breast cancer: achieving personalized medicine via Metabolo-Genomics. Cell Cycle 2011;10:1271–86. https://doi.org/10.4161/cc.10.8.15330.Suche in Google Scholar PubMed PubMed Central
14. Zhu, Y, Du, Z, Zhu, Y, Li, W, Miao, H, Li, Z. Evaluation of organ function in patients with severe COVID-19 infections. Med Clin 2020;155:191–6. https://doi.org/10.1016/j.medcli.2020.05.012.Suche in Google Scholar PubMed PubMed Central
15. Poggiali, E, Zaino, D, Immovilli, P, Rovero, L, Losi, G, Dacrema, A, et al.. Lactate dehydrogenase and C-reactive protein as predictors of respiratory failure in CoVID-19 patients. Clin Chim Acta Int J Clin Chem 2020;509:135–8. https://doi.org/10.1016/j.cca.2020.06.012.Suche in Google Scholar PubMed PubMed Central
16. Akbari, H, Tabrizi, R, Lankarani, KB, Aria, H, Vakili, S, Asadian, F, et al.. The role of cytokine profile and lymphocyte subsets in the severity of coronavirus disease 2019 (COVID-19): a systematic review and meta-analysis. Life Sci 2020;258:118167. https://doi.org/10.1016/j.lfs.2020.118167.Suche in Google Scholar PubMed PubMed Central
17. Serin, I, Sari, ND, Dogu, MH, Acikel, SD, Babur, G, Ulusoy, A, et al.. A new parameter in COVID-19. Pandemic: initial lactate dehydrogenase (LDH)/lymphocyte ratio for diagnosis and mortality. J Infect Public Health 2020;13:1664–70. https://doi.org/10.1016/j.jiph.2020.09.009.Suche in Google Scholar PubMed PubMed Central
18. Bastug, A, Bodur, H, Erdogan, S, Gokcinar, D, Kazancioglu, S, Kosovali, BD, et al.. Clinical and laboratory features of COVID-19: predictors of severe prognosis. Int Immunopharmacol 2020;88:106950. https://doi.org/10.1016/j.intimp.2020.106950.Suche in Google Scholar PubMed PubMed Central
19. Lei, F, Liu, YM, Zhou, F, Qin, JJ, Zhang, P, Zhu, L, et al.. Longitudinal association between markers of liver injury and mortality in COVID-19 in China. Hepatology 2020;72:389–98. https://doi.org/10.1002/hep.31301.Suche in Google Scholar PubMed PubMed Central
20. Ji, P, Zhu, J, Zhong, Z, Li, H, Pang, J, Li, B, et al.. Association of elevated inflammatory markers and severe COVID-19: a meta-analysis. Medicine (Baltimore) 2020;99:e23315. https://doi.org/10.1097/md.0000000000023315.Suche in Google Scholar
21. Martins-Filho, PR, Tavares, CSS, Santos, VS. Factors associated with mortality in patients with COVID-19. A quantitative evidence synthesis of clinical and laboratory data. Eur J Intern Med 2020;76:97. https://doi.org/10.1016/j.ejim.2020.04.043.Suche in Google Scholar PubMed PubMed Central
22. Tian, S, Liu, H, Liao, M, Wu, Y, Yang, C, Cai, Y, et al.. Analysis of Mortality in Patients With COVID-19: Clinical and Laboratory Parameters. Open Forum Infect Dis 2020;7:ofaa152. https://doi.org/10.1093/ofid/ofaa152.Suche in Google Scholar PubMed PubMed Central
23. Li, M. Chest CT features and their role in COVID-19. Radiol Infect Dis 2020;7:51–4. https://doi.org/10.1016/j.jrid.2020.04.001.Suche in Google Scholar PubMed PubMed Central
24. Bhatraju, PK, Ghassemieh, BJ, Nichols, M, Kim, R, Jerome, KR, Nalla, AK, et al.. Covid-19 in critically ill patients in the Seattle region—case series. New Engl J Med 2020;382:2012–22. https://doi.org/10.1056/nejmoa2004500.Suche in Google Scholar
25. Arentz, M, Yim, E, Klaff, L, Lokhandwala, S, Riedo, FX, Chong, M, et al.. Characteristics and outcomes of 21 critically ill patients with COVID-19 in Washington State. Jama 2020;323:1612–4. https://doi.org/10.1001/jama.2020.4326.Suche in Google Scholar PubMed PubMed Central
© 2022 the author(s), published by De Gruyter, Berlin/Boston
This work is licensed under the Creative Commons Attribution 4.0 International License.
Artikel in diesem Heft
- Frontmatter
- Editorial
- COP27 climate change conference: urgent action needed for Africa and the world
- Review Article
- Clinical laboratory use of liquid chromatography mass spectrometry
- Research Articles
- Verification of enzymatic ethanol analysis method and method comparison with headspace gas chromatography
- Investigation of GHRL (rs4684677), FTO (rs8044769) and PGC1Α (rs8192678) polymorphisms in type 2 diabetic Turkish population
- Roles of OLR1 and IL17A variants on clinical phenotypes of Turkish patients undergoing coronary artery bypass surgery
- Cytokine gene polymorphism frequencies in Turkish population living in Marmara region
- Evaluation of BRCA1/2 gene mutations in patients with high-risk breast and/or ovarian cancer in Turkey
- Impacts of long noncoding RNA MALAT1 on LPS-induced periodontitis via modulating miR-155/SIRT1 axis
- Proteomics characterization of the adenovirus VA1 non-coding RNA on the landscape of cellular proteome
- Modulatory effect of pomegranate extract on TRPA1, TRPM2 and caspase-3 expressions in colorectal cancer induction of mice
- EpCAM is critical for tumor proliferation and oxaliplatin chemoresistance in EpCAMhigh/CD44+ colorectal cancer stem cells
- Prognostic factors in thrombotic thrombocytopenic purpura
- Possible effects of clinoptilolite on small intestinal ischemia-reperfusion injury caused by experimental mesenteric artery occlusion
- The relationship between pregnancies complicated with fetal growth restriction and umbilical cord blood endocan concentrations
- Sildenafil for the treatment of necrotizing enterocolitis: an experimental study
- The importance of LDH/Albumin, LDH/Lymphocyte, and LDH/Platelet ratios in the evaluation of COVID-19 B.1.1.7 variant
- The relationship between serum vitamin D and antibody response following two doses of inactivated COVID-19 vaccine
- The relationship between plasminogen activator inhibitor-1 levels and the course of disease in COVID-19 patients
- Could tear be an alternative specimen for SARS-CoV-2 detection?
- Case Report
- A case of falsely elevated D-dimer result