Performance and estimation of the true error rate of classification rules built with additional information. An application to a cancer trial
-
David Conde


Abstract
Classification rules that incorporate additional information usually present in discrimination problems are receiving certain attention during the last years as they perform better than the usual rules. Fernández, M. A., C. Rueda and B. Salvador (2006): “Incorporating additional information to normal linear discriminant rules,” J. Am. Stat. Assoc., 101, 569–577, proved that these rules have lower total misclassification probability than the usual Fisher’s rule. In this paper we consider two issues; on the one hand, we compare these rules with those based on shrinkage estimators of the mean proposed by Tong, T., L. Chen and H. Zhao (2012): “Improved mean estimation and its application to diagonal discriminant analysis,” Bioinformatics, 28(4): 531–537. with regard to four criteria: total misclassification probability, area under ROC curve, well-calibratedness and refinement; on the other hand, we consider the estimation of the true error rate, which is a very interesting parameter in applications. We prove results on the apparent error rate of the rules that expose the need of new estimators of their true error rate. We propose four such new estimators. Two of them are defined incorporating the additional information into the leave-one-out-bootstrap. The other two are the corresponding cross-validation after bootstrap versions. We compare these estimators with the usual ones in a simulation study and in a cancer trial application, showing the good behavior of the rules that incorporate additional information and of the new leave-one-out bootstrap estimators of their true error rate.
This research was partially supported by Spanish DGES grant MTM2012-37129. We thank the anonymous reviewers for several useful comments which improved this manuscript.
Appendix
The expected apparent error rate for Π1 is

For the proof of Theorem 1 we will need a previous result:
Lemma 3

Proof. In order to make the proof clearer and to remark the dependence of  on
on  and
and  during the proof we will write
  as
as  It is easy to check that

so that
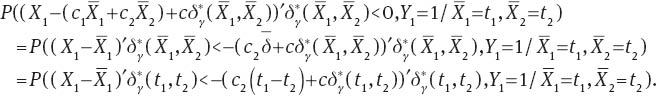
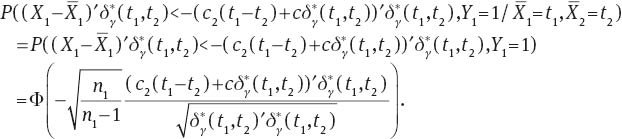
Now, 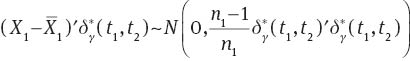 is an ancillary statistic as its distribution does not depend on μ1 or μ2. As
  is sufficient and complete, from Basu’s theorem we have that
  and
and  are independent. From this fact we have that
See Lehmann and Casella (1998: p. 93) for the same argument in a similar situation. ■
In a similar way, for Π2 we have

and

Following the same lines we can also prove that for Fisher’s rule

and

Now we are ready to prove Theorem 1:
Proof of Theorem. As n1=n2 we have that  and c=0. Now,
  and
and  so taking into account Theorem 1.3.2 in Robertson et al. (1988),
 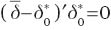 and
and 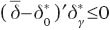 From this,
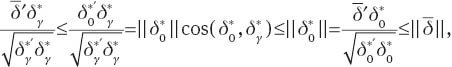
and the result follows from Lemma 3. ■
References
Beran, R. and L. Dümbgen (2010): “Least squares and shrinkage estimation under bimonotonicity constraints,” Stat. Comput., 20(2), 177–189.Suche in Google Scholar
Braga-Neto, U. M. and E. R. Dougherty (2004): “Is cross-validation valid for small-sample microarray classification?,” Bioinformatics, 20, 374–380.10.1093/bioinformatics/btg419Suche in Google Scholar PubMed
Conde, D., M. A. Fernández, C. Rueda and B. Salvador (2012): “Classification of samples into two or more ordered populations with application to a cancer trial,” Stat. Med., 31(28), 3773–3786.Suche in Google Scholar
Dettling, M. (2005): “Bagboosting for tumor classification with gene expression data,” Bioinformatics, 20, 3583–3593.10.1093/bioinformatics/bth447Suche in Google Scholar PubMed
Dudoit, S., J. Fridlyand and T. P. Speed (2002): “Comparison of discrimination methods for the classification of tumor using gene expression data,” J. Am. Stat. Assoc., 97, 77–87.Suche in Google Scholar
Efron, B. (1983): “Estimating the error rate of a prediction rule: Improvement on cross-validation,” J. Am. Stat. Assoc., 78, 316–331.Suche in Google Scholar
Efron, B. and R. Tibshirani (1997): “Improvement on cross-validation: the 632+bootstrap method,” J. Am. Stat. Assoc., 92, 548–560.Suche in Google Scholar
Faraggi, D. and B. Reiser (2002): “Estimation of the area under the ROC curve,” Stat. Med., 21(20), 3093–3106.Suche in Google Scholar
Fernández, M. A., C. Rueda and B. Salvador (2006): “Incorporating additional information to normal linear discriminant rules,” J. Am. Stat. Assoc., 101, 569–577.Suche in Google Scholar
Fu, W. J., R. J. Carroll and S. Wang (2005): “Estimating misclassification error with small samples via bootstrap cross-validation,” Bioinformatics, 21, 1979–1986.10.1093/bioinformatics/bti294Suche in Google Scholar PubMed
Graf, A. C. and P. Bauer (2009): “Model selection based on FDR-thresholding optimizing the area under the ROC-curve,” Stat. Appl. Genet. Mol. Biol., 8(1), 1–20.Suche in Google Scholar
Kim, J. H. (2009): “Estimating classification error rate: repeated cross-validation, repeated hold-out and bootstrap,” Comput. Stat. Data An., 53(11), 3735–3745.10.1016/j.csda.2009.04.009Suche in Google Scholar
Kim, J. and E. Cha (2006): “Estimating prediction errors in binary classification problem: Cross-validation versus bootstrap,” Korean Commun. Stat., 13, 151–165.Suche in Google Scholar
Kim, K. I. and R. Simon (2011): “Probabilistic classifiers with high-dimensional data,” Biostatistics, 12(3), 399–412.10.1093/biostatistics/kxq069Suche in Google Scholar PubMed PubMed Central
Lachenbruch, P. and M. Mickey (1968): “Estimation of error rates in discriminant analysis,” Technometrics, 10, 167–178.10.1080/00401706.1968.10490530Suche in Google Scholar
Lee, J. W., J. B. Lee, M. Park and S. H. Song (2005): “An extensive comparison of recent classification tools applied microarray data,” Comput. Stat. Data An., 48(4), 869–885.10.1016/j.csda.2004.03.017Suche in Google Scholar
Lehmann, E. L. and G. Casella (1998): Theory of Point Estimation, 2nd edition. New York: Springer-Verlag.Suche in Google Scholar
Lin, D., Z. Shkedy, D. Yekutieli, T. Burzykowski, H. W. H. Göhlmann, A. De Bondt, T. Perera, T. Geerts and L. Bijnens (2007): “Testing for trends in dose-response microarray experiments: a comparison of several testing procedures, multiplicity and resampling-based inference,” Stat. Appl. Genet. Mol. Biol., 6(1), article 26.Suche in Google Scholar
Long, T. and R. D. Gupta (1998): “Alternative linear classification rules under order restrictions,” Commun. Stat. A-Theor, 27, 559–575.Suche in Google Scholar
McLachlan, G. J. (1976): “The bias of the apparent error rate in discriminant analysis,” Biometrika, 63, 239–244.10.1093/biomet/63.2.239Suche in Google Scholar
Molinaro, A. M., R. Simon and R. M. Pfeiffer (2005): “Prediction error estimation: a comparison of resampling methods,” Bioinformatics, 15, 3301–3307.10.1093/bioinformatics/bti499Suche in Google Scholar PubMed
Oh, M. S. and D. W. Shin (2011): “A unified Bayesian inference on treatment means with order constraints,” Comput. Stat. Data An., 55(1), 924–934.10.1016/j.csda.2010.07.026Suche in Google Scholar
Pepe, M. S., H. Janes, G. Longton, W. Leisenring and P. Newcomb (2004): “Limitations of the odds ratio in gauging the performance of a diagnostic, prognostic, or screening marker,” Am. J. Epidemiol., 159, 882–890.Suche in Google Scholar
Pepe, M. S., T. Cai and G. Longton (2006): “Combining predictors for classification using the area under the receiver operating characteristic curve,” Biometrics, 62(1), 221–229.10.1111/j.1541-0420.2005.00420.xSuche in Google Scholar PubMed
Robertson, T., F. T. Wright and R. L. Dykstra (1988): Order Restricted Statistical Inference, New York: Wiley.Suche in Google Scholar
Salvador, B., M. A. Fernández, I. Martn and C. Rueda (2008): “Robustness of classification rules that incorporate additional information,” Comput. Stat. Data An., 52(5), 2489–2495.10.1016/j.csda.2007.08.017Suche in Google Scholar
Schiavo, R. A. and D. J. Hand (2000): “Ten more years of error rate research,” Int. Stat. Rev., 68, 295–310.Suche in Google Scholar
Silvapulle, M. J. and P. K. Sen (2005): Constrained Statistical Inference, New Jersey: John Wiley & Sons.Suche in Google Scholar
Simmons, S. and S. D. Peddada (2007): “Order-restricted inference for ordered gene expression (ORIOGEN) data under heteroscedastic variances,” Bioinformation, 1, 414–419.10.6026/97320630001414Suche in Google Scholar PubMed PubMed Central
Steele, B. M. and D. A. Patterson (2000): “Ideal bootstrap estimation of expected prediction error for k-nearest neighbor classifiers: applications for classification and error assessment,” Stat. Comput., 10(4), 349–355.Suche in Google Scholar
Tong, T., L. Chen and H. Zhao (2012): “Improved mean estimation and its application to diagonal discriminant analysis,” Bioinformatics, 28(4): 531–537.10.1093/bioinformatics/btr690Suche in Google Scholar PubMed PubMed Central
UICC (2009): TNM Classification of Malignant Tumours, 7th edition. New Jersey: Wiley-Blackwell.Suche in Google Scholar
Wehberg, S. and M. Schumacher (2004): “A comparison of nonparametric error rate estimation methods in classification problems,” Biometrical J., 46, 35–47.Suche in Google Scholar
©2013 by Walter de Gruyter Berlin Boston
Artikel in diesem Heft
- Masthead
- Masthead
- Research Articles
- Simultaneous inference and clustering of transcriptional dynamics in gene regulatory networks
- Markov chain Monte Carlo sampling of gene genealogies conditional on unphased SNP genotype data
- Performance and estimation of the true error rate of classification rules built with additional information. An application to a cancer trial
- Optimizing threshold-schedules for sequential approximate Bayesian computation: applications to molecular systems
- Model selection for prognostic time-to-event gene signature discovery with applications in early breast cancer data
- Identifying clusters in genomics data by recursive partitioning