Abstract
Polystyrene/poly(methyl methacrylate) (PS/PMMA) blends in 80:20, 50:50, and 20:80 ratios with and without calcium carbonate nanoparticles were prepared. n-Pentane was then used to foam the samples in an autoclave. After the diffusion of n-pentane gas into the polymer matrix, the samples and the gas were simultaneously cooled to obtain the liquid n-pentane phase. Phase change to liquid provided the required pressure drop for cell nucleation and consequent cell growth. The solubility of n-pentane in the samples was measured. Liquid n-pentane trapped inside created micro- and nanopores, forming a foam with closed cells. Experiments were carried out in different compositions of the materials, with and without nanoparticles, and the cell morphologies were characterized. The results of this work show that nanocellular structures can be achieved when calcium carbonate nanoparticles are added to PS/PMMA blends.
1 Introduction
Thermoplastic foams have become very popular in recent years because of their many superior characteristics, such as low thermal conductivity, light weight, and high specific impact strength, compared to their solid counterparts [1]. Thermoplastic polymer foams are usually prepared using a blowing agent in a batch or continuous foaming process [2]. Usually, the blowing agent used is either chemical or physical [3]. Chemical blowing agents (CBAs) are physically mixed with the polymer powders before heating and melting the polymer [4]. In this process, by heating the mixture, the CBAs decompose and a mixture of polymer and gas is created. Finally, a polymer foam is produced when the pressure of the mixture is rapidly reduced. On the other hand, using physical blowing agent for preparing a polymer foam [5] involves the direct diffusion of a gas (e.g. carbon dioxide or nitrogen) into the polymer at a high pressure during the melting process, followed by a rapid reduction in pressure [6].
A typical foaming process involves three stages: production of a high-pressure polymer/gas mixture; rapid pressure drop and cell nucleation; and, finally, cell growth and solidification. Foams are classified in different ways [7]. They can be open-celled or closed-celled, depending on the cells’ interconnectivity. Open-cell foams consist of pores that are interconnected, which results in a softer and more absorbent material. In closed-cell foams, however, the pores are isolated from each other [8]. Polymer foams can also be classified on the basis of their density, cell size, cell density, and cell-wall thickness, all of which influence the properties of the foam. Cell sizes ranging from 0.1 to 5 mm are considered traditional foams. Microcellular foams have cell sizes ranging from 0.1 to 100 μm, whereas nanocellular foams have pores below 100 nm [9].
During the foaming process, in some applications, increasing the number of cells in the foam is usually of interest for researchers. Different strategies have been used to control the cell size and cell density of foams. Processing temperature, pressure, and pressure drop rate are three important parameters that affect the cellular morphology. A high processing temperature usually results in a low viscosity and consequently easy cell growth. Processing pressure has a significant effect on the amount of gas dissolved in the polymer, and this affects the cell density. Finally, the pressure drop rate controls the cell nucleation density [10]. Many researchers have used the pressure drop rate alone to control the morphology of their foams [11]. There are some other ways to control the morphology of foams. For example, having nanoparticles dispersed in the polymer matrix usually results in the creation of a high density of nucleation sites. Homogeneous dispersion of nanoparticles in the matrix was found to be a determining factor on the cell density [12].
For decades, chlorofluorocarbons (CFCs) and hydrochlorofluorocarbons (HCFCs) were used as blowing agents, but later they were banned because of their important role on the ozone layer depletion. Recently, supercritical carbon dioxide (sCO2) and supercritical nitrogen (sN2), due to their economical availability and not having any environmental impact, are being commonly used as blowing agents [13]. The solubility of carbon dioxide and nitrogen in the polymer matrix becomes significant when they are in supercritical phase, and this requires the application of a relatively high pressure on the gas/polymer mixture [14]. Usually, a sudden pressure drop is effected on the polymer/gas mixture to nucleate cells and propel cell growth [15]. In this study, we used a different material and strategy to produce polymer foam. n-Pentane, which has a boiling temperature of about 38°C, was used as the blowing agent. There was no need for the gas to be in supercritical phase, as it has a relatively high solubility in polystyrene (PS), poly(methyl methacrylate) (PMMA), and PS/PMMA blends. Also, there was no need for the application of a sudden pressure drop.
Cell nucleation occurs via two different classical mechanisms: homogeneous and heterogeneous. During homogeneous nucleation, concurrent initiation and growth of bubbles is achieved, leading to a uniform-sized cell distribution in the final structure [16], [17]. In this study, PS/PMMA/calcium carbonate foams were produced using n-pentane as the blowing agent and calcium carbonate as the nucleation agent. Effects of different compositions of the materials and calcium carbonate on the cell size and cell density at different temperatures were investigated.
2 Materials and methods
2.1 Materials
PMMA and PS were supplied by Tabriz petrochemical company (TPC), Iran. Table 1 shows the number-averaged (Mn) and weight-averaged (Mw) molecular weights and polydispersity index (PDI) of the used PMMA and PS in this study. n-Pentane (purity 99%, Merck, Germany) was used as the blowing agent, and tetrahydrofuran (THF; Merck) was used as the solvent for PS and PMMA. Calcium carbonate was obtained from Shell, India.
Properties of used PS and PMMA.
| PDI | Mn (g mol—1) | MW (g mol—1) | Sample (wt/wt) |
|---|---|---|---|
| 2.12 | 82,500 | 175,000 | PS |
| 2.904 | 298,340 | 866,530 | PMMA |
2.2 Preparation of PS/PMMA blends
Three different compositions of PS/PMMA blends with 80:20, 50:50, and 20:80 ratios were prepared. As mentioned, THF was used as the solvent for both PS and PMMA. Both materials (i.e. PS and PMMA), considering their weight percent in the composite, were weighed and dissolved in the solvent to prepare PS/PMMA blends. In the case of composites, calcium carbonate nanoparticles were dissolved separately in THF, and then both solutions were combined. A vacuum pump and an oven were used to dry the samples. Dispersion of the nanoparticles in the polymer matrix was studied using transmission electron microscopy (TEM).
2.3 Foaming of the samples
First, 0.5 mm layers of the samples were made using a hot-press. In this process, the samples (i.e. PS, PS80/PMMA20, PS50/PMMA50, PS20/PMMA80, and PMMA) were held under pressure for about 10 min at 90, 95, 100, 105, and 110°C, respectively. Because of the variation in the compositions of the samples, to obtain almost the same thickness for the samples, the process was carried out at different temperatures. The sheets of samples produced were cut into 2 mm×4 mm size and weighed. An autoclave was designed and used for foaming (Figure 1). The autoclave had a cavity for holding the samples. Two holes were provided in the autoclave: one for locating the samples in the cavity, and the other for connecting a pressure gage. The volume of the cavity in the chamber was measured, and the amount n-pentane needed, considering it as an ideal gas, to reach the required pressures in each test was calculated. The prepared samples and the calculated volume of n-pentane as the blowing agent were placed inside the autoclave and the holes were plugged. The autoclave was then heated to the desired processing temperature. During the test, the amount of used n-pentane in the chamber was adjusted to maintain the expected pressure, as read by the connected pressure gage.
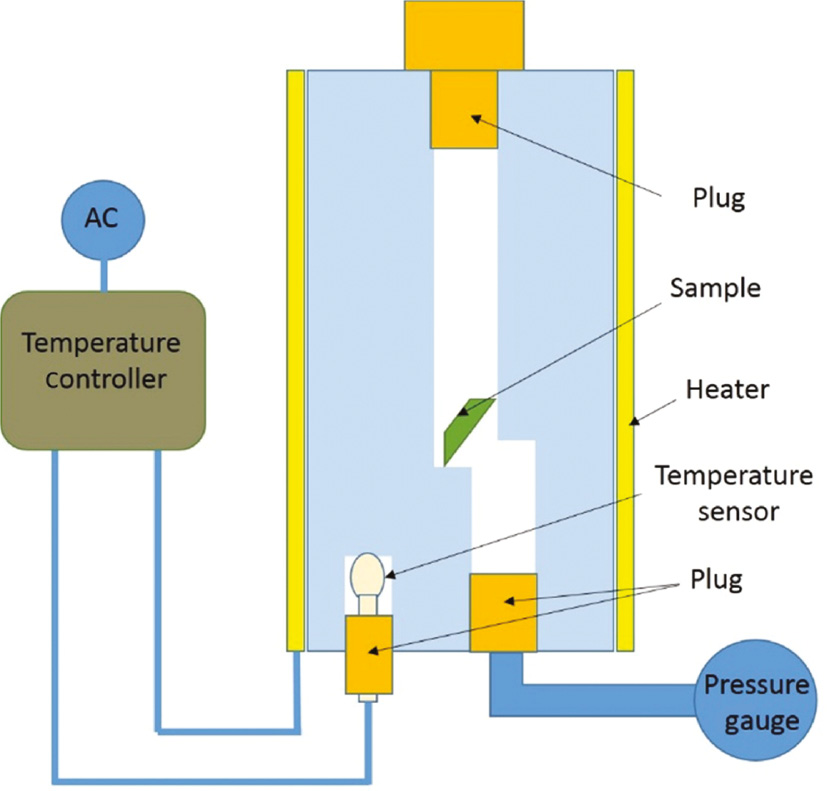
Designed autoclave for foaming.
To ensure complete dissolution of the gas in the polymer composites, the heated samples in the autoclave were held in the processing temperature for 7 h under the desired pressures. The temperature of the samples was controlled by using a temperature controller that was connected to the wall of the autoclave. Also, the chamber pressure was measured by the connected pressure gage. Finally, the heated autoclave was placed inside a water tank for 20–30 s to get the samples solidified. Then, the autoclave chamber was opened, and the foamed samples were taken out. Then, further morphological tests were carried out on the foamed samples [18], [19].
3 Results and discussion
In polymer foaming, the processing temperature is considered as one of the most influential parameters because of its strong effect on polymer viscosity, cell nucleation, and cell size. Polymer foams with a desired cell size and cell density can be achieved only if the processing temperature is selected suitably [20], [21]. According to the differential scanning calorimetry (DSC) results, the glass transition temperatures of the PS and PMMA samples were 100 and 116°C, respectively.
Viscosity of the polymer melt is one of the most critical parameters in the foaming process. Temperature significantly affects the viscosity. Low viscosity allows high cell growth and sometimes cell coalescence. On the other hand, high viscosity hinders cell growth [22], [23]. Hence, an appropriate value of viscosity should be selected to achieve the desired foam properties.
3.1 Dynamic mechanical analysis (DMA)
An experiment was carried out to analyze the variation of storage modulus for the samples when temperature was varied from 40 to 220°C. As shown in Figure 2, the storage modulus for PS and PS80/PMMA20 samples shows a huge drop when the temperate reaches 100°C. Some drop in the value of storage modulus is also seen at this temperature for PS50/PMMA50 and PS20/PMMA80 samples.
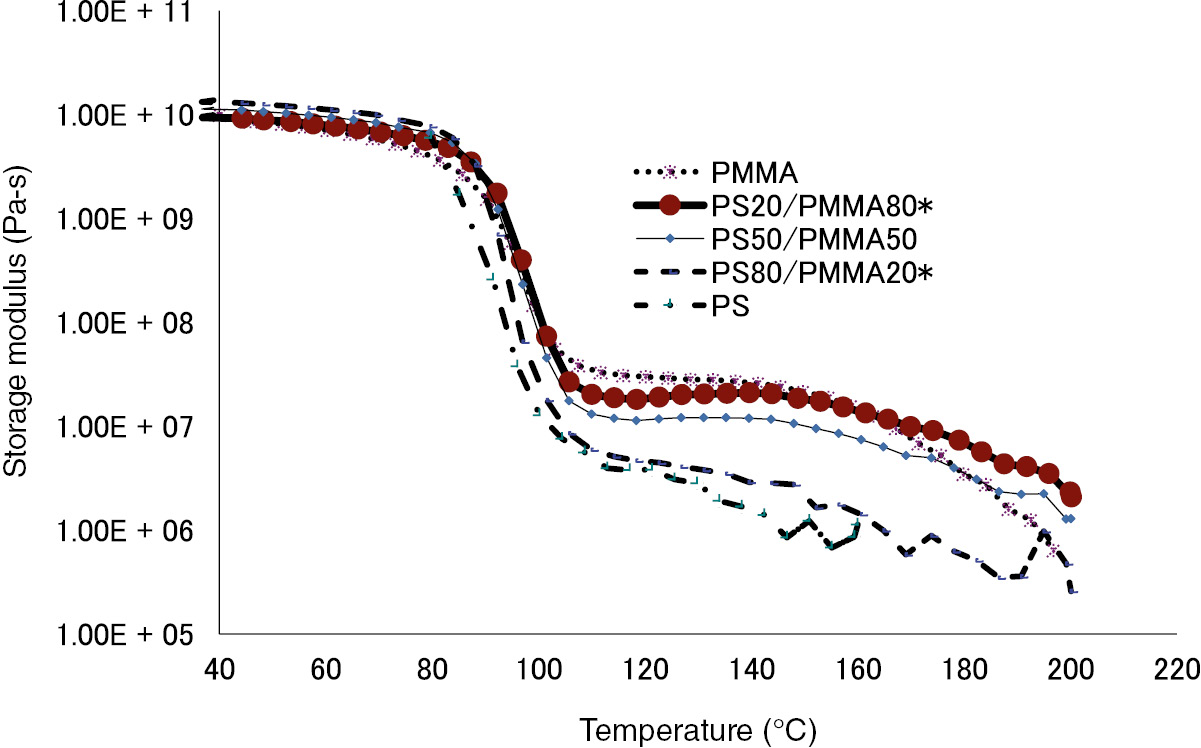
Storage modulus for PMMA, PS20/PMMA80, PS50/PMMA50, PS80/PMMA20, and PS.
3.2 Solubility measurements
The properties of a polymer foam produced in a batch process have a close connection with the amount of gas dissolved in the polymer matrix [24]. There are other parameters, such as temperature and pressure, that significantly affect the amount of saturated gas and consequently the properties of the produced foams. In this study, the effect of pressure and temperature on the solubility of n-pentane gas in the produced composites was investigated. Figure 3 shows the effect of pressure on the solubility of n-pentane gas in different composites.
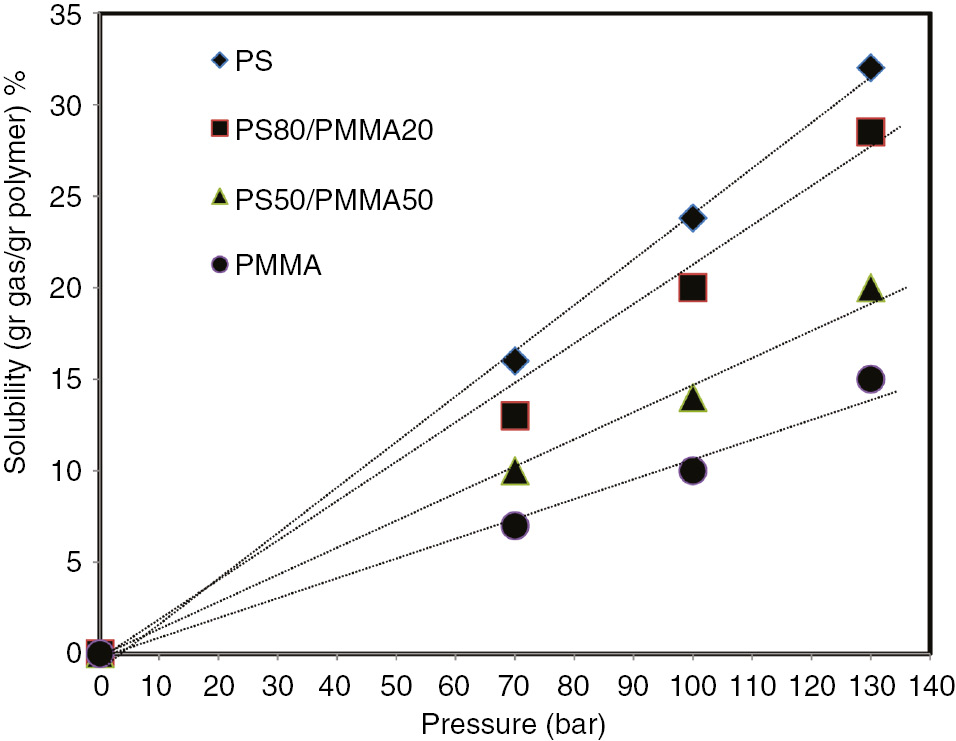
Solubility of n-pentane in the produced samples at a temperature of 100°C, at different pressures.
As Figure 3 shows, the solubility of n-pentane in all the samples increased as a function of the saturation pressure. This is consistent with the Henry’s solubility law. With the increase in pressure, the driving force of the translating gas into the polymer matrix increased [6], [25]. PS samples show a much higher capability to dissolve the gas compared to PMMA samples. This is because of the polarity of n-pentane and its affinity to PS.
Figure 4 shows the gas solubility in the produced samples at different temperatures. As can be seen, with the increase in temperature, the solubility decreased as a result of the increase in the molecular movement of the matrix. Also, when the amount of the PMMA is decreased, the solubility increases, which is related to the higher molecular weight of the PMMA compared to that of PS.
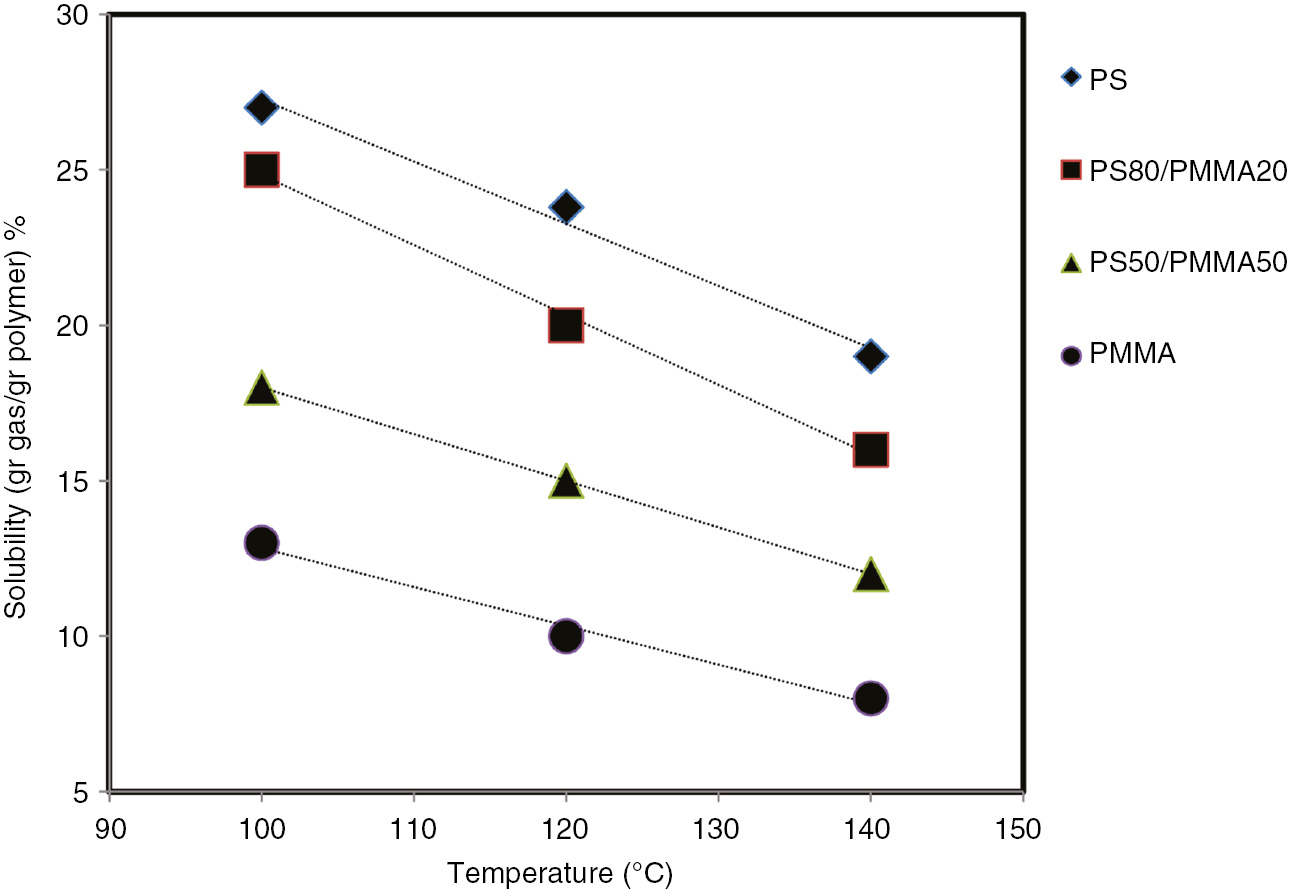
Temperature dependence of n-pentane solubility under 100 bar pressure.
3.3 Distribution of nanoparticles
Figure 5 shows the particle size and distribution of calcium carbonate nanoparticles in the composites. The TEM image, Figure 5, shows that calcium carbonate nanoparticles are well dispersed and stabilized in the matrix. The stabilization of calcium carbonate particles in PMMA is due to the presence of PMMA’s functional groups. The steric group is strongly associated with the calcium cation, which reduces their mobility. As a result, the calcium carbonate nanoparticles in the PMMA domain become stable. Because of the presence of a benzene ring in PS’s functional group, PS is nonpolar and does not have the tendency to bond with calcium carbonate nanoparticles. By increasing the percentage of nanoparticles, agglomeration was seen in the matrix.
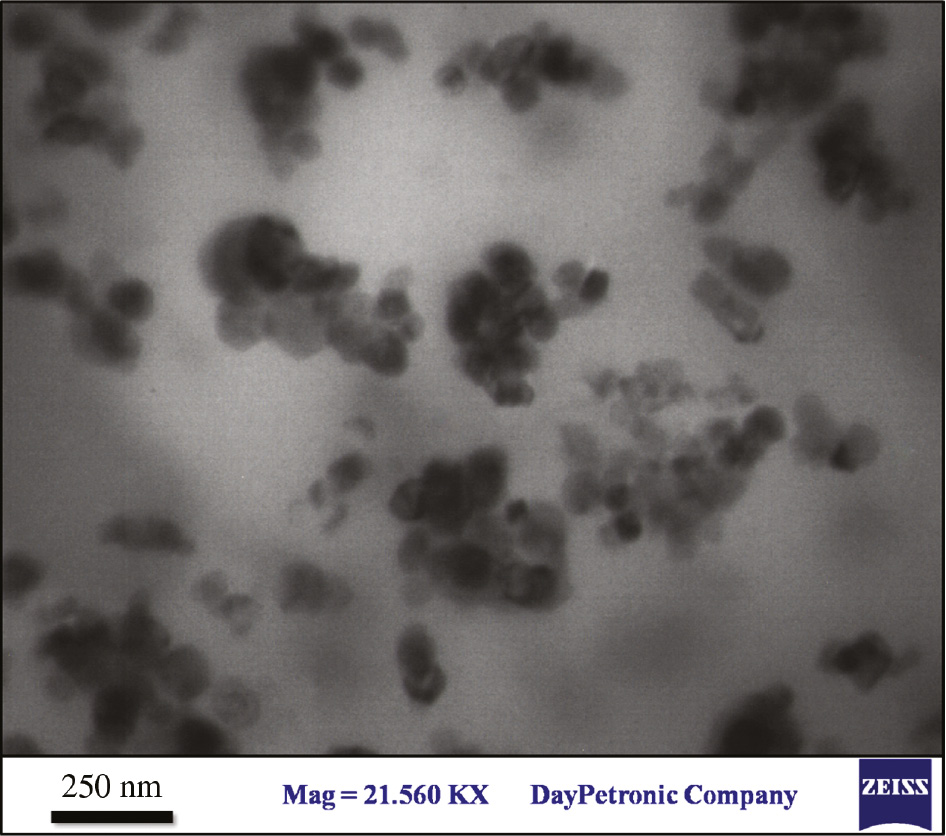
TEM images from PS80/PMMA20 with 5% calcium carbonate nanoparticles.
3.4 Foaming results
Figure 6A,B shows the SEM images of pure PS and PMMA foams processed at 90 and 110°C, respectively, under a pressure of 100 bar. The scale bar is 20 μm in both cases. The size of the cells in PS foam is much larger than that of the cells in PMMA foams. This can be due to their differences in viscosity during cell growth [26], [27]. Also, as shown in Figure 3, PS has a much higher gas solubility compared to PMMA, and this can be the other reason for the differences in cell morphology. For better understanding of these foam morphologies, the graph of their cell size distributions was extracted, as shown in Figure 6C. While 78% of the cells in PS foams have a cell size of 1–2 μm, only 5% of the cells in PMMA foams have the same range of cell sizes. On the other hand, while in PMMA foams 85% of the cells have size of 0.5–1 μm, in PS foams only 10% of the cell population has the same size. The variation in their viscosity is shown in Figure 2.
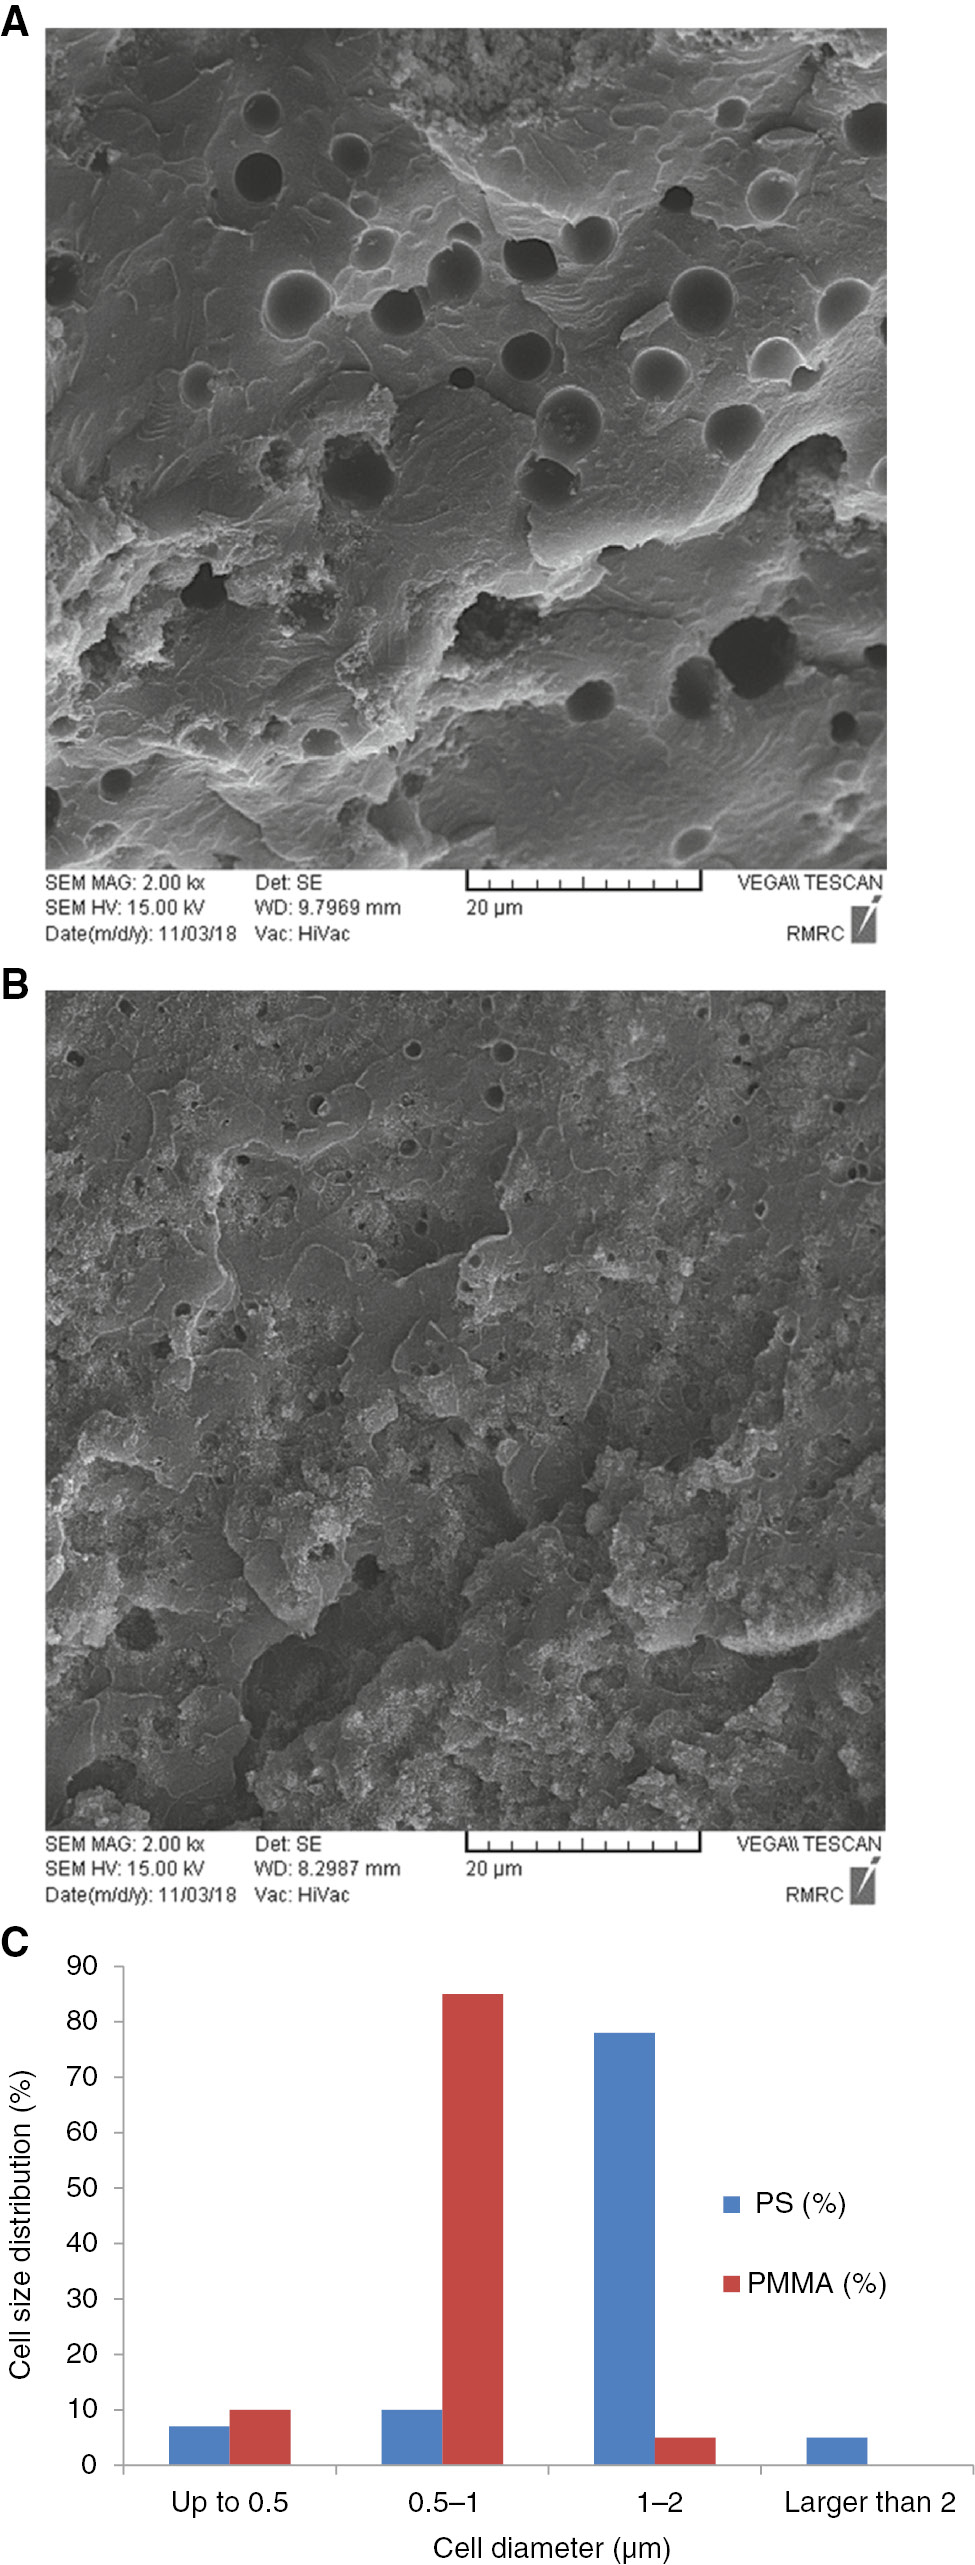
SEM images for pure (A) PS and (B) PMMA foams. (C) Cell size distribution for pure PS and PMMA foams.
Three compositions of PS/PMMA blends: PS80/PMMA20, PS50/PMMA50, and PS20/PMMA80, were foamed, and their SEM images are shown in Figure 7A–C. The processing temperatures for PS80/PMMA20, PS50/PMMA50, and PS20/PMMA80 were 95, 100, and 105°C, respectively, while their processing pressure was 100 bar. While the SEM image in the first row has a scale bar of 50 μm, those in second row have a scale bar of 20 μm for better clarity. The presented SEM images in these foams were quantified for obtaining the cell size distribution. Figure 7D shows the cell size distributions for PS80/PMMA20, PS50/PMMA50, and PS20/PMMA80, respectively. Below is the description of these produced samples.
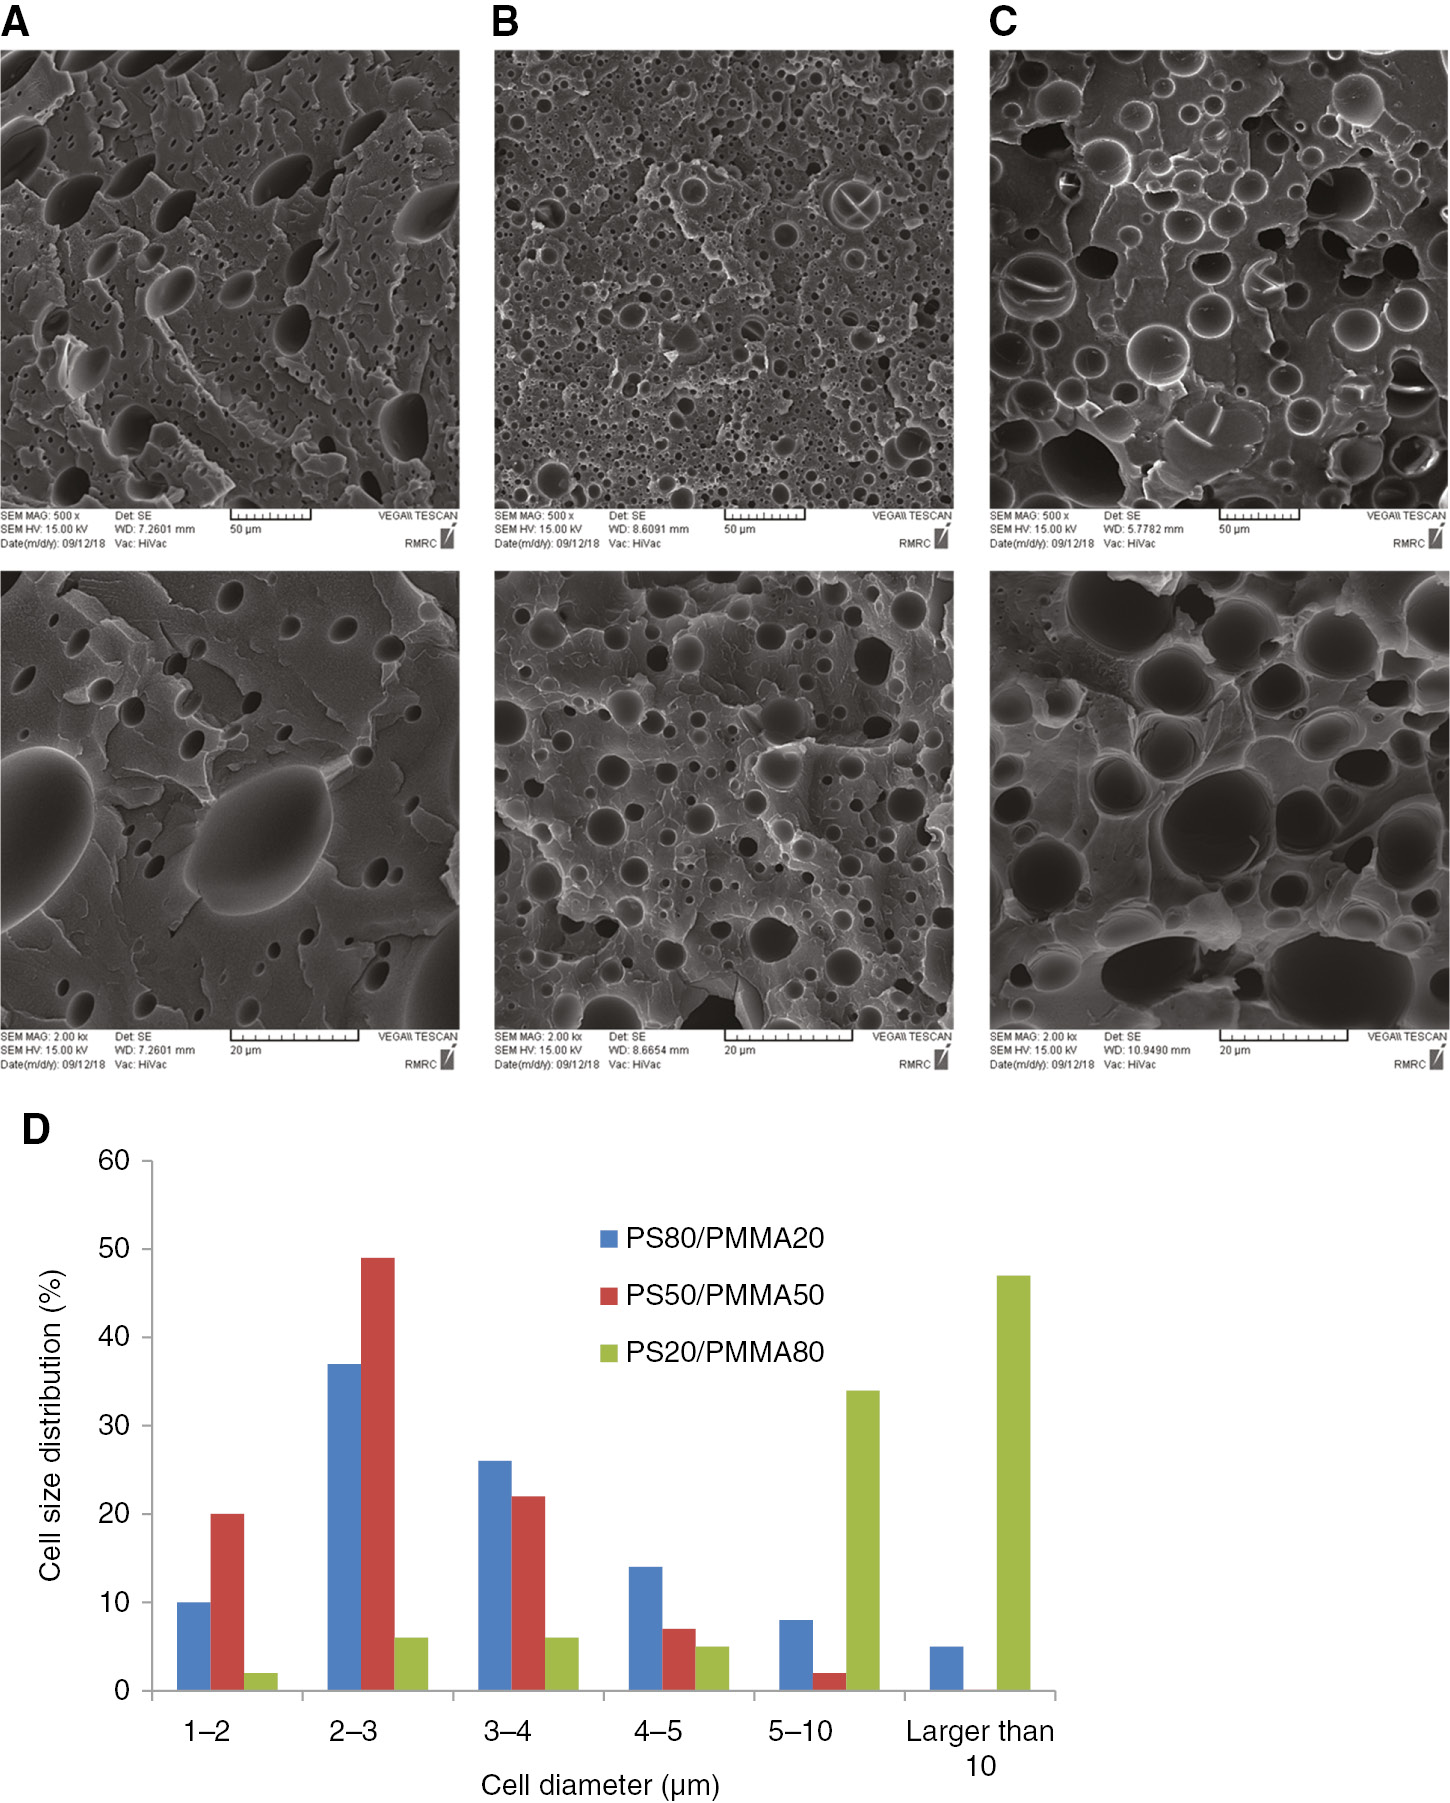
SEM images of the PS/PMMA blend foams (A) PS80/PMMA20, (B) PS50/PMMA50, and (C) PS20/PMMA80. (D) Cell size distributions of the foams.
In Figure 7, the majority of the cells (95%) in PS80/PMMA20 foam samples are in the range 1–10 μm and cells in the range 2–3 and 3–4 μm are due the two highest populations. In PS50/PMMA50 foam samples, all the cells are in the range 1–10 μm. Almost half of the cells (49%) lie in the range 2–3 μm, and cells in the range 1–2 and 3–4 μm are due to the two second highest populations. It seems that PS50/PMMA50 foam samples have the narrowest range of cell size distribution. Contribution of the cells in the range 1–4 μm is 91%. On other hand, in PS20/PMMA80 foams samples, all the cells are in the range 1–30 μm. In these samples, the majority of the cells (55%) are in the range 5–15 μm; the cells in the range 5–10 μm constitute 34% of the cell populations, and cells in the range 10–15 μm form 21% of the cell populations. Also, cells up to 5 μm contribute 19% of the population. The low solubility of n-pentane in PMMA and its high viscosity, compared to PS, are the two main reasons for cell morphology variations in PS80/PMMA20, PS50/PMMA50, and PS20/PMMA80 samples.
From the SEM images in Figure 7A–C, and from the results of image analysis, shown in Figure 7D, a very narrow cell size distribution is obtained for PS80/PMMA20 samples. Also, the cells in this composition are the smallest among all the compositions. It seems that during cell growth PS and PMMA balance each other, resulting in a relatively narrow cell size range and small cell size. PS80/PMMA20 samples were studied further in the presence of nanoparticles for obtaining samples with a smaller cell size and a higher cell population [26], [28].
Figure 8A shows the SEM image for PS80/PMMA20 foam sample when 5 wt% nanoparticles of calcium carbonate was added to the composite. The processing temperate and pressure for this sample were 100°C and 100 bar, respectively. Similar to the foam samples prepared without nanoparticles, these images also show some diversity, but it is significantly less than when processed without the nanoparticles. Figure 8B shows the cell size distribution for these samples. In PS80/PMMA20 foam samples with 5% nanoparticles of calcium carbonate, the majority of the cells (61%) are in the range 400–600 nm.
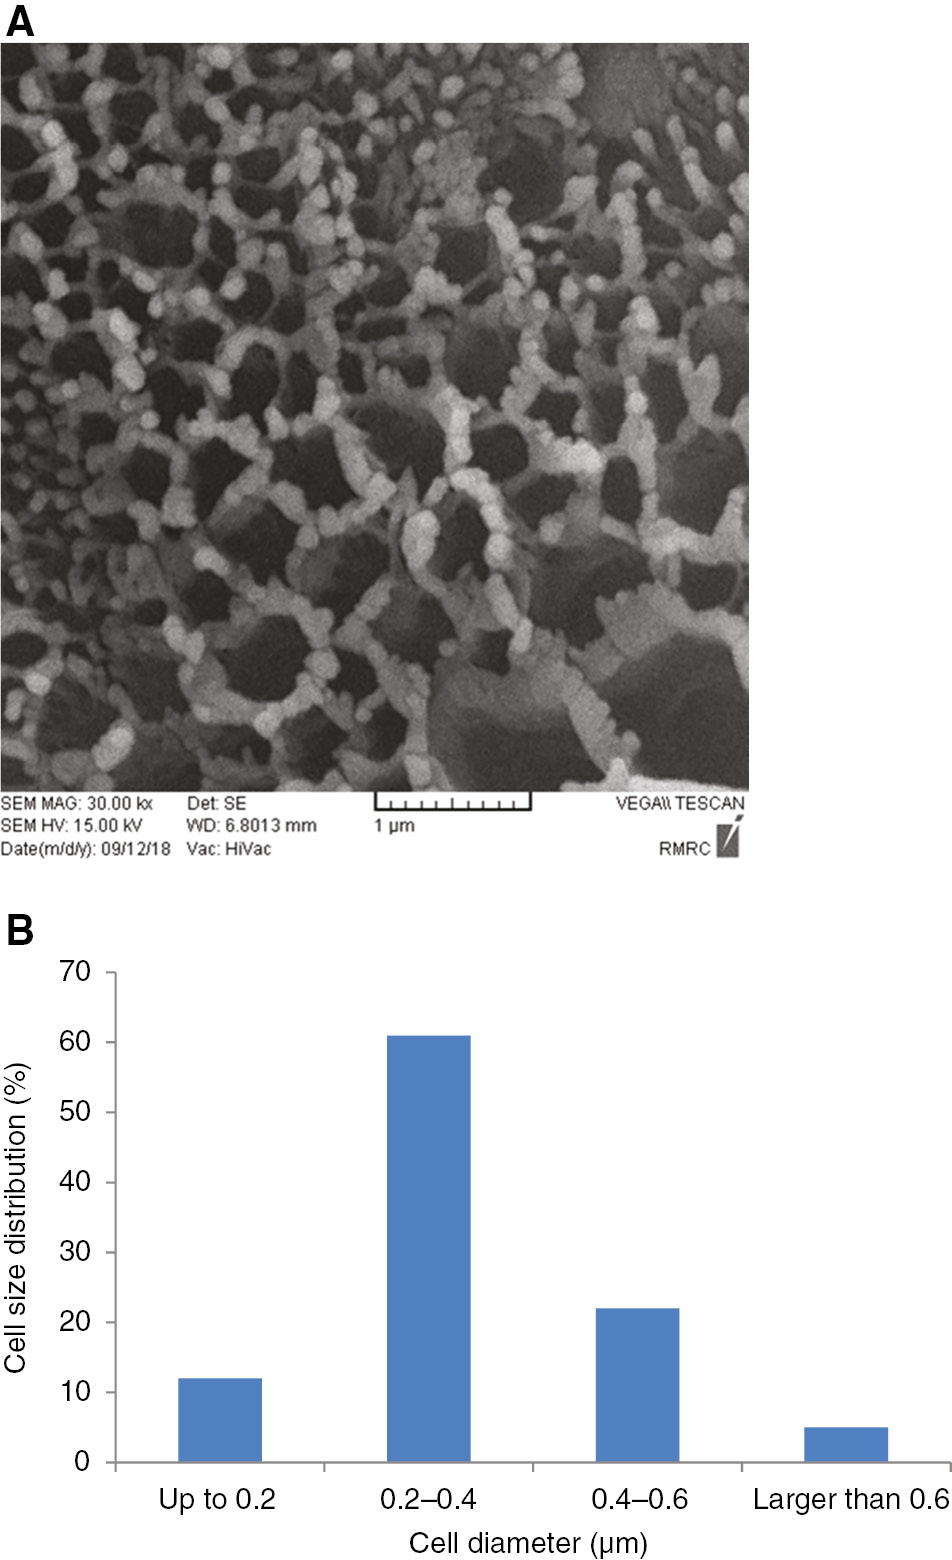
(A) SEM and (B) cell size distribution for PS50/PMMA50 foam samples when 5 wt% nanoparticles was added to the composite.
4 Conclusion
Different compositions of PS/PMMA (i.e. 80:20, 50:50, 20:80) with and without calcium carbonate nanoparticles were prepared. Solution method was used for the preparation of the blends and composites. The solubility of n-pentane in the composites was studied as a function of the temperature and pressure. It was concluded that with increase in temperature and PMMA content, the solubility of n-pentane decreased in the samples. A new strategy was thus proposed for foaming the samples. PS, PMMA, and the produced composites were foamed in a high-pressure chamber using the proposed method. The effects of composition and nanoparticles on the produced foams were studied. It was observed that the PS80/PMMA20 sample had a narrow cell distribution, and in this sample, with the addition of 5% nanoparticles, foams having cell size below 200 nm could be produced.
References
[1] Ahn DU, Wang Z, Campbell IP, Stoykovich MP, Ding Y. Polymer (Guildf) 2012, 53, 4187–4194.10.1016/j.polymer.2012.07.037Suche in Google Scholar
[2] Petrossian G, Hohimer JC, Ameli A. J. Polym. (Basel) 2019, 11, 280–289.10.3390/polym11020280Suche in Google Scholar PubMed PubMed Central
[3] Azimi HR, Rezaei M, Abbasi F. Thermochim. Acta 2009, 488, 43–48.10.1016/j.tca.2009.01.026Suche in Google Scholar
[4] Silva GG, De Freitas Rocha PM, De Oliveira PS, Neves BRA. Appl. Surf. Sci. 2004, 238, 64–72.10.1016/j.apsusc.2004.05.211Suche in Google Scholar
[5] Rende D, Schadler LS, Ozisik R. J. Chem. 2013, 2013, 1–13.10.1155/2013/864926Suche in Google Scholar
[6] Azimi H, Jahani D. J. Supercrit. Fluids 2018, 139, 30–37.10.1016/j.supflu.2018.05.010Suche in Google Scholar
[7] Chakkalakal GL, Abetz C, Vainio U, Handge UA, Abetz V. Polymer (Guildf) 2013, 54, 3860–3873.10.1016/j.polymer.2013.05.025Suche in Google Scholar
[8] Enayati MS, Famili M, Janani H. Iran. J. Polym. Sci. Technol. (In Persian) 2010, 23, 223–234.Suche in Google Scholar
[9] Prosycevas I, Tamulevicius S, Guobiene A. Thin Solid Films 2004, 453–454, 304–311.10.1016/j.tsf.2003.11.090Suche in Google Scholar
[10] Baltopoulos A, Athanasopoulos N, Fotiou I, Vavouliotis A, Kostopoulos V. Express Polym. Lett. 2013, 7, 40–54.10.3144/expresspolymlett.2013.4Suche in Google Scholar
[11] Jahani D, Ameli A, Jung PU, Barzegari MR, Park CB, Naguib H. Mater. Des. 2014, 53, 20–28.10.1016/j.matdes.2013.06.063Suche in Google Scholar
[12] Kim SG, Leung SN, Park CB, Sain M. Chem. Eng. Sci. 2011, 66, 3675–3686.10.1016/j.ces.2011.05.003Suche in Google Scholar
[13] Ding W, Jahani D, Chang E, Alemdar A, Park CB, Sain M. Compos. Part A Appl. Sci. Manuf. 2016, 83, 130–139.10.1016/j.compositesa.2015.10.003Suche in Google Scholar
[14] Jahani D, Ameli A, Saniei M, Ding W, Park CB, Naguib HE. Macromol. Mater. Eng. 2015, 300, 48–56.10.1002/mame.201400125Suche in Google Scholar
[15] Chu RKM, Mark LH, Jahani D, Park CB. J. Cell. Plast. 2015, 52, 619–641.10.1177/0021955X15592069Suche in Google Scholar
[16] Ameli A, Nofar M, Wang S, Park CB. ACS Appl. Mater. Interfaces 2014, 6, 11091–11100.10.1021/am500445gSuche in Google Scholar PubMed
[17] Zhai W, Yu J, Wu L, Ma W, He J. J. Polym. 2006, 47, 7580–7589.10.1016/j.polymer.2006.08.034Suche in Google Scholar
[18] Tjong SC. Mater. Sci. Eng. R Rep. 2006, 53, 73–197.10.1016/j.mser.2006.06.001Suche in Google Scholar
[19] Ruiz JAR, Pedros M, Tallon JM, Dumon M. J. Supercrit. Fluids 2011, 58, 168–176.10.1016/j.supflu.2011.04.022Suche in Google Scholar
[20] Park CB, Behravesh AH, Venter RD. Polym. Eng. Sci. 1998, 38, 1812–1823.10.1002/pen.10351Suche in Google Scholar
[21] Nguyen TH, Vayer M, Sinturel C. Appl. Surf. Sci. 2018, 427, 464–470.10.1016/j.apsusc.2017.08.160Suche in Google Scholar
[22] Yee M, Calvão PS, Demarquette NR. Rheol. Acta 2007, 46, 653–664.10.1007/s00397-006-0154-7Suche in Google Scholar
[23] Echlin P. Handbook of Sample Preparation for Scanning Electron Microscopy and X-Ray Microanalysis, Springer: New York, NY, 2009.10.1007/978-0-387-85731-2Suche in Google Scholar
[24] Sharudin RW, Alwi H, Ohshima M. Adv. Mater. Res. 2013, 701, 17–22.10.4028/www.scientific.net/AMR.701.17Suche in Google Scholar
[25] Tuladhar TR, Mackley MR. Chem. Eng. Sci. 2004, 59, 5997–6014.10.1016/j.ces.2004.07.054Suche in Google Scholar
[26] Urbanczyk L, Calberg C, Detrembleur C, Jérôme C, Alexandre M. Polymer (Guildf) 2010, 51, 3520–3531.10.1016/j.polymer.2010.05.037Suche in Google Scholar
[27] Taki K, Yanagimoto T, Funami E, Okamoto M, Ohshima M. Polym. Eng. Sci. 2004, 44, 1004–1011.10.1002/pen.20093Suche in Google Scholar
[28] Wan C, Sun G, Gao F, Liu T, Esseghir M, Zhao L, Yuan W. J. Supercrit. Fluids 2017, 120, 421–431.10.1016/j.supflu.2016.05.038Suche in Google Scholar
©2019 Walter de Gruyter GmbH, Berlin/Boston
Artikel in diesem Heft
- Frontmatter
- Material properties
- Characterization and corrosion resistance of ultra-high molecular weight polyethylene composite coatings reinforced with tungsten carbide particles in hydrochloric acid medium
- Tribological properties of PAANa/UHMWPE composite materials in seawater lubrication
- Preparation and assembly
- Acrylic acid-chitosan blend hydrogel: a novel polymer adsorbent for adsorption of lead(II) and copper(II) ions from wastewater
- Efficient preparation of PDMS-based conductive composites using self-designed automatic equipment and an application example
- Significant improvement of the low-temperature toughness of PVC/ASA/NBR ternary blends through the concept of mismatched thermal expansion coefficient
- Chitosan surface modified PLGA nanoparticles loaded with brigatinib for the treatment of non-small cell lung cancer
- Fabrication of polyimide films with imaging quality using a spin-coating method for potential optical applications
- Engineering and processing
- An experimental study on the micro- and nanocellular foaming of polystyrene/poly(methyl methacrylate) blend composites
- Barrel heating with inductive coils in an injection molding machine
- Influence of temperature dependence on the structural characteristics of polyoxymethylene/poly(lactic acid) blends by injection molding
- Annual reviewer acknowledgement
- Reviewer acknowledgement Journal of Polymer Engineering volume 39 (2019)

