
ACAT2 contributes to cervical cancer tumorigenesis by regulating the expression of the downstream gene LATS1
-
Hui Wang


Abstract
Objectives
Cervical cancer poses a significant health threat. While acetyl-CoA acetyltransferase 2 (ACAT2) gene is known to promote hepatocellular carcinoma progression, its role in cervical cancer remains unclear. This study aims to elucidate the function of ACAT2 in cervical cancer.
Methods
ACAT2 expression in cervical cancer and adjacent non-cancerous tissues was assessed using Western blotting and qPCR. The correlation between ACAT2 expression levels and patients’ pathological features as well as survival outcomes was evaluated. The effects of ACAT2 knockdown on cell proliferation and migration were tested in C33a and HeLa cells. TRULI, an inhibitor targeting LATS1, a downstream gene of ACAT2, was used to treat ACAT2-overexpressing C33a and HeLa cells to assess its impact on these processes.
Results
ACAT2 exhibited significantly higher expression in cervical cancer tissues compared to adjacent non-cancerous tissues (p<0.0001). Elevated ACAT2 expression was significantly correlated with the pathological grading (p<0.05) and associated with poor overall survival (OS) (p<0.05) in patients. ACAT2 knockdown inhibited the proliferative activity and migration of C33a and HeLa cells and induced apoptosis in both cells. Furthermore, by inhibiting the expression of the key downstream gene LATS1, the proliferation and migration of ACAT2-overexpressing C33a and HeLa cells were significantly reduced, while also inducing apoptosis in both overexpressing cells.
Conclusions
ACAT2 plays a proactive role in regulating the development and progression of cervical cancer, likely through its involvement with the LATS1 in its downstream pathway. Consequently, ACAT2 represents a promising potential biomarker and therapeutic target for cervical cancer.
Introduction
Cervical cancer (cervical and endocervical cancers) ranks as the fourth most prevalent gynecological malignancy globally. In 2018, an estimated 570,000 new cases and 311,000 deaths were reported worldwide [1]. By 2020, worldwide occurrence of cervical cancer surpassed 600,000 cases, accompanied by more than 340,000 fatalities. Age-standardized rates indicate an annual rate of approximately 13.3 cases per 100,000 women, with a mortality rate of 7.2 per 100,000 [2]. Recent statistics from 2022 indicate approximately 661,021 new cases and 348,189 deaths globally [3]. In 2022, the National Cancer Center of China released data on cancer incidence and mortality, revealing that cervical cancer is the fifth most common malignant tumor among women, with an incidence rate of 11.34 per 100,000, and ranks seventh in mortality at 3.36 per 100,000. Notably, higher rates were reported in rural regions compared to urban areas [4]. A study by the Chinese Center for Disease Control and Prevention published in The Lancet Public Health in 2023 revealed that cervical cancer increased in rank from seventh place in 2005 to sixth in 2020 among the leading causes of mortality related to cancer in Chinese women. In women aged 20–59, cervical cancer exhibits the third-highest fatality rate compared to other malignant tumors, highlighting a troubling trend of younger onset and persistently high rates of incidence and mortality [5]. Thus, there is a critical demand to discover novel biomarkers and explore potential therapeutic targets to enhance the prognosis of patients with cervical cancer.
Acetyl-CoA acetyltransferase (ACAT) is an enzyme that serves a vital function in the regulation of cellular lipid metabolism and is membrane-bound to the endoplasmic reticulum. It facilitates the esterification reaction between cholesterol and long-chain fatty acyl-CoA molecules, leading to the formation of cholesteryl esters, which are then rapidly packaged into lipid droplets [6]. This form helps maintain the dynamic balance of intracellular lipids and provides a readily accessible lipid reserve for cells during specific physiological needs.
The ACAT family primarily includes two important subtypes: ACAT1 and ACAT2, which exhibit significant differences in function, expression distribution, and cellular localization. ACAT1 serves a pivotal role in the regulatory network about cellular lipid metabolism and can be detectable in a variety of tissues [7]. In contrast, ACAT2 is predominantly localized in the cytoplasm and exhibits tissue specificity. It is primarily expressed in the intestine and fetal liver and may be involved in the absorption and re-esterification of dietary cholesterol, as well as lipid metabolism and lipoprotein synthesis during developmental processes [8], [9], [10].
Accumulating studies link ACAT1 to the promotion of tumor initiation and malignant progression [11]. The absence of PTEN, coupled with the stimulation of the PI3K/AKT signaling cascade, leads to an increased buildup of cholesteryl esters in lipid droplets within aggressive and metastatic prostate cancer. Additional studies have shown that this buildup stems from a marked increase in the absorption of external lipoproteins and the essential process of cholesterol ester formation. In Patient-Derived Xenograft (PDX) mouse models, depletion of cholesterol ester stores can markedly reduce tumor proliferation, impair cancer invasive capability, and inhibit tumor growth. In this critical metabolic pathway, inhibiting the expression of ACAT, particularly ACAT1, can inhibit cholesterol esterification, thereby reducing the aggressiveness of prostate cancer [12]. While ACAT2 has limited value in cancers, some studies have demonstrated through bioinformatics methods that ACAT2 may serve as a therapeutic biomarker for lung adenocarcinoma [13]. However, functional validation and clinical studies regarding ACAT2 have been scarce to date.
This study aims to evaluate and contrast the levels of ACAT2 expression in cervical cancer tissues vs. adjacent non-cancerous tissues, while investigating how ACAT2 expression correlates with the clinicopathological characteristics and survival outcomes of individuals with cervical cancer.
Materials and methods
Clinical samples
Human cervical cancer tissue microarrays were obtained from Shanghai Outdo Biotech Co., Ltd. (Catalog No.: HUteS154Su01, Lot No.: XT17-039), comprising 119 cervical cancer cases with survival data, including 35 cases with adjacent non-cancerous samples. The surgical samples were collected between January 2010 and October 2011. The Ethics Committee of Hebei North University Affiliated First Hospital approved this study (Ethics ID: K2024050), which complied with the Declaration of Helsinki.
Cells culture
Human immortalized cervical epithelial cells H8 (ATCC, United States) and cervical cancer cell lines C-33A (TCHu176), Ca Ski (TCHu137), SiHa (TCHu113), and HeLa (TCHu187) (all obtained from the Cell Bank of the Chinese Academy of Sciences) were grown in RPMI 1640 or DMEM media (10-040-CV/10-013-CV, Corning, United States) supplemented with 10 % fetal bovine serum (FBS; Wuhan Ausbian Biotechnology Co., Ltd., China). All culture media contained Penicillin-Streptomycin (100×) (Gibco; Thermo Fisher Scientific, Inc., United States). These cells were maintained in a controlled environment with 5 % CO2 and a temperature of 37 °C. Each cell line’s authenticity was verified by its supplier, and all tested negative for mycoplasma presence.
RNA isolation and quantitative real-time PCR (qPCR)
Total RNA was isolated from the above cell lines with TRIzol reagent (15596026, Sigma-Aldrich, United States). Subsequently, cDNA was generated using the Hiscript QRT Supermix for qPCR kit (Vazyme, China). Gene expression levels of target genes and internal control GAPDH was quantified using the VII7 RT-PCR system (Thermo Fisher Scientific, Inc., United States). The specific primer utilized in this study are detailed in Table 1.
The specific primer sequences.
| Gene | Forward primer | Reverse primer | Size |
|---|---|---|---|
| ACAT2 | GTCCAGTCAATAGGGATAGGAGA | CAAGTAAGCCAAGTGAGGAGC | 87 |
| GAPDH | TGACTTCAACAGCGACACCCA | CACCCTGTTGCTGTAGCCAAA | 121 |
Construction and packaging of ACAT2 knockdown and overexpression plasmids
Three short hairpin RNA (shRNA) sequences targeting human ACAT2 gene loci (shACAT2-1, shACAT2-2, and shACAT2-3) were synthesized. The shRNA sequences (oligo DNA sequences synthesized by GeneScript Biotech (Shanghai) Co., Ltd., China) were cloned into vectors using T4 DNA Ligase (EL0016, Fermentas, Thermo Fisher Scientific, Lithuania). The target sequences were:
Target sequence (38598)-KD-1: 5′-CATGTCCAAGCTAAAGCCTTA-3′
Target sequence (38599)-KD-2: 5′-GTGCTGCAGCTGTCGTTCTTA-3′
Target sequence (38600)-KD-3: 5′-CACCTTTAGCACGGATAGTTT-3′
A scrambled sequence was used as the shRNA negative control (shCtrl). For the overexpression of the target gene ACAT2, the ACAT2 gene sequence was synthesized (oligo DNA sequences synthesized by GeneScript Biotech (Shanghai) Co., Ltd., China) and cloned into vectors utilizing the ClonExpress II One Step Cloning Kit (C112, Vazyme, China). The human overexpression and knockdown sequences were cloned into fluorescent protein-based lentiviral vectors containing BamHI/NheI and AgeI/EcoRI restriction sites, respectively, to generate recombinant lentiviral vectors. The lentiviral knockdown or overexpression vectors were co-transfected with lentiviral packaging plasmids (Cat. No. #12259, Didier Trono Lab, Addgene, United States) and envelope plasmids (Didier Trono Lab, Addgene, Cat. No. #12260; United States) into cells.
Lentiviral transduction of target cells
After plating healthy cells, infection media containing the virus was added to the cells. Following 18–20 h of incubation, the fresh medium was replaced. After 72 h, infection efficiency was assessed, and fluorescence expression and cell status were visualized under a fluorescence microscope. qPCR and Western blotting were employed to screen for stable cell lines expressing the target gene. Control groups included the overexpression negative control (NC) and the overexpression group (ACAT2). After 3–5 days of lentiviral transduction, experiments on cell proliferation, migration, and apoptosis were carried out sequentially.
Protein extraction and Western blot analysis
Proteins were isolated from H8, as well as cervical cancer cell lines C-33A, SiHa, and HeLa. The cells were collected, washed with PBS, and lysed using a Western and IP cell lysis buffer supplemented with PMSF (100:1 ratio). The lysates were incubated on ice for 10–15 min and then centrifugated at 12,000 rpm for 10 min at 4 °C. The supernatants were collected, combined with loading buffer, and boiled at 100 °C for 20 min. Samples were then centrifuged at 12,000 rpm for 1 min at 4 °C and preserved at −20 °C until use. The concentration of extracted proteins was quantified using a bicinchoninic acid (BCA) assay (Pierce; Thermo Fisher Scientific, United States).
A total of 20 μg of protein was loaded per lane and separated using SDS-PAGE gel containing 10 % SDS. After electrophoresis, proteins were transferred to PVDF membranes at 300 mA for 90 min at 4 °C. Membranes were blocked with 5 % non-fat milk in TBST for 1 h at room temperature, followed by incubation with primary antibodies for 2 h at room temperature or overnight at 4 °C. The primary antibodies used included anti-ACAT2 (14755-1-AP; Proteintech, China) anti-LATS1 (3477S; CST, United States), anti-SMC2 (5329S; CST, United States), anti-HAUS1 (ab243808; Abcam, United Kingdom), anti-SPC25 (26474-1-AP; Proteintech, China), and anti-RPA1 (12448-1-AP; Proteintech, China) at 1:2,000, anti-GAPDH (60004-1-lg; Proteintech, China) at 1:30,000. After washing with TBST, membranes were treated with secondary antibodies (Goat Anti-Rabbit or Goat Anti-Mouse at 1:3,000) for 1 h at 23 °C. Protein bands were detected using the Millipore immobilon Western Chemiluminescent HRP Substrate and captured with a chemiluminescence imaging system (RPN2232; Millipore, United States).
Cell counting kit-8 (CCK-8) assay for cell viability
Cell viability was evaluated using a CCK-8 assay kit (96992, Sigma-Aldrich, USA). Cells in the logarithmic growth phase were collected, counted, and the seeding density was optimized based on their growth rate over a 5-day period. A cell suspension containing 2,000 cells per 100 μL was plated in each well of a 96-well plate. Following cell attachment, 10 μL of CCK-8 solution was added to each well 2–4 h prior to the end of the incubation period. The plates were then incubated for 4 h, gently agitated, and the absorbance was recorded at 450 nm using a microplate reader (Synergy H1, BioTek, USA).
Colony formation assay
For the colony formation assay, cells in the logarithmic growth phase were seeded at 400–1,000 cells/well into 6-well plates, with three replicates per group, and maintained in culture for 14 days or until the majority of single clones contained >50 cells. The medium was replaced every three days. Cell clones were fixed with 4 % paraformaldehyde for 30–60 min and then stained with 500 μL of Giemsa solution per well (AR-0752, Shanghai Dingguo Biotech Co., Ltd., China) for 10–20 min, washed with ddH2O, and air-dried. Images of the cell clones were then photographed under a fluorescence microscope (IX71, Olympus Company, Japan), and the number of colonies (defined as clones containing more than 50 cells) was counted.
Wound-healing assay
Cells in the logarithmic growth phase were harvested, resuspended in a complete medium, and counted. A total of 50,000 cells per well were plated in 96-well plates (100 μL/well) to achieve >90 % confluency by the next day for wound-healing assays. After 24 h, the medium was replaced with a low-serum medium, and a scratch was made using a wounding tool. Cells were gently washed with serum-free medium, and a low-serum medium (0.5 % FBS) was added. Images of the wound area were captured every 12 h under a microscope (CKX31, Olympus Company, Japan). Migration was monitored, and images were acquired at appropriate intervals using a Cellomics system (ArrayScan VT1, Thermo Fisher Scientific, Inc., United States). The migration area was analyzed using Cellomics® vHCS Scan Software v3.0.
Transwell assays for cell migration and invasion
During the logarithmic growth phase, cells were trypsinized, suspended in a low-serum culture medium, and counted. The upper chambers of a 24-well Transwell plate were pre-incubated with 100 μL of serum-deprived medium for 1–2 h. After removing the medium, medium (600 μL) supplemented with FBS (30 %) was introduced into the basolateral compartment. Matrigel (3422, Corning, United States) was added in advance to assess invasion capability. Cell suspensions, containing 100,000 to 200,000 cells in 100 μL of medium without serum, were placed into the top compartments, which were then placed into the lower chambers. Cells were incubated for 4–24 h at 37 °C with 5 % CO2. Cells that did not migrate were removed with a cotton swab, while the migrated cells on the lower surface of the membrane were stained for 5 min, washed, and air-dried. Microscopic images (IX73 Olympus Company, Japan), and migrated cells were quantified.
Flow cytometry for cell apoptosis detection
C-33A and HeLa cells were gathered for apoptosis analysis. When cells reached 70 % confluency, apoptosis was induced. Culture supernatant and PBS-washed cells were harvested, followed by trypsinization and centrifugation at 1,500 rpm for 5 min. The cell pellet was rinsed with PBS and resuspended in 1× binding buffer. Cells (1 × 10⁵–1 × 10⁶) were stained with 5 μL annexin V-PE in the dark for 15 min, followed by centrifugation and resuspension in 1× binding buffer. Subsequently, 5 μL PI (diluted 10×) was added, and the volume was adjusted to 300 μL with 1× binding buffer. Samples were analyzed within 15 min using a flow cytometer (ABC250-22INT, Guava, Luminex Corp., USA) following the manufacturer’s guidelines (10010-09, Southern Biotechnology Associates, Inc., United States).
The TRULI treatment
To inhibit LATS1 gene expression, the LATS1 inhibitor TRULI was used for subsequent treatments. TRULI (E1061, Selleck, United States) was applied at a concentration of 30 µM for 24 h in the CCK-8 assay, colony formation assay, wound-healing assay, Transwell assays, and flow cytometry for cell apoptosis detection.
Hematoxylin and eosin (HE) staining and immunohistochemistry (IHC) staining
The tissue microarray was stained with HE (Baso Diagnostics, Inc., China). For IHC staining, paraffin was removed from tissue sections using xylene, followed by rehydration in a series of graded ethanol solutions. For antigen unmasking, heat-induced epitope retrieval was conducted in either citrate buffer (pH 6.0) or EDTA buffer (pH 9.0) using pressurized heating. To block endogenous peroxidase activity, endogenous peroxidases were incubated with 3 % H2O2 treatment, and non-specific antibody interactions were blocked with 5 % normal serum. The tissue was then incubated with the primary anti-ACAT2 antibody (14755-1-AP, Wuhan Sanying, China) at a dilution of 1:100 (optimized based on preliminary experiments), followed by the application of a secondary antibody. Detection was performed with DAB chromogen, and the tissue sections were counterstained with hematoxylin. Staining results were independently assessed by two pathologists to ensure consistency and accuracy.
Bioinformatics analysis
To validate the role of ACAT2 in cervical cancer, we conducted bioinformatics analyses using expression profile data from multiple tumor-related databases such as TCGA (https://www.cancer.gov/ccg/research/genome-sequencing/tcga), GEO (https://www.ncbi.nlm.nih.gov/geo/), and Oncomine (https://www.oncomine.com/). Additionally, to further elucidate how ACAT2 contributes to the development and progression of cervical malignant tumors, we performed a comprehensive investigation of data from multiple tumor-related databases, including TCGA, GEO, and Oncomine, to identify the potential gene functions and downstream pathways of ACAT2. Gene ontology (GO) were grouped into three classification systems: biological process (BP), cellular component (CC), and molecular function (MF).
Statistical analysis
All experiments were conducted with a minimum of three biological replicates. Quantitative data are expressed as mean values±standard deviation. All statistical analyses were conducted using SPSS version 20.0. The expression and knockdown efficiency of ACAT2 in various groups, along with CCK-8 assay, colony formation assay, flow cytometry analysis, wound healing assays, and Transwell migration assays, were assessed using T-tests or Mann-Whitney U tests. The distribution of ACAT2 expression levels in cervical cancer tissues and adjacent tissues, as well as the characteristics of patients with cervical cancer, were analyzed using chi-square tests. Kaplan–Meier curves were employed to evaluate OS and progression-free survival (PFS) among patients based on ACAT2 expression. p<0.05 was considered statistically significant.
Results
Upregulation of ACAT2 in cervical cancer tissues and cell lines
By intersecting the differential expression genes identified from these databases, we found that expression of the ACAT2 gene is significantly upregulated in cervical cancer (p=0.000984<0.01, Figure 1A).
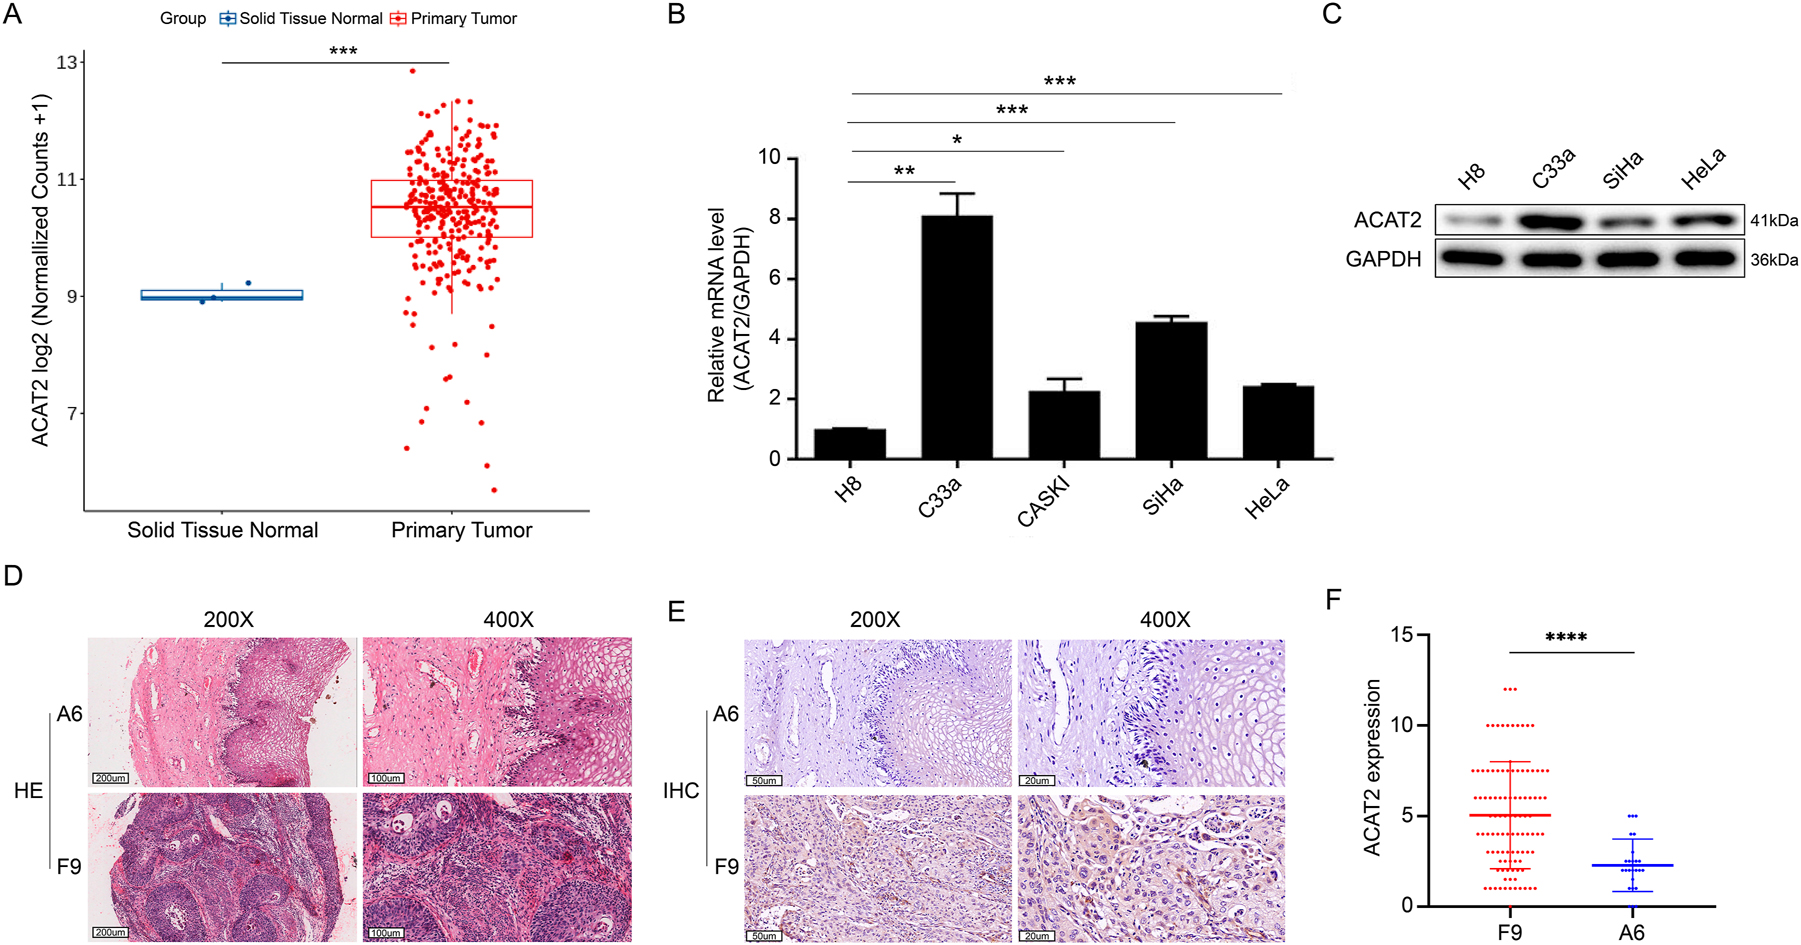
The expression of ACAT2 in cervical cancer and normal tissue or cell lines. (A) RNA-seq counts data of squamous carcinoma of the cervix and human normal tissue specimens from the TCGA, GEO, and oncomine databases were normalized to compare expression levels. (B) Quantitative polymerase chain reaction (qPCR) analysis of ACAT2 relative expression in human cervical cancer cell lines C-33A, CASKI, SiHa, and HeLa compared to human immortalized cervical epithelial H8 cells. GAPDH was used as the internal reference gene. (C) ACAT2 protein expression levels were assessed by western blotting in human cervical epithelial cell line H8 and the human cervical cancer cell lines C-33A, SiHa, and HeLa. (D) HE staining in cervical cancer tissues (sample F9) is more intense than in adjacent noncancerous tissues (sample A6). Representative images at 200× and 400× magnifications are shown. Scale bar, 200 and 100 μm. (E) ACAT2 staining in cervical cancer tissues (sample F9) is stronger than in adjacent noncancerous tissues (sample A6). Representative IHC images at 200× and 400× magnifications are shown. Scale bar, 50 and 20 μm. (F) Corresponding statistical analyses for IHC. *p<0.05, **p<0.01, ***p<0.001, ****p<0.0001.
To further examine the expression of ACAT2 in cervical cancer cell lines, qPCR and Western blot analyses were performed to assess ACAT2 expression in H8 cells and C-33A, CASKI, SiHa, and HeLa cell lines. As expected, ACAT2 expression was significantly higher in C-33A, CASKI, SiHa, and HeLa cell lines compared to H8 cells (Figure 1B and C).
To further investigate ACAT2 expression in cervical cancer tissues, we compared ACAT2′ expression in 88 cervical cancer tissues as well as partially matched 25 adjacent non-cancerous tissues from a total of 119 samples due to incomplete pathological data for some specimens (Supplementary Figure S1). IHC analysis revealed a higher ACAT2 levels in tumor tissues compared to normal tissues (p<0.001, Table 2; p<0.0001, Figure 1D–F; Supplementary Figure S2).
Distribution of ACAT2 expression levels in cervical cancer tissues (n=88) and adjacent non-cancerous tissues (n=25).
| ACAT2 expression | Tumor tissue | Para-carcinoma tissue | p-Value | ||
|---|---|---|---|---|---|
| Cases | Percentage | Cases | Percentage | ||
| Low | 42 | 47.7 % | 22 | 88.0 % | <0.001 |
| High | 46 | 52.3 % | 3 | 12.0 % | |
Upregulation of ACAT2 is associated with pathological grading and survival in cervical cancer patients
To further elucidate the role of ACAT2 in cervical cancer, we used the median expression level of ACAT2 in cervical cancer tissues as a threshold to assess its correlation with clinical-pathological attributes of cervical cancer. It was found that the proportion of high ACAT2 expression was notably higher in cervical cancer compared to normal tissues, and high ACAT2 expression was markedly associated with tumor pathological grading (p=0.041, Tables 2 and 3).
Characteristics of patients with cervical cancer (n=88).
| Features | No. of patients | ACAT2 expression | p-Value | |
|---|---|---|---|---|
| Low | High | |||
| All patients | 88 | 42 | 46 | |
| Age | 0.839 | |||
| <45 years | 45 | 21 | 24 | |
| ≥45 years | 43 | 21 | 22 | |
| Grade | 0.041 | |||
| I | 1 | 1 | 0 | |
| II | 11 | 8 | 3 | |
| III | 76 | 33 | 43 | |
| T infiltrate | 0.285 | |||
| T1 | 45 | 24 | 21 | |
| T2 | 26 | 11 | 15 | |
| T3 | 16 | 7 | 9 | |
| T4 | 1 | 0 | 1 | |
| Lymphatic metastasis (N) | 0.549 | |||
| N0 | 71 | 35 | 36 | |
| N1 | 17 | 7 | 10 | |
| Stage | 0.285 | |||
| I | 45 | 24 | 21 | |
| II | 26 | 11 | 15 | |
| III | 16 | 7 | 9 | |
| IV | 1 | 0 | 1 | |
| Lymph node positivea | 0.549 | |||
| 0 | 71 | 35 | 36 | |
| 1 | 17 | 7 | 10 | |
-
a0 indicates N0 (no lymph node metastasis); 1 indicates lymph node metastasis positivity, including N1, N2, N3, etc.
Additionally, regarding the impact of ACAT2 expression on prognosis, Kaplan-Meier survival analysis indicated that patients with high ACAT2 expression exhibited significantly worse OS compared to those with low ACAT2 expression (93.99 months vs. not reached, HR=1.83 (95 % CI, 1.11–3.01), p<0.05; Figure 2A), while there was no significant difference in PFS (HR=1.37 (95 % CI, 0.85–2.22), p=0.198; Figure 2B). These findings imply that high ACAT2 expression may indicate a higher pathological grade and poorer survival outcomes in cervical cancer patients.
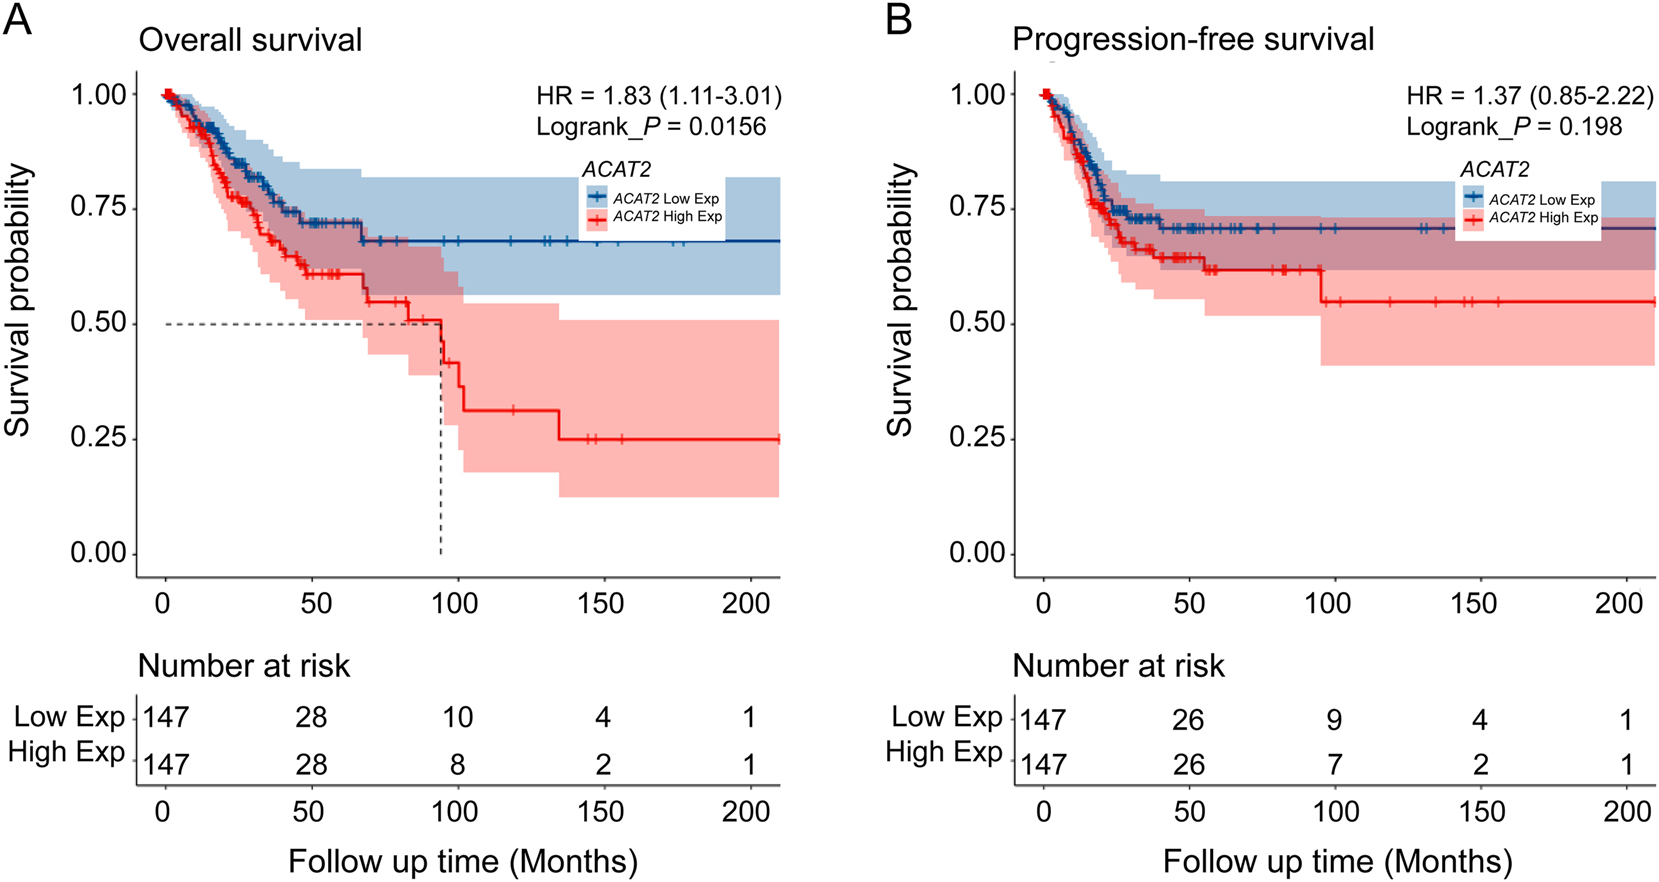
Kaplan–Meier curves for OS and PFS among patients based on ACAT2 expression. (A) OS and (B) PFS among patients stratified by ACAT2 expression level. HR, hazard ratio; p value by log-rank analysis.
ACAT2 positively regulates proliferation in cervical cancer
To explore the biological functions of ACAT2 in cervical cancer, lentiviruses for ACAT2 knockdown were first constructed and these viruses were used to infect C-33A cells and HeLa cells. Subsequently, the effect of ACAT2 knockdown was validated using Western blot and qPCR. The findings revealed that both the gene and protein expression levels of ACAT2 were notably decreased in C-33A and HeLa cells (p<0.01; Figure 3A–D). Additionally, fluorescence imaging indicated that the infection efficiency of the viruses exceeded 80 %, and the infected cells maintained normal morphology (Figure 3E and F).
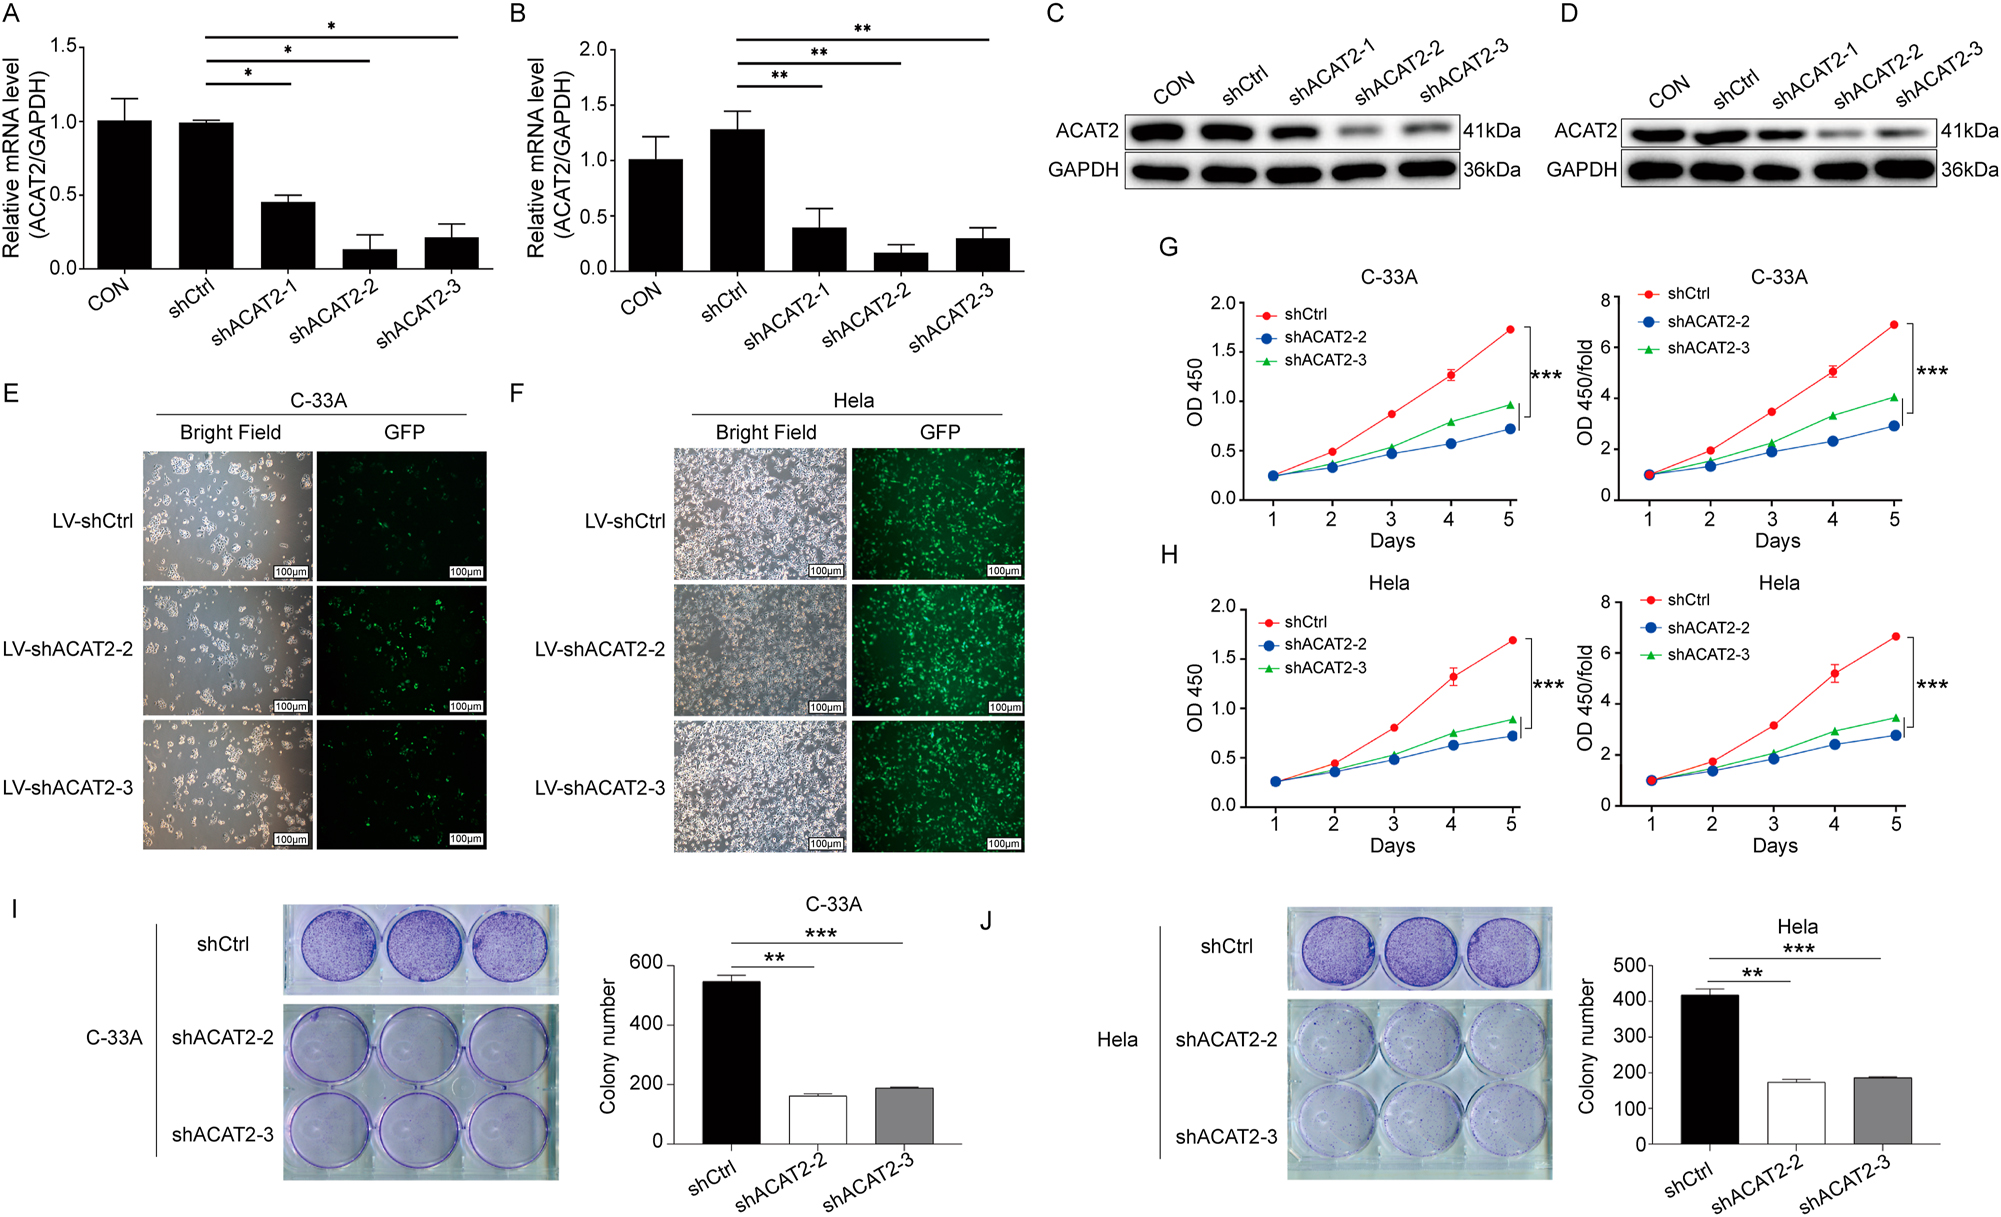
ACAT2 mediates proliferation in cervical cancer cell lines. qPCR analysis showing the knockdown efficiency of ACAT2 in the C-33A cell line (A) and HeLa cell line (B). Evaluation of ACAT2 protein expression levels via Western blot (WB) in C-33A cells (C) and HeLa cells (D). Lentiviral transduction of ACAT2 knockdown in C-33A cells (E) and HeLa cells (F). Scale bar, 100 μm. ACAT2 knockdown significantly inhibited the proliferation of C-33A cells (G) and HeLa cells (H), as measured by the CCK-8 assay. Colony formation assay showed that ACAT2 knockdown reduced the colony-forming ability of C-33A cells (I) and HeLa cells (J). *p<0.05, **p<0.01, ***p<0.001.
To thoroughly assess the impact of ACAT2 on cell viability, proliferation, apoptosis, and migration, we conducted CCK-8 assays, which revealed that ACAT2 knockdown notably decreased the viability of C-33A and HeLa cells (p<0.01; Figure 3G, and H). Additionally, colony formation assays demonstrated a significant reduction in the colony-forming capacity of both cell lines following ACAT2 knockdown (p<0.01; Figure 3I and J).
To elucidate the role of ACAT2 in apoptosis, we conducted flow cytometry analysis. The results demonstrated that ACAT2 knockdown promoted apoptosis in C-33A and HeLa cells (p<0.05; Figure 4A and B).
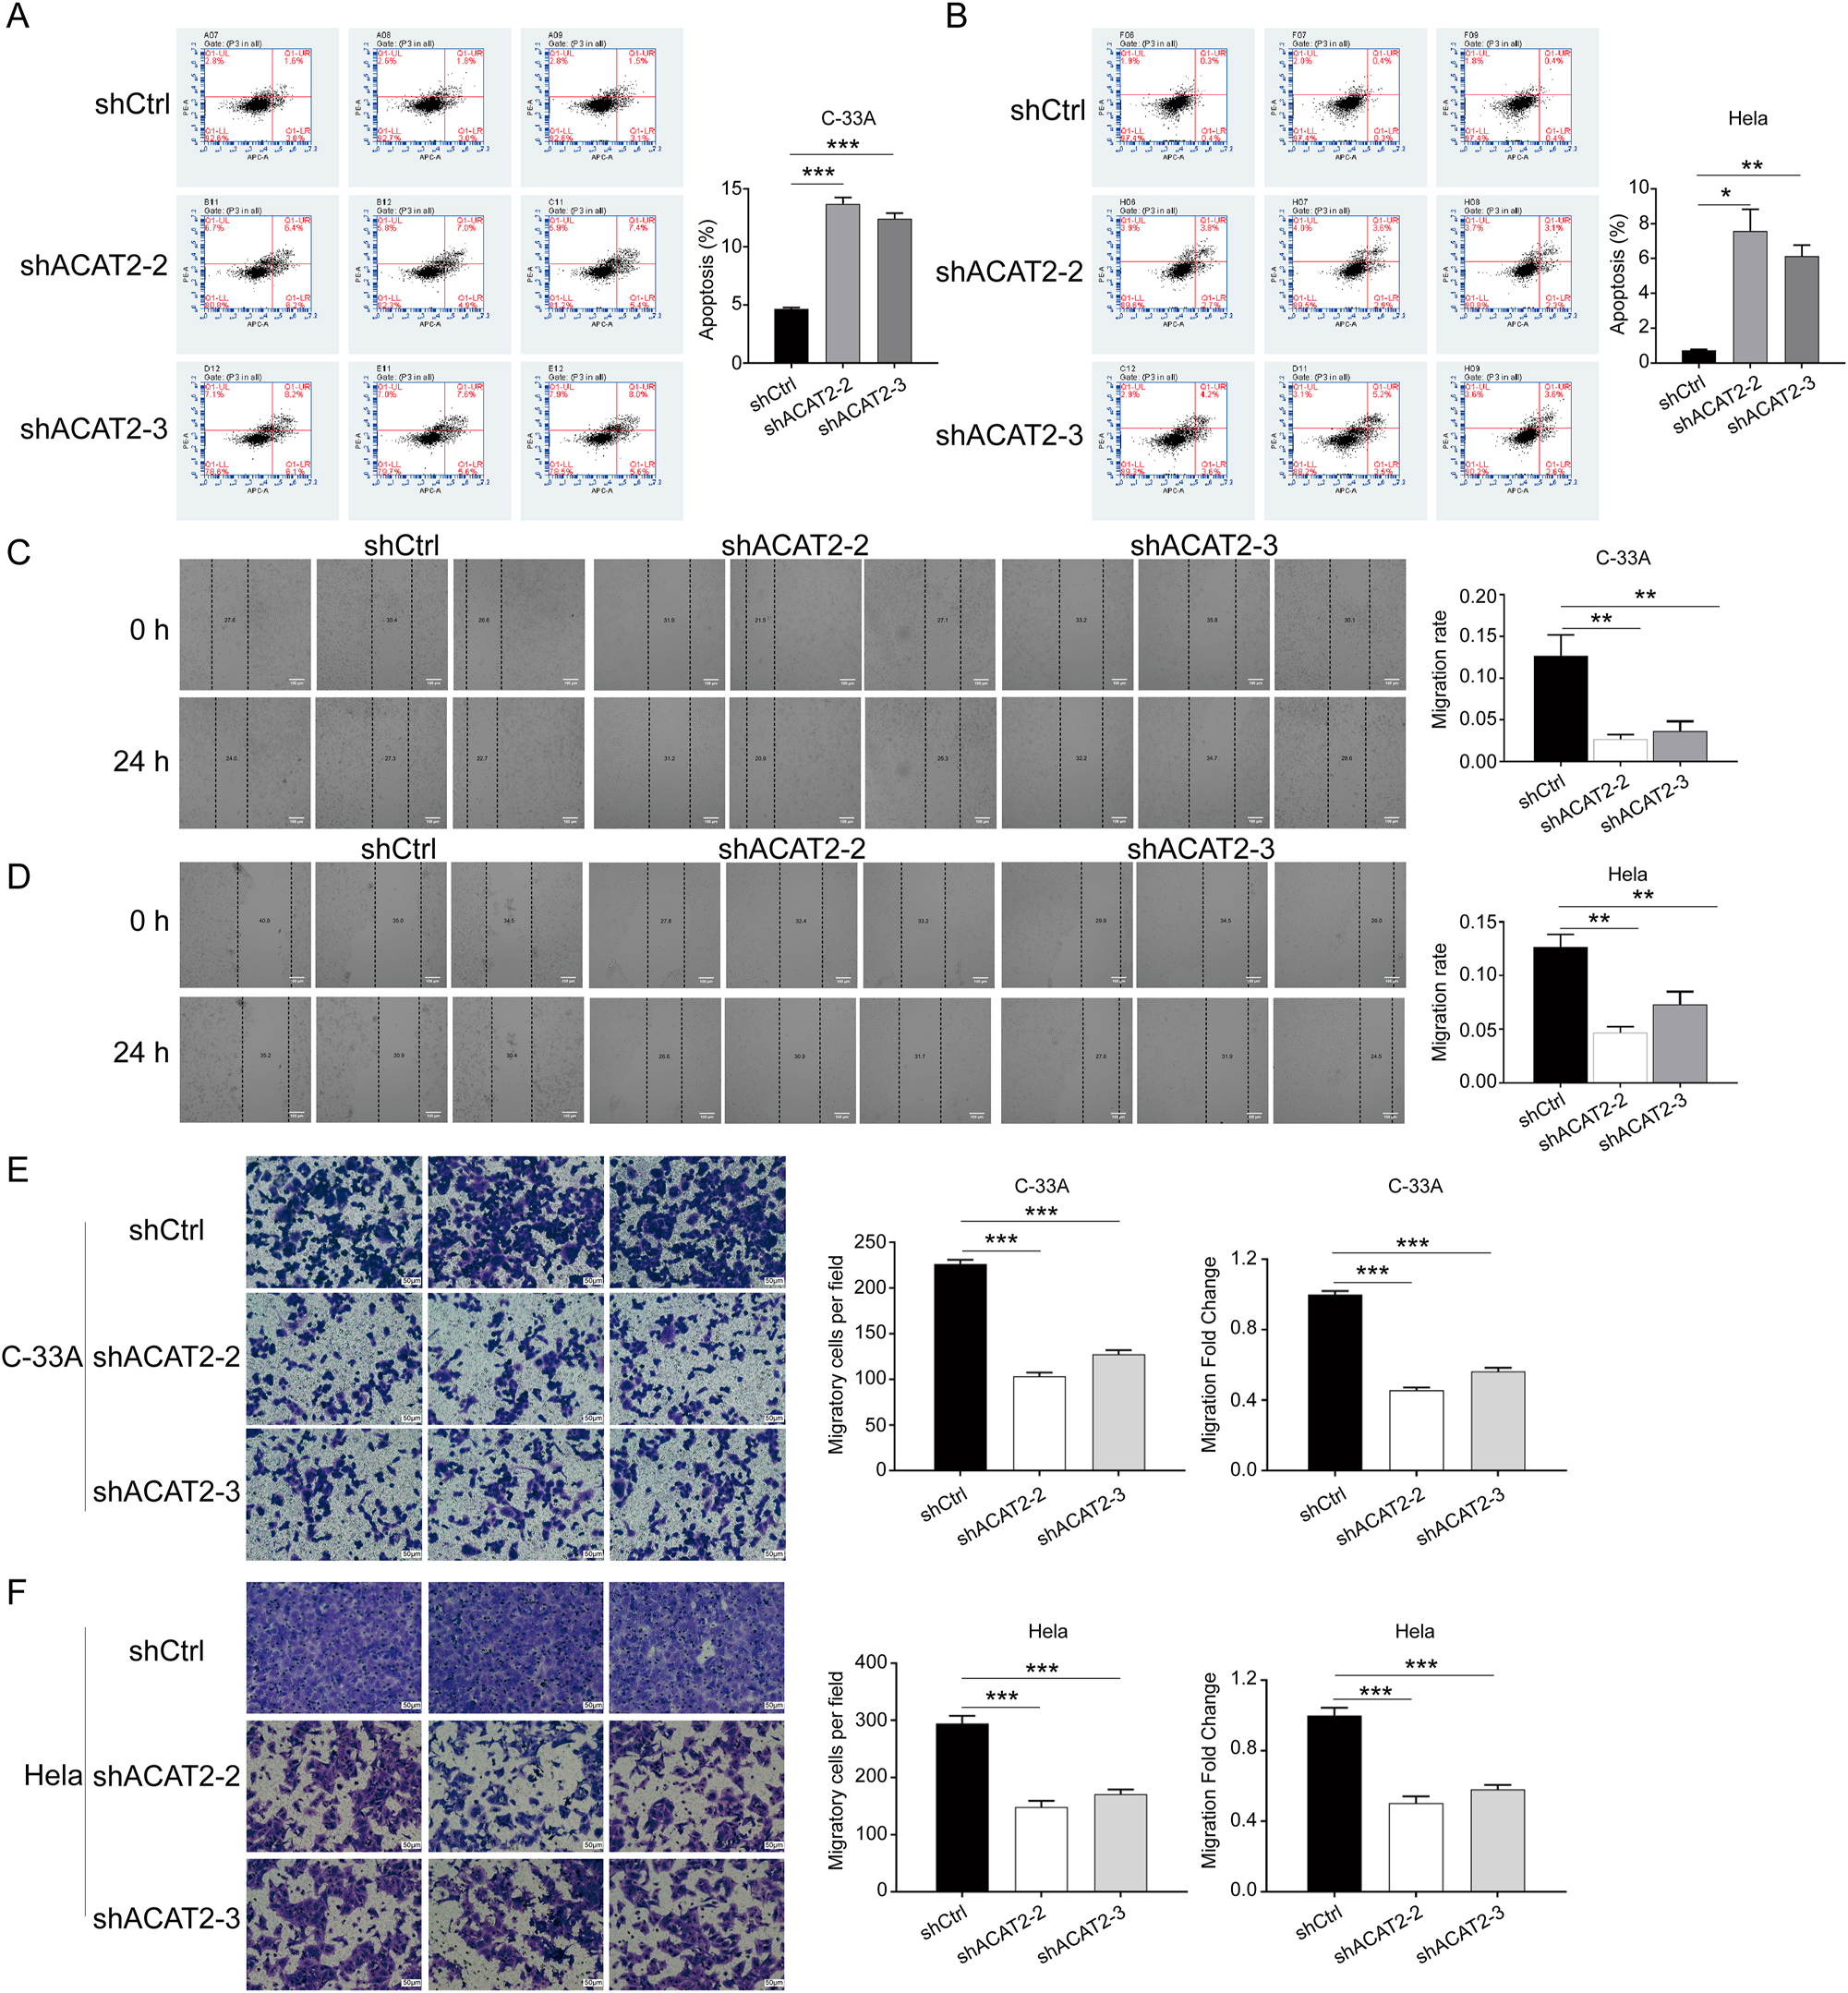
ACAT2 mediates proliferation in cervical cancer cell lines. Flow cytometry analysis of apoptosis levels in ACAT2-knockdown C-33A cells (A) and HeLa cells (B). Wound healing assays showed attenuated migration abilities in ACAT2-knockdown C-33A cells (C) and HeLa cells (D). Scale bar, 100 μm. Transwell migration assays indicated reduced migratory capacity in ACAT2-knockdown C-33A cells (E) and HeLa cells (F). Scale bar, 50 μm *p<0.05, **p<0.01, ***p<0.001.
To investigate the impact of ACAT2 knockdown on cell migration in C-33A and HeLa cells, wound healing and Transwell assays were performed. The wound healing assays indicated that ACAT2 knockdown significantly inhibited the migration of C-33A and HeLa cells (p<0.01; Figure 4C and D). Furthermore, Transwell assays confirmed that ACAT2 knockdown reduced the migratory capability of C-33A and HeLa cells (p<0.01; Figure 4E and F).
The mechanism through which ACAT2 drives the development and progression of cervical cancer
To further elucidate how ACAT2 influences the development and progression of cervical cancer, we conducted an integrated examination from multiple tumor-related databases, including TCGA, GEO, and Oncomine, to identify the potential gene functions and downstream pathways of ACAT2. Bioinformatics analysis based on GO in three aspects, BP, CC, and MF, revealed that ACAT2 frequently participates in mitosis-related biological processes and cellular components, particularly those associated with chromosomes (Supplementary Figure S3). It is well-known that LATS1/2 serves as central regulators of cell fate, playing crucial roles in modulating a range of oncogenic and tumor-suppressive agents, participating in the canonical Hippo effectors [14]. Interestingly, the enriched GO biological process CHROMOSOME_SEGREGATION includes the LATS1 gene in this analysis. Previous investigation has indicated that the Hippo signaling pathway is regulated by ACAT2 deficiency [15]. Thus, we hypothesized that LATS1 might be an important downstream gene of ACAT2.
Therefore, we decided to use Western blotting to validate the LATS1 protein expression in ACAT2 knockdown C-33A and HeLa cells. The results revealed a marked reduction in LATS1 expression compared to control group (Figure 5A and B). This observation from protein-level experiments supports our hypothesis that ACAT2 promotes the development of cervical cancer by positively regulating LATS1 expression in mitosis-related biological processes.
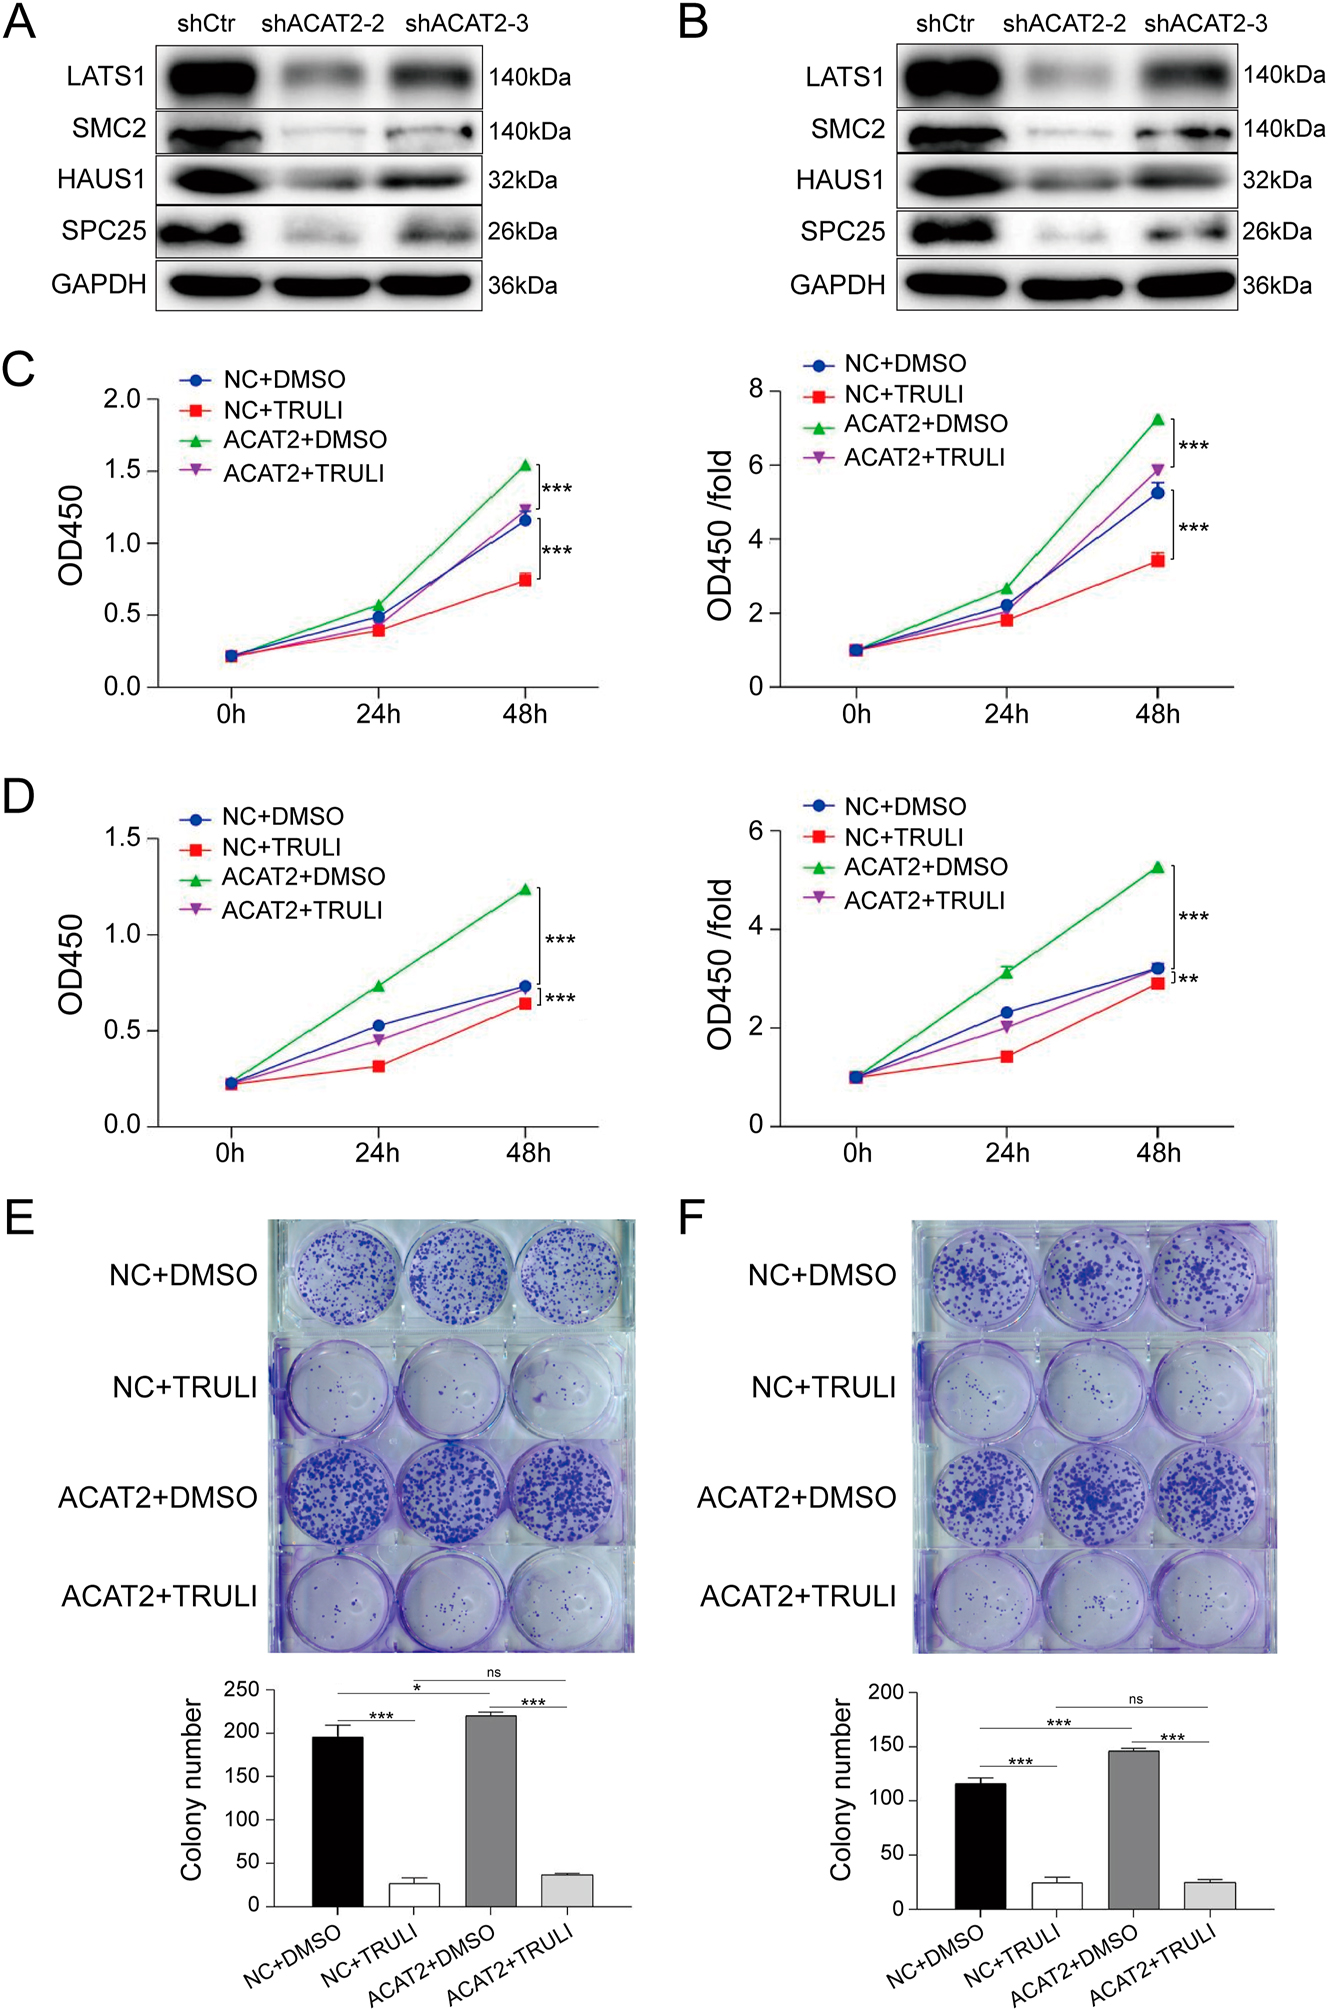
Inhibition of LATS1 suppresses proliferation and growth of ACAT2-overexpressing C-33A and HeLa cells. LATS1 protein expression was validated by Western blotting in ACAT2-knockdown C-33A cells (A) and HeLa cells (B). The proliferation of ACAT2-overexpressing C-33A (C) and HeLa (D) cells was significantly inhibited by TRULI treatment, as determined by the CCK-8 assay. The colony-forming ability of ACAT2-overexpressing C-33A (E) and HeLa (F) cells was reduced following TRULI treatment, as determined by colony formation assays. The protein levels of downstream genes (SMC2, HAUS1, and SPC25) identified via bioinformatics analysis were also compared with LATS1 expression. Ns, no significance; *p<0.05, **p<0.01, ***p<0.001.
To further clarify how ACAT2 influences cell viability, proliferation, apoptosis and migration in C-33A and HeLa cells through the regulation of LATS1 expression, we constructed an ACAT2-overexpressing lentivirus to infect both cell lines. Next, the cells were treated with the LATS1 inhibitor TRULI, and CCK-8 assays was conducted. TRULI significantly inhibited the proliferation of ACAT2-overexpressing C-33A and HeLa cells (p<0.001; Figure 5C and D). Similarly, the results from the colony formation assays indicated that TRULI significantly reduced the colony-forming capability of ACAT2-overexpressing C-33A and HeLa cells (Figure 5E and F). Additionally, Flow cytometry analysis showed that TRULI treatment significantly promoted apoptosis in ACAT2-overexpressing C-33A and HeLa cells (p<0.01; Figure 6A and B).
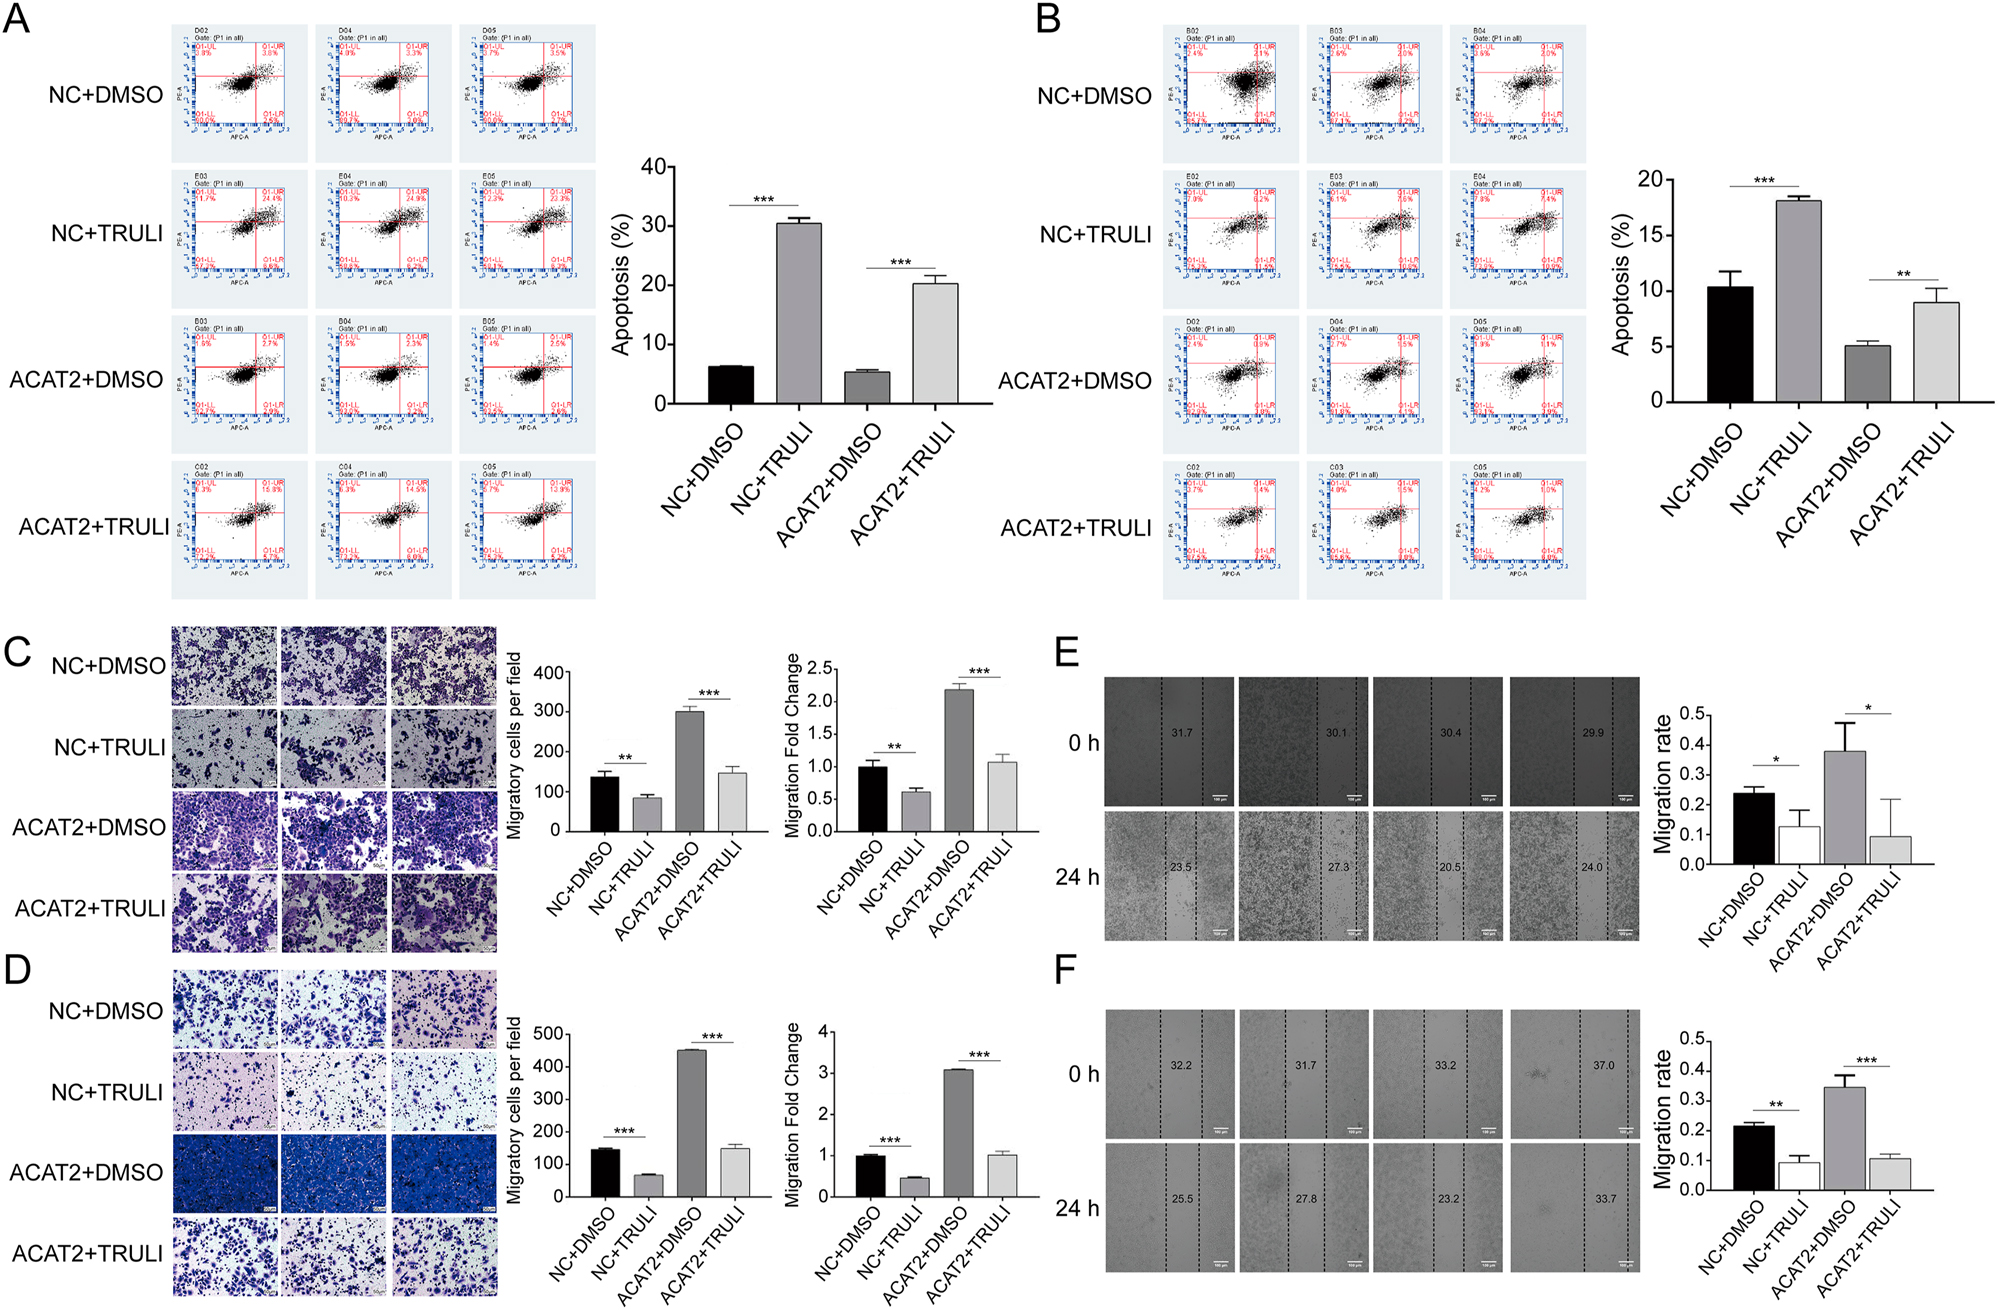
Inhibition of LATS1 suppresses proliferation and growth of ACAT2-overexpressing C-33A and HeLa cells. Flow cytometry analysis demonstrated that apoptosis was promoted in ACAT2-overexpressing C-33A (A) and HeLa (B) cells treated with the LATS1 inhibitor TRULI. Transwell migration assays revealed decreased migratory capacity in ACAT2-overexpressing C-33A (C) and HeLa (D) cells treated with TRULI. Scale bar, 50 μm. Wound healing assays indicated attenuated migration ability in ACAT2-overexpressing C-33A (E) and HeLa (F) cells treated with TRULI. Scale bar, 100 μm. Ns, no significance; *p<0.05, **p<0.01, ***p<0.001.
To examine the impact of TRULI on the migration levels of ACAT2-overexpressing both cell lines, we again conducted wound healing and Transwell assays. The transwell assays confirmed that TRULI inhibited the migratory capacity of ACAT2-overexpressing both cells (p<0.001; Figure 6C and D). Furthermore, the wound healing assays demonstrated that TRULI led to a marked reduction in the migration ability of ACAT2-overexpressing both cell lines (p<0.05; Figure 6E and F).
Discussion
Our findings demonstrate that ACAT2 plays a critical role in cervical cancer progression by regulating the downstream gene LATS1, which is involved in mitosis-related biological processes. The upregulation of ACAT2 in cervical cancer tissues and its association with higher pathological grading and poorer OS highlights its value as a prognostic indicator and a potential target for therapy. These results align with emerging evidence that lipid metabolism, particularly cholesterol regulation, is intricately linked to tumorigenesis and cancer progression [16]. ACAT family proteins, including ACAT2, can prevent the excess accumulation of free cholesterol by converting it into cholesteryl esters [17]. Cholesterol metabolism may influence the immune response of CD8+ T cells against tumors. Targeting cholesterol esterification in T cells through ACAT1 inhibition can improve the efficacy and infiltration of CD8+ T cells. The ACAT inhibitor avasimibe showed promising results in treating melanoma in mice, particularly when combined with immune checkpoint blockade (ICB) therapy resulted in even better antitumor effects. Therefore, ACAT1 may represent a potential target, especially for cancer immunotherapy [18]. Abnormal accumulation of cholesteryl esters has been found in human pancreatic cancer specimens and cell lines. A possible mechanism is that the inhibition of ACAT1 increases intracellular levels of free cholesterol, leading to a reduction in apoptosis [19]. Additionally, the deficiency of p53 affects cholesterol esterification and exacerbates the development of liver cancer [20]. Cholesterol metabolism plays a crucial role in cancer immune evasion, drug resistance, and autophagy dysfunction, all of which relate to various forms of cell death. Despite its importance, current research has yet to fully uncover how cholesterol metabolism regulates cell death and tumor formation, making it difficult to completely understand. Therefore, there remains a significant gap in identifying biomarkers for dysregulated cholesterol metabolism in cancer [21]. Given its role in these conditions, ACAT has emerged as a promising target for cancer therapies [22].
A hallmark metabolic feature of neoplastic tissues is their marked accumulation of cholesteryl esters, a lipid species rarely observed in normal parenchyma. This phenotypic divergence stems from ACAT1-mediated esterification of free cholesterol, with the resultant cholesteryl esters being sequestered within cytoplasmic lipid droplets. Emerging therapeutic strategies targeting this pathway demonstrate that pharmacological suppression of ACAT1 activity can effectively suppress the growth of various tumors [23]. However, the precise mechanistic contributions of ACAT2 to lipid metabolic dysregulation in malignant contexts continue to represent a significant gap in current oncological understanding. Some studies have reported potential molecular or biochemical regulatory pathways involving ACAT2. Research has found that ACAT2 plays a role in the oxidative pentose phosphate pathway, influencing the proliferation of cancer cells and tumor growth through the acetylation of K76 and K294 sites on6-phosphogluconate dehydrogenase (6PGD) [24]. Additionally, in lung adenocarcinoma, ACAT2 may participate in mitosis-related biological processes, such as DNA replication, chromosome segregation, and DNA helicase activity [13]. This aligns with our findings, which revealed that ACAT2 frequently participates in mitosis-related biological processes and cellular components, particularly those associated with chromosomes. Notably, ACAT2 may also be involved in the Hippo signaling pathway, suppressing the ubiquitination of YAP1 to enhance the proliferation and metastasis of gastric cancer [15]. Interestingly, in our study on cervical cancer, the enriched GO biological process CHROMOSOME_SEGREGATION includes LATS1, a key gene in the Hippo signaling pathway. Therefore, this compelling evidence prompted a systematic exploration of ACAT2-mediated biological processes in cervical cancer, including its signaling networks and metabolic pathways. First, the results from the knockdown experiments indicated that ACAT2 knockdown in C-33A and HeLa cells notably decreased cell viability, proliferation, and migration. Conversely, in our established ACAT2 overexpression virus-infected C-33A and HeLa cells, ACAT2 overexpression markedly increased cell viability, enhanced the cell clonogenic ability, inhibited apoptosis, and improved cell migration. To delineate the molecular mechanisms underlying ACAT2-mediated cervical cancer progression, we silenced its downstream gene, LATS1, at the cellular level. Treatment of both cell lines with the LATS1 inhibitor TRULI resulted in a substantial reduction in apoptosis in ACAT2-overexpressing cells, along with marked reductions in cell proliferation and migration. Collectively, these data establish ACAT2 as a key regulator of cervical cancer pathogenesis, potentially through modulation of mitosis-related biological processes involving the LATS1 gene. Consequently, the regulation of lipid metabolism by ACAT2 in cervical cancer may occur through its involvement in the Hippo signaling pathway.
Although the tumorigenic mechanisms of ACAT2 have not been fully elucidated, ACAT2 has been reported to promote neoplastic transformation and development. ACAT2 not only exhibits a trend of specific expression in the liver but also drives the progression of hepatocellular carcinoma (HCC). Emerging preclinical and translational evidence highlights ACAT2 as a critical metabolic regulator in hepatocellular carcinoma (HCC), where its overexpression drives oncogenic progression. Mechanistically, pharmacological inhibition of ACAT2 disrupts cholesterol homeostasis, resulting in the intracellular accumulation of unesterified oxysterols. This metabolic perturbation exerts potent anti-tumor effects, significantly impairing the proliferation of HCC cell lines in vitro and inhibiting xenograft tumor growth in vivo [25], 26]. Patients with ACAT2-high tumors exhibited significantly shorter disease-free survival (DFS) and OS compared to ACAT2-low counterparts [13]. High ACAT2 expression predicts a poor platinum-free interval, PFS, and OS in epithelial ovarian cancer patients [27]. Endometrial malignancies exhibit marked upregulation of ACAT2 expression compared to normal endometrium, with elevated ACAT2 levels correlating significantly with adverse patient prognosis [28]. Larger tumor size, extensive lymph node metastasis, and later clinical stages are linked to higher ACAT2 expression, predicting a worse 5-year OS in colorectal cancer (CRC) patients [29]. In this study, we detected the expression of ACAT2 in cervical cancer tissues and matched adjacent normal tissues. Western blot and qPCR analyses indicated that the relative expression of ACAT2 in cervical cancer tissues was significantly upregulated compared to adjacent normal tissues. Further investigation revealed that high ACAT2 expression was associated with histological grade. At the cellular level, ACAT2 expression was higher in four cervical cancer cell lines compared to the H8 cell line. These findings indicate that ACAT2 expression is consistently upregulated in cervical cancer, both at the tissue and cellular levels, and is associated with poor survival in patients with cervical malignancies.
However, ACAT2 expression is not consistently elevated in tumors. For instance, ACAT2 exhibits reduced expression in clear cell renal cell carcinoma, and its downregulation correlates with unfavorable prognosis in affected patients [30]. Additionally, while androgen agonists can upregulate ACAT1 expression, ACAT2 expression remains unchanged in androgen-independent prostate cancer cells [31]. These findings highlight the ongoing controversy surrounding ACAT2, a lipid metabolism enzyme, in the study of cancer mechanisms.
A limitation of this study is the relatively small sample size of cervical cancer cases, which restricts the broader applicability of the findings. Second, the mechanistic link between ACAT2 and LATS1 requires further validation in vivo to confirm its relevance in clinical settings. Additionally, the therapeutic potential of targeting ACAT2 in combination with existing treatments, such as immunotherapy or chemotherapy, remains to be investigated. Addressing these limitations in future studies will strengthen the clinical relevance of ACAT2 as a therapeutic target.
In summary, the proliferative and invasive effects of ACAT2 in cervical cancer may be inhibited by regulating its downstream gene LATS1. Therefore, blocking the relevant genes involved in the downstream mitosis-related biological processes of ACAT2, particularly LATS1, could promote the apoptosis in malignant cells for cervix, and regulate the occurrence and development of cervical cancer.
Conclusions
ACAT2 may be a crucial regulatory factor involved in cervical cancer cell proliferation and could potentially represent a promising therapeutic target, especially in patients with cervical cancer. Its role may be linked to the regulation of the downstream gene LATS1 within mitosis-related biological processes. However, whether ACAT2 can serve as a therapeutic target needs further exploration of the deeper potential molecular mechanisms of ACAT2, as well as further investigation into the regulatory mechanisms of this gene in cervical cancer animal models.
Funding source: Medical Science Research Project Plan of the Health Commission of Hebei Province
Award Identifier / Grant number: 20200198
Acknowledgments
We thank all co-authors for commenting on the manuscript.
-
Research ethics: Ethics Committee of Hebei North University Affiliated First Hospital approved this study (Ethics ID: K2024050), which complied with the Declaration of Helsinki.
-
Informed consent: All patients provided written informed consent for the study and consented to the publication of all patient-related data included in this study in a deidentified format.
-
Author contributions: Hui Wang is the guarantor of the entire study. Hui Wang, Zhe Wang, Huancheng Su, Lili Wang, Ying He, and Sanyuan Zhang acquired the data. Zhe Wang and Sanyuan Zhang analyzed the data. Hui Wang did the literature research and drafted the paper. Sanyuan Zhang reviewed and revised the paper. All authors have read and approved the final paper.
-
Use of Large Language Models, AI and Machine Learning Tools: N/A.
-
Conflict of interest: The authors declare no conflicts of interest.
-
Research funding: This study was supported by Medical Science Research Project Plan of the Health Commission of Hebei Province (20200198).
-
Data availability: The data that support the findings of this study are available from the corresponding author upon reasonable request.
References
1. Arbyn, M, Weiderpass, E, Bruni, L, de Sanjosé, S, Saraiya, M, Ferlay, J, et al.. Estimates of incidence and mortality of cervical cancer in 2018: a worldwide analysis. Lancet Glob Health 2020;8:e191–e203. https://doi.org/10.1016/s2214-109x(19)30482-6.Suche in Google Scholar
2. Singh, D, Vignat, J, Lorenzoni, V, Eslahi, M, Ginsburg, O, Lauby-Secretan, B, et al.. Global estimates of incidence and mortality of cervical cancer in 2020: a baseline analysis of the WHO Global Cervical Cancer Elimination Initiative. Lancet Glob Health 2023;11:e197–e206. https://doi.org/10.1016/s2214-109x(22)00501-0.Suche in Google Scholar PubMed PubMed Central
3. Bray, F, Laversanne, M, Sung, H, Ferlay, J, Siegel, RL, Soerjomataram, I, et al.. Global cancer statistics 2022: GLOBOCAN estimates of incidence and mortality worldwide for 36 cancers in 185 countries. CA Cancer J Clin 2024;74:229–63. https://doi.org/10.3322/caac.21834.Suche in Google Scholar PubMed
4. Qi, J, Li, M, Wang, L, Hu, Y, Liu, W, Long, Z, et al.. National and subnational trends in cancer burden in China, 2005–20: an analysis of national mortality surveillance data. Lancet Public Health 2023;8:e943–e955. https://doi.org/10.1016/s2468-2667(23)00211-6.Suche in Google Scholar PubMed
5. Zheng, RS, Zhang, SW, Zeng, HM, Wang, SM, Sun, KX, Chen, R, et al.. Cancer incidence and mortality in China, 2016. J Natl Cancer Cent 2022;2:1–9. https://doi.org/10.1016/j.jncc.2022.02.002.Suche in Google Scholar PubMed PubMed Central
6. Chang, C, Dong, R, Miyazaki, A, Sakashita, N, Zhang, Y, Liu, J, et al.. Human acyl-CoA:cholesterol acyltransferase (ACAT) and its potential as a target for pharmaceutical intervention against atherosclerosis. Acta Biochim Biophys Sin (Shanghai) 2006;38:151–6. https://doi.org/10.1111/j.1745-7270.2006.00154.x.Suche in Google Scholar PubMed
7. Song, BL, Wang, CH, Yao, XM, Yang, L, Zhang, WJ, Wang, ZZ, et al.. Human acyl-CoA:cholesterol acyltransferase 2 gene expression in intestinal Caco-2 cells and in hepatocellular carcinoma. Biochem J 2006;394:617–26. https://doi.org/10.1042/bj20051417.Suche in Google Scholar
8. Anderson, RA, Joyce, C, Davis, M, Reagan, JW, Clark, M, Shelness, GS, et al.. Identification of a form of acyl-CoA:cholesterol acyltransferase specific to liver and intestine in nonhuman primates. J Biol Chem 1998;273:26747–54. https://doi.org/10.1074/jbc.273.41.26747.Suche in Google Scholar PubMed
9. Parini, P, Davis, M, Lada, AT, Erickson, SK, Wright, TL, Gustafsson, U, et al.. ACAT2 is localized to hepatocytes and is the major cholesterol-esterifying enzyme in human liver. Circulation 2004;110:2017–23. https://doi.org/10.1161/01.cir.0000143163.76212.0b.Suche in Google Scholar
10. Chang, CC, Sakashita, N, Ornvold, K, Lee, O, Chang, ET, Dong, R, et al.. Immunological quantitation and localization of ACAT-1 and ACAT-2 in human liver and small intestine. J Biol Chem 2000;275:28083–92. https://doi.org/10.1074/jbc.m003927200.Suche in Google Scholar
11. Sun, T, Xiao, X. Targeting ACAT1 in cancer: from threat to treatment. Front Oncol 2024;14:1395192. https://doi.org/10.3389/fonc.2024.1395192.Suche in Google Scholar PubMed PubMed Central
12. Yue, S, Li, J, Lee, SY, Lee, HJ, Shao, T, Song, B, et al.. Cholesteryl ester accumulation induced by PTEN loss and PI3K/AKT activation underlies human prostate cancer aggressiveness. Cell Metab 2014;19:393–406. https://doi.org/10.1016/j.cmet.2014.01.019.Suche in Google Scholar PubMed PubMed Central
13. Wang, Z, Cao, Z, Dai, Z. ACAT2 may be a novel predictive biomarker and therapeutic target in lung adenocarcinoma. Cancer Rep (Hoboken) 2024;7:e1956. https://doi.org/10.1002/cnr2.1956.Suche in Google Scholar PubMed PubMed Central
14. Furth, N, Aylon, Y. The LATS1 and LATS2 tumor suppressors: beyond the Hippo pathway. Cell Death Differ 2017;24:1488–501. https://doi.org/10.1038/cdd.2017.99.Suche in Google Scholar PubMed PubMed Central
15. Zhang, M, Cai, F, Guo, J, Liu, S, Ma, G, Cai, M, et al.. ACAT2 suppresses the ubiquitination of YAP1 to enhance the proliferation and metastasis ability of gastric cancer via the upregulation of SETD7. Cell Death Dis 2024;15:297. https://doi.org/10.1038/s41419-024-06666-x.Suche in Google Scholar PubMed PubMed Central
16. Zhang, Y, Yang, Z, Liu, Y, Pei, J, Li, R, Yang, Y, et al.. Targeting lipid metabolism: novel insights and therapeutic advances in pancreatic cancer treatment. Lipids Health Dis 2025;24:12. https://doi.org/10.1186/s12944-024-02426-0.Suche in Google Scholar PubMed PubMed Central
17. Wang, YJ, Bian, Y, Luo, J, Lu, M, Xiong, Y, Guo, SY, et al.. Cholesterol and fatty acids regulate cysteine ubiquitylation of ACAT2 through competitive oxidation. Nat Cell Biol 2017;19:808–19. https://doi.org/10.1038/ncb3551 [Erratum in 2017;19(12):1441].Suche in Google Scholar PubMed PubMed Central
18. Yang, W, Bai, Y, Xiong, Y, Zhang, J, Chen, S, Zheng, X, et al.. Potentiating the antitumour response of CD8(+) T cells by modulating cholesterol metabolism. Nature 2016;531:651–5. https://doi.org/10.1038/nature17412.Suche in Google Scholar PubMed PubMed Central
19. Li, J, Gu, D, Lee, SS, Song, B, Bandyopadhyay, S, Chen, S, et al.. Abrogating cholesterol esterification suppresses growth and metastasis of pancreatic cancer. Oncogene 2016;35:6378–88. https://doi.org/10.1038/onc.2016.168.Suche in Google Scholar PubMed PubMed Central
20. Zhu, Y, Gu, L, Lin, X, Zhou, X, Lu, B, Liu, C, et al.. P53 deficiency affects cholesterol esterification to exacerbate hepatocarcinogenesis. Hepatology 2023;77:1499–511. https://doi.org/10.1002/hep.32518.Suche in Google Scholar PubMed PubMed Central
21. Chen, F, Lu, Y, Lin, J, Kang, R, Liu, J. Cholesterol metabolism in cancer and cell death. Antioxid Redox Signal 2023;39:102–40. https://doi.org/10.1089/ars.2023.0340.Suche in Google Scholar PubMed
22. Garcia-Bermudez, J, Birsoy, K. Drugging ACAT1 for cancer therapy. Mol Cell 2016;64:856–7. https://doi.org/10.1016/j.molcel.2016.11.023.Suche in Google Scholar PubMed
23. Cheng, C, Geng, F, Cheng, X, Guo, D. Lipid metabolism reprogramming and its potential targets in cancer. Cancer Commun (Lond) 2018;38:27–14. https://doi.org/10.1186/s40880-018-0301-4.Suche in Google Scholar PubMed PubMed Central
24. Shan, C, Elf, S, Ji, Q, Kang, HB, Zhou, L, Hitosugi, T, et al.. Lysine acetylation activates 6-phosphogluconate dehydrogenase to promote tumor growth. Mol Cell 2014;55:552–65. https://doi.org/10.1016/j.molcel.2014.06.020.Suche in Google Scholar PubMed PubMed Central
25. Sun, J, Dahboul, F, Pujos-Guillot, E, Petera, M, Chu-Van, E, Colsch, B, et al.. PLD2 is a marker for MASLD-HCC with early-stage fibrosis: revealed by lipidomic and gene expression analysis. Metabolomics 2025;21:39. https://doi.org/10.1007/s11306-025-02226-2.Suche in Google Scholar PubMed
26. Lu, M, Hu, XH, Li, Q, Xiong, Y, Hu, GJ, Xu, JJ, et al.. A specific cholesterol metabolic pathway is established in a subset of HCCs for tumor growth. J Mol Cell Biol 2013;5:404–15. https://doi.org/10.1093/jmcb/mjt039.Suche in Google Scholar PubMed PubMed Central
27. Wang, J, Yang, Z, Bai, H, Zhao, L, Ji, J, Bin, Y, et al.. High-expressed ACAT2 predicted the poor prognosis of platinum-resistant epithelial ovarian cancer. Diagn Pathol 2024;19:7. https://doi.org/10.1186/s13000-023-01435-4.Suche in Google Scholar PubMed PubMed Central
28. Xiao, X, Huang, T, Chen, B, Zhu, J, Xiao, Q, Bao, Y. ACAT2 negatively modulated by FOXA2 suppresses ferroptosis to expedite the aggressive phenotypes of endometrial cancer cells. Histol Histopathol 2024;18793.Suche in Google Scholar
29. Wang, ML, Zhang, H, Hou, WT, Sun, ZR, Zhong, J, Miao, CH. ACAT2 promotes cell proliferation and associates with malignant progression in colorectal cancer. Onco Targets Ther 2020;13:3477–88. https://doi.org/10.2147/ott.s238973 [Erratum in 2021;14:4641–3].Suche in Google Scholar PubMed PubMed Central
30. Zhao, Z, Lu, J, Han, L, Wang, X, Man, Q, Liu, S. Prognostic significance of two lipid metabolism enzymes, HADHA and ACAT2, in clear cell renal cell carcinoma. Tumor Biol 2015;37:8121–30. https://doi.org/10.1007/s13277-015-4720-4.Suche in Google Scholar PubMed
31. Locke, JA, Wasan, KM, Nelson, CC, Guns, ES, Leon, CG. Androgen mediated cholesterol metabolism in LNCaP and PC-3 cell lines is regulated through two different isoforms of acyl-coenzyme A: cholesterol acyltransferase (ACAT). Prostate 2008;68:20–33. https://doi.org/10.1002/pros.20674.Suche in Google Scholar PubMed
Supplementary Material
This article contains supplementary material (https://doi.org/10.1515/oncologie-2024-0643).
© 2025 the author(s), published by De Gruyter on behalf of Tech Science Press (TSP)
This work is licensed under the Creative Commons Attribution 4.0 International License.
Artikel in diesem Heft
- Frontmatter
- Review Articles
- Unveiling the hidden role of tumor-educated platelets in cancer: a promising marker for early diagnosis and treatment
- Multiple roles of mitochondria in tumorigenesis and treatment: from mechanistic insights to emerging therapeutic strategies
- The impact of JMJD5 on tumorigenesis: a literature review
- Research Articles
- A case-matched comparison of ER-α and ER-β expression between malignant and benign cystic pancreatic lesions
- Salivary gamma-glutamyltransferase activity as an indicator of redox homeostasis in breast cancer
- Cancer can be suppressed by alkalizing the tumor microenvironment: the effectiveness of “alkalization therapy” in cancer treatment
- Percutaneous-assisted laparoscopic bilateral salpingo-oophorectomy in BRCA-mutated patients: a retrospective comparative study
- ACAT2 contributes to cervical cancer tumorigenesis by regulating the expression of the downstream gene LATS1
- Rapid Communication
- Efficacy of mild hyperthermia in cancer therapy: balancing temperature and duration
- Case Report
- Orbital marginal zone B-cell lymphoma of mucosa-associated lymphoid tissue with amyloidosis: a case series and review of the literature
- Commentary
- Palliative external beam radiotherapy for dysphagia management in advanced esophageal cancer: a narrative perspective
- Endometriosis and endometriosis-associated ovarian cancer, possible connection and early diagnosis by evaluation of plasma microRNAs