Pixeled metasurface for multiwavelength detection of vitamin D
-
Valentina Di Meo


Abstract
The steadily increasing demand for accurate analysis of vitamin D level, via measurement of its best general marker, 25-hydroxyvitamin D (25(OH)D), pushes for the development of novel automated assays capable of working at very low concentrations. Here, we propose a plasmonic biosensor of 25(OH)D3 (calcifediol) based on surface-enhanced infrared absorption spectroscopy, which exploits the resonant coupling between plasmonic nanoantennas and vibrational excitation of small molecules. Specifically, our proposed platform features a large-area (several mm2) metasurface made of gold nanoantennas fabricated on a silicon substrate, comprising different macroregions (“pixels”) of area 500 × 500 µm2. In each pixel, the nanoantenna geometrical parameters are tuned so as to support localized surface plasmon resonances (and hence large field enhancements at the nanoscale) within different regions of the infrared spectrum. As a result, a single chip is capable of performing analysis from the region of functional groups to that of fingerprint. Two different designs are fabricated via electron beam lithography, functionalized with a correlated antibody for the detection of 25(OH)D3, and characterized via Fourier-transform infrared spectroscopy. Our experiments demonstrate the capability to detect a concentration as low as 86 pmol/L, and an amount of immobilized small molecules of 25(OH)D3 monohydrate (molecular weight: 418.65 g/mol) as low as 4.31 amol over an area of 100 × 100 µm2.
1 Introduction
Given the continuous aging of the population, an increasing demand for analysis of 25-hydroxyvitamin D (25(OH)D), the best general indicator of vitamin D status, has been observed worldwide since the early 2000s [1]. It is indeed estimated that about one billion people suffer from vitamin D deficiency or insufficiency worldwide (PMID: 17634462), particularly among the elderly population [1]. The deficiency of vitamin D in elderlies is often associated with cognitive decline (PMID: 23185713), bone diseases (PMID: 31792684), impaired muscle strength, and reduced physical performance (PMID: 31686797). Such deficiency has also been associated with other medical conditions, including diabetes, cancer, autoimmune and cardiovascular diseases, all of which can increase mortality. Vitamin D is a challenging analyte to measure accurately, because of its highly lipophilic nature, high affinity for binding proteins, as well as the presence of multiple vitamin D metabolites in the circulation. Such challenging measurements are carried out in specialized laboratories via time- and resource-consuming methods. Manufacturers have experienced significant problems in developing high-throughput, reliable, automated assays, and many marketed products have been withdrawn because of poor analytical accuracy. A recent study [2] on newly introduced automated assays for the measurement of 25(OH)D found that they generally perform satisfactorily at high concentrations (258 nmol/L), but tend to fail at low concentrations; specifically, 50% and 100% of the examined assays failed at concentrations of 24.2 and 12.8 nmol/L, respectively.
The detection of molecules at extreme low concentrations is a problem of crucial relevance and impact not only in the fields of medicine and pharmacology, but also for emerging applications such as trace chemical detection, homeland security, food safety and forensic sciences. Among the various approaches, far-field mid-infrared (MIR) spectroscopy is a standard analysis technique for detection and identification of molecules [3], via their own characteristic absorption spectrum, in a univocal, non-destructive and label-free fashion. In particular, complex vibrational characteristics of molecules in bulk materials occurring within the so-called “fingerprint” region (1500–600 cm−1 in wavenumber, ∼6–16 μm in wavelength) can be effectively distinguished via MIR spectroscopy, thereby enabling unambiguous identification of molecular structures and species [4]. However, because of the very low molecular absorption cross-section of infrared vibrations (σabs ≈ 10−20 cm2), as predicted by Beer’s Law, this technique fails at extremely low concentrations [5]. Plasmonic enhancement can overcome this limitation, by significantly boosting the light-matter interaction at molecular sites [6], [7]. One such way to achieve signal amplification is surface-enhanced infrared absorption (SEIRA) spectroscopy, which exploits metallic nanoantennas (NAs) supporting localized surface plasmon resonances (LSPRs) to enhance the light-molecule interactions in the MIR range [8], [9], [10], [11]. Typical implementations are based on “metasurfaces” comprising 2-D arrangements of plasmonic NAs [12], [13], [14], [15], which can be functionalized to adsorb specific chemical and biological substances, and engineered to support well-defined LSPRs characterized by strong field enhancement [15], [16], [17], [18], [19], [20], [21], [22]. For optimal sensing performance, the resonance spectrum must match the absorption band of the substance to be detected [23], [24]. Essentially, the resonance spectral position scales with the NA size and the refractive index (RI) of the surrounding medium [25]. Other geometrical properties of the NAs (periodicity, shape, and thickness) can also be varied to tailor the resonance lineshape and linewidth. This enables the resonance tuning within the spectral range of interest, with high spatial reproducibility [12], [13], [14], [15], so as to optimize the SEIRA detection sensitivity [15], [16], [17], [18], [19], [20], [21], [22]. Specifically, enhanced absorption signals have been observed from individual NAs [16], [17], [18], [19], [20], [21], and SEIRA-based gas sensing has recently been demonstrated by using graphene plasmon resonances [22].
In this study, we report on the experimental detection of 25(OH)D3 by exploiting plasmonic metasurfaces based on 2-D arrays of gold NAs on a silicon substrate. The coupling between neighbor NAs ensures a significant near-field signal enhancement. In particular, we design a large area (several mm2) pixeled metasurface, with different pixels engineered so as to operate within separate spectral ranges, from the region of functional groups to that of fingerprint. The metasurface is fabricated by using a float-zone silicon wafer as a substrate, and a gold film patterned via electron beam lithography (EBL), which guarantees a high reproducibility. This results in a very homogeneous, robust and recyclable device. Specifically, we consider two different NA designs, namely, cross-shaped (CS) and star-shaped (SS), which minimize the sensitivity with respect to the polarization of the impinging light, and improve the robustness with respect to the random orientation of the molecule dipole moments. Thanks to the combined individual and collective NA plasmonic responses, we attain large signal enhancement factors within the range 103–105. While CS-type designs have already been reported as RI sensors [26], [27] also in SEIRA scenarios [28], the SS-type design has not been reported hitherto. This new design enables the detection of extremely low concentrations of analytes owing to its more effective space-filling properties that facilitate the molecule binding and also provide additional near-field hotspots. As a result, we are able to improve the sensitivity and to detect concentrations as low as 86 pmol/L, and amounts of immobilized small molecules of 25(OH)D3 (with molecular weight, MW: 418.65 g/mol) as low as 4.31 amol over an area of 100 × 100 μm2.
2 Materials and methods
2.1 Modeling and design
The modeling and design of the metasurfaces in this study relied on full-wave numerical simulations carried out via the finite-element-based commercial software package Ansys HFSS electromagnetics suite 16.2 [29].
In our simulations, the metasurfaces were modeled as 2-D periodic arrangements of gold NAs (of thickness t = 50 nm) laid on a silicon substrate. For gold, we assumed a conductivity σ = 15 × 106 S/m [30], whereas the RI of silicon (essentially real-valued and constant within the spectral range of interest) was taken from Ref. [31]. In view of the periodicity, only a single unit cell was simulated, by assuming normally incident plane-wave illumination from air, with master/slave periodicity conditions enforced at the lateral walls. The illumination region and the substrate were truncated and terminated with a Floquet-type port and a perfectly matched layer, respectively; it was verified that the results remain essentially invariant for truncation lengths ≥5 µm in the substrate and ≥10 µm in air. The standard iterative solver was utilized, with default converge conditions and meshing, resulting in ∼160,000 elements.
Figure 1A illustrates the 3-D unit-cell pertaining to a CS-type NA, with the square periodic arrangement displayed in Figure 1B. For this geometry, Figure 1C and 1D shows some representative reflectance spectra, from a series of extensive parametric studies. Specifically, Figure 1C illustrates the effects of varying the period P (for fixed values of the armlength L and width W), whereas Figure 1D shows the effects of the armlength L (for fixed values of P and W). These results confirm that it is possible, via judicious choice of the geometrical parameters, to broadly tune the position and linewidth of the resonance peak over the spectral range of interest. The anomalous changes of slopes observed at certain wavenumbers are attributable to Rayleigh-Wood anomalies, i.e., the passing-off of spectral diffraction orders in transmission [32]. Figure 1E shows a typical resonant-field distribution over the unit cell, where, for a clearer visualization of the phenomenon, the impinging-field polarization is chosen as not aligned with the cross arms. As can be observed, hotspots are formed at the arm tips, with field enhancements of over two orders of magnitudes.
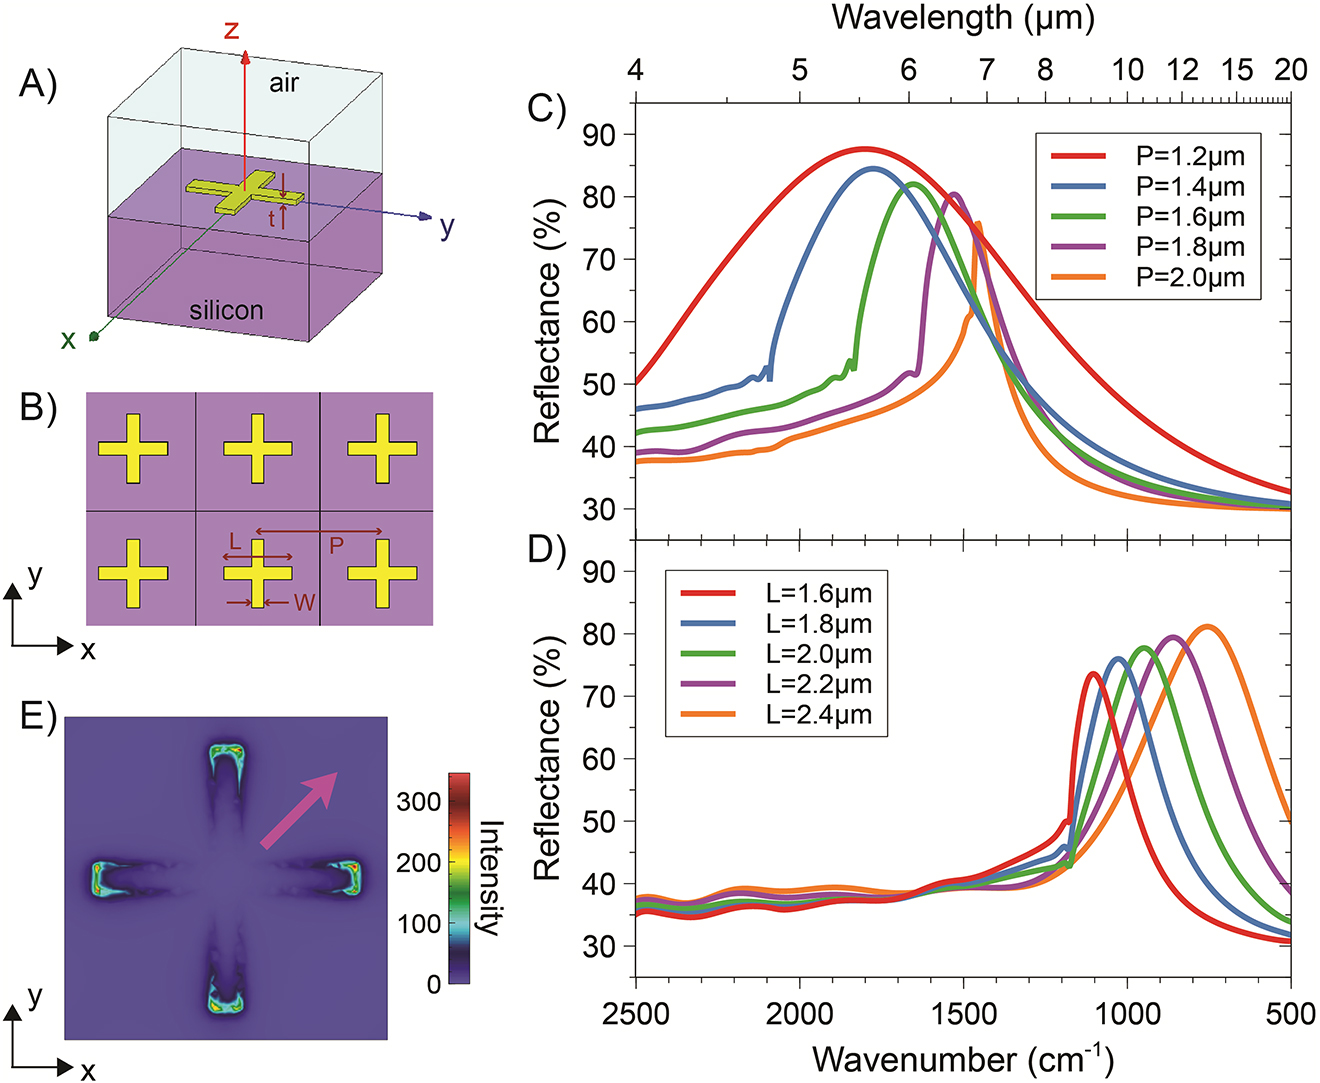
Representative numerical results for CS-type NAs. (A), (B) 3-D schematic of the unit cell and square periodic lattice, respectively, with indication of the geometrical parameters. (C) Reflectance responses, as a function of the wavenumber (and wavelength, on the top axis), for a normally incident plane-wave illumination with x-polarized electric field, width W = 200 nm and armlength L = 1.1 µm, and various values of the period P. (D) As in panel (C), but for fixed P = 2.5 µm, and various values of L. (E) Electric-field distribution (intensity, in false-color scale, normalized with respect to the incident one) over the unit cell, for L = 2.0 µm and P = 2.5 µm, computed at a distance of 10 nm (along z) from the NA at the resonance (wavenumber: 947 cm−1). The magenta thick arrow indicates the polarization of the impinging electric field.
Figure 2 shows the corresponding results for a higher-symmetry configuration featuring SS-type NAs arranged on a hexagonal periodic lattice. Qualitatively similar considerations as the previous example hold. By comparison with the CS-type design, the higher symmetry renders the optical response more robust with respect to the polarization of the impinging field. Moreover, the more effective space-filling properties (higher number of arms) favor the molecule binding with the NAs and also provide additional near-field hotspots, thereby enabling the detection of extremely low concentrations.
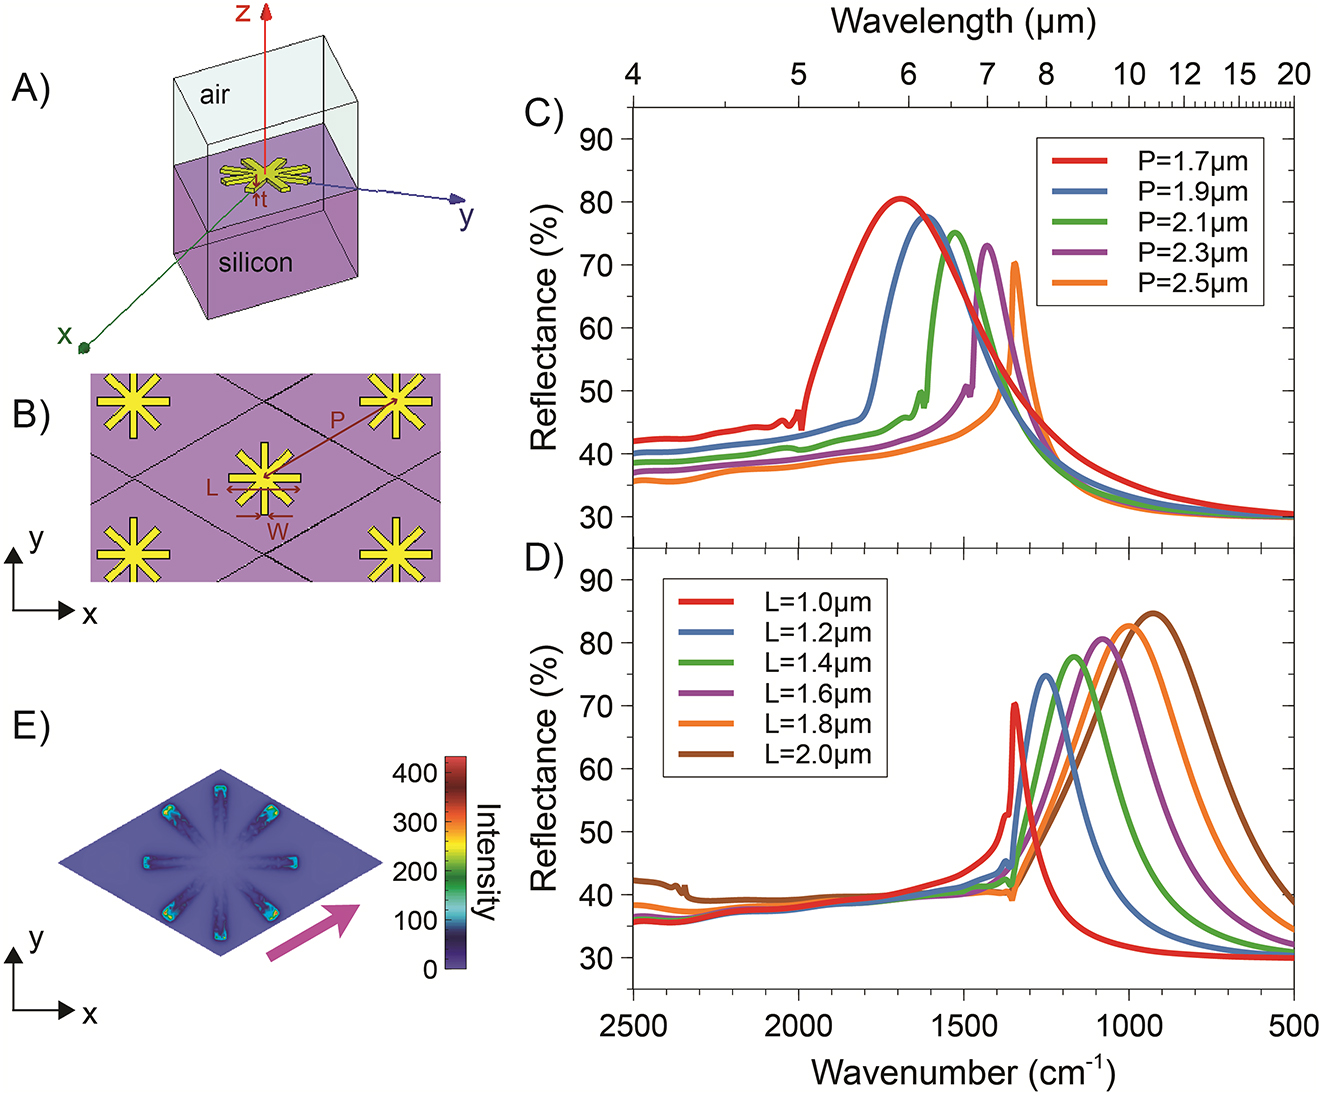
Representative numerical results for SS-type NAs. (A), (B) 3-D schematic of the unit cell and hexagonal periodic lattice, respectively, with indication of the geometrical parameters. (C) Reflectance responses, as a function of the wavenumber (and wavelength, on the top axis), for a normally incident plane-wave illumination with x-polarized electric field, width W = 110 nm and armlength L = 1.0 µm, and various values of the period P. (D) As in panel (C), but for fixed P = 2.5 µm, and various values of L. (E) Electric-field distribution (intensity, in false-color scale, normalized with respect to the incident one) over the unit cell, for L = 2.0 µm and P = 2.5 µm, computed at a distance of 10 nm (along z) from the NA at the resonance (wavenumber: 927.3 cm−1). The magenta thick arrow indicates the polarization of the impinging electric field.
Overall, from the above results, we estimate that the ratio between the period and effective resonant wavelength ranges from 0.4 to 0.6 for the CS-type geometry and from 0.6 to 0.7 for the SS one. This is a typical regime where collective effects are known to play a beneficial role in providing sharper resonances. As can be observed, the resonance linewidth tends to decrease for increasing values of the period, and the sharpest resonances are obtained nearby a Rayleigh-Wood anomaly for the transmitted field. Once again, this is consistent with what observed in related works (e.g., Ref. [10]).
2.2 Fabrication
Typical plasmonic materials used for resonant SEIRA include metals, such as gold, aluminum or silver. In this study, we chose gold since it is biocompatible, stable under ambient conditions, and it permits a robust and easily functionalization through self-assembled monolayers. Furthermore, this noble metal allows to get sharp plasmonic resonances in the MIR range. The proposed metasurfaces were fabricated by means of EBL and lift-off process. A schematic and a photograph of a typical realized chip are shown in Figure 3A and 3B, respectively. Each pixel, covering an area of 500 × 500 µm2, represents an array of NAs with different geometrical parameters, so as to attain on the same chip a set of plasmonic resonances placed within different regions of the MIR spectrum. Pixels are separated by a 1 mm distance to avoid overlapping. The NAs were fabricated on a float-zone silicon substrate: a negative mask was patterned in a positive tone resist by means of EBL and, after the development process, a 5 nm thick chromium film (acting as a buffer layer to increase gold adhesion) and a 50 nm thick gold film were sputtered on the whole substrate [33]. After the lift-off process, the NA morphology turned out to be homogenous and robust; the fabrication process confirmed its reproducibility with the fabrication of several chips exhibiting the same spectral characteristics. Each pixel is indexed as a 2 × 4 matrix element Ai,j, with the symbol A standing for CS or SS, for the two designs of interest. The detailed description of the geometrical parameters and resonance characteristics of each pixel, for both designs, are provided in the Supplementary Information (see Supplementary Note 1 and Figures S1 and S2). Figure 3C and 3D shows the scanning electron microscope (SEM) images of two representative CS- and SS-type pixels, respectively, with parameters detailed in the caption.
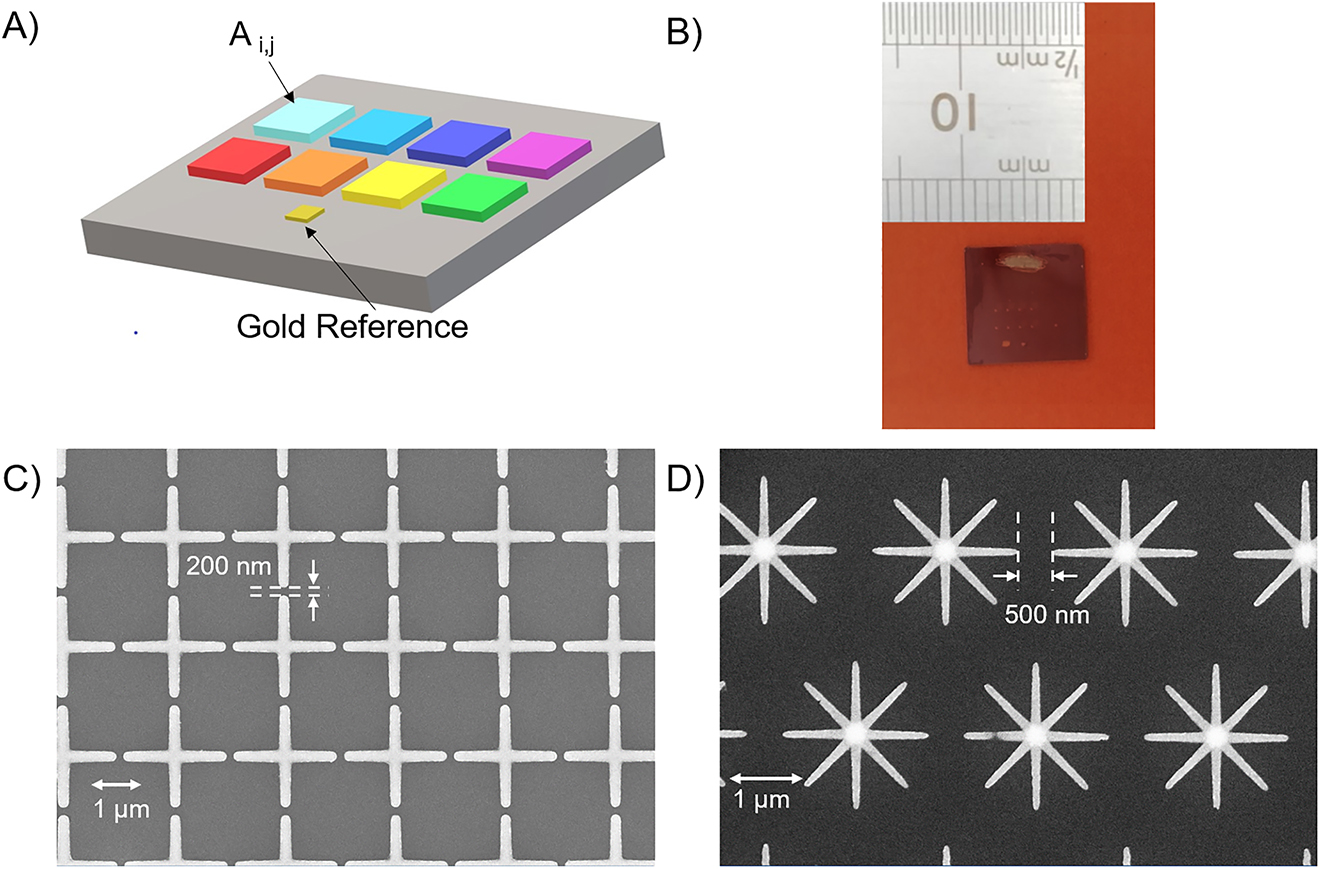
(A) Schematic of the pixeled metasurface. (B) Photograph of a typical 1 cm2 chip fabricated. (C), (D) Representative SEM images of CS-type (CS2,4, with L = 2.3 µm, P = 2.5 µm, W = 200 nm) and SS-type (SS2,4, with L = 2.0 µm, P = 2.5 µm, W = 110 nm) designs, respectively. The arrows indicate the minimum gap between adjacent NAs.
2.3 Functionalization
To detect the capture of 25(OH)D3 on the chip surface we used an immunoassay, i.e., a highly specific anti-25 hydroxy D antibody. The antibody concentration was determined by using an UV–Vis spectrophotometer (Nanodrop Instruments) measuring the absorbance at 280 nm at room temperature and by means of 1 cm quartz cells. The molar concentration (mol/L) was calculated by using the specific molar extinction coefficient (ε) equal to 210,000 (mol/L)−1 cm−1 for a typical IgG with MW = 147,000 g/mol. The 25(OH)D3 used in our experiments was vitamin D3 25-hydroxy monohydrate (MW = 418.65 g/mol), which was dissolved in ethanol at concentration of 1 mg/mL, and then was serially diluted in water at a final concentration of 130 ng/mL to obtain a solution at 0.86 nmol. A total of 442 fmol (solution volume 0.5 mL) were used for the immobilization on the gold surface. The antibody immobilization was achieved by adsorption, by exploiting the ability of proteins to strongly interact with gold [34]. This concentration was chosen by assuming that all antibody molecules were adsorbed on the gold surface and that a single monolayer of closely packed antibody molecules (average diameter 200 Å) was formed. 25(OH)D3 was dissolved in ethanol at 1 mg/mL and was then serially diluted in water at the following final concentrations: 600 ng/mL, 60 ng/mL, 36 ng/mL, 6 ng/mL, and 36 pg/mL. Since 0.5 mL solution samples were used in every experiment, amounts of hormone 25(OH)D3 ranging from 716 pmol to 43 fmol were obtained over the whole area of 1 cm2 (detailed calculation are reported in Supplementary Note 2). Figure 4 shows the structural formula of the 25(OH)D3 monohydrate and its IR spectra.
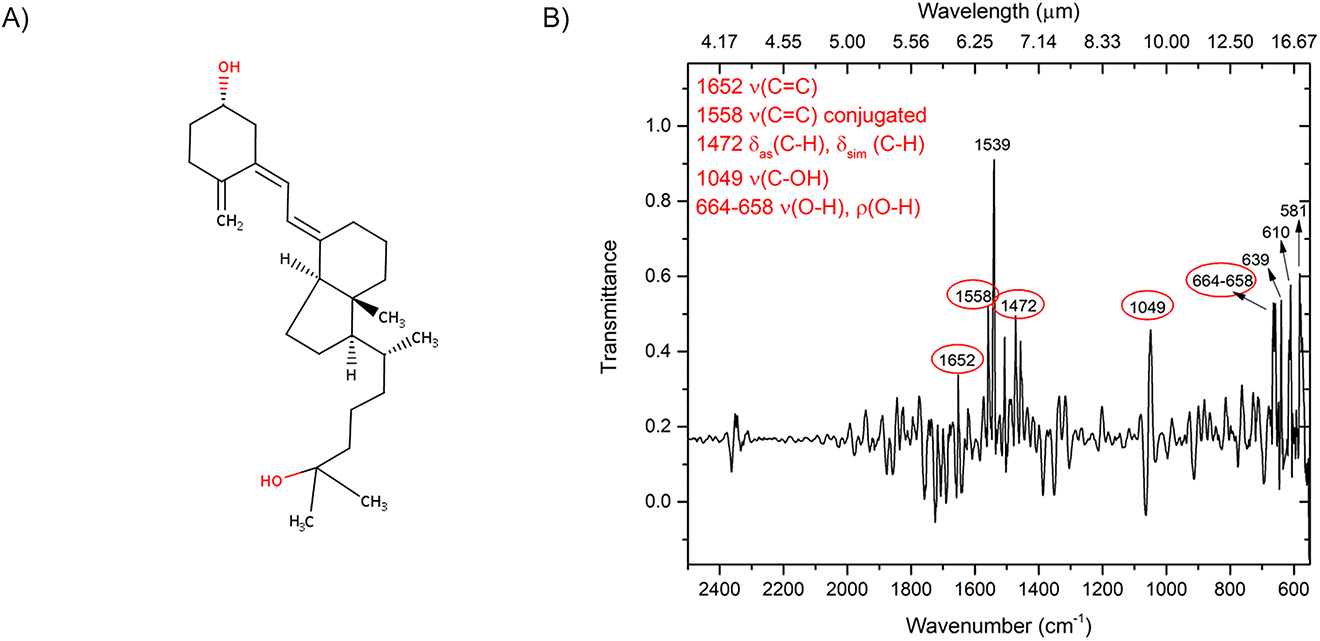
(A) Skeletal formula of 25(OH)D3 monohydrate; (B) Attenuated Total Reflectance-FTIR characterization spectrum of 25(OH)D3 monohydrate: the targeted wavenumbers of interest in our SEIRA experiments are marked with red ellipses.
In a parallel experiment, we used an unrelated antibody (IgG1) in order to verify the specificity of the binding of 25(OH)D3. In this case, we did not observe any difference in the reflectance spectra of our device before and after the linking procedure of 25(OH)D3, thereby confirming the failure of the binding procedure. We also tested the binding capability of the 25(OH)D3 alone on naked gold NAs, observing a rate of success lower than 50%. This observation suggested that the presence of the unrelated antibody also prevented the unspecific adsorption of the 25(OH)D3 on the gold surface. Binding measurements were performed following the procedure described above, by using 25(OH)D3 at concentrations of 600 ng/mL, 60 ng/mL, 36 ng/mL, 6 ng/mL, and 36 pg/mL.
2.4 MIR measurements
The MIR spectroscopy of our plasmonic pixeled metasurface was performed by using a Perkin Elmer Spectrum One Fourier-transform IR (FTIR) spectrometer, equipped with a Mercury cadmium telluride nitrogen cooled detector and a Perkin Elmer Multiscope system with a 10× optical or 15× IR magnification. The measurement area was set to 100 × 100 µm2 thanks to knife-edge apertures. All acquired spectra were automatically normalized to a background spectrum pertaining to a flat unpatterned gold layer (of same thickness as the NAs) deposited on the same substrate. The measurements were performed with a spectral resolution of 4 cm−1 by collecting, at room temperature, the reflected signal within the spectral region 4000–600 cm−1, by using 128 scans with 5s acquisition time for each spectrum.
3 Discussion
As previously discussed, our engineered pixeled metasurface enables the spectral tuning and tailoring of several LSPRs, thereby allowing a good overlap with the narrow MIR-active molecular vibrations. It is therefore possible to explore both the functional group and fingerprint regions on the same substrate, by utilizing the same functionalization steps.
Based on our simulation study, we fabricated metasurfaces with two different designs (CS and SS), characterized by different length L, period P and width W, in order to cover the MIR region 2500–500 cm−1 (see Supplementary Note 1 and Figures S1 and S2 for details). Figure 5 shows a comparison between representatives measured and simulated reflection spectra for both CS- and SS-type designs. In these specific examples, both pixels are tuned for the coupling to the fingerprint region before the molecule adsorption. Specifically, Figure 5A shows the reflectance spectrum pertaining to pixel CS2,3 (L = 2.0 μm, P = 2.5 μm, W = 200 nm), exhibiting a plasmonic resonance at a wavenumber of 934 cm−1 with ∼90% reflectance. Figure 5B shows instead the results pertaining to pixel SS2,4 (L = 2.0 μm, P = 2.5 μm, W = 110 nm), for which the plasmonic resonance is peaked at a wavenumber of 917 cm−1 with ∼70% reflectance. As can be observed in both cases, the positions of the resonance peaks are well matched by the numerical predictions, thereby validating our design procedure of NAs pixels with desired spectral characteristics. Qualitatively similar agreements were observed for the other pixels as well (see Supplementary Note 1). The mild disagreement between experimental and simulated responses is attributable to the slight deviations between the geometrical parameters of the manufactured nanostructures and the nominal ones, which are due to the EBL manufacturing procedure [35]. In particular, as visible in Figure 3C and 3D, the proximity effect makes it difficult to realize sharp edges.
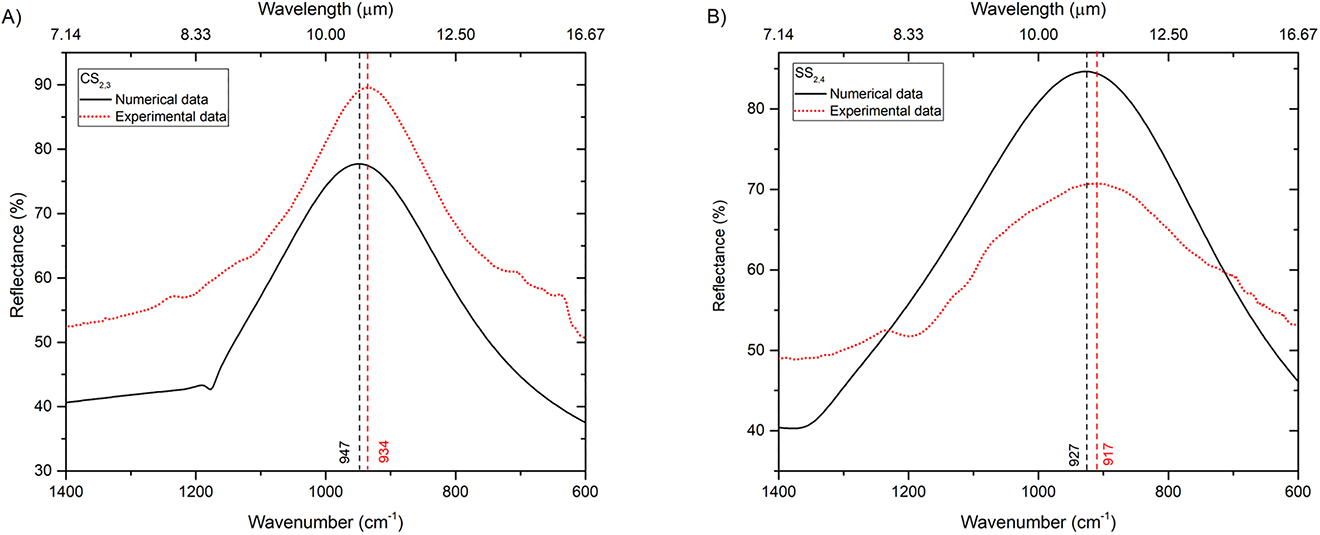
Comparison between simulated and experimental reflectance curves for naked NAs pixels (no molecules adsorbed). (A) Pixel CS2,3 (L = 2.0 µm, P = 2.5 µm, W = 200 nm). (B) Pixel SS2,4 (L = 2.0 µm, P = 2.5 µm, W = 110 nm).
As previously mentioned, an accurate analysis of the total 25(OH)D3 (calcifediol) level is crucial for the predictive diagnoses of vitamin D-related diseases. The reference range of the total 25(OH)D3 level in the blood stream is 25–80 ng/mL. Vitamin D deficiency incurs when the level of 25(OH)D3 is lower than 20 ng/mL (50 nmol/L), while insufficiency incurs within the range 21–29 ng/mL (52–72 nmol/L) [36]. This is based on the observed physiological changes in calcium absorption and parathyroid hormone (25(OH)D3) levels that occur with changes in vitamin D levels. The 25(OH)D3 (C27H44O2) molecule is characterized by a small molecular weight (MW = 418.65 g/mol for monohydrate formulation). As detailed in Section 2.3, in order to detect the 25(OH)D3, we first prepared a monolayer of the anti-25 hydroxy vitamin D3 specific antibody 2F4, and subsequently we exposed the surface to solutions of 25(OH)D3 (0.5 mL) at the concentrations values indicated in Section 2.3.
The reference analytical characterization of the 25(OH)D3 utilized in our experiment, via FTIR analysis of a solid-form sample, is reported in Figure 4B. More specifically, the vibrational bands reported in Figure 4B were utilized to detect the presence of the 25(OH)D3 on our metasurface pixels.
The gold NAs were functionalized with the antibody solution, and the FTIR spectra were examined before and after the antibody adsorption on their surface, and again after the binding with the 25(OH)D3. The amount of antibody adsorbed on the whole chip area of 1 cm2 was estimated to be 442 fmol. Considering an area coverage exposed to the light of 100 × 100 μm2, we were able to detect in a single measurement 44.1 amol of antibody. Figure 6A shows the SEIRA spectra pertaining to a single pixel (CS1,2) before and after the adsorption of the correlated antibody, and after the binding with the 25(OH)D3 molecules. After the 25(OH)D3 binding, the resonance peak was redshifted of 69 cm−1. This behavior is due to the polarizability variation of the medium surrounding the NAs induced by the adsorbed compound. LSPR sensing is based on this type of shift [24], which arises from the confined plasmonic near field. Indeed, at visible and near IR wavelengths, the confined plasmonic near field is extremely sensitive to the RI modifications of the surrounding medium. Typical sensitivity for LSPR sensors is ∼2 × 10² nm/RIU [37]. LSPR sensors are less performing than surface-plasmon-polaritons-based sensors, but can perform better for the detection of few biomolecules having low molecular weight (<500 g/mol). Recalling that the RI difference between air and 25(OH)D3 is 0.523, we estimated for the pixel CS1,2 a sensitivity of 549 nm/RIU. All pixels exhibited values of sensitivity between 500 and 800 nm/RIU, which are in line with those reported in the literature for similar sensors [37].
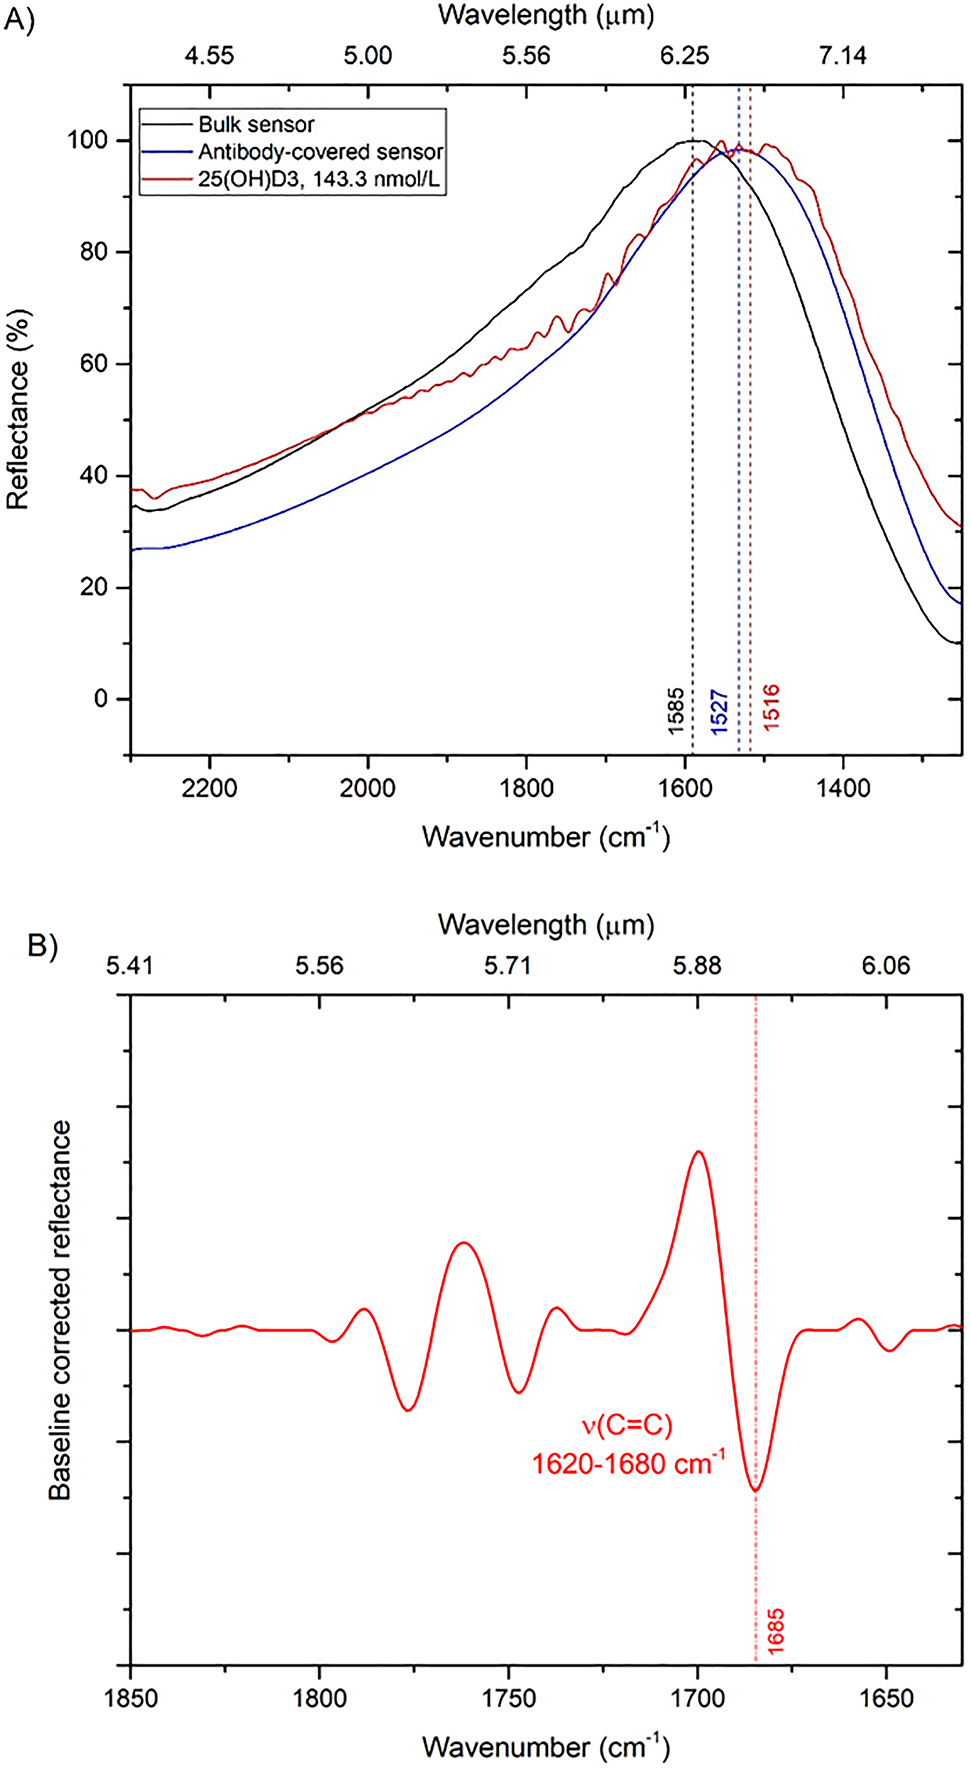
SEIRA spectra. (A) Reflectance curves (black: naked sensor; blue: sensor with adsorbed antibody monolayer; red: sensor with bound 25(OH)D3 with a concentration of 143.33 nmol/L) pertaining to pixel CS1,2 (L = 1.1 µm, P = 2.0 µm, W = 200 nm). (B) Baseline-corrected reflectance with the detected molecular vibration, i.e., stretching of the carbon double bond ν(C=C), vibrating in the range 1620–1680 cm−1.
The lowest concentration of 25(OH)D3 that could be detected with the CS design is 60 ng/mL (143.33 nmol/L). The SEIRA spectra of pixel CS1,2 show at 1685 cm−1 the vibrational band corresponding to the stretching of the carbon double bond ν(C=C); the baseline corrected reflectance is shown in Figure 6B.
Figure 7 shows the baseline-corrected SEIRA spectra for different concentrations of 25(OH)D3 of representative pixels pertaining to different metasurfaces, namely, CS1,3, CS2,4, SS1,2, and SS2,4; the corresponding SEIRA reflectance spectra are reported in Figure S3 of the Supplementary Information.
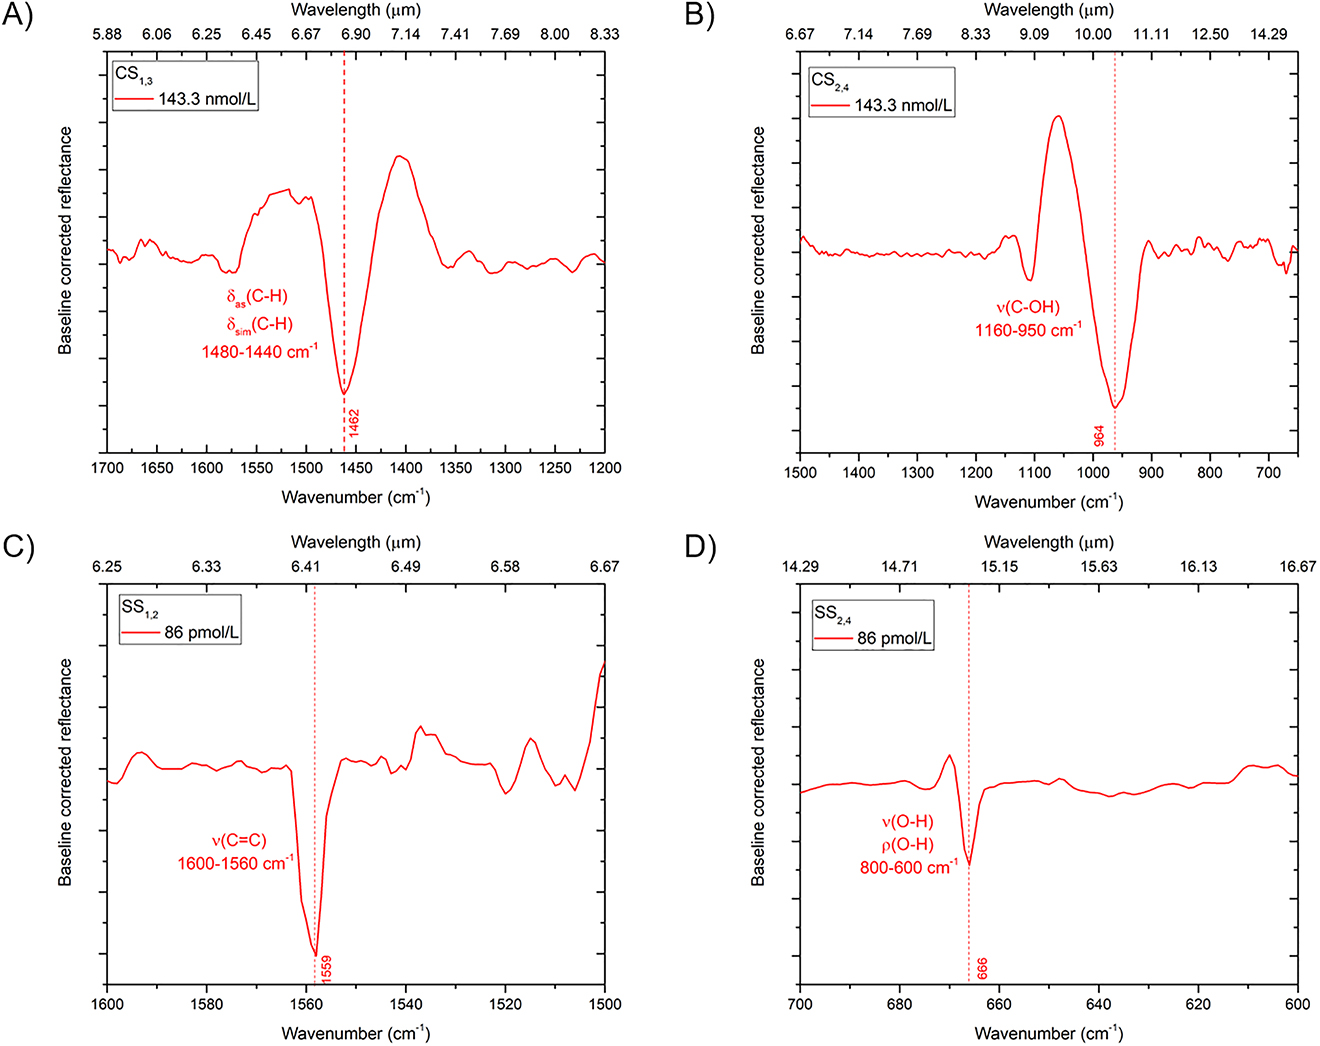
Baseline-corrected reflectance spectra pertaining to representative pixels for different concentrations of 25(OH)D3. (A) Pixel CS1,3 (L = 1.3 µm, P = 2.0 µm, W = 200 nm) with 143.33 nmol/L concentration; the detected SEIRA peak is associated with the bending in plane of the –CH3 methyl group δas(C–H) and δsim(C–H) of –CH2– group. (B) Pixel CS2,4 (L = 2.3 µm, P = 2.5 µm, W = 200 nm) with 143.33 nmol/L concentration; the detected SEIRA peak is associated with the stretching of carbon-hydroxyl group ν(C–OH). (C) Pixel SS1,2 (L = 1.0 µm, P = 1.7 µm, W = 110 nm) with 86 pmol/L concentration; the detected SEIRA peak is associated with the stretching of the conjugated carbon double bond ν(C=C). (D) Pixel SS2,4 (L = 2.0 µm, P = 2.5 µm, W = 110 nm) with 86 pmol/L concentration; the detected SEIRA peak is associated with the out-of-plane bending of the hydroxyl group ν(O–H) and the in-plane bending of the hydroxyl group ρ(O–H).
The pixel CS1,3, characterized by a (naked) resonance centered at 1485 cm−1, exhibits an SEIRA peak at 1462 cm−1 associated with the methyl group bending in plane (scissoring) δas(C–H) of –CH3 group and δsim(C–H) of –CH2– group between 1480 and 1440 cm−1 (Figure 7A). For the pixel CS2,4 (L = 2.3 μm, P = 2.5 μm, W = 200 nm), characterized by (naked) resonance centered at 827 cm−1, we observe instead a resonant SEIRA peak at 964 cm−1 associated to the stretching of carbon-hydroxyl group bond ν(C–OH) within the spectral range 1160–950 cm−1 (Figure 7B).
A precise tuning of the NA resonance with the different vibration bands is necessary for the appearance of the vibrational signal. The enhancement factor (EF), useful for quantifying the sensitivity of resonant SEIRA effects, is defined as [13], [23]
where ΔR is the difference of the reflectance values (in correspondence of the vibrational signature) without and with the molecules, ΔR0 is the reflectance difference with respect to a flat gold layer with same thickness as the NAs (deposited on the same substrate; see the schematic in Figure 3A) and acquired in the same conditions utilized for the pixels. Moreover, A0 is the area of the NAs exposed to the light (100 × 100 μm2, in our case), and ASEIRA is the effective area of NAs on which the field is localized. As reported in the literature [9], [17], and as can be observed in Figures 1E and 2E, the field is mainly localized on the tips of the NAs arms. As detailed in Supplementary Note 3, we estimate EF values of 1.8 × 10⁵ for pixel CS1,2, 3.4 × 10⁵ for pixel CS2,4, and 6.4 × 10³ for pixel CS1,3.
To possibly reveal lower concentrations of molecules, we also explored the SS-type design which, for an equivalent area, doubles the number of arm tips exposed to light, thereby favoring the molecule binding and increasing the number of near-field hotspots. The baseline-corrected SEIRA spectra pertaining to pixel SS1,2 (L = 1.0 μm, P = 1.7 μm, W = 110 nm) is shown in Figure 7C. This pixel, characterized by a (naked) resonance centered at 1553 cm−1, exhibits a resonant SEIRA peak at 1559 cm−1 associated with the stretching of carbonium double bond ν(C=C). The presence of the conjugation with another double bond, as in our case, moves the absorption toward lower wavenumbers, i.e., 1600–1560 cm−1. This metasurface was functionalized with a concentration of 25(OH)D3 as low as 36 pg/ml (86 pmol/L), i.e., well below the minimum threshold reached by the methods used nowadays and below the clinically relevant levels [36], [38]. The EF estimated for this pixel is 1.1 × 10⁵. Figure 7D shows instead the results corresponding to pixel SS2,4 (L = 2.0 μm, P = 2.5 μm, W = 110 nm). For this pixel, characterized by a (naked) resonance centered at 917 cm−1, a resonant SEIRA peak appears at 666 cm−1; it can be attributed to the out-of-plane bending and stretching of the hydroxyl group ν(O–H) and to the in-plane bending (rocking) of the hydroxyl group ρ(O–H) occurring within spectral the range 800–600 cm−1, as well as to the deformation of the ring. However, since these bands are found within the fingerprint region, it is not always easy to assign them. The EF estimated for this pixel is 3.1 × 10⁵.
All the peaks highlighted through the SEIRA effect have been associated to the corresponding vibrational bands of the molecule through the use of the IR analysis made on the sample in solid form of the molecule (see Figure 4B).
Table 1 summarizes the measurements carried out in terms of the following parameters: Concentration of 25(OH)D3 in molarity (numbers of moles of analyte in one liter solution), targeted vibrational band of the functional groups, corresponding wavenumbers, pixel utilized, resonance peak (i.e., center of the peak of the resonance with the 25(OH)D3 bound on NAs), ΔR (difference of the reflectance values, in correspondence of the vibrational signature, without and with the molecules), effective area ASEIRA of NAs on which the field is localized, EF, and resonant shift with respect to the naked NAs.
Summary of main measurement results.
| 25(OH)D3 M(mol/L) | Target vibrational mode | Targeted wavenumber (cm−1) | Pixel type | Resonance peak (cm−1) | ΔR (%) | ASEIRA (nm2) | EF | Total shift (cm−1) |
|---|---|---|---|---|---|---|---|---|
| 143.33 nM | ν(C=C) | 1685 | CS1,2 | 1516 | 17 | 1.6 × 10⁸ | 1.8 × 10⁵ | 69 |
| 143.33 nM | δas(C–H) δsim(C–H) | 1462 | CS1,3 | 1451 | 2 | 1.6 × 10⁸ | 6.4 × 10³ | 34 |
| 143.33 nM | ν(C–OH) | 967 | CS2,4 | 797 | 31 | 108 | 3.4 × 10⁵ | 30 |
| 86 pM | ν(C=C) | 1559 | SS1,2 | 1524 | 5 | 1.6 × 10⁸ | 1.1 × 10⁵ | 29 |
| 86 pM | ν(O–H) ρ(O–H) | 666 | SS2,4 | 888 | 11 | 7.3 × 10⁷ | 3.1 × 10⁵ | 29 |
We highlight that the EF parameter does not account for the concentration value. It is a conventional definition of SEIRA sensitivity which relates the enhanced signal strengths to standard IR techniques for each device, and therefore it is not necessarily meaningful (and potentially misleading) to compare this parameter for different devices that operate with different concentration levels.
The obtained EF values are comparable with the best values reported in the literature (ranging from 103 to 105), confirming the competitive performance of our devices and the potentials of the approach. Our proposed pixeled metasurface is not only capable of detecting extremely low concentrations of analyte, but it also provides attractive advantages with respect to traditional methods based on radioactive compounds, that are time- and reagent-consuming, and require disposal, pretreatment procedures and expensive instrumentation [38].
4 Conclusions
By using a pixeled plasmonic metasurface, we have experimentally demonstrated the multiwavelength detection of 25(OH)D3, which is the most common marker of vitamin D3. Each pixel of the metasurface supports LSPRs tuned to different parts of the MIR spectrum by varying the geometrical parameters. Specifically, we evaluated two NA designs (CS and SS), with varying armlength (0.8−2.5 μm), period (1.7−2.5 μm), and width (100−200 nm). For the CS design (with square lattice), we observed the best performance in terms of EF for the pixel having the smallest gap (200 nm) between adjacent arm tips (EF = 2.2 × 10⁵). In this case, the minimum detected concentration was 143.32 nmol/L, and the number of molecules linked to an area of 100 × 100 μm2 was 71.5 pmol.
With the SS-type design (with hexagonal lattice), which exhibits a double number of tips for the same area coverage, concentrations as low as 86 pmol/L could be detected. For an illuminated area of 100 × 100 μm2, we were able to detect an absolute amount of 25(OH)D3 as small as 4.31 amol characterized by a low molecular weight (MW = 418.65 g/mol). Further work will be devoted to determining the concentration dynamic range of operation and the limit-of-detection parameter.
Our pixeled design enables the recognition of different vibrational bands occurring within different parts of the MIR spectrum. The device can be easily integrated with micrometer-sized channels so as to be apt for the high-sensitivity, real-time analysis of IR emitting samples, in applications where IR spectroscopy is severely limited due to the absorption bands of liquid water.
We propose to develop a new plasmonic platform to be used as a window in FTIR spectrometry and a new disruptive accessory, either in reflection or transmission mode. Our proposed approach can establish a method for identifying the presence of at least one contaminant substance in a physical sample in conjunction with a spectrometer. The method requires to have a reference sample of the contaminant substance for reference spectral analyses. With a suitable choice of the functionalization method (immune assay like in our case), the metasurface can be used to detect pathogens in trace amounts. Our proposed platform provides inherent advantages with respect to traditional methods (based on radioactive compounds) that are time- and reagent-consuming and require disposal, pretreatment procedures and expensive instrumentation.
Funding source: Italian Ministry of Education, University and Research (MIUR)
Award Identifier / Grant number: PON03PE_00155_2
Funding source: European Union
Funding source: Campania Region
Award Identifier / Grant number: POR FESR 2014–2020
Acknowledgments
The work has been supported by the Italian Ministry of Education, University and Research (MIUR) through the project OPTIMA (PON03PE_00155_2), the European Union through the project RaDFOS − Radiation Dosimetry with Fiber Optic Sensors (Horizon 2020), and the Campania Region through the project NANOCAN (POR FESR 2014–2020).
Author contribution: All the authors have accepted responsibility for the entire content of this submitted manuscript and approved submission.
Research funding: The work has been supported by the Italian Ministry of Education, University and Research (MIUR)through the project OPTIMA (PON03PE_00155_2), the European Union through the project RaDFOS – Radiation Dosimetry with Fiber Optic Sensors (Horizon 2020), and the Campania Region through the project NANOCAN (POR FESR 2014–2020).
Conflict of interest statement: The authors declare no conflicts of interest regarding this article.
References
[1] N. M. Van Schoor and P. Lips, “Worldwide vitamin D status,” Best Pract. Res. Clin. Endocrinol. Metabol., pp. 671–680, 2011, https://doi.org/10.1016/j.beem.2011.06.007.Suche in Google Scholar
[2] A. Viljoen, D. K. Singh, K. Farrington, and P. J. Twomey, “Analytical quality goals for 25-vitamin D based on biological variation,” J. Clin. Lab. Anal., vol. 25, pp. 130–133, 2011, https://doi.org/10.1002/jcla.20446.Suche in Google Scholar
[3] B. H. Stuart, Infrared spectroscopy: Fundamentals and applications, England, Wiley Online Library, 2005.10.1002/0470011149Suche in Google Scholar
[4] N. L. Alpert, W. E. K. Herman, and A. Szymanski, IR theory and practice of infrared spectroscopy, 2nd edn. Springer, 1970.10.1007/978-1-4684-8160-0_1Suche in Google Scholar
[5] I. Amenabar, S. Poly, W. Nuansing, et al., “Structural analysis and mapping of individual protein complexes by infrared nanospectroscopy,” Nat. Commun., vol. 4, pp. 2890, 2013, https://doi.org/10.1038/ncomms3890.Suche in Google Scholar
[6] S. A. Maier, Plasmonics: Fundamentals and applications, New York, Springer-Verlag, 2007.10.1007/0-387-37825-1Suche in Google Scholar
[7] R. Stanley, “Plasmonics in the mid-infrared,” Nat. Photon., vol. 6, pp. 409–11, 2012, https://doi.org/10.1038/nphoton.2012.161.Suche in Google Scholar
[8] T. R. Jensen, R. P. Van Duyne, S. A. Johnson, and V. A. Maroni, “Surface-enhanced infrared spectroscopy: a comparison of metal island films with discrete and non-discrete surface plasmons,” Appl. Spectrosc., vol. 54, pp. 371–377, 2000, https://doi.org/10.1366/0003702001949654.Suche in Google Scholar
[9] F. Neubrech, A. Pucci, T. W. Cornelius, S. Karim, A. García-Etxarri, and J. Aizpurua, “Resonant plasmonic and vibrational coupling in a tailored nanoantenna for infrared detection,” Phys. Rev. Lett., vol. 10, 2008, Art no. 157403, https://doi.org/10.1103/physrevlett.101.157403.Suche in Google Scholar
[10] R. Adato, A. A. Yanik, J. J. Amsden, et al., “Ultra-sensitive vibrational spectroscopy of protein monolayers with plasmonic nanoantenna arrays,” Proc. Nat. Acad. Sci. USA, vol. 106, pp. 19227–19232, 2009, https://doi.org/10.1073/pnas.0907459106.Suche in Google Scholar
[11] J. Kundu, F. Le, P. Norlander, and N. J. Halas, “Surface enhanced infrared absorption (SEIRA) spectroscopy on nanoshell aggregate substrates,” Chem. Phys. Lett., vol. 452, pp. 115–119, 2008, https://doi.org/10.1016/j.cplett.2007.12.042.Suche in Google Scholar
[12] S. Aksu, A. A. Yanik, R. Adato, A. Artar, M. Huang, and A. Altug, “High-throughput nanofabrication of infrared plasmonic nanoantenna arrays for vibrational nanospectroscopy,” Nano Lett., vol. 10, pp. 2511–2518, 2010, https://doi.org/10.1021/nl101042a.Suche in Google Scholar
[13] C. D’Andrea, J. Bochterle, A. Toma, et al., “Optical nanoantennas for multiband surface-enhanced infrared and Raman spectroscopy,” ACS Nano, vol. 7, pp. 3522–3531, 2013, https://doi.org/10.1021/nn4004764.Suche in Google Scholar
[14] M. Abb, Y. Wang, N. Papasimakis, C. H. de Groot, and O. L. Muskens, “Surface enhanced infrared spectroscopy using metal oxide plasmonic antenna arrays,” Nano Lett., vol. 14, pp. 346–352, 2014, https://doi.org/10.1021/nl404115g.Suche in Google Scholar
[15] F. B. Barho, F. Gonzalez-Posada, M.-J. Milla, et al., “Highly doped semiconductor plasmonic nanoantenna arrays for polarization selective broadband surface-enhanced infrared absorption spectroscopy of vanillin,” Nanophotonics, vol. 7, pp. 507–516, 2018, https://doi.org/10.1515/nanoph-2017-0052.Suche in Google Scholar
[16] R. Bukasov and J. S. Shumaker-Parry, “Silver nanocrescents with infrared plasmonic properties as tunable substrates for surface enhanced infrared absorption spectroscopy,” Anal. Chem., vol. 81, pp. 4531–4535, 2009, https://doi.org/10.1021/ac900477p.Suche in Google Scholar
[17] D. Dregely, F. Neubrech, H. Duan, R. Vogelgesang, and H. Giessen, “Vibrational near-field mapping of planar and buried three-dimensional plasmonic nanostructures,” Nat. Commun., vol. 4, pp. 223, 2013, https://doi.org/10.1038/ncomms3237.Suche in Google Scholar
[18] R. Adato and H. Altug, “In situ ultra-sensitive infrared absorption spectroscopy of biomolecule interactions in real time with plasmonic nanoantennas,” Nat. Commun., vol. 4, pp. 2154, 2013, https://doi.org/10.1038/ncomms3154.Suche in Google Scholar
[19] R. Adato, A. Artar, S. Erramilli, and H. Altug, “Engineered absorption enhancement and induced transparency in coupled molecular and plasmonic resonator systems,” Nano Lett., vol. 13, pp. 2584–2591, 2013, https://doi.org/10.1021/nl400689q.Suche in Google Scholar
[20] L. V. Brown, X. Yang, K. Zhao, B. Y. Zheng, P. Nordlander, and N. J. Halas, “Fan-shaped gold nanoantennas above reflective substrates for surface-enhanced infrared absorption (SEIRA),” Nano Lett., vol. 15, pp. 1272–1280, 2015, https://doi.org/10.1021/nl504455s.Suche in Google Scholar
[21] D. Yoo, D. A. Mohr, F. Vidal-Codina, et al., “High-contrast infrared absorption spectroscopy via mass-produced coaxial zero-mode resonators with sub-10 nm gaps,” Nano Lett., vol. 18, pp. 1930–1936, 2018, https://doi.org/10.1021/acs.nanolett.7b05295.Suche in Google Scholar
[22] H. Hu, X. Yang, X. Guo, et al., “Gas identification with graphene plasmons,” Nat. Commun., vol. 10, pp. 1131, 2019, https://doi.org/10.1038/s41467-019-09008-0.Suche in Google Scholar
[23] F. Neubrech, C. Huck, K. Weber, A. Pucci, and H. Giessen, “Surface-enhanced infrared spectroscopy using resonant nanoantennas,” Chem. Rev., vol. 117, pp. 5110–5145, 2017, https://doi.org/10.1021/acs.chemrev.6b00743.Suche in Google Scholar
[24] R. Adato, S. Aksu, and H. Altug, “Engineering mid-infrared nanoantennas for surface enhanced infrared absorption spectroscopy,” Mater. Today, vol. 18, pp. 436–446, 2015, https://doi.org/10.1016/j.mattod.2015.03.001.Suche in Google Scholar
[25] L. Novotny, “Effective wavelength scaling for optical antennas,” Phys. Rev. Lett., vol. 98, 2007, Art no. 266802, https://doi.org/10.1103/physrevlett.98.266802.Suche in Google Scholar
[26] F. J. Rodríguez-Fortuño, M. Martínez-Marco, B. Tomás-Navarro, et al., “Highly-sensitive chemical detection in the infrared regime using plasmonic gold nanocrosses,” Appl. Phys. Lett., vol. 98, pp. 133118, 2011, https://doi.org/10.1063/1.3558916.Suche in Google Scholar
[27] L. Businaro, O. Limaj, V. Giliberti, et al., “Mid-infrared nanoantenna arrays on silicon and CaF2 substrates for sensing applications,” Microelectron. Eng., vol. 97, pp. 197–200, 2012, https://doi.org/10.1016/j.mee.2012.02.025.Suche in Google Scholar
[28] V. Di Meo, A. Caporale, A. Crescitelli, et al., “Metasurface based on cross-shaped plasmonic nanoantennas as chemical sensor for surface-enhanced infrared absorption spectroscopy,” Sens. Actuators, B, vol. 286, pp. 600–607, 2019, https://doi.org/10.1016/j.snb.2019.02.014.Suche in Google Scholar
[29] ANSYS, Inc. Available at: https://www.ansys.com/products/electronics/ansys-hfss [accessed: Feb. 6, 2020].Suche in Google Scholar
[30] N. Laman and D. Grischkowsky, “Terahertz conductivity of thin metal films,” Appl. Phys. Lett., vol. 93, pp. 051105, 2008, https://doi.org/10.1063/1.2968308.Suche in Google Scholar
[31] D. Chandler-Horowitz and P. M. Amirtharaj, “High-accuracy, midinfrared (450 cm−1≤ω≤4000 cm−1) refractive index values of silicon,” J. Appl. Phys., vol. 97, pp. 123526, 2005, https://doi.org/10.1063/1.1923612.Suche in Google Scholar
[32] D. Maystre, “Theory of wood’s anomalies,” in Plasmonics: From asics to Advanced Topics, S. Enoch, N. Bonod, Eds., New York, Springer-Verlag, 2012, pp. 39–83.10.1007/978-3-642-28079-5_2Suche in Google Scholar
[33] R. Cristiano, E. Esposito, L. Frunzio, et al., “Nb-based Josephson junction devices for nuclear radiation detection: design and preliminary experimental results,” J. Appl. Phys., vol. 75, pp. 5210–5217, 1994, https://doi.org/10.1063/1.356990.Suche in Google Scholar
[34] S. H. De Paoli Lacerda, J. J. Park, C. Meuse, et al., “Interaction of gold nanoparticles with common human body proteins,” ACS Nano, vol. 4, pp. 365–379, 2010, https://doi.org/10.1021/nn9011187.Suche in Google Scholar
[35] R. Cristiano, E. Esposito, L. Frunzio, et al., “Quasiparticle diffusion, edge losses, and back-tunneling in superconducting tunnel junctions under X-ray irradiation,” J. Appl. Phys., vol. 86, pp. 4580–4558, 1999, https://doi.org/10.1063/1.371406.Suche in Google Scholar
[36] C. J. Farrell and M. Herrmann, “Determination of vitamin D and its metabolites,” Best Pract. Res. Clin. Endocrinol. Metabol., vol. 27, no. 2013, pp. 675–688, 2013, https://doi.org/10.1016/j.beem.2013.06.001.Suche in Google Scholar
[37] B. Špačková, B. Wrobel, M. Bocková, and J. Homola, “Optical biosensors based on plasmonic nanostructures: a review,” Proc. IEEE, vol. 104, pp. 2380–2408, 2016, https://doi.org/10.1109/jproc.2016.2624340.Suche in Google Scholar
[38] L. Carlucci, G. Favero, C. Tortolini, et al., “Several approaches for vitamin D determination by surface plasmon resonance and electrochemical affinity biosensors,” Biosens. Bioelectron., vol. 40, pp. 350–355, 2013, https://doi.org/10.1016/j.bios.2012.07.077.Suche in Google Scholar
Supplementary Material
The online version of this article offers supplementary material (https://doi.org/10.1515/nanoph-2020-0103).
© 2020 Valentina Di Meo et al., published by De Gruyter, Berlin/Boston
This work is licensed under the Creative Commons Attribution 4.0 International License.
Artikel in diesem Heft
- Editorial
- Interdisciplinary nanophotonics
- Reviews
- Advances in exploiting the degrees of freedom in nanostructured metasurface design: from 1 to 3 to more
- On-chip nanophotonics and future challenges
- All-dielectric metasurfaces for polarization manipulation: principles and emerging applications
- Nonlinear nanophotonic devices in the ultraviolet to visible wavelength range
- Active plasmonic nanoantenna: an emerging toolbox from photonics to neuroscience
- Research Articles
- Simply synthesized nitrogen-doped graphene quantum dot (NGQD)-modified electrode for the ultrasensitive photoelectrochemical detection of dopamine
- Design and optimization of tunneling photodetectors based on graphene/Al2O3/silicon heterostructures
- Self-induced thermo-optical effects in silicon and germanium dielectric nanoresonators
- Plasmon-controlled, ultra-bright, excitation-polarization-independent photoluminescence from individual Ag nanoplates
- Passively Q-switched Yb-doped all-fiber laser based on Ag nanoplates as saturable absorber
- Stacking angle dependent multiple excitonic resonances in bilayer tungsten diselenide
- Optically and radio frequency (RF) transparent meta-glass
- Critical review of quantum plasmonic models for finite-size media
- Tunable plasmon-phonon polaritons in anisotropic 2D materials on hexagonal boron nitride
- Pixeled metasurface for multiwavelength detection of vitamin D
- Phase-controlled metasurface design via optimized genetic algorithm
- Superlattice nonlinearities for Gigahertz-Terahertz generation in harmonic multipliers
- Multipolar second-harmonic generation from high-Q quasi-BIC states in subwavelength resonators
- Lasing at the nanoscale: coherent emission of surface plasmons by an electrically driven nanolaser
- Perovskite nanowire lasers on low-refractive-index conductive substrate for high-Q and low-threshold operation
- A simple transfer-matrix model for metasurface multilayer systems
- Enhanced two-photon photoluminescence assisted by multi-resonant characteristics of a gold nanocylinder
- Nanoscale control of single molecule Förster resonance energy transfer by a scanning photonic nanoantenna
- Magnetic switching of Kerker scattering in spherical microresonators
- High-efficiency, large-area lattice light-sheet generation by dielectric metasurfaces