Clinical usefulness of the “GeneSoC® SARS-CoV-2 N2 Detection Kit”
-
Yuki Sato
 ,
Takashi Kondo
,
Takashi Kondo


Abstract
Objectives
The GeneSoC® that launched recently enables the quantitative detection of target genes (in approximately 15 min) using microfluidic thermal cycling technology. Here, we compared the diagnostic performance of the “GeneSoC® SARS-CoV-2 N2 Detection Kit” (Kyorin assay) and conventional severe acute respiratory syndrome coronavirus 2 (SARS-CoV-2) detection assays to verify the clinical usefulness of the Kyorin assay.
Methods
Two hundred samples (100 nasopharyngeal and 100 saliva specimens) were collected from patients with suspected SARS-CoV-2 infection between May 2020 and August 2021. Conventional SARS-CoV-2 detection assays were performed using the Japanese National Institute of Infectious Diseases (NIID) assay, Ampdirect™ 2019-nCoV Detection Kit (SHIMADZU assay), and Lumipulse Presto SARS-CoV-2 Ag (FUJIREBIO assay), according to each manufacturer’s instructions.
Results
Using the NIID and SHIMADZU assays as references, the positive and negative concordance rates and the kappa coefficient in the Kyorin assay were 96.9–97.9 %, 99.0–100.0 %, and 0.96–0.98, respectively. The positivity rate of the FUJIREBIO assay was slightly lower than that of the reference assay (p<0.05).
Conclusions
The Kyorin assay showed a favorable concordance rate with conventional SARS-CoV-2 detection assays, making it a useful, rapid, and high-performance assay for detecting SARS-CoV-2, which may lead to early diagnosis and appropriate treatment.
The recently developed GeneSoC® (Kyorin Pharmaceutical Co., Ltd., Tokyo, Japan) incorporates a heater with a preset temperature at the bottom of the microfluidic channel. GeneSoC® employs a thermal cycling technique in which a sample placed in a microfluidic channel is moved pneumatically over a heater to quickly change the temperature of the sample to a desired temperature; this is repeated to perform a thermal cycle. This technique enables rapid real-time reverse transcription-polymerase chain reaction, and results can be obtained approximately 15 min after the start of the measurement using RNA-extracted samples, PCR buffer, enzyme mix, and primer/probe mix. “GeneSoC® SARS-CoV-2 N2 Detection Kit” (Kyorin Pharmaceutical Co., Ltd., Tokyo, Japan; Kyorin assay), a dedicated reagent for GeneSoC®, was launched in April 2022. Therefore, we verified the clinical usefulness of the Kyorin assay in the diagnosis of severe acute respiratory syndrome coronavirus 2 (SARS-CoV-2) infection by comparing the results obtained with the kit with those of conventional SARS-CoV-2 detection assays using residual samples collected from patients infected or suspected to be infected with SARS-CoV-2.
A total of 200 samples (100 nasopharyngeal and 100 saliva specimens) were collected from patients with suspected SARS-CoV-2 infection at the Sapporo Medical University Hospital and the public health center of Sapporo City between May 2020 and August 2021. The saliva specimens were collected in sterile petri dishes or spitz tubes, and the nasopharyngeal specimens were collected using a kit containing a nasopharyngeal nylon-flocked swab and a tube containing universal transport medium viral transport medium (Copan Diagnostics, Murrieta, CA, USA). The samples were stored at −80 °C until immediately before the assay. In this study, the RNA extraction step was performed manually using the QIAamp Viral RNA Mini kit (QIAGEN, Hilden, Germany) according to the manufacturer’s instructions. The Kyorin assay was analyzed according to the manufacturer’s instructions. We used three conventional SARS-CoV-2 detection assays: The N2 assay of the Japanese National Institute of Infectious Diseases (NIID) assay and the Ampdirect™ 2019-nCoV Detection Kit (Shimadzu Corporation, Kyoto, Japan; SHIMADZU assay) for nucleic acid amplification tests (NAATs), and Lumipulse Presto SARS-CoV-2 Ag (Fujirebio Inc., Tokyo, Japan; FUJIREBIO assay) for quantitative antigen tests (Supplementary Methods). The NIID and SHIMADZU assays were used as a reference.
Statistical analysis of quantitative variables was performed using the Shapiro-Wilk test to confirm normality, and the results were evaluated using the Mann-Whitney U test, correlation coefficient, and correlation test. Qualitative variables were analyzed using the kappa coefficient, McNemar’s test, and χ2 test. All statistical analyses were performed using IBM SPSS Statistics version 24 (IBM Corp., Chicago, IL, USA). Statistical significance was set at p<0.05. This study was approved by the Sapporo Medical University Hospital Institutional Review Board (Ethics number 332-54).
The median age of patients with confirmed and suspected SARS-CoV-2 infection was 51 years (interquartile range [IQR], 36–68 years). Seventy-four samples for which the date of symptom onset was obtained from electronic medical records were collected on median day 7 (IQR: 4–10 days), nasopharyngeal swabs on day 7 (IQR: 4.5–10 days), and saliva on day 5 (IQR: 4–7 days). Out of the total number of samples, 94 (47 %) were positive in the Kyorin assay, with no difference in positivity rates between the 48 nasopharyngeal specimens (48 %) and 46 saliva specimens (46 %) (p=0.77). The median viral load of nasopharyngeal specimens was 1.45 × 10³ copies/µL, which was significantly higher than that of the saliva specimens (1.60 × 10² copies/µL) (p<0.01, Figure 1A). The total concordance rates of the Kyorin assay with the NIID and SHIMADZU assays were 98.0 and 99.0 %, respectively, indicating high rates (Table 1). The positivity rate of the FUJIREBIO assay was significantly lower (p<0.01). There were four cases using the NIID assay, two cases using the SHIMADZU assay, and seven cases using the FUJIREBIO assay that were discordant with the Kyorin assay (Table 2, two discordant duplicate cases: No. 2 and No. 4). The median viral load of the samples that were discordant between the Kyorin and the FUJIREBIO assays was 9.00 × 100 copies/µL, which was significantly lower than that of the concordant samples (5.56 × 10² copies/µL) (p<0.01, Figure 1B). Furthermore, the median Ct value of the samples that were discordant between the Kyorin and the FUJIREBIO assays was 36.7 (range, 35.3–39.0), which was significantly higher than that of the concordant samples (median Ct value, 29.1; range, 15.5–37.4; p<0.01; Supplementary Figure). In the same way, the median Ct value of the samples that were discordant between the SHIMADZU and the FUJIREBIO assays was 34.3 (range, 27.9–39.7), which was significantly higher than that of the concordant samples (median Ct value, 28.7; range, 15.8–37.7; p<0.01). The RNA levels, Ct values, and luminescence intensity in the other three SARS-CoV-2 detection assays were highly correlated (p<0.01, Figure 2).
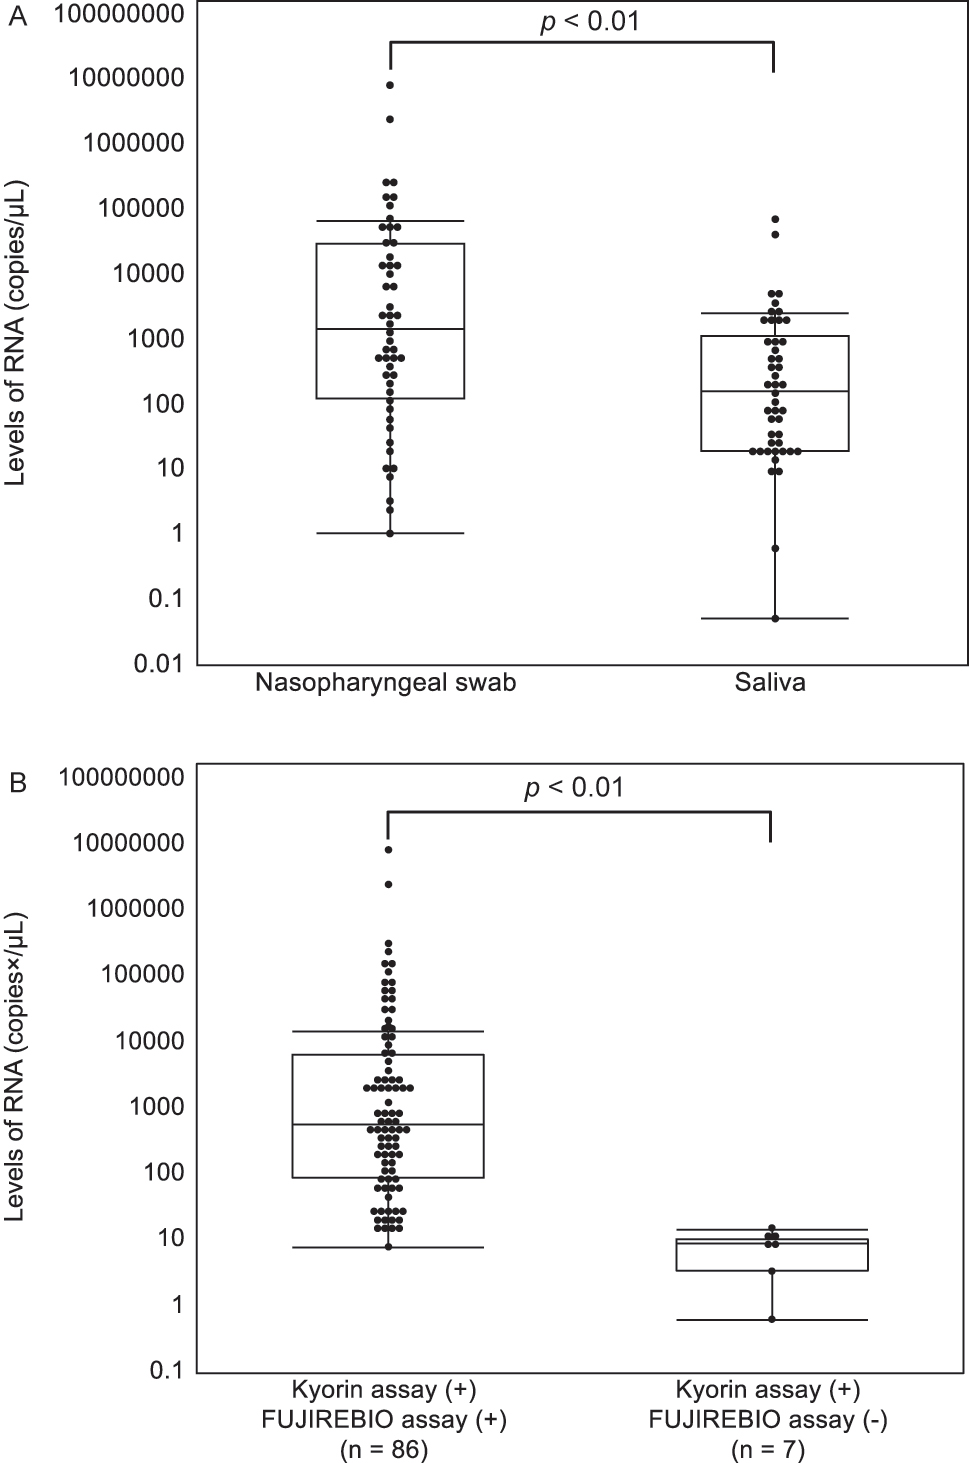
Relationship between SARS-CoV-2RNA levels. (A) Relationship between SARS-CoV-2 RNA levels and the sample type. (B) Relationship between the results of the two SARS-CoV-2 detection assays that have positive results and the RNA levels. The p-values were calculated with the Mann-Whitney U test. (+), positive; (−), negative.
Evaluation of the Kyorin and FUJIREBIO assays in comparison with conventional SARS-CoV-2 detection assays.
| NIID assay | Total concordance rate (95 % CI), (%) | Positive concordance rate (95 % CI), (%) | Negative concordance rate (95 % CI), (%) | Kappa (95 % CI) | McNemar’s test | |||
|---|---|---|---|---|---|---|---|---|
| + | − | |||||||
| Kyorin assay | + | 93 | 1 | 98.0 | 96.9 | 99.0 | 0.96 | p=0.31 |
| – | 3 | 103 | (96.1–99.9) | (93.4–100.0) | (97.2–100.0) | (0.92–1.00) | ||
| FUJIREBIO assay | + | 86 | 1 | 94.5 | 89.6 | 99.0 | 0.89 | p=0.01 |
| – | 10 | 103 | (91.3–97.7) | (83.5–95.7) | (97.2–100.0) | (0.83–0.95) | ||
| SHIMADZU assay | Total concordance rate (95 % CI), (%) | Positive concordance rate (95 % CI), (%) | Negative concordance rate (95 % CI), (%) | Kappa (95 % CI) | McNemar’s test | |||
|---|---|---|---|---|---|---|---|---|
| + | − | |||||||
| Kyorin assay | + | 94 | 0 | 99.0 | 97.9 | 100.0a | 0.98 | p=0.16 |
| – | 2 | 104 | (97.6–100.0) | (95.1–100.0) | (0.95–1.00) | |||
| FUJIREBIO assay | + | 87 | 0 | 95.5 | 90.6 | 100.0a | 0.91 | p<0.01 |
| – | 9 | 104 | (92.6–98.4) | (84.8–96.5) | (0.85–0.97) | |||
-
a95 % CI could not be calculated. NIID, National Institute of Infectious Diseases; CI, confidence interval; +, positive; −, negative.
Discordant results between the GeneSoC SARS-CoV-2 N2 Detection Kit and conventional SARS-CoV-2 detection assays.
| No. | Kyorin assay (Ct value) |
NIID assay, copies/µL |
SHIMADZU assay (Ct value of N2) |
FUJIREBIO assay, pg/mL |
Days from onset to sample collection | Sample type |
|---|---|---|---|---|---|---|
| 1 | + (35.3) |
– | + (32.2) |
+ (3.31) |
5 | Saliva |
| 2 | – | + (2.43 × 100) |
+ (34.9) |
– | 7 | Nasopharyngeal swab |
| 3 | – | + (1.06 × 100) |
– | – | 3 | Nasopharyngeal swab |
| 4 | – | + (5.22 × 10⁻²) |
+ (39.7) |
– | NAa | Saliva |
| 5 | + (37.3) |
+ (1.02 × 101) |
+ (34.3) |
– | NAa | Saliva |
| 6 | + (36.7) |
+ (1.43 × 101) |
+ (34.2) |
– | NAa | Saliva |
| 7 | + (36.0) |
+ (9.44 × 100) |
+ (33.6) |
– | 11 | Nasopharyngeal swab |
| 8 | + (36.5) |
+ (8.85 × 100) |
+ (36.2) |
– | NAa | Saliva |
| 9 | + (35.3) |
+ (8.24 × 100) |
+ (34.1) |
– | 12 | Nasopharyngeal swab |
| 10 | + (39.0) |
+ (3.35 × 100) |
+ (38.9) |
– | 12 | Nasopharyngeal swab |
| 11 | + (37.7) |
+ (6.25 × 10⁻¹) |
+ (27.9) |
– | NAa | Saliva |
-
aDetails are unknown due to administrative samples. Ct, cycle threshold; NIID, National Institute of Infectious Diseases; NA, not applicable; +, positive; −, negative.
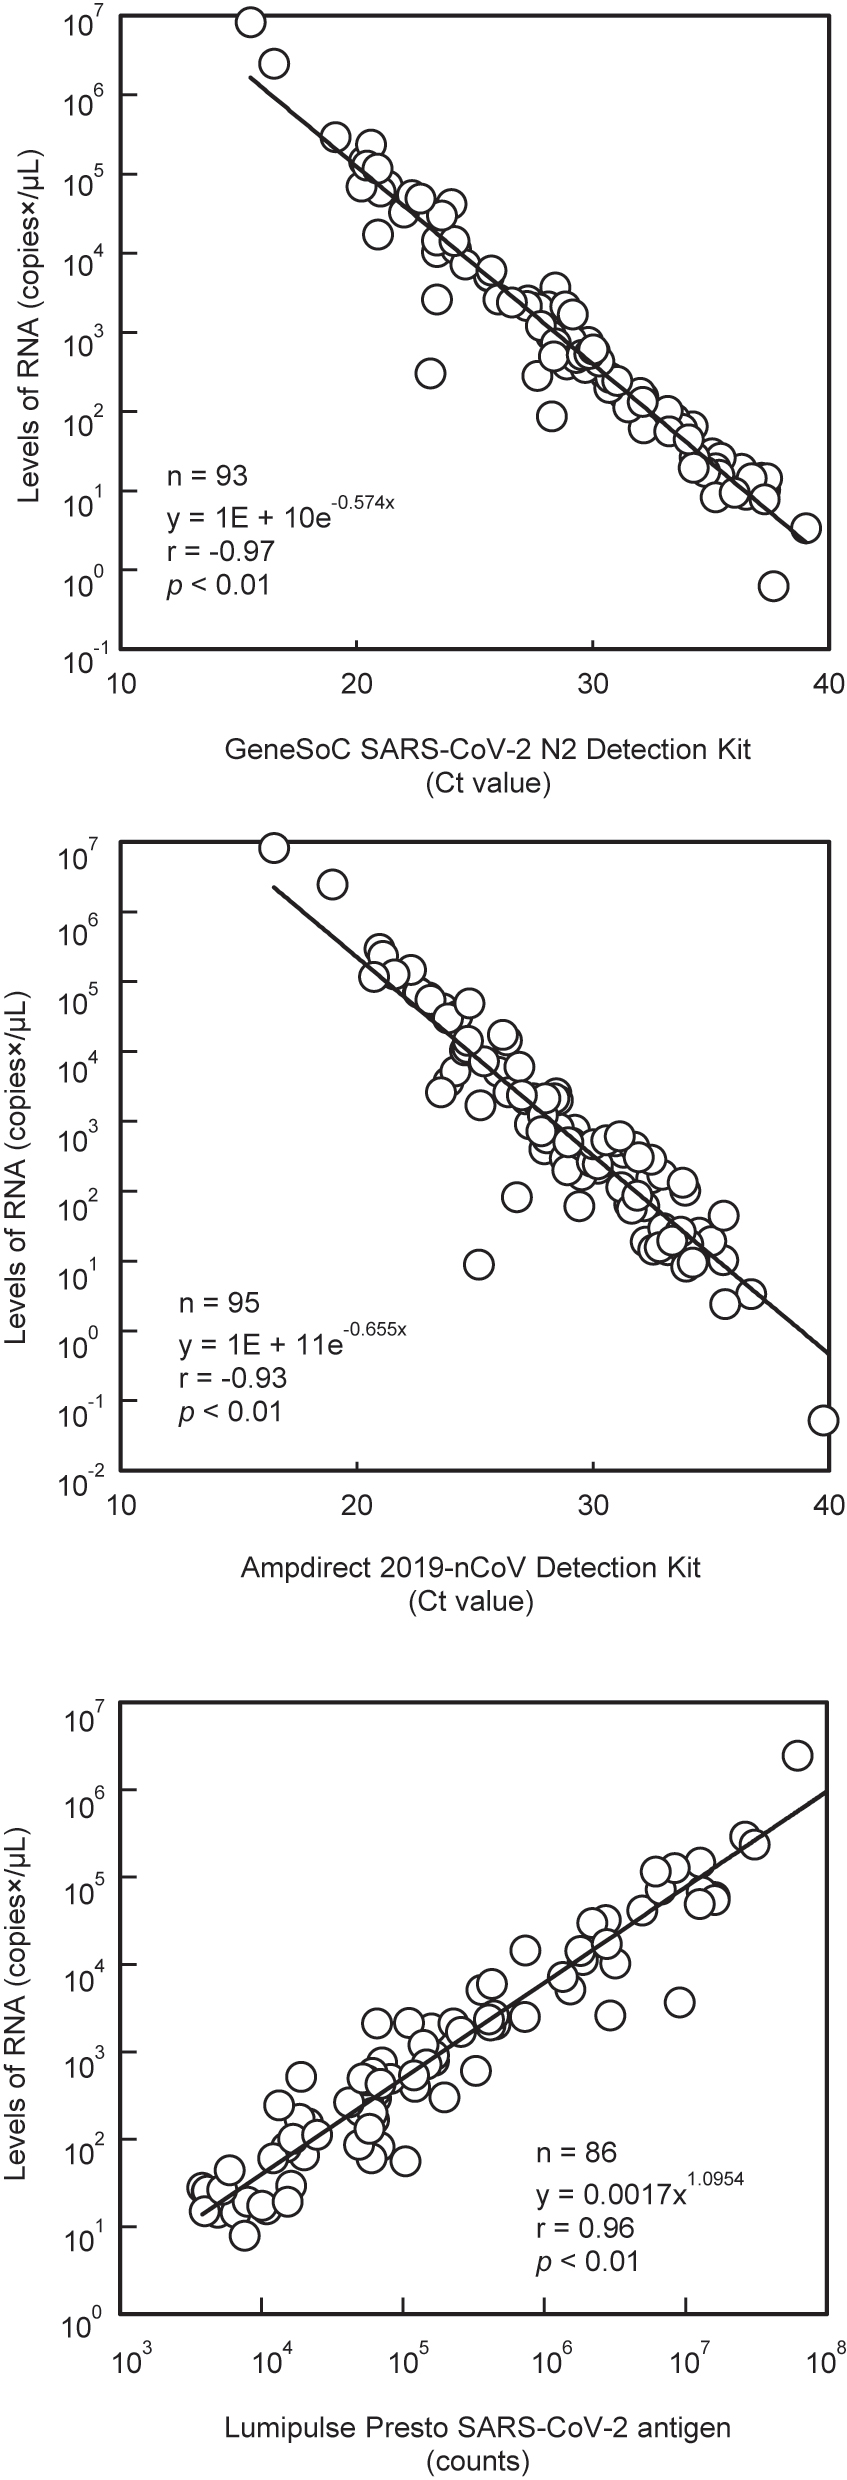
Correlation of RNA levels with Ct values and luminescence intensity.
In this study, as in a previous report [1], the viral load in nasopharyngeal swabs was higher than that in saliva. Nasopharyngeal and saliva specimens were not collected from the same patient; however, the median number of days from symptom onset to sample collection was almost the same, suggesting a similar trend in the same patient. However, there was no difference in the positivity rates between the nasopharyngeal and saliva specimens. The median number of days from symptom onset to sample collection was seven (IQR: 4–10 days), and there were only a few samples with a low viral load after 11 days [2], which was considered to have no effect on the positivity rate among the specimen types. In addition, the Kyorin assay used RNA extracted and purified with the “QIAamp Viral RNA Mini Kit”, and was less susceptible to inhibitors in the sample, which was considered to be a contributing factor. The Kyorin assay and reference method mostly agreed with each other, although some samples showed discordant results. Among such results, sample No. 1 (Table 2) was negative only in the NIID assay, suggesting a high possibility of false-negative results for the NIID assay. We considered that the discordant result was caused by the difference in sampling because the Ct value of the Kyorin assay was 35.3, which was converted to a very small amount of 1.59 × 101 copies/µL. Samples No. 2, 3, and 4 also showed low viral loads in the NIID assay (5.22 × 10⁻²–2.43 × 100 copies/µL) near the detection limit (NIID assay: 3.91 × 10⁻¹ copies/µL [3], SHIMADZU assay: 1.00 × 100 copies/µL [4]), suggesting a discrepancy between the Kyorin assay and reference methods. Samples No. 5–11 tested negative in the FUJIREBIO assay and positive in the other three assays. The viral load of the samples that were discordant between the Kyorin and FUJIREBIO assays was significantly lower than that of the concordant samples, and the Ct value was significantly higher in the discordant samples than in the concordant samples. It has been reported that antigen levels seem to decrease gradually with the production of antibodies in the blood when days from symptom onset to sample collection elapse and that a small amount of RNA fragments may remain in the nasopharynx [5, 6]. Therefore, it was considered that a trace amount of RNA remaining in the nasopharynx was detected by the three NAATs and was not detected by the FUJIREBIO assay, owing to lower detection sensitivity. Ct values correlate with the number of days from disease onset to sample collection [2] and viral infectivity of the virus [7]. Therefore, the Ct value may be a useful tool for estimating the time of infection. In this study, we confirmed a correlation (correlation coefficient: −0.97) between the Ct value of the Kyorin assay and the viral load analyzed by the NIID assay in positive samples, which was similar or higher than that of the SHIMADZU and FUJIREBIO assays. This may be because the Kyorin assay was designed relative to the primer-probe set of the NIID assay, and thus more closely approximates the PCR reaction. The regression equations (Figure 2) for the Kyorin, SHIMADZU, and FUJIREBIO assays obtained in this study can be used to estimate viral load to some extent from Ct values and luminescence intensity and may help in the future standardization of these assays. In November 2023, “GeneSoC® PCR Preparation Kit Type A” (Kyorin Pharmaceutical Co., Ltd., Tokyo, Japan) that enables RNA extraction in approximately 1 min was launched. In the future, it is desirable to evaluate the clinical usefulness of the Kyorin assay with the simple and rapid RNA extraction kit.
In conclusion, the Kyorin assay showed favorable agreement with the conventional NAATs. However, samples with a low viral load may yield false-negative results in any of the SARS-CoV-2 detection assays evaluated in this study. The interpretation must be comprehensive and include clinical symptoms, the presence or absence of infection opportunities, the timing of sample collection, and retesting using different assays.
Funding source: Kyorin Pharmaceutical Co., Ltd., Tokyo, Japan
-
Research ethics: Research involving human subjects complied with all relevant national regulations, institutional policies and is in accordance with the tenets of the Helsinki Declaration (as revised in 2013), and has been approved by the authors’ Institutional Review Board (https://web.sapmed.ac.jp/byoin/rinshokenkyu/) (number 332–54).
-
Informed consent: Sapporo Medical University Hospital approved this study and waived informed consent based on the retrospective design of the study.
-
Author contributions: All authors have accepted responsibility for the entire content of this manuscript and approved its submission.
-
Competing interests: This study was partly funded by Kyorin Pharmaceutical Co., Ltd., Tokyo, Japan. Satoshi Takahashi received speaker honoraria from MSD K.K. and Fujirebio Inc. and research grants from Shino-Test Corporation, Roche Diagnostics Japan Corporation, Fujirebio Inc., and Abbott Japan Corporation, Ltd. All other authors declare no conflict of interests.
-
Research funding: This study was partly funded by Kyorin Pharmaceutical Co., Ltd., Tokyo, Japan.
-
Data availability: The raw data can be obtained on request from the corresponding author.
References
1. Procop, GW, Shrestha, NK, Vogel, S, Van Sickle, K, Harrington, S, Rhoads, DD, et al.. A direct comparison of enhanced saliva to nasopharyngeal swab for the detection of SARS-CoV-2 in symptomatic patients. J Clin Microbiol 2020;58:e01946–20. https://doi.org/10.1128/jcm.01946-20.Suche in Google Scholar PubMed PubMed Central
2. Singanayagam, A, Patel, M, Charlett, A, Lopez Bernal, J, Saliba, V, Ellis, J, et al.. Duration of infectiousness and correlation with RT-PCR cycle threshold values in cases of COVID-19, England, January to May 2020. Euro Surveill 2020;25:1–5. https://doi.org/10.2807/1560-7917.es.2020.25.32.2001483.Suche in Google Scholar
3. Matsumura, Y, Shimizu, T, Noguchi, T, Nakano, S, Yamamoto, M, Nagao, M. Comparison of 12 molecular detection assays for severe acute respiratory syndrome coronavirus 2 (SARS-CoV-2). J Mol Diagn 2021;23:164–70. https://doi.org/10.1016/j.jmoldx.2020.11.007.Suche in Google Scholar PubMed PubMed Central
4. Sato, Y, Kondo, T, Moriai, M, Nirasawa, S, Saeki, M, Yakuwa, Y, et al.. Clinical performance and potential of a SARS-CoV-2 detection kit without RNA purification steps. J Lab Med 2021;45:205–12. https://doi.org/10.1515/labmed-2021-0073.Suche in Google Scholar
5. Wölfel, R, Corman, VM, Guggemos, W, Seilmaier, M, Zange, S, Müller, MA, et al.. Virological assessment of hospitalized patients with COVID-2019. Nature 2020;581:465–9. https://doi.org/10.1038/s41586-020-2196-x.Suche in Google Scholar PubMed
6. Kobayashi, R, Murai, R, Moriai, M, Nirasawa, S, Yonezawa, H, Kondoh, T, et al.. Evaluation of false positives in the SARS-CoV-2 quantitative antigen test. J Infect Chemother 2021;27:1477–81. https://doi.org/10.1016/j.jiac.2021.06.019.Suche in Google Scholar PubMed PubMed Central
7. La Scola, B, Le Bideau, M, Andreani, J, Hoang, VT, Grimaldier, C, Colson, P, et al.. Viral RNA load as determined by cell culture as a management tool for discharge of SARS-CoV-2 patients from infectious disease wards. Eur J Clin Microbiol Infect Dis 2020;39:1059–61. https://doi.org/10.1007/s10096-020-03913-9.Suche in Google Scholar PubMed PubMed Central
Supplementary Material
This article contains supplementary material (https://doi.org/10.1515/labmed-2023-0119).
© 2024 the author(s), published by De Gruyter, Berlin/Boston
This work is licensed under the Creative Commons Attribution 4.0 International License.
Artikel in diesem Heft
- Frontmatter
- Original Articles
- Adequate cefazolin therapy for critically ill patients: can we predict active concentrations from given protein-binding data?
- Fully automated chemiluminescence microarray immunoassay for detection of antinuclear antibodies in systemic autoimmune rheumatic diseases
- Evaluation of a Treponema IgG ELISA alone and in combination with an IgM ELISA as substitutes for Treponema pallidum particle agglutination (TPPA) as confirmatory tests in a two-tier diagnostic algorithm for diagnosis of syphilis infection
- Research on the stability changes in expert consensus of the ACTH detection preprocessing scheme
- Female patients with systemic lupus erythematosus (SLE)-associated antiphospholipid syndrome (APS) have a lower ovarian reserve than either primary APS or SLE patients
- Short Communication
- Clinical usefulness of the “GeneSoC® SARS-CoV-2 N2 Detection Kit”