Fully automated chemiluminescence microarray immunoassay for detection of antinuclear antibodies in systemic autoimmune rheumatic diseases
-
Dandan Yuan
 ,
Tingting Wang
and
Zhigang Hu
,
Tingting Wang
and
Zhigang Hu

Abstract
Objectives
Detection of specific antinuclear antibodies is very important in term of diagnosis, prognosis and management of patients with systemic autoimmune rheumatic diseases. Chemiluminescence microarray immunoassay (CLMIA) is a microdot array-based method that allows simultaneous detection of multiple antinuclear antibodies, which received increasing attention.
Methods
A CLMIA method that can detect 14 kinds of antinuclear antibodies was established and optimized. Basic performance and diagnostic performance of CLMIA was evaluated by comparing it with line immunoassay (LIA) and indirect immunofluorescence (IIF).
Results
Through conditional exploration, the optimal blocking time and blocking temperature were determined to be 18 h and 25 °C, respectively. The enzyme-labeled secondary antibody reaction concentration was 0.1 μg/mL, the incubation temperature of serum and enzyme-labeled secondary antibody were 30 °C, and the incubation time of serum and enzyme-labeled secondary antibody were 40 min. After parameter optimization, CLMIA demonstrated high accuracy with a relative bias <15 %; high sensitivity with detection limits below 3 IU/mL for dsDNA and below 1 RU/mL for other ANAs; and high reproducibility with both intra-assay and inter-assay coefficients of variation (CV) <15 %.The CLMIA detection method established in this study was also demonstrated to have good clinical diagnostic performance, showing the highest area under curve (AUC=0.87, p=0.042 and p=0.03). The CLMIA and LIA revealed substantial to good agreements on specific antinuclear antibodies except anti-dsDNA, with the Cohen’s kappa from 0.72 to 0.89. Samples that produced discrepant results between the CLMIA and LIA methods were further analyzed. Upon additional testing, most of these samples were ultimately determined to have been correctly detected by the CLMIA assay rather than the LIA assay, suggesting that CLMIA also shows some superiority in diagnosing dsDNA.
Conclusions
The CLMIA could become a potential routine method for detecting ANAs with the advantages of good detection performance.
Introduction
Systemic autoimmune rheumatic diseases (SARDs) are characterized by immunological and inflammatory dysregulation, resulting in damage and destruction of connective tissues, joints, blood elements, skin and other target organs [1]. The SARDs include systemic lupus erythematosus, systemic sclerosis, idiopathic inflammatory myopathies, rheumatoid arthritis, Sjögren’s syndrome, systemic vasculitides and so on [2, 3]. Most patients with SARDs exhibit clinically heterogeneous, variable and non-specific clinical features. Therefore, distinguishing between different types of SARDs can be extremely difficult [4]. The presence of antinuclear antibodies (ANAs), directed against intracellular antigens, is a hallmark of the SARDs. Currently, ANAs has been widely used for diagnosis and monitoring of SARDs.
Traditionally, indirect immunofluorescence (IIF) on HEp-2 cells is the most established method used to screen for ANAs [5, 6]. Nonetheless, positive fluorescent staining showed that the presence of ANA could not allow precise identification of these antibodies. Specific categories of antibodies has been associated with each specific diseases [7], much more relevant information comes from the identification of the target antigens bound by ANAs. Line immunoassay (LIA) can achieve the detection of specific antibodies by using strips pre-coated with multiple antigens on separate parallel lines. However, LIA is a time-consuming and labor-intensive procedure and exhibits poor reproducibility because of the subjective interpretation of results.
The chemiluminescence microarray immunoassay (CLMIA) is a fully automated assay system that allows the simultaneous detection of multiple antibodies of established clinical significance. Antigenic substances are attached to the supporting material in ordered arrays. The antigen microarrays are exposed to serum samples containing the autoantibodies, which bind to their corresponding antigen [8]. The concentration of the analyte in the sample can be determined by detecting the resulting antigen-antibody complex in the microspots of the chip [9]. Owing to the advantages of multiplexing, automation, rapidity, and high sensitivity and specificity, CLMIA has been widely applied to detect cancer, immune and inflammatory diseases as well as infectious diseases. However, its use in clinical laboratories for ANA detection has not been extensively adopted on a large scale [10], [11], [12].
In this study, we established a CLMIA detection method in our laboratory that can detect 14 antibodies simultaneously. In addition, we compared the assay with LIA and traditional IIF to assess the diagnostic performance in Chinese patients. By carrying out a comprehensive comparison and analysis, we explored whether the CLMIA could become a commercial microarray analysis to detect SARDs.
Materials and methods
Study population
A total of 185 patient serum samples were tested in this study, including 135 patients with SARDs, 31 disease controls and 19 healthy controls. The SARDs specimens were retrospectively classified according to predefined diagnoses as follows: included Systemic lupus erythematosus (SLE, n=63), Sjögren’s syndrome (SjS, n=26), mixed connective tissue disease (MCTD, n=20), systemic scleroderma (SSc, n=10), rheumatic arthritis (RA, n=12) and polymyositis/dermatomyositis (PM/DM, n=4).The 135 SARDs patients were inpatients or outpatients, who were newly diagnosed or followed up in the Department of Dermatology and Rheumatology, and had not received glucocorticoids or immunosuppressive treatments within 3 months before recruitment. Disease controls were consecutive patients who consulted rheumatology department, and for whom ANA test was deemed necessary by the clinician. After examination, these patients were diagnosed not to have SARDs. The disease controls are mainly viral or bacterial infectious diseases, nonalcoholic steatohepatitis (NASH), allergy and cancer. The apparently healthy controls were collected from 19 individuals receiving regular annual physical examinations. The median age of SARDs, disease control, and apparently healthy control are 47 (IQR 34–57), 52 (IQR 41–70), and 49 (IQR 31–65), respectively. The female percentage of SARDs, disease control, and healthy control are 90, 58, and 63 %, respectively. All samples were collected from May to August 2022 and June to September 2023 at Wuxi People’s Hospital and stored at −70 °C until use.
All clinical investigations were conducted according to the Declaration of Helsinki. Informed consent was obtained from all individuals and this study was approved by the Ethics Committees of Wuxi People’s Hospital Affiliated to Nanjing Medical University.
Detection of antinuclear antibodies
All 185 serum samples were tested by the IIF (Fluoro HEPANA test, Medical & Biological Laboratories, Japan) and LIA (Seramun Diagnostica GmbH, Germany), as well as CLMIA (Sunlant Bioengineering Co. Ltd, China), according to the manufacturers’ protocols.
Antinuclear antibody detected by IIF on HEp-2 cell
IIF on human epidermoid laryngeal carcinoma cells (HEp-2 cells) is the most established method for ANA screening. The manually processed HEp-2 slides were read using a fluorescence microscope at ×200 power within 24 h. ANA by IIF titer of at least 1:40 was regarded as positive in our laboratory. The serum was considered positive if clear fluorescence appeared on the entire cell nucleus or in a specific area. All positive patient specimen should be tittered to endpoint dilution, at which no specific fluorescence is found in the nucleus, by repeating the test with twofold dilutions of serum.
Antinuclear antibodies detected by LIA
LIA is a qualitative method capable of multiplex detection of human IgG antibodies against 12 antigens, comprising Ro60, Ro52, SSB, P0, CENP-B, Histone, dsDNA, Jo-1, Nucleosome, RNP, Sm and Scl-70. By visually comparing the intensity of the test line and the cutoff line on the specific LIA determination card provided by this kit, the experimental results were interpreted as negative or positive. Positive results showed strips with color intensity equal to or darker than the cutoff control line, while negative strips showed lighter color intensity compared to the cutoff control line.
Anti-dsDNA IgG detected by ELISA
Some studies have shown that enzyme linked immunosorbant assay (ELISA) is the preferred method for detecting dsDNA antibodies due to its advantages in specificity and sensitivity [13, 14]. Therefore, we compared the consistency of ELISA (Euroimmun, Germany) with LIA and CLMIA. The cutoff of this assay is 100 IU/mL, according to the manufacturer’s instructions.
Antinuclear antibodies detected by CLMIA
CLMIA were carried out on the SLXP-001B Fully Automated Microarray Chip Reader (Sunlant, China).
Microarray chip production
First, the hard substrate microarray chips (Sunlant, China) were immersed in pretreatment solution containing 2 % NaOH for 24 h, washed 2–8 times with pure water, and then immersed in 0.5 % (3-glycidyloxypropyl) trimethoxysilane for 30 min. Secondly, the pre-soaked hard substrate microarray chips were dried with nitrogen gas blowing and placed in an oven and baked at 140 °C for 0.5 h. The processed chips were stored in a sealed container. Thirdly, the 14 kinds of ANA antigens (Jinlian Biotechnology Co., Ltd., China) were gradient diluted with stabilizer (Sunlant, China). The antigens at various concentrations were spotted on the pretreated chips separately using a Nano-Plotter 2.1 fully automatic spotting instrument (GeSim, Germany) with a spotting volume of 20 nL/spot. Finally, the prepared microarray slides were immersed in blocking buffer and incubated for a period of time. The slides were then retrieved, centrifuged at 150×g for 1 min to remove residual blocking buffer, and stored at 4 °C until use.
Microarray measurements
The glass chip was incubated with 100-fold diluted serum. Then the incubated chip was transferred into horseradish peroxidase (HRP)-labeled anti-human IgG solution and incubated again. Finally, the chip was placed in the chemiluminescent substrate (Luminol). The light signals were captured by a CCD camera and the concentration of ANAs in the sample were calculated with an in-house-developed software.
CLMIA, based on the principle of antigen-antibody reaction, is a fully automatic, high-throughput detection method that can simultaneously detect 14 kinds of antigens, including anti-Ro52, Ro60, SSB, P0, CENP-B, M2, Histone, dsDNA, Jo-1, Nucleosome, RNP, Sm, Scl-70 and Pm-scl. Four identical antigens constituted one column and the average value was used as the final result for detecting each kind of antigen. The distribution and concentration of coated antigens on the chip was shown in Figure 1. The recommended cutoff for the anti-dsDNA antibody is 100 IU/mL and for other ANAs is 20 RU/mL (based on the concentration of ANA detected in serum samples from 50 healthy individuals using this system, the 99th percentile was utilized to determine the reference range).
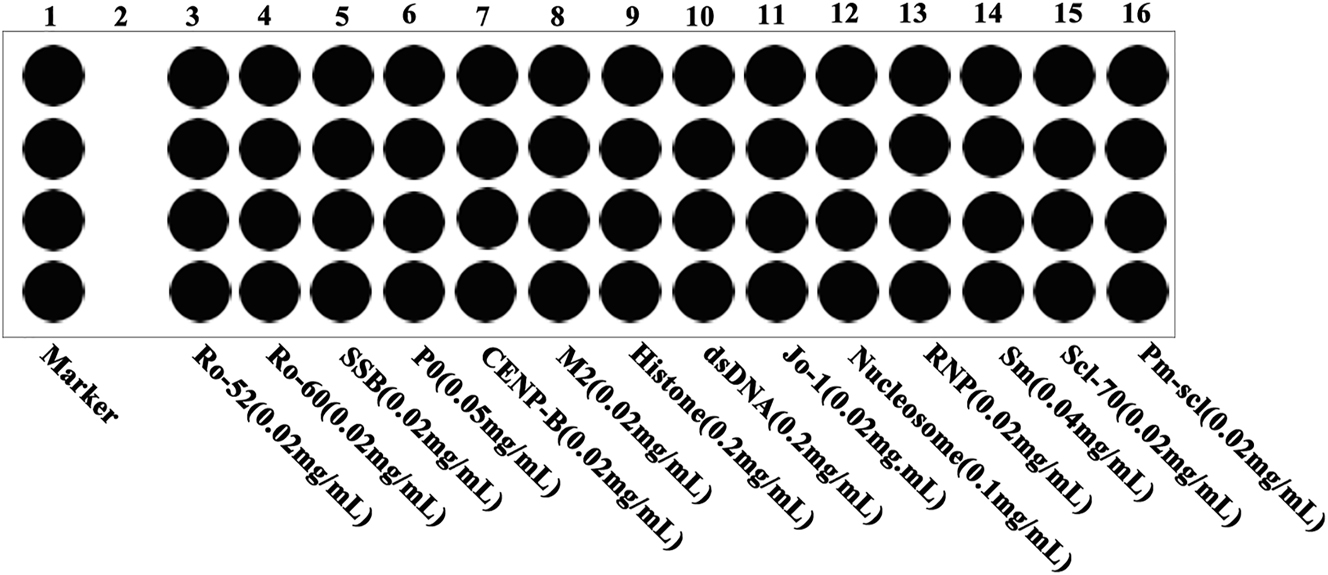
The distribution and concentration of coated antigens on the chip.
Optimization of CLMIA experiment conditions
Since the blocking time and temperature, concentration of HRP-labeled anti-human IgG solution, incubated temperature and time would affect CLMIA detection results, we optimized the experimental conditions [15, 16]. Various blocking time (12, 18, 24 h), various blocking temperature (4, 25 and 37 °C), different concentrations of HRP-labeled secondary antibody (0.05, 0.1 and 0.3 μg/mL), various reaction temperature (4, 30 and 37 °C) and various reaction time (20, 40 and 60 min) were performed in triplicate. The background signal value and detection result signal value of each index were recorded and compared. The ideal experimental conditions are those with a relatively high signal-to-noise ratio (SNR), where SNR refers to the ratio of the result signal to the background signal [17].
Basic performance tests of CLMIA
The certified reference materials 15/174 (with certified values of 100 units per ampoule; WHO Reference Reagent) for the standardization of dsDNA were used to investigate method accuracy [18]. Since there are no certified reference materials for other ANAs, the accuracy of the CLMIA method for various indicators has been evaluated by the concentration of samples assigned by the company of Euroimmun (Germany, RNP, Sm, Ro60, SSB, Nucleosome, Histone, P0), Shenzhen YHLO Biotech (China, Scl-70, M2, Jo-1), Hob Biotech (China, PM-Scl, CENP-B) and Orgentec (Germany, Ro52). Bias was calculated as the difference between the average measured value and the accepted reference value.
The 14 kinds of ANA antibodies (Jinlian Biotechnology Co., Ltd., China) were mixed and prepared into a standard material with a dsDNA concentration of 800 IU/mL and other ANA concentrations of 200 RU/mL, which was used for the CLMIA linearity assessment assay and subsequent experiments. For each CLMIA assay, three replicates were performed.
Values for the limits of detection (LOD) of the ANAs solution for CLMIA were calculated based on Clinical and Laboratory Standards Institute (CLSI) guideline EP17 [19]. The LoD is the lowest concentration that could be reliably distinguished from the limit of blank (LoB) and can be calculated as: LOD = LOB + 1.645 × SDlow concentration sample. The LOB was the apparent analyte concentration that was expected to be found when replicates of a blank sample were tested: LOB = meanblank + 1.645 × SDblank. Therefore, 20 replicates of blank samples were tested to calculate the LOB, and 20 replicates of low concentration samples were tested to calculate the LOD, where the low concentration samples were based on the minimum value of the dynamic range in CLMIA assays. To determine the precision of the platform, high-value and low-value samples were measured 10 times repeatedly. These high-value (dsNDA: 600 IU/mL, other ANAs: 150 RU/mL) and low-value (dsDNA: 150 IU/mL, other ANAs: 30 RU/mL) samples were diluted from the standard materials.
Statistical analysis
Statistical analyses were carried out using MedCalc 13.0 (MedCalc Software Ltd, Belgium) and SPSS 20.0 (SPSS, IBM, USA). The receiver operating characteristic (ROC) curve analysis was used to evaluate the diagnosis efficiency. The area under ROC curve (AUC)、positive likelihood ratio (LR+) and negative likelihood ratio (LR-) were reported using a two-sided 95 % confidence interval (CI).The agreement of specific antinuclear antibodies was analyzed using Cohen’s kappa coefficient, with measurements <0.20, 0.21–0.39, 0.40–0.59, 0.60–0.79, 0.80–0.90, and >0.90 interpreted as no, minimal, weak, moderate, strong, and almost perfect agreement, respectively [20, 21]. All statistical analyses were based on a two-sided hypothesis testing at significance level of p<0.05.
Results
Construction of CLMIA protocol
Optimization of blocking time
As the blocking time continued to increase, the result signal values of indicators also continued to increase. However, after 18 h, the signals of multiple indicators did not show a significant increase. By selecting the 18 h blocking time, variations in the result signal were minimized as indicated by the smallest CV, while the highest SNR was obtained at this epoch. This choice also aimed to reduce time expenditure while still ensuring analytical quality through exploitation of the favorable SNR (Figure 2A and B).

Optimization of experimental conditions for CLMIA. (A, B) The chips were blocked using the blocking buffer for 12 and 18 h, respectively. (C, D) The chips were blocked using the blocking buffer at 37 and 25 °C, respectively. (E, F) The HRP-labeled secondary antibody concentrations were 0.3 and 0.1 μg/mL, respectively. (G, H) The reaction temperature for serum and HRP-labeled secondary antibody were at 4 and 30 °C. (I, J) When the reaction times for both serum and HRP-labeled secondary antibody were 20 and 40 min, respectively.
Optimization of blocking temperature
Generally, warmth tended to amplify signals irrespective of marker assessed. However, considering practical aspects such as ambient temperature conditions, 25 °C was deemed more representative. Moreover, at 25 °C, the CV of result signal values was smaller and the SNR was higher. Therefore, 25 °C was selected as the blocking temperature (Figure 2C and D).
Optimization of HRP-labeled secondary antibody concentration
For the HRP-labeled secondary antibody, three different concentrations of 0.05, 0.1 and 0.3 μg/mL were used according to the concentration of spotting antigen. The excessively high background signal is not conducive to accurately reflecting the true concentration. At 0.1 μg/mL, the result signal CV is the smallest and the SNR is the highest. Therefore, we choose this concentration (Figure 2E and F).
Optimization of incubation temperature
The incubation temperature of serum and HRP-labeled secondary antibody were set to the same temperature as they were carried out in the same instrument. Results showed that the higher the temperature, the stronger the detection signal of each index. However, considering the practical use environment temperature and instrument temperature influence on instrument aging, choosing 30 °C as the incubation temperature is more consistent with reality. Under this condition, the result signal CV value is smallest and the SNR is highest (Figure 2G and H).
Optimization of incubation time
The incubated time of serum (20, 40 and 60 min) and HRP-labeled secondary antibody (20, 40 and 60 min) were randomly combined and performed in triplicate. With the continuous increase of serum reaction time and secondary antibody reaction time, the result signal values of each index also increase continuously, but after 40 min, the signals of multiple indexes enter a plateau period. Comprehensively comparing the result signal values and CV, background values, SNR, and considering saving time, the final selected serum reaction time is 40 min and the secondary antibody reaction time is also 40 min, which the CV is smallest and the SNR is highest (Figure 2I and J).
Basic performance tests of CLMIA
Accuracy evaluation experiment
The average measured and target values of the reference materials were calculated. The observed bias for dsDNA was 8.9 %, while the bias of other indicates was between −6.8 and 5.2 % (Table 1). Regardless of the indicator, the bias was always lower than the maximum allowable (−15–15 %, according to the reagent profiles), demonstrating the accuracy of this method.
Basic performance of CLMIA.
| Relative bias % | LOB | LOD | Intra-assay CV % | Inter-assay CV % | |||
|---|---|---|---|---|---|---|---|
| Accuracy evaluation | dsDNA unit: IU/mL other ANAs: RU/mL | Low-value sample | High-value sample | Low-value sample | High-value sample | ||
| dsDNA | 8.9 | 1.01 | 2.60 | 1.43 | 2.92 | 2.53 | 2.56 |
| Ro-52 | 5.2 | 0.10 | 0.30 | 4.27 | 7.11 | 4.23 | 6.09 |
| Ro-60 | −6.8 | 0.10 | 0.40 | 3.06 | 5.01 | 3.19 | 5.28 |
| SSB | −6.2 | 0.12 | 0.49 | 3.33 | 5.14 | 5.08 | 5.68 |
| P0 | 3.2 | 0.14 | 0.52 | 5.84 | 4.71 | 6.55 | 6.89 |
| CENP B | 0.9 | 0.12 | 0.56 | 3.36 | 3.47 | 6.05 | 5.18 |
| M2 | 3.5 | 0.16 | 0.46 | 4.67 | 5.80 | 5.26 | 5.88 |
| Histone | −0.5 | 0.16 | 0.59 | 5.85 | 6.08 | 5.70 | 6.4 |
| Jo-1 | 0.5 | 0.13 | 0.63 | 4.42 | 5.07 | 4.43 | 6.33 |
| Nucleosome | 2.4 | 0.23 | 0.68 | 4.60 | 6.06 | 4.23 | 6.02 |
| RNP | −5.1 | 0.12 | 0.54 | 4.39 | 5.00 | 5.13 | 6.90 |
| Sm | −0.5 | 0.18 | 0.64 | 2.93 | 3.11 | 3.67 | 4.96 |
| Scl-70 | 3.3 | 0.16 | 0.50 | 5.29 | 3.95 | 5.46 | 4.64 |
| PM-Scl | −3.5 | 0.19 | 0.75 | 4.78 | 5.16 | 5.02 | 6.39 |
-
LOD, limit of detection; LOB, limit of blank.
Linearity, LOD, and precision
The linearity of CLMIA was assessed by quantifying twofold-diluted standard materials. According to the different reference ranges of ANAs, ANAs standard curves are divided into two categories: curves of dsDNA and other ANAs indicators. All CLMIA curves exhibited high linearity (R2>0.99) and except for dsDNA, the degree of overlap was very high, indicating that the CLMIA assays exhibited good laboratory performance (Figure 3A and B).

Linearity of dsDNA and other antinuclear antibody indicators. Samples were twofold serially diluted to ensure that the concentrations of 14 kinds of ANAs were within the dynamic ranges of the assays.
To calculate the LODs, 20 replicates of blank samples were examined. Results showed that the LOD for dsDNA was 2.60 IU/mL and for other ANAs were 0.30–0.75 RU/mL (Table 1). The LOD of all the indicators meet the technical requirements, which were ≤ 3 IU/mL for dsDNA and ≤1 RU/mL for other ANAs.
Based on the linearities and LODs of CLMIA, we selected 150 IU/mL as a low concentration and 600 IU/mL as a high concentration to evaluate the precisions of the dsDNA, meanwhile, we selected 30 RU/mL as a low concentration and 150 RU/mL as a high concentration to evaluate the precision of other ANAs. Table 1 also showed the precision of CLMIA in measuring target at two concentrations. Whether it was a high-value or low-value sample, the intra-assay and inter-assay CVs of each indicator were both <15 %.
Clinical diagnostic performance of CLMIA
In order to evaluate the clinical diagnostic performance, CLMIA was compared with IIF and LIA, which are common clinical detection methods. A total of 185 patients were included in this study, including 135 patients with SARDs as the disease group, 31 patients with other diseases and 19 healthy individuals as the disease control group. Among these three methods, ROC analysis demonstrated that the CLMIA possesses the highest AUC and LR+ (Table 2, Figure 4). Meanwhile, the IIF showed a higher sensitivity of 84.44 % but a lower specificity of 62.00 %, while the LIA exhibited a higher specificity of 82.00 % but a lower sensitivity of 77.04 %. The CLMIA demonstrated both a relatively high sensitivity (82.22 %) and specificity (88.00 %) (Table 2).
Comparison of clinical diagnostic performance of CLMIA, LIA and IIF.
| ANA IIF | CLMIA | p (IIF) | LIA | p (IIF) | p (CLMIA) | |
|---|---|---|---|---|---|---|
| AUC | 0.80 | 0.87 | 0.042 | 0.83 | 0.33 | 0.03 |
| (95 % CI) | 73.0–85.1 | 81.6–91.7 | 76.8–88.1 | |||
| Sensitivity | 84.44 | 82.22 | 77.04 | |||
| (95 % CI) | 77.2–90.1 | 74.7–88.3 | 69.0–83.8 | |||
| Specificity | 62.00 | 88.00 | 82.00 | |||
| (95 % CI) | 47.2–75.3 | 75.7–95.5 | 68.6–91.4 | |||
| LR+ | 2.20 | 6.85 | 4.28 | |||
| (95 % CI) | 1.5–3.2 | 3.2–14.6 | 2.4–7.8 | |||
| LR− | 0.25 | 0.20 | 0.28 | |||
| (95 % CI) | 0.2–0.4 | 0.1–0.3 | 0.2–0.4 |
-
AUC, area under curve; LR+, positive likelihood ratio; LR−, negative likelihood ratio.

ROC curve analysis of IIF, LIA and CLMIA.
Agreement between CLMIA and LIA
The agreement for specific antinuclear antibodies comparing CLMIA with LIA are summarized in Table 3. Agreement analysis was conducted for 11 out of 14 common specific antinuclear antibodies that are measured by both CLMIA and LIA ANA kits; antibodies against PM-Scl and M2 were not included in the concordance analysis as these two antibodies were not detected by LIA. Antibody against Jo-1 was also not included in the agreement analysis as there were no positive results. The anti-Ro52, Ro60, SSB, P0, CENP-B, Histone, RNP and Scl-70 assays showed strong agreement (kappa=0.85, 0.89, 0.83, 0.82, 0.86, 0.82, 0.83 and 0.83, respectively), while Nucleosome and Sm tests displayed moderate agreement (kappa=0.79 and 0.72, respectively). Weak agreement was observed for antibodies against dsDNA (kappa=0.57).
Agreements of specific antinuclear antibodies between CLMIA and LIA.
| CLMIA | Positive | Positive | Negative | Negative | Kappa (95 % CI) |
|---|---|---|---|---|---|
| LIA | Positive | Negative | Positive | Negative | |
| Ro-52 | 65 | 4 | 9 | 107 | 0.85(0.77–0.93) |
| Ro-60 | 70 | 6 | 4 | 105 | 0.89(0.82–0.96) |
| SSB | 35 | 10 | 1 | 139 | 0.83(0.73–0.92) |
| P0 | 10 | 4 | 0 | 171 | 0.82(0.65–0.99) |
| CENP-B | 13 | 4 | 0 | 168 | 0.86(0.72–0.99) |
| Histone | 13 | 5 | 0 | 167 | 0.82(0.67–0.97) |
| dsDNA | 17 | 14 | 6 | 149 | 0.57(0.40–0.745) |
| Nucleosome | 6 | 3 | 0 | 176 | 0.79(0.56–1.00) |
| RNP | 17 | 6 | 0 | 162 | 0.83(0.70–0.96) |
| Sm | 4 | 2 | 1 | 178 | 0.72(0.41–1.00) |
| Scl-70 | 5 | 2 | 0 | 178 | 0.83(0.59–1.00) |
Due to the weak agreement between CLMIA and LIA in dsDNA, we used ELISA as a reference method to detect the 20 discrepant anti-dsDNA samples. Results showed that 12 out of 14 (85.7 %) CLMIA anti-dsDNA positive but LIA negative samples tested positive, and 5 out of 6 (83.3 %) CLMIA negative but LIA positive samples tested negative on the dsDNA ELISA kit.
Discussion
In this study, we established a CLMIA detection method in our laboratory that can detect 14 antibodies simultaneously. After experiment optimization, the developed assay showed high performance. Trueness verification was added to increase data reliability. Good linearities (R2>0.99) were observed for all ANA indicators over a range of concentrations. The LOD and precision experiment proved that the instrument has high sensitivity and good repeatability.
In addition, our study found that CLMIA detection has better clinical diagnostic performance compared with LIA and traditional HEp-2 IIF, showing the highest AUC and LR+ in ROC analysis. The LR is the ratio of the probability that a patient with the disease has a particular test result over the probability that a patient without the disease has the same test result. The larger LR+, the greater the probability of a true positive when the test result is positive [22]. Highest sensitivity was observed at IIF. Higher sensitivity can be used to increase the frequency of positive results in samples from patients with the disease, but it will also increase the rate of positive ANA in normal populations [23]. Although the specificity was increased with LIA compared to IIF, its sensitivity was lower due to methodological limitations. In contrast, CLMIA exhibited relatively higher sensitivity (82.22 %) and specificity (88.00 %).
The study revealed that the kappa coefficient values differed for each autoantibody; by its nature, kappa is affected by the distribution of positive and negative samples [21]. Frequently detected autoantibodies like Ro52, Ro60, and SSB showed strong agreement. Although there were only a few discordant results, the small number of positive samples resulted in lower kappa values for Nucleosome and Sm. The concordance of the antibody against Jo-1, PM-Scl and M2 could not be accurately assessed due to lack of positive results or inability of LIA to detect the indicator. This reflects the low prevalence of these autoantibodies in our sample population; more data are needed to assess the performance of these two techniques for detecting these autoantibodies.
Overall, most specific ANAs showed strong agreement between the two multiplex ANA kits. However, significant differences were observed between the CLMIA and LIA in the detection of anti-dsDNA. Most of anti-dsDNA discrepancy samples, 85.7 % of CLMIA positive but LIA negative and 83.3 % of CLMIA negative but LIA positive, showed consistent results between CLMIA and ELISA detection. The LIA anti-dsDNA antibody test is a qualitative test, while the CLMIA ANA test is a quantitative test, which can be traced to the international standard certified reference materials 15/174 [18, 24, 25]. Further observation also found that most of the discrepant results were due to the low sensitivity of LIA detection, which led to negative results of LIA and positive results of CLMIA [26].
This study also had several limitations. First, due to the lack of positive samples and the inconsistency of item testing, the diagnostic performance of the two assays was only compared for 11 antibodies. Second, the number of positive antibodies, such as Nucleosome, and Sm, was insufficient for accurate agreement comparisons. Moreover, no additional tests were performed to determine the specificity of antibodies other than dsDNA. Finally, this study focused on a small population and used limited testing and further studies are needed to supplement its limitations.
In conclusion, the CLMIA detection method established in this study was demonstrated to have better clinical diagnostic performance than LIA and IIF. The CLMIA was also shown to have the characteristics of high accuracy (each indicator was detected four times to avoid deviations in single detection results), good reproducibility (CV<15 %), high sensitivity (≤3 IU/mL for dsDNA and ≤1 RU/mL for other ANAs), convenience (fully automated without manual operation), and detection of ANA with trace amounts (20 μL) of serum. Meanwhile, this method has a relatively low cost, with up to 14 detection indicators integrated on a single glass chip, which is expected to become a potential routine method for detecting ANA.
-
Research ethics: All clinical investigations were conducted according to the Declaration of Helsinki and the studies were approved by the Ethics Committee of the Wuxi People’s Hospital Affiliated to Nanjing Medical University.
-
Informed consent: Informed consent was obtained from all individuals included in this study, or their legal guardians or wards.
-
Author contributions: Hu Z, Ye Y, Wang T conceived the study and designed the experiments. Yuan D, Yang Xand Ji C conducted the experiments and wrote the manuscript. Sun G, Xu Y, Cao Y analyzed the results. The authors have accepted responsibility for the entire content of this manuscript and approved its submission.
-
Competing interests: The authors state no conflict of interest.
-
Research funding: 1. The Major Projects of Precision Medicine of Wuxi Health Committee, China (No. J202001), 2. The Top Talents Project of Wuxi Taihu Lake Talent Plan.
-
Data availability: The raw data can be obtained on request from the corresponding author.
References
1. Guthridge, JM, Wagner, CA, James, JA. The promise of precision medicine in rheumatology. Nat Med 2022;28:1363–71. https://doi.org/10.1038/s41591-022-01880-6.Search in Google Scholar PubMed PubMed Central
2. Bizzaro, N, Antico, A, Platzgummer, S, Tonutti, E, Bassetti, D, Pesente, F, et al.. Automated antinuclear immunofluorescence antibody screening: a comparative study of six computer-aided diagnostic systems. Autoimmun Rev 2014;13:292–8. https://doi.org/10.1016/j.autrev.2013.10.015.Search in Google Scholar PubMed
3. Zheng, B, Li, E, Zhu, H, Lu, J, Shi, X, Zhang, J, et al.. Automated antinuclear immunofluorescence antibody analysis is a reliable approach in routine clinical laboratories. Clin Chem Lab Med 2017;55:1922–30. https://doi.org/10.1515/cclm-2017-0050.Search in Google Scholar PubMed
4. Yang, Z, Ren, Y, Liu, D, Lin, F, Liang, Y. Prevalence of systemic autoimmune rheumatic diseases and clinical significance of ANA profile: data from a tertiary hospital in Shanghai, China. APMIS 2016;24:805–11. https://doi.org/10.1111/apm.12564.Search in Google Scholar PubMed
5. Park, Y, Kim, SY, Kwon, GC, Koo, SH, Kang, ES, Kim, J. Automated versus conventional microscopic interpretation of antinuclear antibody indirect immunofluorescence test. Ann Clin Lab Sci 2019;49:127–33.Search in Google Scholar
6. Abozaid, HSM, Hefny, HM, Abualfadl, EM, Ismail, MA, Noreldin, AK, Eldin, ANN, et al.. Negative ANA-IIF in SLE patients: what is beyond? Clin Rheumatol 2023;42:1819–26. https://doi.org/10.1007/s10067-023-06577-w.Search in Google Scholar PubMed PubMed Central
7. Lee, SA, Kahng, J, Kim, Y, Park, YJ, Han, K, Kwok, SK, et al.. Comparative study of immunofluorescent antinuclear antibody test and line immunoassay detecting 15 specific autoantibodies in patients with systemic rheumatic disease. J Clin Lab Anal 2012;26:307–14. https://doi.org/10.1002/jcla.21522.Search in Google Scholar PubMed PubMed Central
8. Klupfel, J, Koros, RC, Dehne, K, Ungerer, M, Wurstle, S, Mautner, J, et al.. Automated, flow-based chemiluminescence microarray immunoassay for the rapid multiplex detection of IgG antibodies to SARS-CoV-2 in human serum and plasma (CoVRapid CL-MIA). Anal Bioanal Chem 2021;413:5619–32. https://doi.org/10.1007/s00216-021-03315-6.Search in Google Scholar PubMed PubMed Central
9. Klupfel, J, Passreiter, S, Weidlein, N, Knopp, M, Ungerer, M, Protzer, U, et al.. Fully automated chemiluminescence microarray analysis platform for rapid and multiplexed SARS-CoV-2 serodiagnostics. Anal Chem 2022;94:2855–64. https://doi.org/10.1021/acs.analchem.1c04672.Search in Google Scholar PubMed
10. Wu, Y, Fu, Y, Guo, J, Guo, J. Single-molecule immunoassay technology: recent advances. Talanta 2023;265:124903. https://doi.org/10.1016/j.talanta.2023.124903.Search in Google Scholar PubMed
11. Dillaerts, D, De Baere, H, Bossuyt, X. Clinical autoantibody detection by microarray. Clin Chem Lab Med 2017;55:578–85. https://doi.org/10.1515/cclm-2016-0533.Search in Google Scholar PubMed
12. Robinson, WH, DiGennaro, C, Hueber, W, Haab, BB, Kamachi, M, Dean, EJ, et al.. Autoantigen microarrays for multiplex characterization of autoantibody responses. Nat Med 2002;8:295–301. https://doi.org/10.1038/nm0302-295.Search in Google Scholar PubMed
13. Chang, HC, Wu, YC, Chen, JP, Wu, YD, Huang, WN, Chen, YH, et al.. Comparisons of anti-dsDNA antibody detection methods by chemiluminescent immunoassay and enzyme-linked immunosorbent assay in systemic lupus erythematosus. Diagnostics 2021;11:1940. https://doi.org/10.3390/diagnostics11111940.Search in Google Scholar PubMed PubMed Central
14. Cockx, M, Van Hoovels, L, De Langhe, E, Lenaerts, J, Thevissen, K, Persy, B, et al.. Laboratory evaluation of anti-dsDNA antibodies. Clin Chim Acta 2022;528:34–43. https://doi.org/10.1016/j.cca.2021.12.029.Search in Google Scholar PubMed
15. Wu, Y, Wu, X, Chen, J, Hu, J, Huang, X, Zhou, B. A novel protein chip for simultaneous detection of antibodies against four epidemic swine viruses in China. BMC Vet Res 2020;16:162. https://doi.org/10.1186/s12917-020-02375-7.Search in Google Scholar PubMed PubMed Central
16. Yin, J, Niu, J, Huo, J, Sun, J, Huang, J, Sun, C. Construction and evaluation of a novel MAP immunoassay for 9 nutrition-and-health-related protein markers based on multiplex liquid protein chip technique. Nutrients 2023;15:1522. https://doi.org/10.3390/nu15061522.Search in Google Scholar PubMed PubMed Central
17. Yin, JY, Huo, JS, Ma, XX, Sun, J, Huang, J. Study on the simultaneously quantitative detection for beta-lactoglobulin and lactoferrin of cow milk by using protein chip technique. Biomed Environ Sci 2017;30:875–86. https://doi.org/10.3967/bes2017.118.Search in Google Scholar PubMed
18. Fox, BJ, Hockley, J, Rigsby, P, Dolman, C, Meroni, PL, Ronnelid, J. A WHO Reference Reagent for lupus (anti-dsDNA) antibodies: international collaborative study to evaluate a candidate preparation. Ann Rheum Dis 2019;78:1677–80. https://doi.org/10.1136/annrheumdis-2019-215845.Search in Google Scholar PubMed PubMed Central
19. Yuan, D, Cui, M, Yu, S, Wang, H, Jing, R. Droplet digital PCR for quantification of PML-RARalpha in acute promyelocytic leukemia: a comprehensive comparison with real-time PCR. Anal Bioanal Chem 2019;411:895–903. https://doi.org/10.1007/s00216-018-1508-6.Search in Google Scholar PubMed
20. Jang, J, Kim, S, Kim, HS, Lee, KA, Park, J, Park, Y. Comparison of antinuclear antibody profiles obtained using line immunoassay and fluorescence enzyme immunoassay. J Int Med Res 2021;49:3000605211014390. https://doi.org/10.1177/03000605211014390.Search in Google Scholar PubMed PubMed Central
21. Yi, A, Lee, CH, Moon, HW, Kim, H, Hur, M, Yun, YM. Evaluation of the LIA-ANA-Profile-17S for the detection of autoantibodies to nuclear antigens. Clin Biochem 2018;55:75–9. https://doi.org/10.1016/j.clinbiochem.2018.03.020.Search in Google Scholar PubMed
22. Op De Beeck, K, Vermeersch, P, Verschueren, P, Westhovens, R, Marien, G, Blockmans, D, et al.. Antinuclear antibody detection by automated multiplex immunoassay in untreated patients at the time of diagnosis. Autoimmun Rev 2012;12:137–43. https://doi.org/10.1016/j.autrev.2012.02.013.Search in Google Scholar PubMed
23. Deng, X, Peters, B, Ettore, MW, Ashworth, J, Brunelle, LA, Crowson, CS, et al.. Utility of antinuclear antibody screening by various methods in a clinical laboratory patient cohort. J Appl Lab Med 2016;1:36–46. https://doi.org/10.1373/jalm.2016.020172.Search in Google Scholar PubMed
24. Yuan, W, Cao, H, Li, W, Wu, X, Zheng, J. Comparison study of bead-based and line-blot multiplex ANA immunoassays in the diagnosis of systemic autoimmune rheumatic diseases. Clin Rheumatol 2022;41:899–909. https://doi.org/10.1007/s10067-021-05946-7.Search in Google Scholar PubMed
25. Zhao, J, Wang, K, Wang, X, Li, T, Guo, L, Gu, L, et al.. The performance of different anti-dsDNA autoantibodies assays in Chinese systemic lupus erythematosus patients. Clin Rheumatol 2018;37:139–44. https://doi.org/10.1007/s10067-017-3771-x.Search in Google Scholar PubMed
26. Bremer, HD, Lattwein, E, Renneker, S, Lilliehook, I, Ronnelid, J, Hansson-Hamlin, H. Identification of specific antinuclear antibodies in dogs using a line immunoassay and enzyme-linked immunosorbent assay. Vet Immunol Immunopathol 2015;168:233–41. https://doi.org/10.1016/j.vetimm.2015.10.002.Search in Google Scholar PubMed
© 2024 the author(s), published by De Gruyter, Berlin/Boston
This work is licensed under the Creative Commons Attribution 4.0 International License.
Articles in the same Issue
- Frontmatter
- Original Articles
- Adequate cefazolin therapy for critically ill patients: can we predict active concentrations from given protein-binding data?
- Fully automated chemiluminescence microarray immunoassay for detection of antinuclear antibodies in systemic autoimmune rheumatic diseases
- Evaluation of a Treponema IgG ELISA alone and in combination with an IgM ELISA as substitutes for Treponema pallidum particle agglutination (TPPA) as confirmatory tests in a two-tier diagnostic algorithm for diagnosis of syphilis infection
- Research on the stability changes in expert consensus of the ACTH detection preprocessing scheme
- Female patients with systemic lupus erythematosus (SLE)-associated antiphospholipid syndrome (APS) have a lower ovarian reserve than either primary APS or SLE patients
- Short Communication
- Clinical usefulness of the “GeneSoC® SARS-CoV-2 N2 Detection Kit”