The effect of the Covid pandemic and lockdown on stillbirth rates in a South Indian perinatal centre
-
Nuzhat Aziz
 ,
Pallavi Chandra Ravula
,
Pallavi Chandra Ravula

Abstract
Objectives
The Covid-19 pandemic affected antenatal care in many parts of the world. It brought about many changes as part of control and containment measures. We examined the effect of the first and second waves of the pandemic in India on stillbirth rates, as indicators of quality of maternity care.
Methods
Observational study at a tertiary referral perinatal centre with approximately 10,000 births annually. The Covid-19 first wave period was taken as January to December 2020 with lockdown March to June 2020, which included complete shut down of clinics and ultrasound services. The second wave was from January to September 2021. All women with singleton pregnancy who had hospital based antenatal care were included. We investigated monthly trends in obstetric load (new antenatal registrations, total obstetric clinic numbers and total births) with stillbirth numbers as the pandemic continued (daily Covid case trend). We compared first and second wave stillbirth rates, overall as well as those that were small for gestational age (<10th centile) at delivery.
Results
There were 9,251 births with 32 stillbirths in the first wave (rate 3.46/1,000) and 6,228 births with 14 stillbirths in the second wave (2.25/1,000). This represented a 54% higher rate in the first phase and extended lockdown period (p=0.08). The incidence of stillbirths that were SGA was significantly higher in the first wave: 14 vs. 2, (p=0.03).
Conclusions
Reduced access to planned antenatal care during Covid-19 pandemic lockdown was associated with a significant increase in SGA stillbirths.
Introduction
The Covid-19 pandemic saw an increase in stillbirths across the world. The progress made for reducing stillbirth rates seemed to have been halted, reversed in many countries as all the available resources were targeted to save people from the Covid-19 pandemic. Stillbirth rates have been reported in various reports to have increased by 20–30% [1, 2].
India had the first wave in the year 2020 and a much severe second wave a year later in 2021. The first wave overwhelmed the healthcare capacity, but the second wave was unprecedented, chaotic with people dying in massive numbers. Reaching a healthcare facility, getting oxygen became a luxury, many dying for lack of medical care. Data has been coming in about obstetric mortality and morbidity with Covid infected women for the first and second wave in India [3]. The impact of the second wave was much worse when we consider the numbers infected, positivity rates and deaths; maximum daily numbers were more than 4 times. This is only a tip of the iceberg. Women without Covid-19 also suffered [4].
The major difference between the two pandemic waves was the healthcare access during lockdown, containment, and control measures for Covid-19. A very strict curfew with only emergency services in hospitals, all non-emergency healthcare was halted during the first wave. The second wave lockdown allowed healthcare related activities completely. Non-urgent care, planned visits and investigations were not interrupted. The two pandemic peaks with their contrast in containment policies allow an opportunity to explore positive and negative factors [5, 6]. The comparison of the impact of Covid-19 on stillbirths of first and second waves has not been reported. This study was done to study the effect of the Covid-19 pandemic on stillbirth rates in a tertiary perinatal unit in the southern part of India in the first and second wave.
Methods
First wave of Covid-19 pandemic in India
The first reported case in India was on 27th January 2020 and the numbers slowly increased. The start of the first wave was in January 2020, peaking in September-October and returning to baseline by end of December 2020. Hence the 12 months of 2020 was taken as the first wave of the Covid pandemic. The maximum daily number of Covid cases was 97,894. The first lockdown for the entire country as a Covid-19 containment policy was announced on 22nd March 2020, extended till June 30th 2020, with restrictions being lifted in a phased manner from June 15th 2020. The first lockdown was before the first waves peak, which occured in October 2020. The lockdown in the first wave restricted movement completely, all non-emergency healthcare services were affected. Movement during this lockdown required a curfew pass which had to be obtained from the government [6].
Second wave of Covid-19 pandemic
The numbers started rising again in February 2021, peaking in May, June and returning to less than 10,000 per day by October 2021, which was regarded as end of the peak. The second lockdown was from April 1st 2021 to June 30th 2021. The second lockdown was at the peak of the second wave of the pandemic in May 2021. January to September 2021 was taken as the second wave period in India. The second lockdown in 2021 gave a window of four to six hours every day for movement out of home and allowed all healthcare activities without interruption. Movement of healthcare workers was allowed with verification of their designation [5, 6].
Data sources
The study was conducted using data from a tertiary referral perinatal centre with about 10,000 births annually. It was an observational data analysis using the electronic medical records database. All women who registered with the hospital were included to study the trends. The obstetric workload at the hospital was measured with new antenatal registrations, total number of obstetric clinic numbers, total births. New antenatal registrations are women who come for the first booking visit. The total obstetric clinic numbers include all visits, new booking, regular scheduled appointments, and emergency visits. The total births include booked and referred women. The maternal and fetal characteristics were studied for the years 2020 and 2021 as mean maternal age, mean BMI, mean parity, Covid positive rates, mean gestational age, mean birth weight, prematurity rates.
Analysis
We collated annual and monthly numbers of antenatal registrations, total numbers in obstetric clinics, total births and stillbirth numbers in singleton booked pregnancies. Inclusion criteria were singleton pregnancies who had booked before 24 weeks gestation and had an ultrasound verified expected date of delivery. Referred women (for only emergency care), multifetal pregnancies and births with congenital anomalies were excluded. Informed consent was taken for use of data for all women. We compared stillbirth rate in singleton pregnancies during first wave and second wave of Covid pandemic in 2020 and 2021, and against baseline stillbirth rates of years 2018 and 2019. We also looked at the distribution of birthweight centiles of stillbirths and compared the incidence of small for gestational age stillbirths in both time periods as identification of SGA is dependent on antenatal care.
Stillbirth was defined as a baby born without signs of life after 28 weeks of gestation [7]. The hospital has been using the Growth Assessment Protocol (GAP) as the pathway for detection of SGA (small for gestational age babies) and prevention of stillbirths from the Perinatal Institute, United Kingdom since 2014 [8]. The hospital uses the risk categorization for stillbirths and has a pathway for detection of SGA in low risk and high-risk populations. Low risk pregnancies have serial symphysio-fundal height measurement from 24 weeks onwards with a routine single third trimester fetal growth assessment by ultrasound at 34–36 weeks gestation. The high-risk women have serial fetal growth assessment at 3–4 weekly intervals in the third trimester. The GAP protocol has customised fetal growth charts for both symphysio fundal height and ultrasound estimated fetal weight plotting. The customised Indian birth weight centiles are created for all babies born; less than 10th centile are categorised as small for gestational age and greater than 90th centile as large for gestational age.
Results
The year of first wave 2020 had 9,632 births in 12 months and 6,515 births from January to September 2021 (nine months) with a monthly average of 802 vs. 723 births, respectively. The new antenatal registration numbers were 16,577 in the first wave vs. 13,610 in the second wave, which gave a monthly average as 1,381 vs. 1512 respectively. The total antenatal clinic numbers were 95,837 and 83,981 with a monthly average of 7,986 vs. 9,331 in the first and second wave respectively. Table 1 shows the total numbers and monthly obstetric workload in these time periods. The total number of Covid positive cases were almost double in the second wave when compared to the first wave; 169 vs. 342 (p<0.01) with the same testing policy in the first and second wave of pandemic. Covid RT PCR was done for women with Covid-19 symptoms and did not do routine screening.
The obstetric workload.
| First wave (January-December 2020) | Second wave (January-September 2021) | |||
|---|---|---|---|---|
| Total | Monthly mean ± SD | Total | Monthly mean ± SD | |
| Obstetric clinic numbers | 95,837 | 7,986 ± 1,684 | 83,981 | 9,331 ± 965 |
| New antenatal registrations | 16,577 | 1,381 ± 380 | 13,610 | 1,512 ± 62.7 |
| Births | 9,632 | 802 | 6,515 | 723 |
| All multifetal pregnanciesa | 291 | 24 | 212 | 23 |
| Covid positive womena | 169 | 14 | 342 | 38 |
-
aDenominator is total births. SD, standard deviation.
Figure 1 shows the flow chart of data exclusions. Multifetal births were excluded from each group, totalling 291 in the first wave and 212 in the second wave. The booked singleton births were 9,251 and 6,228 respectively. The maternal and fetal characteristics of these women are listed in Table 2.
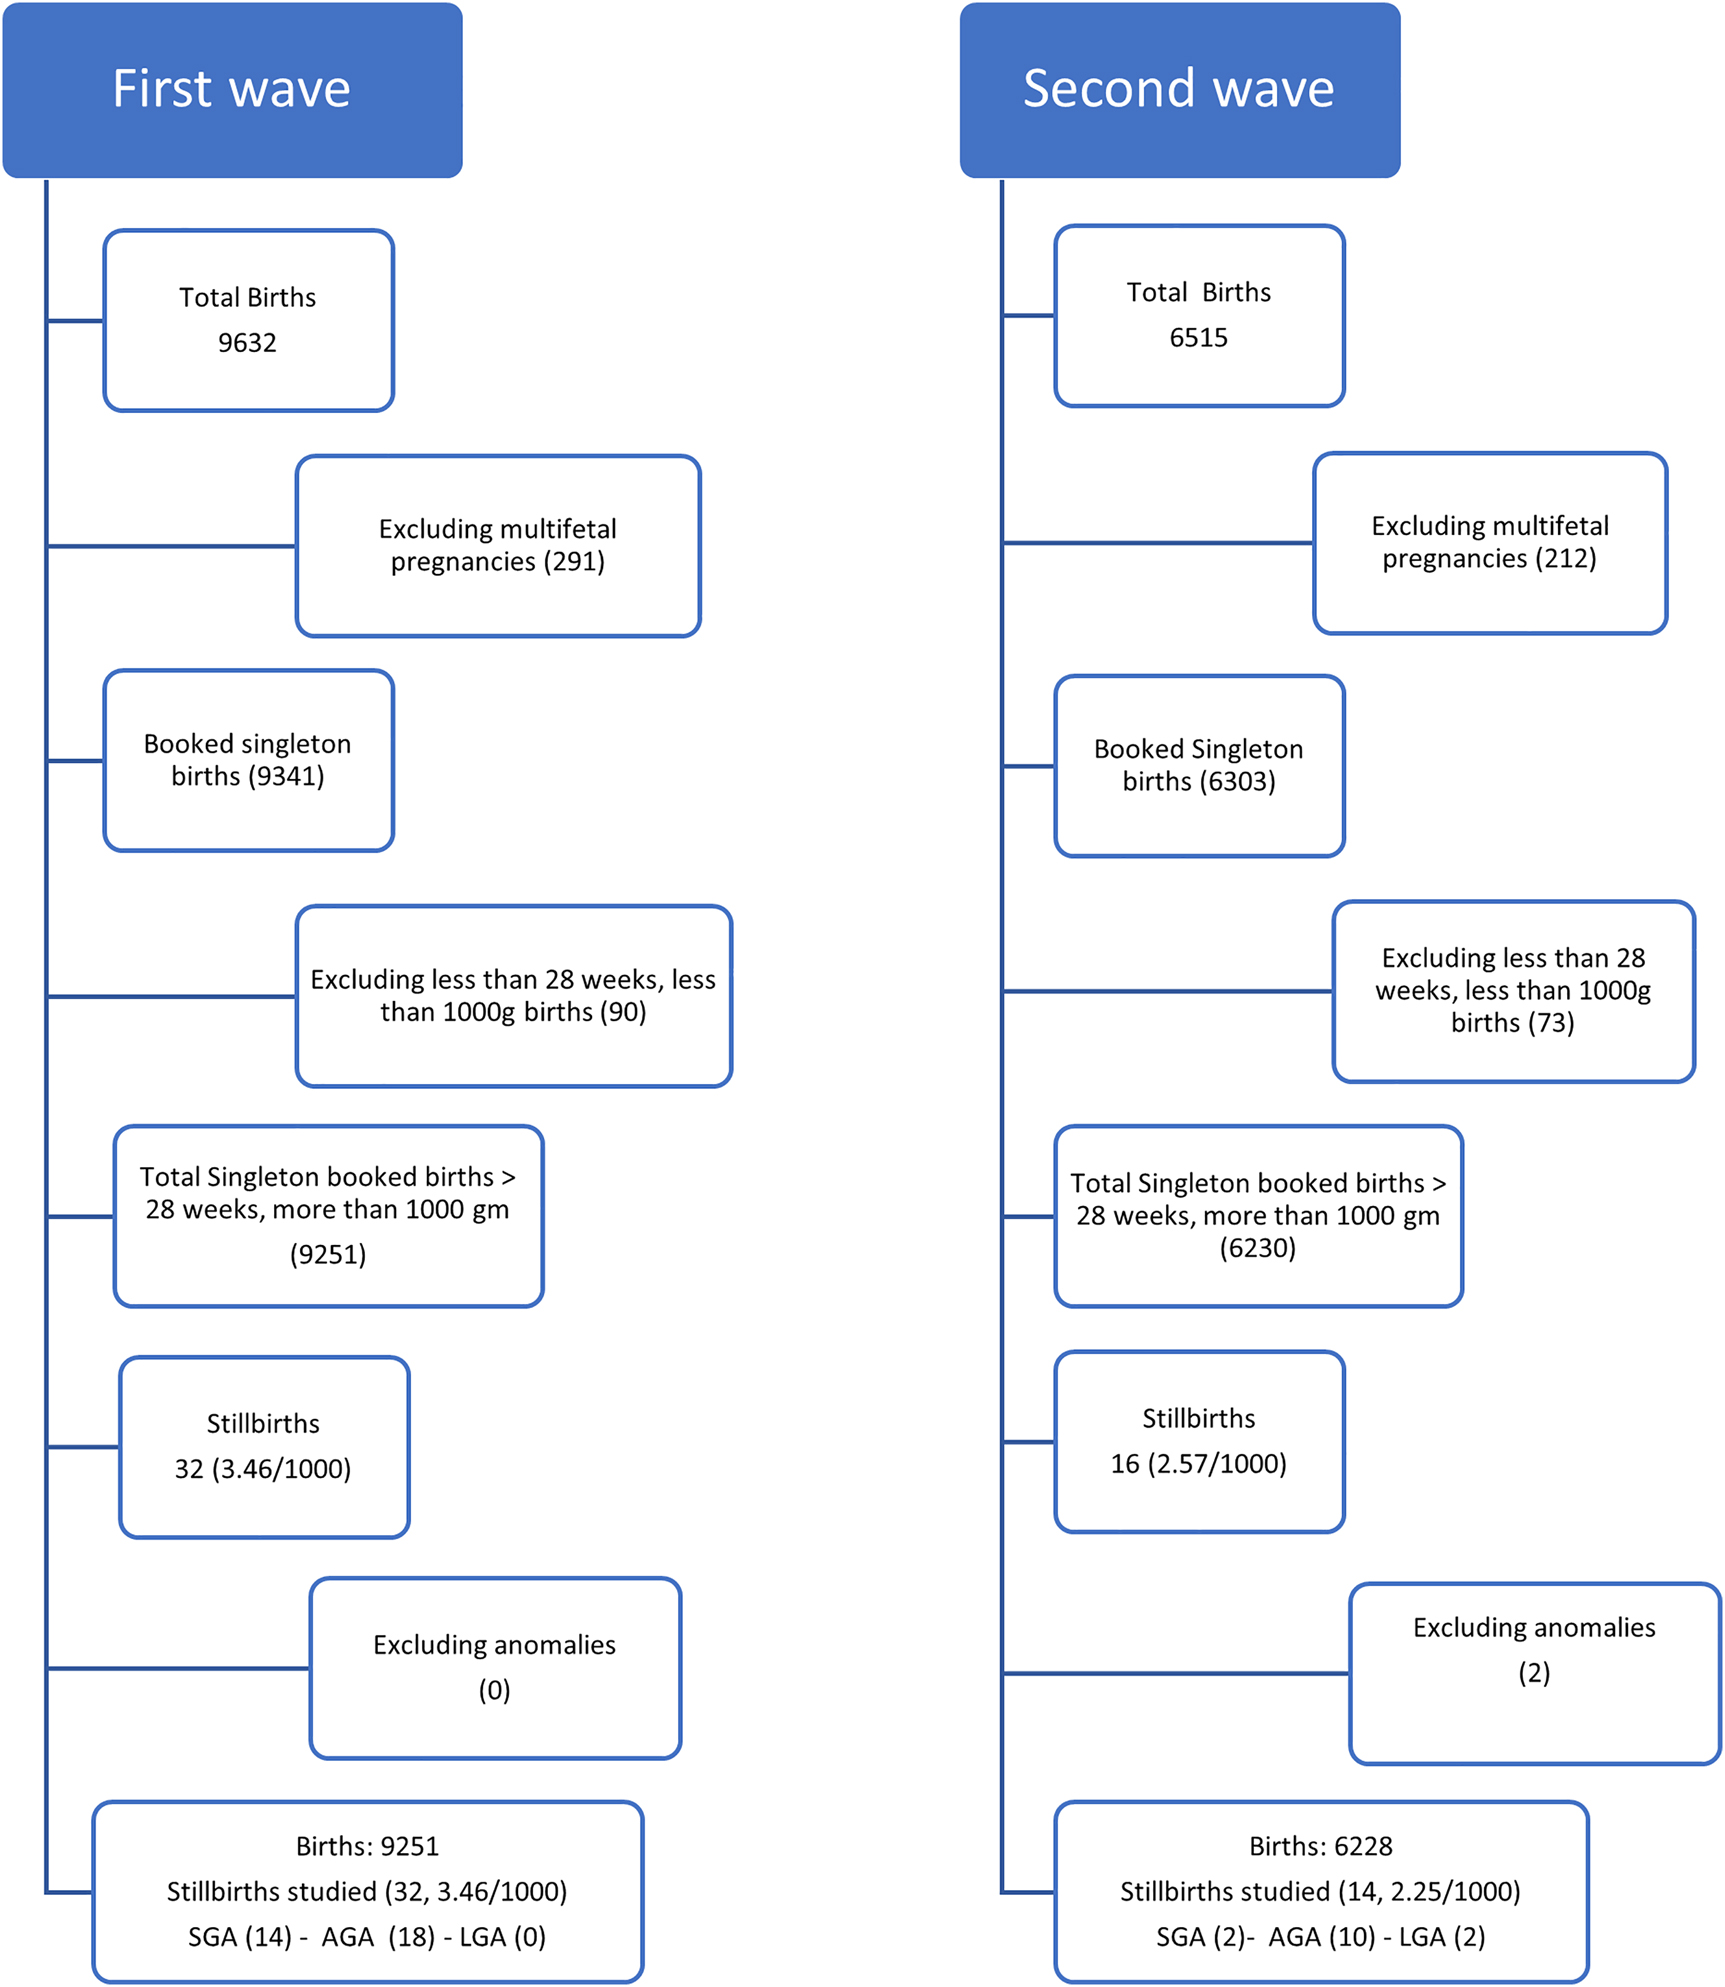
Flow chart of data analysis.
Descriptive characteristics of women and babies in first and second wave of pandemic.
| Characteristic | First wave (January-December 2020) | Second wave (January-September 2021) | |
|---|---|---|---|
| Maternal age, years | Mean ± SD | 28.22 ± 4.27 | 28.71 ± 4.2 |
| BMI, kg/m2 | Mean ± SD | 26.7 ± 5.4 | 26.54 ± 4.83 |
| Parity | Mean ± SD | 0.56 ± 0.82 | 0.58 ± 0.82 |
| Hypertension | n (%) | 1,387 (15.0%) | 922 (14.8%) |
| Diabetes | n (%) | 2,730 (29.5%) | 2,336 (37.5%) |
| Respiratory disease | n (%) | 216 (2.3%) | 168 (2.7%) |
-
BMI, body mass index; SD, standard deviation
Figure 2 was created using monthly numbers from January 2020 to September 2021 and matching them with the daily Covid numbers in India, the first and second pandemic waves [9]. The first lockdown brought down the monthly obstetric clinic numbers from 10,477 in January 2020 to 3,506 in April 2020, a reduction of 66.5% in antenatal checks. The trends slowly increased to reach January 2020 levels only after 18 months in September 2021. The number of women registering for their first antenatal care visit also went down from 1,658 to 383 from January to April 2020, which was 77.1% reduction in registrations for antenatal care. The largest amount of births in a month was 977 in September 2021 and the smallest was 587 in March 2021, a reduction of 40.0%. The troughs due to the first wave of antenatal clinic numbers reached back to pre-pandemic levels only with the decline of the second wave. There was a decrease in antenatal clinic numbers due to fear of Covid-19 even before the lockdown in the first wave. The monthly trends of stillbirths showed an increase in February and June 2020, to seven per month, which was not found in any other month. There was no stillbirths in the interval between (April and May 2020) when there was maximum restriction of movement (Figure 2). The fear of infection, fall in antenatal clinic numbers and the increase in stillbirths was observed before the lockdown, not correlating with the peak of the first wave (Covid-19 daily cases). There were no stillbirths in the lockdown period coinciding with the travel restrictions and suspension of non-emergency healthcare services. The lifting up of the lockdown allowed women to reach for medical care and hence stillbirth numbers are high in June 2020. The second wave did not have an increase in stillbirth numbers, even though the Covid infection cases many times higher.
![Figure 2:
Monthly trends in obstetric antenatal clinic numbers, stillbirths and daily Covid cases.
AN registrations = antenatal registrations represented number of first time booking for antenatal care. The yellow shaded area represents the first lockdown and the pink shaded zone for the second lockdown time. Daily Covid 19 cases for India graph were taken from John Hopkins University CSSE Covid 19 Data available live on the website [9].](/document/doi/10.1515/jpm-2022-0122/asset/graphic/j_jpm-2022-0122_fig_002.jpg)
Monthly trends in obstetric antenatal clinic numbers, stillbirths and daily Covid cases.
AN registrations = antenatal registrations represented number of first time booking for antenatal care. The yellow shaded area represents the first lockdown and the pink shaded zone for the second lockdown time. Daily Covid 19 cases for India graph were taken from John Hopkins University CSSE Covid 19 Data available live on the website [9].
The annual stillbirth rates are shown in Figure 3, and were 2.49, 2.85, 3.46, and 2.25 per 1,000 for the years 2018–2021. The rates for the first and second wave are compared in Table 3 and show stillbirth rates to be 54% higher in the first than the second wave p=0.08. The high rate during the first wave included a significant increase in SGA stillbirths (14 in 2020 vs. 2 in 2021; p=0.03). The causes of stillbirths are summarized in Table 4. The centile distribution of all stillbirths in the two years are shown in Figure 4.
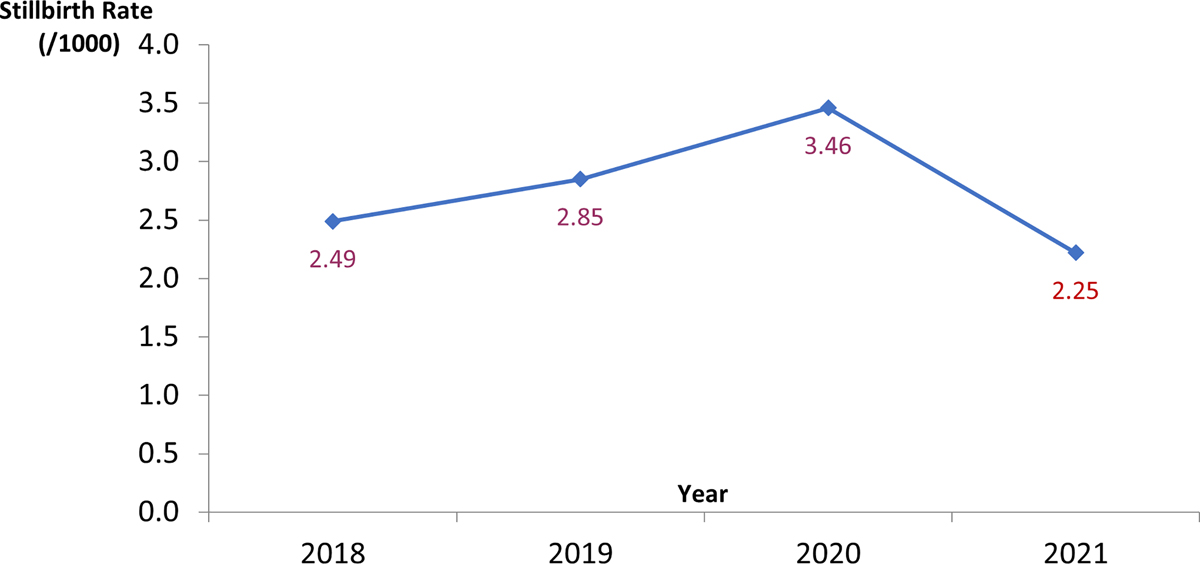
Annual stillbirth rates 2018–2021.
2021 covers period from January to September to coincide with 2nd wave.
Singleton births and stillbirths during the two pandemic waves.
| First wave (January-December 2020) | Second wave (January-September 2021) | p-Value | |
|---|---|---|---|
| All births, n | 9,251 | 6,228 | |
| Gestational age at delivery, weeks, mean ± SD | 38.03 ± 2.1 | 37.88 ± 2.3 | <0.01 |
| Preterm births <37 weeks, % | 13.2 | 13.5 | 0.59 |
| <34 weeks, % | 4.1 | 4.6 | 0.12 |
| Mean birth weight, kg | 2.86 ± 0.57 | 2.84 ± 0.6 | 0.04 |
| Gestational age at delivery, weeks, mean ± SD | 35.1 ± 2.6 | 35.5 ± 3.3 | 0.38 |
| Stillbirths, N (rate/1,000) | 32 (3.46) | 14 (2.25) | 0.08 |
| LGA >90th centile n, % | 0 | 2 (14.3) | – |
| SGA <10th centile n, % | 14 (43.8) | 2 (14.3) | 0.03 |
-
SD, standard deviation; LGA, large for gestational age; SGA, small for gestational age.
Details of stillbirths and perinatal deaths.
| First wave (January-December 2020) | Second wave (January-September 2021) | |
|---|---|---|
| All births, n | 9,251 | 6,228 |
| Stillbirths, n, rate/1,000 | 32 (3.46) | 14 (2.25) |
| SGA related | 14 | 2 |
| Unexplained | 7 | 4 |
| Abruption | 3 | 1 |
| Diabetic disorders | 1 | 3 |
| Hypertensive disorders in pregnancy | 1 | 1 |
| Fetal causes | 0 | 2 |
| Birth asphyxia | 0 | 1 |
| Polyhydramnios | 3 | 0 |
| Fetomaternal hemorrhage | 1 | 0 |
| Rh isoimmunisation | 2 | 0 |
| Neonatal deaths | 9 | 12 |
-
SGA, small for gestational age.
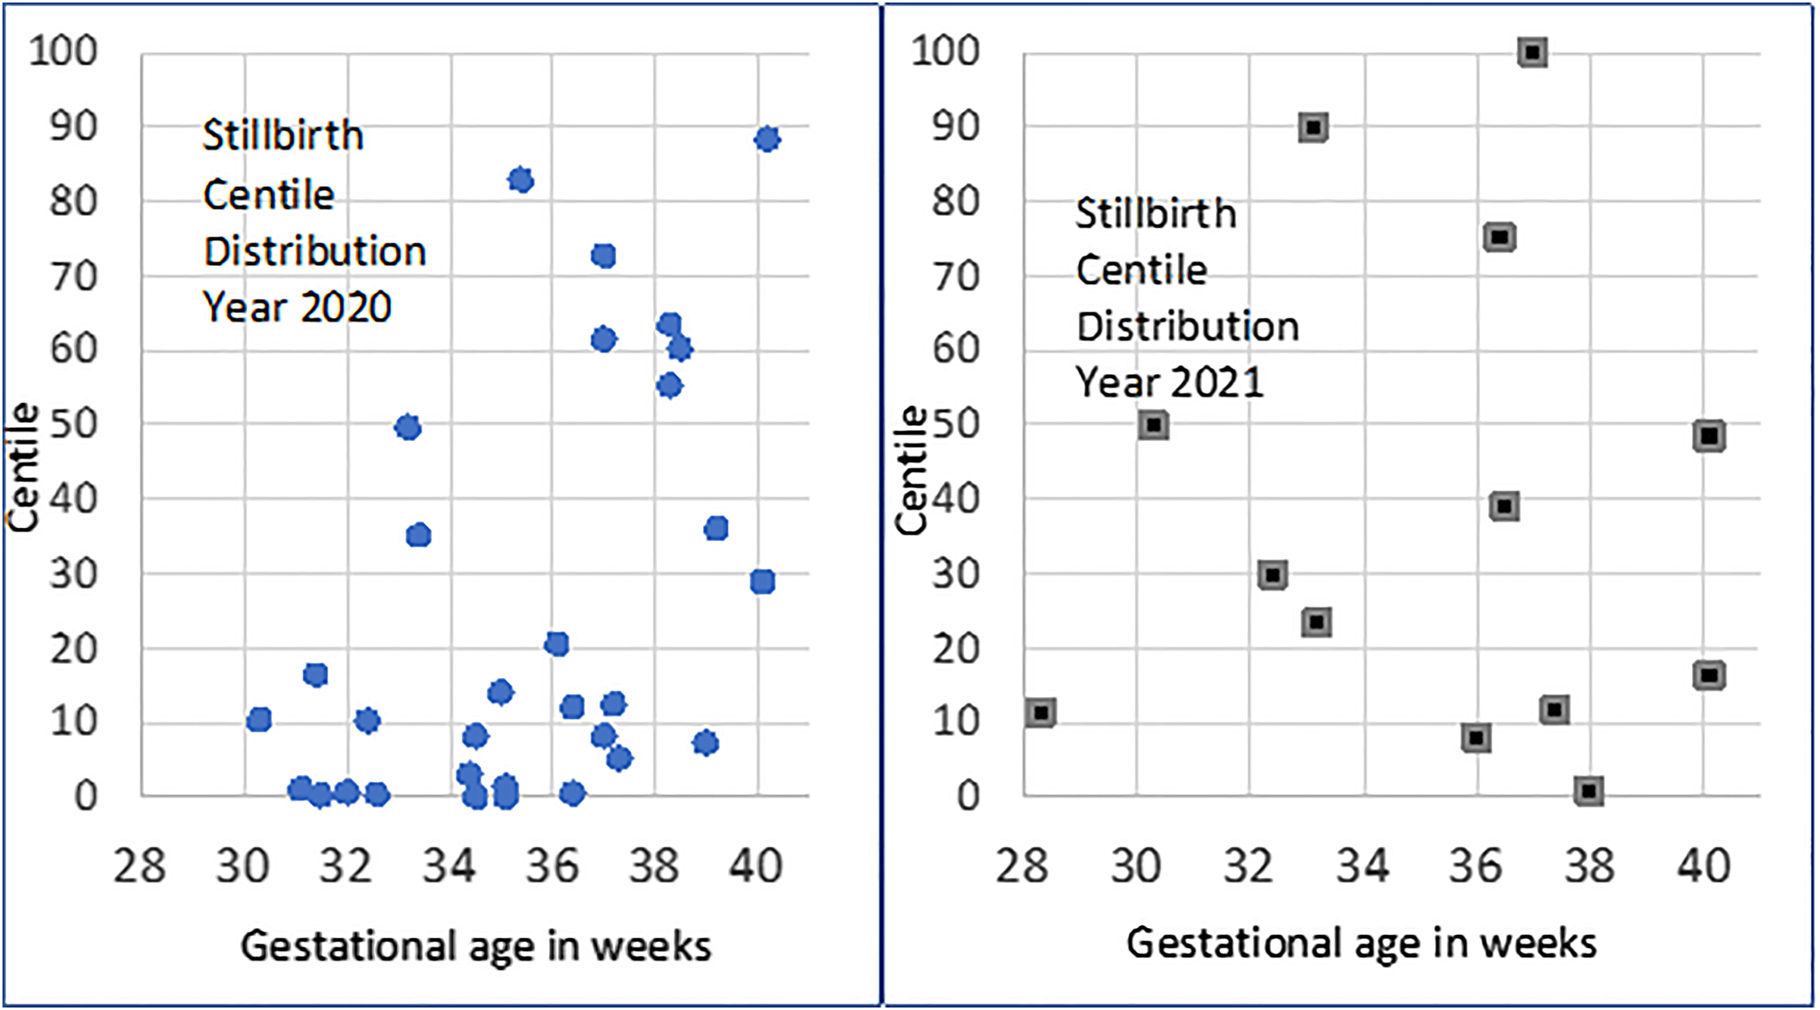
Stillbirth birthweight centile distribution.
Discussion
India struggled with the Covid pandemic, with the world’s highest number of Covid cases per day. The experience of Covid-19 pandemic was unique with healthcare services saturated with Covid cases, emphasis on emergency care on one side and the containment policies on the other side. Obstetric care has evolved over years and the morbidity, mortality rates decreased due to the emphasis on prevention of complications, planned antenatal care, appropriate timely screening for fetal and maternal deviations from normal. This planned antenatal care was disturbed by the first lockdown, fear of the disease, failure to go for routine antenatal care during the first lockdown, which is reflected by a fall in numbers of first visit registrations and total clinic numbers. The maximum drop was 71% coinciding with the month of April 2020, the month of lockdown and not the first and second waves of pandemic. The monthly average number of births in comparison did not decrease, but the lockdown reduced the numbers as seen in Figure 3. This was mostly due to restrictions in travel, closure of state borders and fear of infection. The parameters chosen to represent the reduction in access to planned antenatal care were those captured in electronic database and maintained.
There are many reports of reduction in antenatal care and an increase in stillbirths in Covid pandemic [1,2,10], [11], [12], [13]. The stillbirth rate in singleton pregnancies was chosen to represent a direct indicator of antenatal care, and more than 28 weeks was chosen in line with international definition [7]. The stillbirths around the lockdown in 2020 were very high reaching up to seven in a month against up to three in other months. The lockdown in the first wave did not coincide with the peak of the first wave of Covid pandemic. The lockdown was intense with complete restriction of movement, financial and economic crisis for many, leading to difficulty in access to non-emergency healthcare, including an absence of clinics and ultrasound services. The peak of the first and second wave of the Covid-19 pandemic did not coincide with an increase of stillbirths, reflecting the lockdown principles may have a role which needs to be studied.
The preventable stillbirths are those fetuses who are small, showing signs of growth lag in utero. Increased detection of SGA babies in antenatal care is known to decrease stillbirth rates [14]. Risk categorization, regular, planned serial assessment of symphysio-fundal height in low risk, serial fetal growth by ultrasound in high risk, has been shown to increase SGA detection rates before birth [14]. The disruption in antenatal care led to gaps in this pathway. The SGA proportion of total stillbirths was 14/32 (43.8%) in the first wave when compared to 2/14 (14.3%) in the second wave, more than double in proportion. The lessons learned from the first lockdown were applied to the second wave lockdown, and all healthcare facilities were kept open. The stillbirth rate in year 2018 was 2.49 and that in 2021 was 2.25 per 1,000. The impact of interruption of healthcare was very significant in year 2020 and antenatal care had to be redesigned. Team discussions were held to show SGA stillbirths have increased in year 2020 with audit of SGA detection rates and missed cases as a learning tool. The second wave of Covid-19 was unprecedented with massive numbers, traumatizing every home emotionally, economically, and financially. Even though the hospitals were completely overwhelmed with Covid cases, the stillbirth rate did not rise. The Covid-19 positive women in the hospital were only those who were symptomatic and tested by Covid-19 RT PCR. The Covid-19 positive numbers mentioned were small, and no stillbirth was seen in these women in our institute.
The world has seen pandemic containment and control policies in different countries. Lockdown of varying restrictions, durations can have an impact on non-emergency healthcare [10], [11], [12], [13]. We present our institutional stillbirth data with the antenatal care trends over the first and second waves with different lockdown policies. The limitations are small numbers, institutional data, and a small number of stillbirths. This is the first study comparing stillbirth rates in the first and second wave of pandemic in an institution that was using the GAP protocol for reduction of stillbirths for the past six years. An unprecedented crisis, we do not know the optimal method of containment of this pandemic or the effects on the health indicators. This data analysis and dissemination will help us to plan better, to avoid factors which had a negative impact, and facilitate those that promote better care.
Conclusions
The reduction in access to antenatal care due to lockdown was associated with a trend in increased stillbirths, with a significantly higher rate of potentially preventable SGA stillbirths. The increased incidence of stillbirths did not have a correlation to the peaks of Covid pandemic in terms of daily infection cases. The second wave was much more severe in comparison to the first wave, but there was no increase in stillbirths as the lockdown was much more planned and allowed all healthcare activities to continue.
-
Research funding: None declared.
-
Author contributions: Author Nuzhat Aziz contributed to the concept of the study, data collection, data interpretation and led the writing of the manuscript. Pallavi Chandra, Sailaja Devi and Siri Yerubandi contributed to the concept of the study, data collection and critical analysis of the draft of the manuscript. All authors have read and approved the final manuscript.
-
Competing interests: Authors state no conflict of interest.
-
Informed consent: Informed consent was obtained from all individuals included in this study.
-
Ethical approval: The Fernandez Hospital Ethical Committee (Reg No. ECR/933/Inst/TG/2017) reviewed and approved the protocol (Protocol Ref. No. 02_2022) at Fernandez Hospital, Hyderabad, India.
References
1. Khalil, A, von Dadelszen, P, Draycott, T, Ugwumadu, A, O’Brien, P, Magee, L. Change in the incidence of stillbirth and preterm delivery during the COVID-19 pandemic. JAMA 2020;324:705–6. https://doi.org/10.1001/jama.2020.12746.Suche in Google Scholar PubMed PubMed Central
2. Kc, A, Gurung, R, Kinney, MV, Sunny, AK, Moinuddin, M, Basnet, O, et al.. Effect of the COVID-19 pandemic response on intrapartum care, stillbirth, and neonatal mortality outcomes in Nepal: a prospective observational study. Lancet Global Health 2020;8:e1273–81. https://doi.org/10.1016/S2214-109X(20)30345-4. Epub 2020 Aug 10. PMID: 32791117; PMCID: PMC7417164.Suche in Google Scholar PubMed PubMed Central
3. Mahajan, NN, Pophalkar, M, Patil, S, Yewale, B, Chaaithanya, IK, Mahale, SD, et al.. Pregnancy outcomes and maternal complications during the second wave of coronavirus disease 2019 (COVID-19) in India. Obstet Gynecol 2021;138:660–62. https://doi.org/10.1097/AOG.0000000000004529. PMID: 34233345; PMCID: PMC8454281.Suche in Google Scholar PubMed PubMed Central
4. von Dadelszen, P, Khalil, A, Wolfe, I, Kametas, NA, O’Brien, P, Magee, LA. “Women and children last”—effects of the Covid-19 pandemic on reproductive, perinatal, and paediatric health. BMJ 2020;369:m2287. https://doi.org/10.1136/bmj.m2287.Suche in Google Scholar PubMed
5. The Lancet. India under COVID-19 lockdown. Lancet 2020;395:1315. https://doi.org/10.1016/S0140-6736(20)30938-7. PMID: 32334687; PMCID: PMC7180023.Suche in Google Scholar PubMed PubMed Central
6. Saha, J, Chouhan, P. Lockdown and unlock for the COVID-19 pandemic and associated residential mobility in India. Int J Infect Dis 2021;104:382–9. https://doi.org/10.1016/j.ijid.2020.11.187. Epub 2020 Nov 27. PMID: 33253865.Suche in Google Scholar PubMed
7. WHO, UNICEF. Every newborn: an action plan to end preventable deaths. Geneva: World Health Organization; 2014. Available from: https://apps.who.int/iris/bitstream/handle/10665/127938/9789241507448_eng.pdf.Suche in Google Scholar
8. Hugh, O, Williams, M, Turner, S, Gardosi, J. Reduction of stillbirths in England from 2008 to 2017 according to uptake of the Growth Assessment Protocol: 10-year population-based cohort study. Ultrasound Obstet Gynecol 2021;57:401–8. https://doi.org/10.1002/uog.22187. PMID: 32851727.Suche in Google Scholar PubMed
9. Dong, E, Du, H, Gardner, L. An interactive web-based dashboard to track COVID-19 in real time. Lancet Infect Dis 2020;20:533–4. https://doi.org/10.1016/s1473-3099(20)30120-1. Available from: https://www.arcgis.com/apps/opsdashboard/index.html#/bda7594740fd40299423467b48e9ecf6.Suche in Google Scholar PubMed PubMed Central
10. De Filippo, O, D’Ascenzo, F, Angelini, F, Bocchino, PP, Conrotto, F, Saglietto, A, et al.. Reduced rate of hospital admissions for ACS during Covid-19 outbreak in Northern Italy. N Engl J Med 2020;383:88–9. https://doi.org/10.1056/NEJMc2009166.Suche in Google Scholar PubMed PubMed Central
11. Nieto-Calvache, AJ, Padilla, I, Tabares-Blanco, MF, López-Girón, MC, Vergara Galliadi, LM. Fear is the path to the dark side: unsafe delivery, one of the consequences of fear of the SARS-CoV-2 pandemic, A case report. Matern Fetal Med 2021;3:292–4. https://doi.org/10.1097/FM9.0000000000000112. PMID: 34697605; PMCID: PMC8529697.Suche in Google Scholar PubMed PubMed Central
12. Menendez, C, Gonzalez, R, Donnay, F, Leke, RGF. Avoiding indirect effects of COVID-19 on maternal and child health. Lancet Global Health 2020;8:e863–64. https://doi.org/10.1016/s2214-109x(20)30239-4.Suche in Google Scholar
13. Onyeaka, H, Anumudu, CK, Al-Sharify, ZT, Egele-Godswill, E, Mbaegbu, P. COVID-19 pandemic: a review of the global lockdown and its far-reaching effects. Sci Prog 2021;104:368504211019854. https://doi.org/10.1177/00368504211019854. PMID: 34061685.Suche in Google Scholar PubMed
14. Gardosi, J, Giddings, S, Buller, S, Southam, M, Williams, M. Preventing stillbirths through improved antenatal recognition of pregnancies at risk due to fetal growth restriction. Publ Health 2014;128:698–702. https://doi.org/10.1016/j.puhe.2014.06.022.Suche in Google Scholar PubMed
© 2022 Walter de Gruyter GmbH, Berlin/Boston
Artikel in diesem Heft
- Frontmatter
- Editorials
- Preventing stillbirth: risk factors, case reviews, care pathways
- Managing stillbirth: taking care to investigate the cause and provide care for bereaved families
- Epidemiology and Risk Factors
- Spatial dynamics of fetal mortality and the relationship with social vulnerability
- Stillbirth occurrence during COVID-19 pandemic: a population-based prospective study
- The effect of the Covid pandemic and lockdown on stillbirth rates in a South Indian perinatal centre
- Stillbirths preceded by reduced fetal movements are more frequently associated with placental insufficiency: a retrospective cohort study
- The prevalence of and risk factors for stillbirths in women with severe preeclampsia in a high-burden setting at Mpilo Central Hospital, Bulawayo, Zimbabwe
- Surveillance and Prevention
- Perinatal mortality audits and reporting of perinatal deaths: systematic review of outcomes and barriers
- Stillbirth diagnosis and classification: comparison of ReCoDe and ICD-PM systems
- Facility-based stillbirth surveillance review and response: an initiative towards reducing stillbirths in a tertiary care hospital of India
- Impact of introduction of the growth assessment protocol in a South Indian tertiary hospital on SGA detection, stillbirth rate and neonatal outcome
- Evaluating the Growth Assessment Protocol for stillbirth prevention: progress and challenges
- Prospective risk of stillbirth according to fetal size at term
- Understanding the Pathology of Stillbirth
- Placental findings in singleton stillbirths: a case-control study from a tertiary-care center in India
- Abnormal placental villous maturity and dysregulated glucose metabolism: implications for stillbirth prevention
- Comparison of prenatal central nervous system abnormalities with postmortem findings in fetuses following termination of pregnancy and clinical utility of postmortem examination
- Cardiac ion channels associated with unexplained stillbirth – an immunohistochemical study
- Viral infections in stillbirth: a contribution underestimated in Mexico?
- Audit and Bereavement Care
- Investigation and management of stillbirth: a descriptive review of major guidelines
- Delivery characteristics in pregnancies with stillbirth: a retrospective case-control study from a tertiary teaching hospital
- Perinatal bereavement care during COVID-19 in Australian maternity settings
- Beyond emotional support: predictors of satisfaction and perceived care quality following the death of a baby during pregnancy
- Stillbirth aftercare in a tertiary obstetric center – parents’ experiences