Spatial dynamics of fetal mortality and the relationship with social vulnerability
-
Myllena O. Silva
 ,
Vilma C. Macedo
,
Indianara M.B. Canuto
,
Mayara C. Silva
,
Heitor V.V. da Costa
and
Cristine V. do Bonfim
,
Vilma C. Macedo
,
Indianara M.B. Canuto
,
Mayara C. Silva
,
Heitor V.V. da Costa
and
Cristine V. do Bonfim


Abstract
Objectives
To analyze the spatial-temporal patterns of fetal mortality according to its relationship with social vulnerability, identifying priority areas for intervention.
Methods
Ecological study conducted in the state of Pernambuco, Northeast region of Brazil, from 2011 to 2018. The mean fetal mortality rate per city was calculated for the studied period. A cluster analysis was performed to select cities with homogeneous characteristics regarding fetal mortality and social vulnerability, then the Attribute Weighting Algorithm and Pearson correlation techniques were employed. In the spatial analysis it was used the local empirical Bayesian modeling and global and local Moran statistics.
Results
Twelve thousand nine hundred and twelve thousand fetal deaths were registered. The fetal mortality rate for the period was 11.44 fetal deaths per 1,000 births. The number of groups formed was 7, in which correlation was identified between fetal mortality and dimensions, highlighting the correlations between fetal mortality rate and the Index of Social Vulnerability urban infrastructure for the municipalities in group 1 and 5, the values of the correlations found were 0.478 and 0.674 respectively. The spatial analysis identified areas of higher risk for fetal mortality distributed in regions of medium, high and very high social vulnerability.
Conclusions
The study allowed observing the existing correlations between fetal mortality and social vulnerability and identifying priority areas for intervention, with a view to reducing fetal mortality in the state.
Introduction
Worldwide, it is estimated that 2.6 million fetal deaths occur annually, which are mostly preventable [1]. Fetal mortality is a serious and complex public health problem [2]. And although the rates have reduced, their progress is slower than that observed for neonatal and post-neonatal mortality [3].
Fetal mortality is an important health indicator for a population, as it reflects the maternal health situation, access to and quality of prenatal and intrapartum care [4]. It is used to estimate the risk of a fetus being born without any sign of life; being calculated through the number of fetal deaths per thousand total births in a population residing in a given geographic space [5].
Because of the several existing definitions of stillbirth, it is still difficult to measure them, leading to erroneous estimates, which make it difficult to plan public maternal and child health policies [6]. Another existing barrier in assessing the occurrence of stillbirths is the underreporting of fetal deaths [3].
In the pursuit of reducing the fetal mortality rate, the World Health Organization (WHO) and the United Nations Children’s Fund approved in 2014 the Every Newborn Action Plan [7]. Its main goal is to reach, by 2035, the target of 10 or less newborn deaths per 1,000 births in all countries, and to put an end to cases of preventable stillbirths [7].
Over the last few years, there is still a lack of research addressing the relationship between the occurrence of stillbirths and social determinants, a factor that must be taken into account when the objective is to reduce fetal mortality [8]. As stillbirths are more frequent in regions of socioeconomic vulnerability, where, for example, access to health services is ineffective and unequal [9]. Social deprivation indices may be used to assess living conditions [10].
Spatial analysis techniques may also be used in studies related to fetal mortality and social vulnerability [10]. Through spatial resources, it is possible to detect the distribution of stillbirths, favor the planning of health interventions, and allocation of services to priority areas [11].
This study may help to understand the dynamics of fetal mortality and social vulnerability. The objective is to analyze fetal mortality and verify its relationships with social vulnerability in geographic spaces.
Methods
This is an ecological study whose unit of analysis was the cities of the state of Pernambuco, which is in the Northeast region of Brazil, has a land area of 98,312 km2, and an estimated population of 9,557,071 million inhabitants in 2019 [12]. The state consists of 184 cities and the district of Fernando de Noronha and is divided into five mesoregions: São Francisco, Sertão, Agreste, Mata, and Metropolitan Area of Recife (Figure 1). The district of Fernando de Noronha was excluded from the analysis, as it does not have close neighbor cities, making it impossible to use the spatial analysis method, since the model takes into account information from adjacent cities.
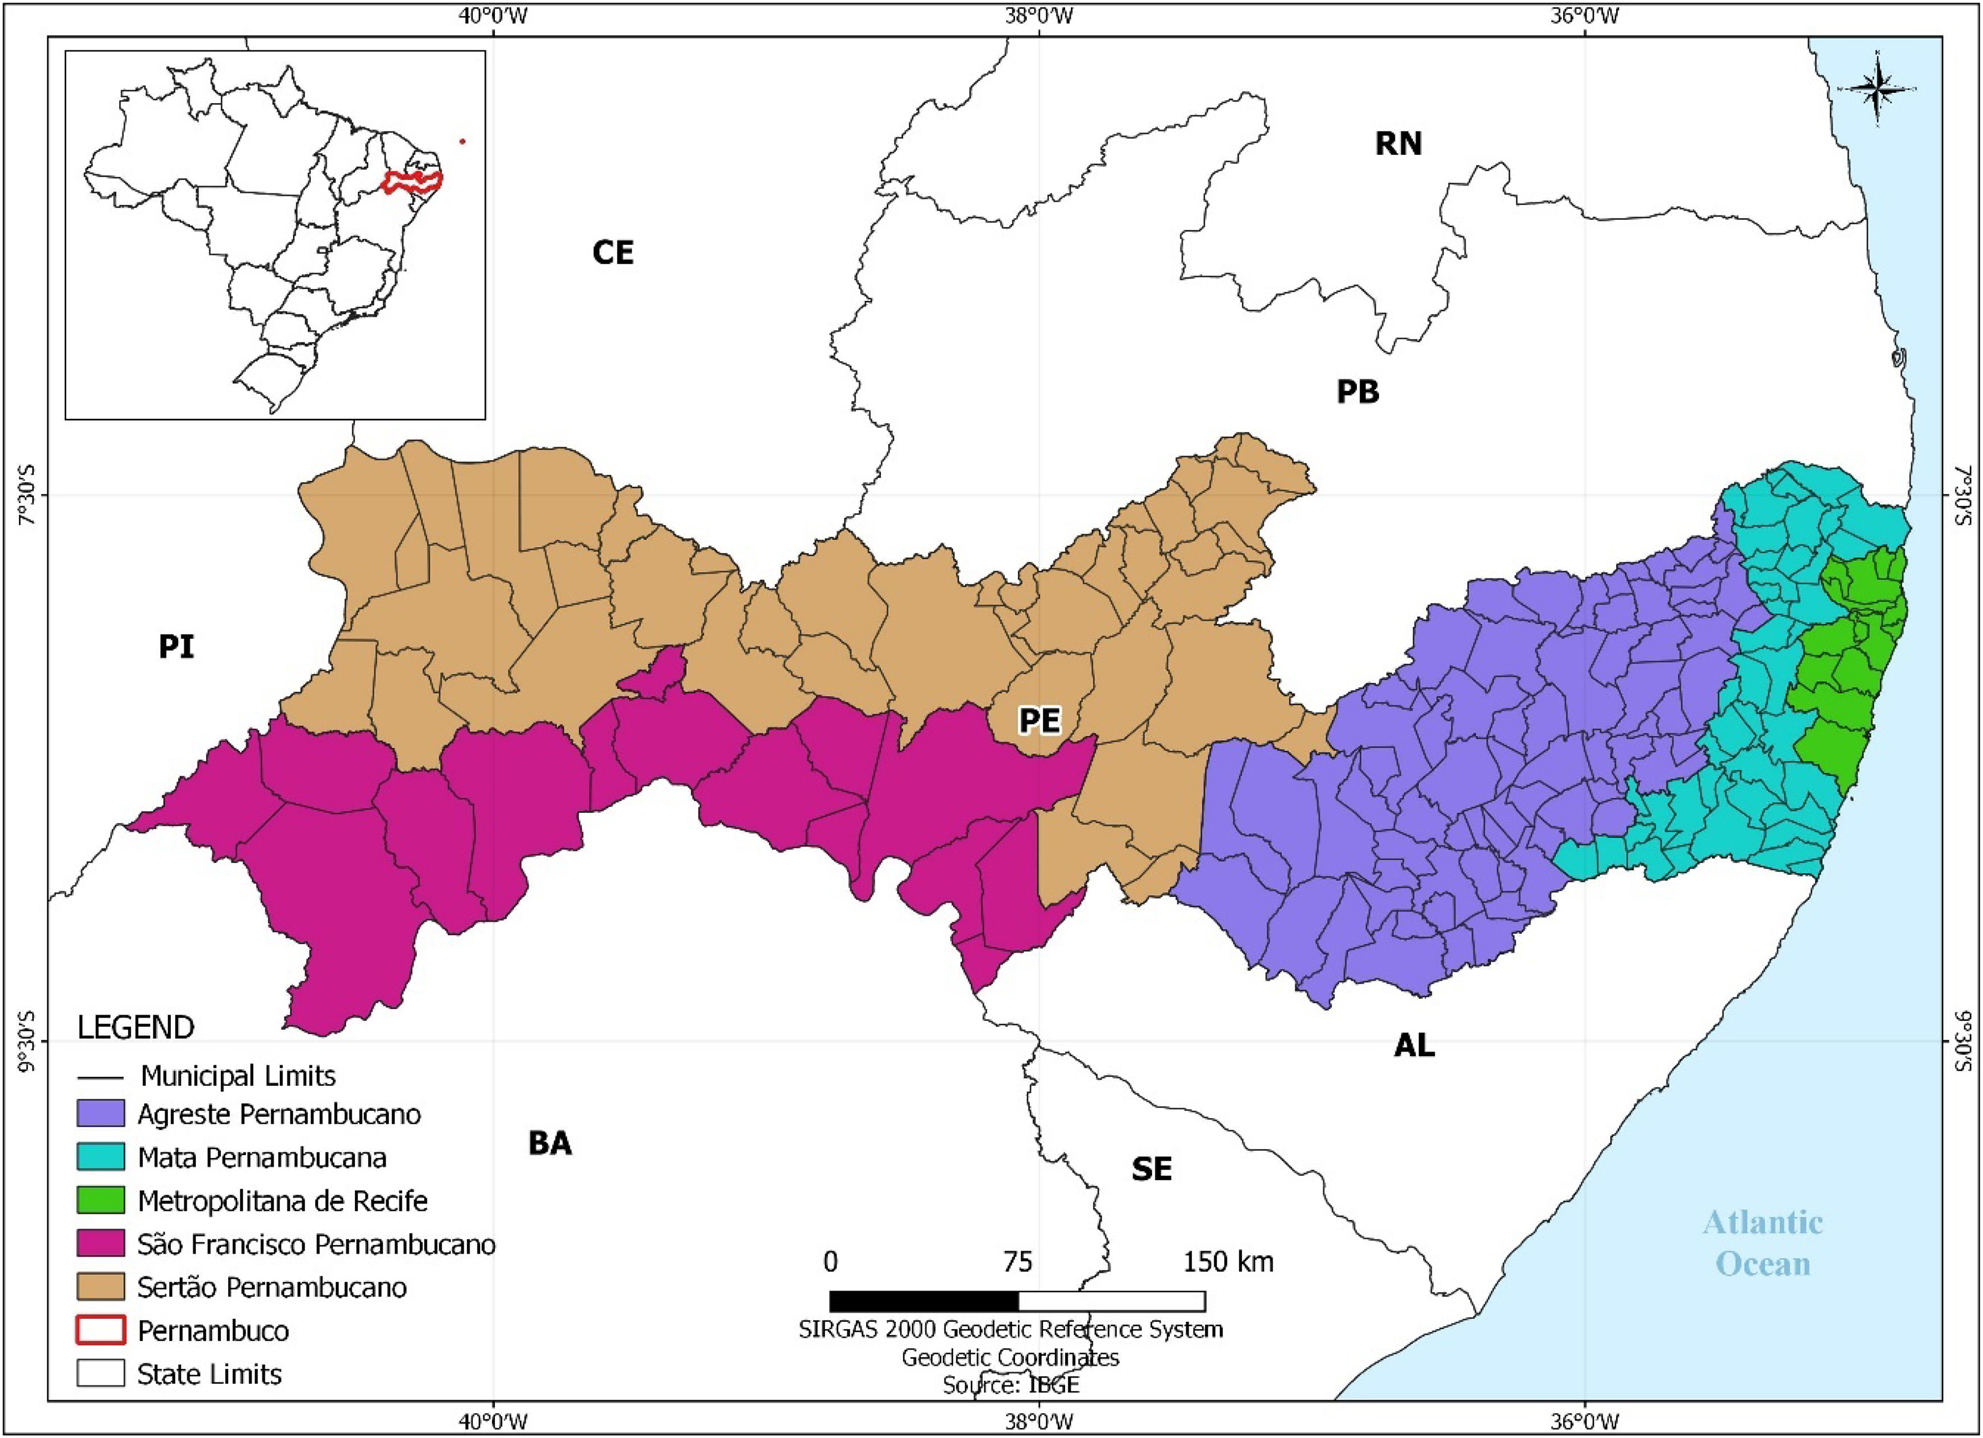
Distribution of mesoregions in the state of Pernambuco, Brazil.
The population consisted of fetal deaths of residents of the state that occurred from 2011 to 2018. This study used the following definition of stillbirth: fetal death as those occurring at or after 22 completed weeks of pregnancy, or 154 days, or a fetal weight of 500 g or more, or height of 25 cm or higher.
Data were sourced from the Mortality Information System (SIM), Live Birth Information System (Sinasc), and the Social Vulnerability Index (SVI), as provided by the Institute of Applied Economic Research – IPEA. Developed by the Ministry of Health, the SIM and Sinasc are national vital statistics systems that contribute to the characterization of birth and mortality conditions in the country [13]. The SIM is fed with information from Medical Certificates of Death (DO), while the Sinasc, from Certificates of Live Births (DNV); these instruments supply these systems with data that enable the calculation of health, epidemiological, and demographic indicators [14]. The availability of quality information enables the analysis of the health situation and planning of actions aiming at reducing mortality [15].
Data from the SIM and Sinasc were used to calculate fetal mortality rates by city. For this purpose, the number of fetal deaths was used, divided by total births (fetal deaths + live births) multiplied by 1,000. Thematic maps were also prepared to represent the distribution of the crude fetal mortality rate in the state.
To characterize the vulnerability conditions in the state, we used the Social Vulnerability Index (SVI) prepared by the Institute of Applied Economic Research – IPEA, which is composed of 16 indicators clustered into three factors as follows: “income and work”, which indicators are income of less than or equal to half the minimum wage, low income and dependents of elderly persons, unemployment, child labor, and formal occupation without primary and lower secondary education [16]. “Urban infrastructure” encompasses the following indicators: waste collection, inadequate water and sewage, and commuting time [16].
And “human capital” has the following indicators: infant mortality, children aged 0–5 out of school, people aged 6–14 out of school, young mothers aged 10–17, mothers without primary and lower secondary education with children up to 15 years old, illiteracy in people aged 15 or more, children in houses where no one has completed primary and lower secondary school, and people who neither study nor work and have low income [16].
The social vulnerability index was analyzed according to the following proposal: the higher the social vulnerability in a given territory, the greater the precariousness of the living conditions of the inhabiting population. Social vulnerability values are ranked in an ascending order and may be interpreted as follows: very low (0–0.200), low (0.201–0.300), medium (0.301–0.400), high (0.401–0.500) and very high (0.501–1.000) social vulnerability [16].
In order to identify the relationship between fetal mortality rate and SVI, a cluster analysis was carried out and aimed to select clusters of cities with homogeneous characteristics, and from this segmentation, we applied the Attribute Weighting Algorithm (AWA) technique [17]. This technique finds clusters in subspaces, where the variance of attributes is usually smaller per cluster. Thus, if the variance of some attributes is smaller, there is a tendency to form much more homogeneous clusters. The number of clusters was chosen using the Elbow chart.
After estimating the clusters, the Pearson correlation was calculated for each cluster. Cluster analysis was performed using the three SVI factors and the average fetal mortality rate; all calculations and graphs were made using the R language version 4.0.3. The significance level of the tests was set at 5%. Thematic maps were drawn up using the program QGis®, version 2.14.3, to spatially identify the cities belonging to each cluster.
For spatial analysis, local Bayesian estimators were applied to smooth out the more unstable rates and provide stability to the model. Based on smoothed rates, the Moran Index was used to detect clusters of areas at risk for fetal mortality. The variation occurs between −1 (inverse correlation) and +1 (direct correlation). Results close to zero evidence the absence of significant spatial autocorrelation in neighboring areas [18].
The identification of critical areas using the Moran scatterplot made it possible to compare the value for each city studied with neighboring cities and notice spatial patterns. The quadrants generated by the scatterplot allowed us to classify the cities into quadrants Q1 (positive values, positive averages for neighboring cities), Q2 (negative values, negative averages for neighboring cities), Q3 (positive values, negative averages for neighboring cities), and Q4 (negative values, positive averages for neighboring cities), and were represented by the Box Map [19].
Then we prepared the Moran Map, which considers the areas with a positive spatial relationship, identified from the Box Map, with spatial significance of less than 5%. Cities belonging to class Q1 (high-high) were deemed to be critical areas. Quadrant Q2 (low-low) indicates areas with a low level of mortality and quadrants Q3 (high-low) and Q4 (low-high) are transition areas. The spatial analysis was performed using the programs TerraView 4.2.2 and QGIS 3.14.1.
In this study, we used secondary data from public domain information systems, in which it is not possible to identify individuals. For this reason, the authorization of the Ethics and Research Committee was not required.
Results
Twelve thousand nine hundred and twelve fetal deaths were reported from 2011 to 2018 in the state of Pernambuco. The fetal mortality rate for the period analyzed was 11.44 fetal deaths per 1,000 births. A cluster analysis was performed to verify the relationship between stillbirths and the SVI.
The result of this analysis is represented in the Elbow chart (Supplementary Material, Figure 1), where seven clusters of cities with homogeneous characteristics were formed, as, for this quantity, the residual sum of squares is smaller and an inflection point of the curve.
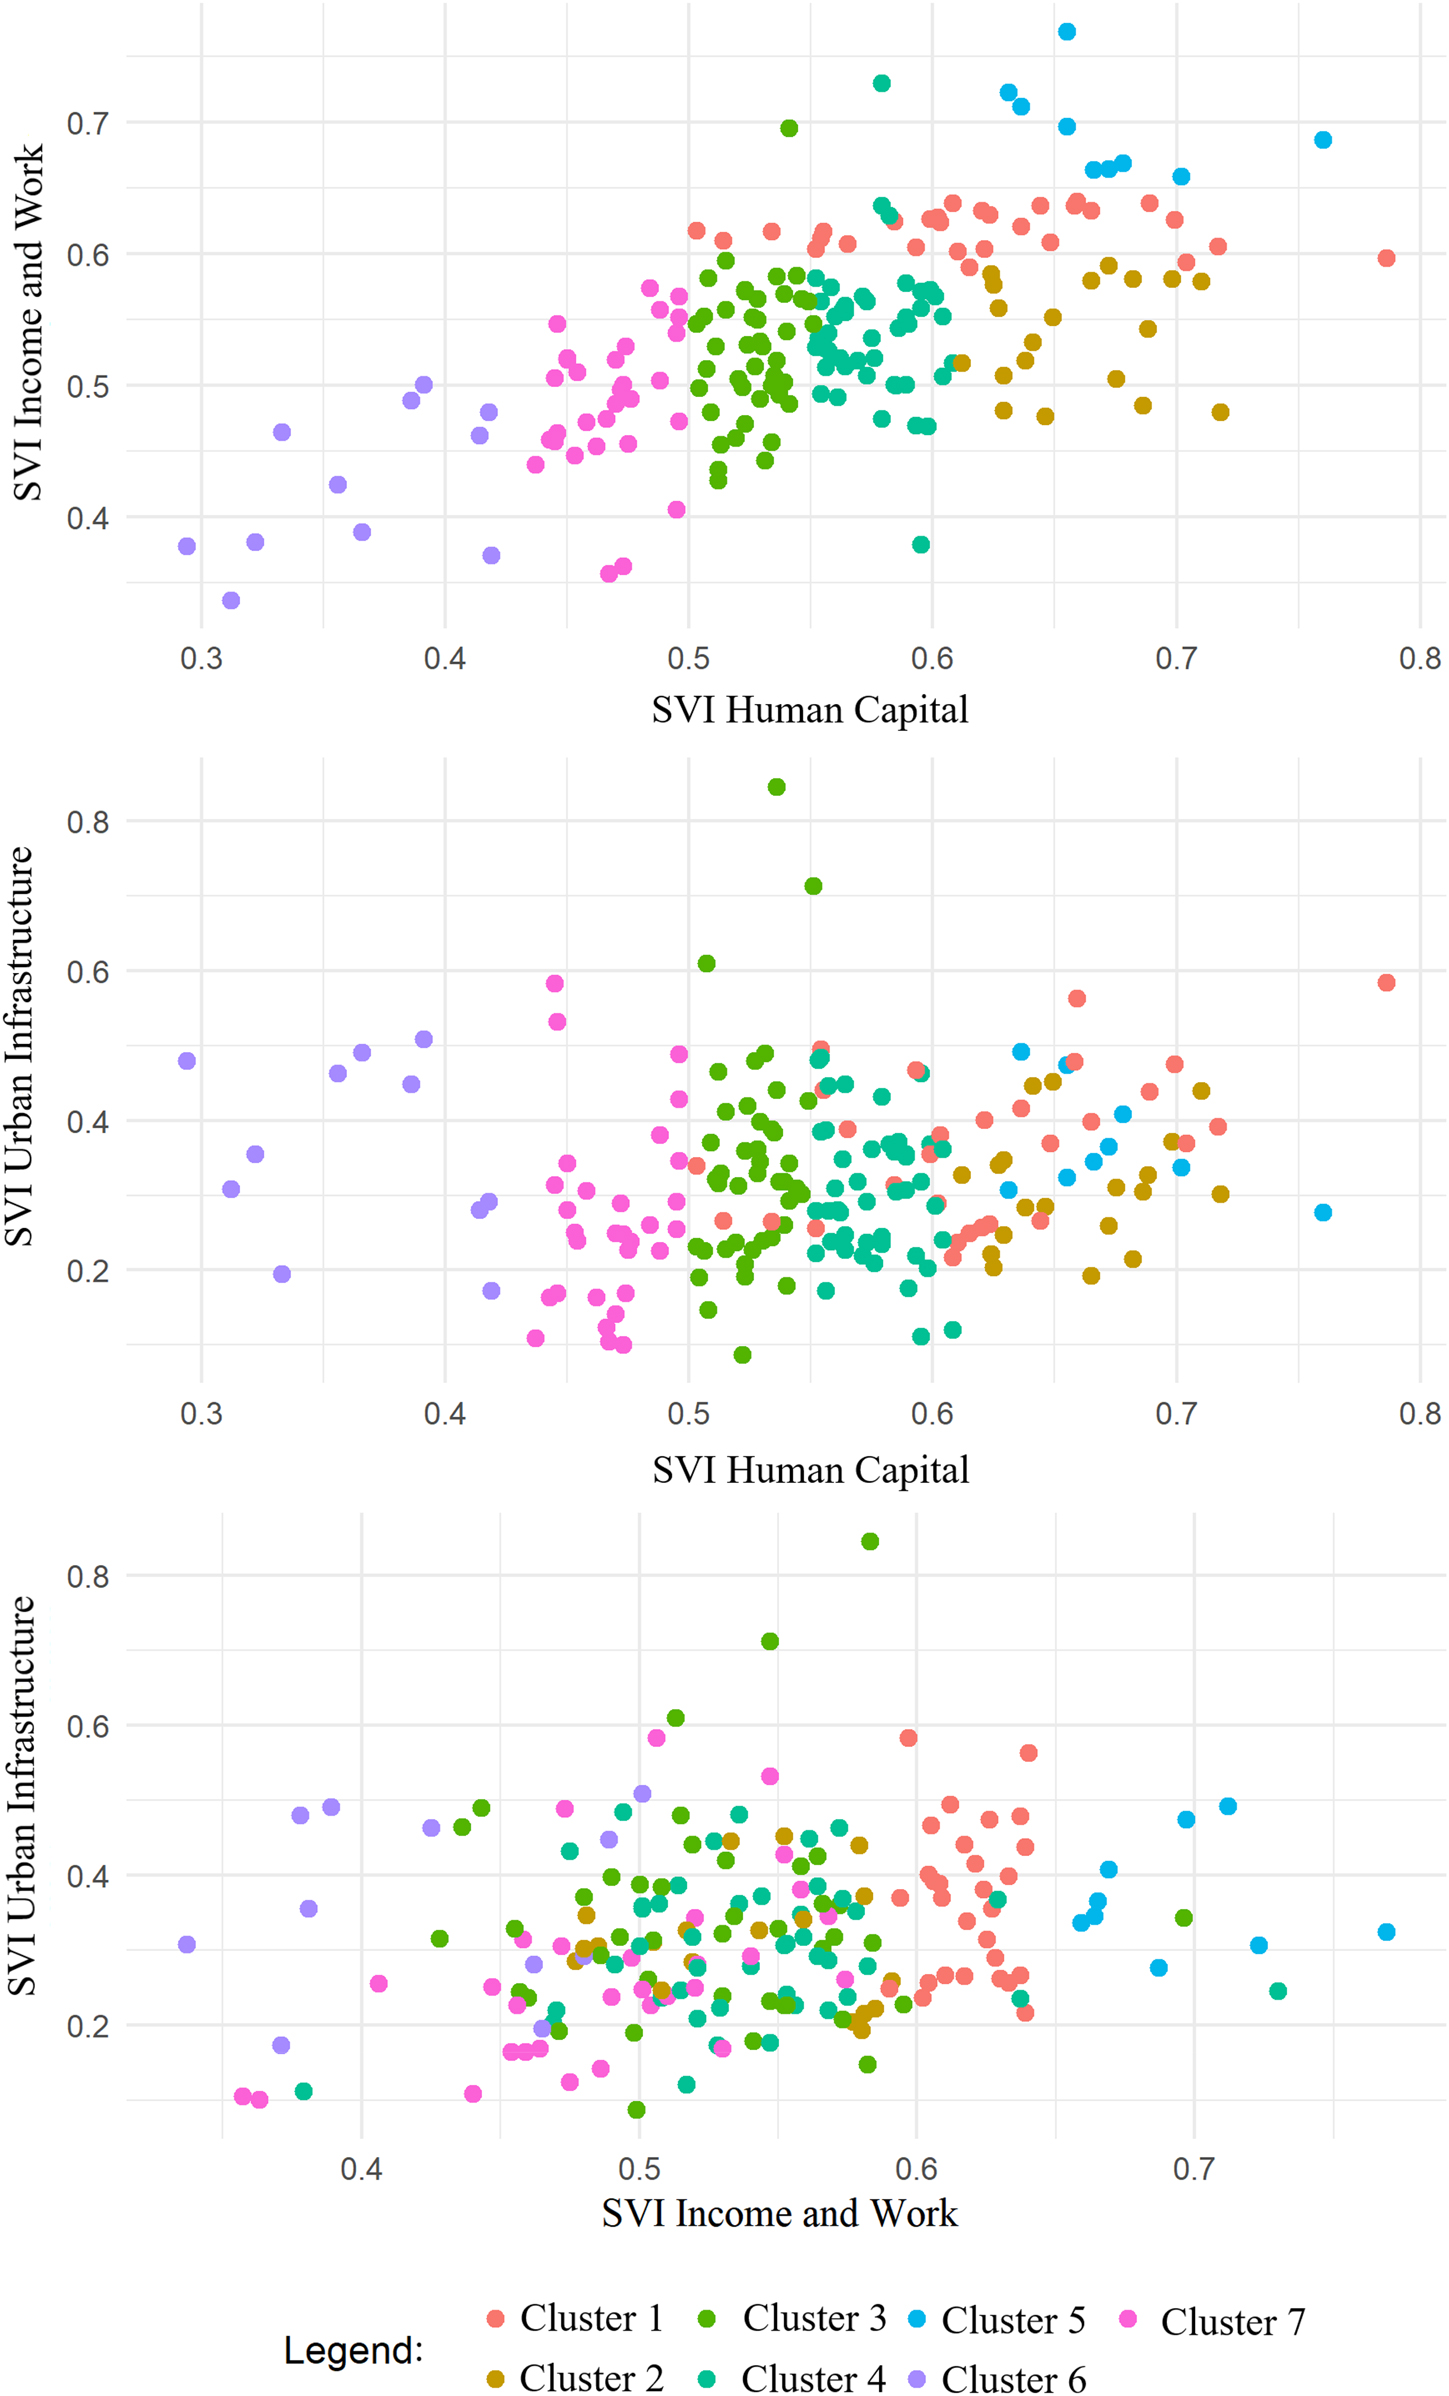
After choosing the number of clusters to be generated, the AWA algorithm was applied, resulting in the associations whose characteristics are displayed in Table 1. The illustration of the clustering is clearer when we analyze Figure 2, which shows the sets of cities generated by pairing the SVI factors. It is possible to note that the variables with the greatest influence are “Human Capital” and “Income and Work”, as the values for these factors by cluster varied less in comparison with the SVI Urban Infrastructure. The striking characteristics of each cluster presented in Table 1 are:
Cluster 1: similar SVI Income and Work (smallest range of all clusters, 0.05 points) and an average factor 14% higher than the general average.
Cluster 2: SVI Human Capital with a range of 0.11 points, where the average is 18% higher than the general average.
Cluster 3: SVI Human Capital with the smallest range (range 0.05 points), the values, however, are close to the general average.
Cluster 4: SVI Human Capital with a small range (0.06 points) and values close to the general average.
Cluster 5: It is the cluster that presents the highest average values for the SVI Human Capital and SVI Income and Work, with averages 28% and 21% higher than the general average and ranges of 0.11 and 0.13 points, respectively.
Cluster 6: It is the cluster that presents the lowest average values for the SVI Human Capital and SVI Income and Work, with averages 22% and 35% lower than the general average and ranges of 0.16 and 0.13 points, respectively.
Cluster 7: It presents average values for the SVI Human Capital and SVI Income and Work, with averages of 10% and 16% lower than the general average and ranges of 0.22 and 0.06 points, respectively.
Result of the cluster analysis of cities with homogeneous characteristics.
| Clusters | SVI urban infrastructure | SVI human capital | SVI income and work | Fetal mortality ratea | ||||||||
|---|---|---|---|---|---|---|---|---|---|---|---|---|
| Min. | Avg. | Max. | Min. | Avg. | Max. | Min. | Avg. | Max. | Min. | Avg. | Max. | |
| Cluster 1 | 0.22 | 0.37 | 0.58 | 0.50 | 0.62 | 0.79 | 0.59 | 0.62 | 0.64 | 7.63 | 13.08 | 20.20 |
| Cluster 2 | 0.19 | 0.31 | 0.45 | 0.61 | 0.66 | 0.72 | 0.48 | 0.54 | 0.59 | 7.58 | 12.70 | 21.58 |
| Cluster 3 | 0.09 | 0.34 | 0.85 | 0.50 | 0.53 | 0.55 | 0.43 | 0.53 | 0.70 | 6.10 | 11.90 | 20.79 |
| Cluster 4 | 0.11 | 0.30 | 0.48 | 0.55 | 0.58 | 0.61 | 0.38 | 0.54 | 0.73 | 5.68 | 12.69 | 18.39 |
| Cluster 5 | 0.28 | 0.37 | 0.49 | 0.63 | 0.67 | 0.76 | 0.66 | 0.69 | 0.77 | 9.10 | 15.00 | 20.96 |
| Cluster 6 | 0.17 | 0.36 | 0.51 | 0.29 | 0.36 | 0.42 | 0.34 | 0.43 | 0.50 | 9.50 | 10.62 | 12.85 |
| Cluster 7 | 0.10 | 0.27 | 0.58 | 0.44 | 0.47 | 0.50 | 0.36 | 0.49 | 0.57 | 9.39 | 12.58 | 18.74 |
|
|
||||||||||||
| General | 0.09 | 0.32 | 0.85 | 0.29 | 0.55 | 0.79 | 0.34 | 0.54 | 0.77 | 5.68 | 12.54 | 21.58 |
-
aRefers to the average FMR during the study period (2011–2018).
Result of the city cluster analysis.
Table 2 shows the correlation coefficients between the SVI factors and the FMR, where the correlations between the FMR and SVI Urban Infrastructure stand out for cluster 5 (with the highest SVI Income and Work and Human Capital) and between the FMR and SVI Human Capital for cluster 1 (with the second highest average for SVI Income and Work), being respectively 0.674 p=0.047 (moderate positive correlation and statistically significant p-value) and 0.478 p=0.009 (low positive correlation and statistically significant p-value) [20]. Thus it’s observed the presence of a very significant correlation for both. For cluster 5, for every 0.01 point of SVI Urban Infrastructure, the FMR tends to increase by 0.32. For cluster 1, for every 0.01 points of Human Capital SVI, the FMR tends to increase by 0.26.
Analysis of correlation between the dimensions of the SVI and the fetal mortality rate for the generated clusters and all cities in general.
| Clusters | FMR vs. SVI urban infrastructure | FMR vs. SVI income and work | FMR vs. SVI human capital | |||
|---|---|---|---|---|---|---|
| Correlation | p-Value | Correlation | p-Value | Correlation | p-Value | |
| Cluster 1 | 0.312 | 0.099 | 0.151 | 0.433 | 0.478 | 0.009 |
| Cluster 2 | −0.053 | 0.829 | 0.026 | 0.917 | −0.260 | 0.282 |
| Cluster 3 | −0.068 | 0.671 | −0.021 | 0.897 | 0.193 | 0.221 |
| Cluster 4 | −0.121 | 0.434 | −0.107 | 0.491 | −0.110 | 0.478 |
| Cluster 5 | 0.674 | 0.047 | −0.059 | 0.880 | −0.200 | 0.606 |
| Cluster 6 | −0.497 | 0.120 | 0.431 | 0.186 | 0.251 | 0.457 |
| Cluster 7 | −0.036 | 0.852 | 0.305 | 0.101 | −0.105 | 0.581 |
|
|
||||||
| General | 0.014 | 0.851 | 0.197 | 0.007 | 0.229 | 0.002 |
There is also a general correlation with p-value between FMR and SVI Income and Work and FMR and SVI Human Capital, showing respectively p=0.007 and p=0.002, and correlations of 0.229 and 0.197 (insignificant correlations) [20].
In Figure 3A, it is possible to view the distributions of cities in the state according to the clusters formed in the cluster analysis. Attention is drawn to cluster 1, which is distributed in the mesoregions of São Francisco, Sertão, Agreste, and Mata. And cluster 5, which focused more in the Agreste region, as these were the clusters with the highest correlation between the FMR and SVI Urban Infrastructure, as seen in Table 2.
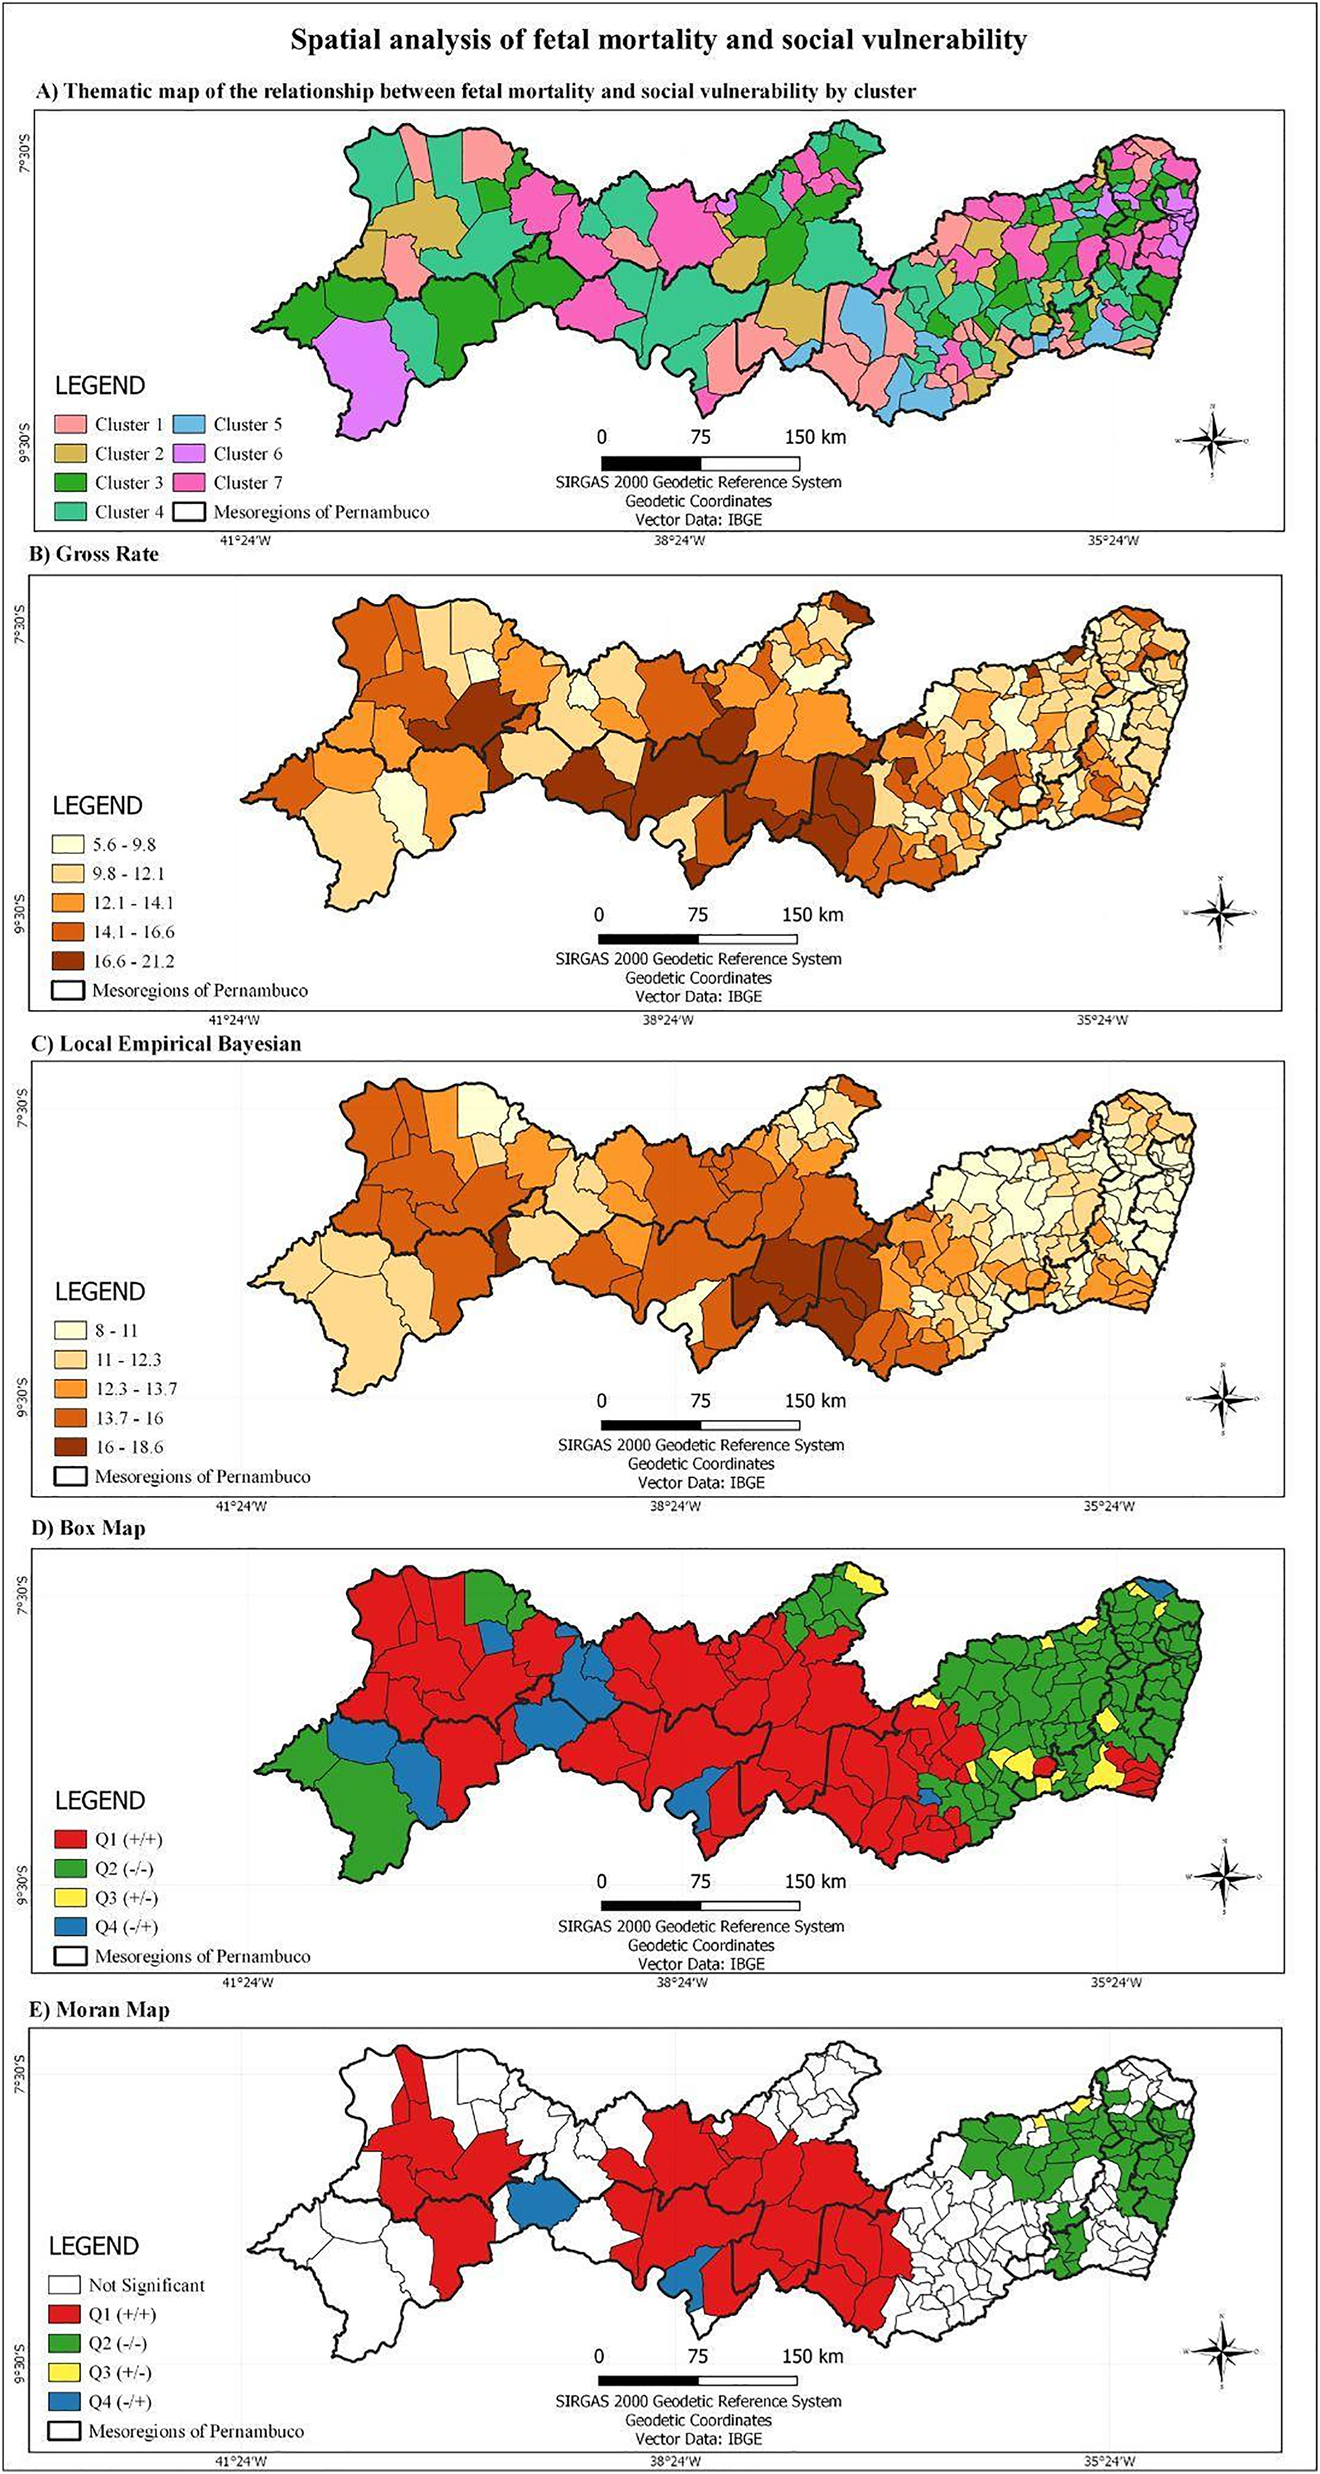
Spatial analysis of fetal mortality and social vulnerability.
(A) Thematic map of the relationships between fetal mortality and social vulnerability by cluster; (B) thematic map of fetal mortality rate; (C) thematic map of Bayesian fetal mortality rate; (D) box map of Bayesian fetal mortality rate; (E) Moran’s map of Bayesian fetal mortality rate. Pernambuco, 2011–2018.
Of the 184 cities in the state, 19 (10.32%) showed a high fetal mortality rate (Figure 3B) in the period 2011–2018, located mainly in the mesoregions of Sertão, Agreste, and São Francisco Pernambuco. After rate correction by the Bayesian model (Figure 3C), eight cities (4.35%) showed a high fetal mortality rate, also concentrated in the aforementioned mesoregions.
The global Moran’s index of smoothed rates for the fetal mortality variable in the analyzed period was 0.665 (p=0.01). In the Chart Map (Figure 3D), we identified three clusters located in Q1, totaling 59 cities (32.96%), and located mainly in the Sertão, Agreste and São Francisco. In the Moran Map (Figure 3E), two clusters were identified as priority for fetal mortality, totaling 27 cities (14.67%), and being arranged in the mesoregions of Sertão (17 cities), Agreste (5 cities) and São Francisco (5 cities).
Discussion
The fetal mortality rate detected in the state of Pernambuco was higher than that of Brazil (9.5 fetal deaths per 1,000 births) and lower than that of the Northeast region (12.0 fetal deaths per 1,000 births) [21]. Which is among the regions that have the highest stillbirth rates in the country, associated with increased social vulnerability [22]. And shows the worst social indicators among the five Brazilian macro-regions [23].
The results found a correlation between the occurrence of stillbirths and social vulnerability. It can be noticed that, in the cluster analysis between fetal mortality and the strata of the social vulnerability index, the cluster that presented the highest average SVI Human Capital and SVI Income and Work (cluster 5) was the same where the highest average fetal mortality rate and the most significant correlation between stillbirths and the SVI Urban Infrastructure were identified. This cluster predominates in the agreste mesoregion, which presents a high index of social deprivation. And it is pointed out that situations of social need related to working conditions, infrastructure, and education are directly linked to the increase in fetal mortality [24].
Increased stillbirths in clusters 1 and 5 were related to the SVI urban infrastructure and SVI human capital, which, among their indicators, cover sanitation conditions and low education or illiteracy, respectively. The clusters of cities with the highest correlation between fetal mortality and the SVI were distributed in areas with high rates of social need, cities at risk for fetal mortality and social need, as well as low or medium municipal HDI, which allows assessing the income, health and education conditions of these places [24, 25].
Two high priority clusters for intervention were identified through the spatial analysis of fetal mortality, corresponding to places that had high rates of stillbirths and need to be prioritized in health actions. These clusters are located in areas of high social deprivation and that present medium, high and very high social vulnerability [24].
Marked social differences are found in Pernambuco, as, in 2010, it had one of the lowest human development indices (HDI) in the country, ranking 19th with an HDI equal to 0.673 [25]. Although increases related to income and education have been observed in recent years, social vulnerability continues to show significant values in the state [26].
The findings of this study are similar to what was listed by an analysis performed in Spain, which found a fetal mortality rate three times higher among women from countries with low HDI and low education [27]. A higher risk for fetal mortality is also identified, especially among black, low-income women, living in rural areas or disadvantaged communities and who use illicit drugs [28], [29], [30], [31].
Given the results of this analysis, it is pointed out that addressing social vulnerability is a way to reduce stillbirths [30]. Improvements in the care provided by maternal and child health services, proper care during pregnancy and labor, adherence to prenatal care, and guaranteed access to health services may also contribute to the reduction of fetal mortality [32], [33], [34].
The research was based on the SIM and Sinasc records and has the following limitations: issues inherent in the use of secondary data, regarding underreporting of fetal deaths, which may contribute to the underestimation of the fetal mortality rate. And using the city as a unit of analysis is also a problem, as it can hide internal inequalities.
Final considerations
This study allowed to observe the correlation between fetal mortality and social vulnerability. The results of this study highlight that fetal mortality is still a health problem in the state and is concentrated mainly in areas of social vulnerability. The application of spatial analysis allowed the localization of these areas, which enables the targeting and development of public policies aimed at reducing fetal mortality in the identified areas.
-
Research funding: National Council for Scientific and Technological Development Scientific Initiation Scholarship.
-
Author contributions: All authors have accepted responsibility for the entire content of this manuscript and approved its submission.
-
Competing interests: Authors state no conflict of interest.
-
Informed consent: Not applicable.
-
Ethical approval: Not applicable.
References
1. Blencowe, H, Cousens, S, Jassir, FB, Say, L, Chou, D, Mathers, C, et al.. National, regional, and worldwide estimates of stillbirth rates in 2015, with trends from 2000: a systematic analysis. Lancet Glob Health 2016;4:E98–108. https://doi.org/10.1016/S2214-109X(15)00275-2.Search in Google Scholar PubMed
2. Egbe, TO, Ewane, EN, Tendongfor, N. Stillbirth rates and associated risk factors at the Buea and Limbe regional hospitals, Cameroon: a case-control study. BMC Pregnancy Childbirth 2020;20:1–8. https://doi.org/10.1186/s12884-020-2767-8.Search in Google Scholar PubMed PubMed Central
3. Lawn, JE, Blencowe, H, Waiswa, P, Amouzou, A, Mathers, C, Hogan, D, et al.. Stillbirths: rates, risk factors, and acceleration towards 2030. Lancet 2016;387:587–603. https://doi.org/10.1016/S0140-6736(15)00837-5.Search in Google Scholar PubMed
4. Tasew, H, Zemicheal, M, Teklay, G, Mariye, T. Risk factors of stillbirth among mothers delivered in public hospitals of Central Zone, Tigray, Ethiopia. Afr Health Sci 2019;19:1930–7. https://doi.org/10.4314/ahs.v19i2.16.Search in Google Scholar PubMed PubMed Central
5. Brasil. Ministério da saúde. Manual de vigilância do óbito infantil e fetal e do Comitê de Prevenção do Óbito Infantil e Fetal. Secretaria de Vigilância em Saúde. Secretaria de Atenção à Saúde, 2nd ed. Brasília, BR: Ministerio da saúde; 2009. Available from: https://bvsms.saude.gov.br/bvs/publicacoes/manual_obito_infantil_fetal_2ed.pdf.Search in Google Scholar
6. Connolly, M, Phung, L, Farrington, E, Scoullar, MJ, Wilson, AN, Comrie-Thomson, L, et al.. Defining preterm birth and stillbirth in the Western Pacific: a systematic review. Asia Pac J Publ Health 2021;24:10105395211026099. https://doi.org/10.1177/10105395211026099.Search in Google Scholar PubMed
7. WHO. Every newborn: an action plan to end preventable deaths; 2014. Available from: https://apps.who.int/iris/bitstream/handle/10665/127938/9789241507448_eng.pdf [Accessed 04 Apr 2020].Search in Google Scholar
8. Adeyinka, DA, Olakunde, BO, Muhajarine, N. Evidence of health inequity in child survival: spatial and Bayesian network analyses of stillbirth rates in 194 countries. Sci Rep 2019;9:1–11. https://doi.org/10.1038/s41598-019-56326-w.Search in Google Scholar PubMed PubMed Central
9. Tesema, GA, Gezie, LD, Nigatu, SG. Trends of stillbirth among reproductive-age women in Ethiopia based on Ethiopian demographic and health surveys: a multivariate decomposition analysis. BMC Pregnancy Childbirth 2020;20:1–11. https://doi.org/10.1186/s12884-020-02880-5.Search in Google Scholar PubMed PubMed Central
10. Loiacono, KV. Evolución de la mortalidad fetal, inmersa en las desigualdades socioeconómicas de la República Argentina: Período 2007–2014. Arch Argent Pediatr 2018;116:e567–74. https://doi.org/10.5546/aap.2018.eng.e567.Search in Google Scholar PubMed
11. Zahrieh, D, Oleson, JJ, Romitti, PA. Bayesian point process modeling to quantify geographic regions of excess stillbirth risk. Geogr Anal 2019;51:381–400. https://doi.org/10.1111/gean.12174.Search in Google Scholar
12. Brasil. Ministério do Planejamento, Orçamento e Gestão. Instituto Brasileiro de Geografia e Estatística. Cidades e Estados. Pernambuco [online]. Rio de Janeiro: IBGE; 2019. Available from: https://www.ibge.gov.br/cidades-e-estados/pe.html [Acessed 04 Aug 2021].Search in Google Scholar
13. Szwarcwald, CL, Leal, MD, Esteves-Pereira, AP, Almeida, WD, Frias, PG, Damacena, GN, et al.. Evaluation of data from the Brazilian Information System on live births (SINASC). Cad Saúde Pública 2019;35. https://doi.org/10.1590/0102-311X00214918.Search in Google Scholar PubMed
14. Szwarcwald, CL, de Frias, PG, Júnior, PR, de Almeida, WD, de Morais Neto, OL. Correction of vital statistics based on a proactive search of deaths and live births: evidence from a study of the North and Northeast regions of Brazil. Popul Health Metrics 2014;12:1–10. https://doi.org/10.1186/1478-7954-12-16.Search in Google Scholar PubMed PubMed Central
15. Marques, LJ, Oliveira, CM, Bonfim, CV. Assessing the completeness and agreement of variables of the information systems on live births and on mortality in Recife-PE, Brazil, 2010–2012. Epidemiol Servi Saúde 2016;25:849–54. https://doi.org/10.5123/S1679-49742016000400019.Search in Google Scholar PubMed
16. IPEA. Plataforma do Atlas da Vulnerabilidade Social. Instituto de pesquisa econômica aplicada (IPEA); 2017. Available from: http://ivs.ipea.gov.br/index.php/pt/sobre/ [Accessed 1 Apr 2020].Search in Google Scholar
17. Chan, EY, Ching, WK, Ng, MK, Huang, JZ. An optimization algorithm for clustering using weighted dissimilarity measures. Pattern Recogn 2004;37:943–52. https://doi.org/10.1016/j.patcog.2003.11.003.Search in Google Scholar
18. Luzardo, AJ, Castañeda Filho, RM, Rubim, IB. Análise espacial exploratória com o emprego do Índice de Moran. Geographia 2017;19:161–79. https://doi.org/10.22409/GEOgraphia2017.v19i40.a13807.Search in Google Scholar
19. Lima, KJ, Chaves, CS, Gomes, EO, Lima, MA, Candeira, EC, Teófilo, FK, et al.. Health situation analysis: fetal mortality in the 10th health region of Ceará. RBPS 2017;30:7–30. https://doi.org/10.5020/18061230.2017.p30.Search in Google Scholar
20. Mukaka, M. Statistics corner: a guide to appropriate use of correlation in medical research. Malawi Med J 2012;24:69–71.Search in Google Scholar
21. Barros, PS, Aquino, ÉC, Souza, MR. Fetal mortality and the challenges for women’s health care in Brazil. Rev Saude Publica 2019;53:12. https://doi.org/10.11606/S1518-8787.2019053000714.Search in Google Scholar PubMed PubMed Central
22. Carvalho, TS, Pellanda, LC, Doye, P. Stillbirth prevalence in Brazil: an exploration of regional differences. J Pediatr 2018;94:200–6. https://doi.org/10.1016/j.jped.2017.05.006.Search in Google Scholar PubMed
23. Hissa-Texeira, K. Uma análise da estrutura espacial dos indicadores socioeconômicos do nordeste brasileiro (2000–2010). Eure 2018;44:101–24. https://doi.org/10.4067/S0250-71612018000100101.Search in Google Scholar
24. Canuto, IM, Macêdo, VC, Frias, PG, Oliveira, CM, Costa, HV, Portugal, JL, et al.. Spatial patterns of avoidable fetal mortality and social deprivation. Rev Bras Epidemiol 2021;24. https://doi.org/10.1590/1980-549720210007.supl.1.Search in Google Scholar PubMed
25. Programa das Nações Unidas para o Desenvolvimento, Instituto de Pesquisa Econômica Aplicada, Fundação João Pinheiro. Atlas do desenvolvimento humano no Brasil [online]. Rio de Brasília: PNUD; 2020. Available from: http://atlasbrasil.org.br/ranking [Accessed 22 Aug 2021].Search in Google Scholar
26. Julião, CC, De Lima, JE. Índice de Vulnerabilidade Social: uma aplicação de análise fatorial para classificar os municípios pernambucanos. Planej Polít Públicas 2020;54. https://doi.org/10.38116/ppp54art01.Search in Google Scholar
27. Luque-Fernandez, MA, Thomas, A, Gelaye, B, Racape, J, Sanchez, MJ, Williams, MA. Secular trends in stillbirth by maternal socioeconomic status in Spain 2007–15: a population-based study of 4 million births. Eur J Public Health 2019;29:1043–8. https://doi.org/10.1093/eurpub/ckz086.Search in Google Scholar PubMed PubMed Central
28. Altijani, N, Carson, C, Choudhury, SS, Rani, A, Sarma, UC, Knight, M, et al.. Stillbirth among women in nine states in India: rate and risk factors in study of 886,505 women from the annual health survey. BMJ Open 2018;8:e022583. https://doi.org/10.1136/bmjopen-2018-022583.Search in Google Scholar PubMed PubMed Central
29. Menezes, AM, Barros, FC, Horta, BL, Matijasevich, A, Bertoldi, AD, Oliveira, PD, et al.. Stillbirth, newborn and infant mortality: trends and inequalities in four population-based birth cohorts in Pelotas, Brazil, 1982–2015. Int J Epidemiol 2019;48:i54–62. https://doi.org/10.1093/ije/dyy129.Search in Google Scholar PubMed PubMed Central
30. Kingdon, C, Roberts, D, Turner, MA, Storey, C, Crossland, N, Finlayson, KW, et al.. Inequalities and stillbirth in the UK: a meta-narrative review. BMJ Open 2019;9:e029672. https://doi.org/10.1136/bmjopen-2019-029672.Search in Google Scholar PubMed PubMed Central
31. Jaiman, S, Romero, R, Pacora, P, Jung, E, Bhatti, G, Yeo, L, et al.. Disorders of placental villous maturation in fetal death. J Perinat Med 2020;48:345–68. https://doi.org/10.1515/jpm-2020-0030.Search in Google Scholar PubMed PubMed Central
32. Reinebrant, HE, Leisher, SH, Coory, M, Henry, S, Wojcieszek, AM, Gardener, G, et al.. Making stillbirths visible: a systematic review of globally reported causes of stillbirth. BJOG 2018;125:212–24. https://doi.org/10.1111/1471-0528.14971.Search in Google Scholar PubMed
33. Qu, Y, Chen, S, Pan, H, Zhu, H, Yan, C, Zhang, S, et al.. Risk factors of stillbirth in rural China: a national cohort study. Sci Rep 2019;9:1–8. https://doi.org/10.1038/s41598-018-35931-1.Search in Google Scholar PubMed PubMed Central
34. Khalili, N, Heidarzadeh, M, Habibelahi, A, Tayefi, B, Ramezani, M, Rampisheh, Z, et al.. Stillbirth in Iran and associated factors (2014–2016): a population-based study. Med J Islam Repub Iran 2020;34:38.10.47176/mjiri.34.38Search in Google Scholar
Supplementary Material
The online version of this article offers supplementary material (https://doi.org/10.1515/jpm-2021-0444).
© 2021 Walter de Gruyter GmbH, Berlin/Boston
Articles in the same Issue
- Frontmatter
- Editorials
- Preventing stillbirth: risk factors, case reviews, care pathways
- Managing stillbirth: taking care to investigate the cause and provide care for bereaved families
- Epidemiology and Risk Factors
- Spatial dynamics of fetal mortality and the relationship with social vulnerability
- Stillbirth occurrence during COVID-19 pandemic: a population-based prospective study
- The effect of the Covid pandemic and lockdown on stillbirth rates in a South Indian perinatal centre
- Stillbirths preceded by reduced fetal movements are more frequently associated with placental insufficiency: a retrospective cohort study
- The prevalence of and risk factors for stillbirths in women with severe preeclampsia in a high-burden setting at Mpilo Central Hospital, Bulawayo, Zimbabwe
- Surveillance and Prevention
- Perinatal mortality audits and reporting of perinatal deaths: systematic review of outcomes and barriers
- Stillbirth diagnosis and classification: comparison of ReCoDe and ICD-PM systems
- Facility-based stillbirth surveillance review and response: an initiative towards reducing stillbirths in a tertiary care hospital of India
- Impact of introduction of the growth assessment protocol in a South Indian tertiary hospital on SGA detection, stillbirth rate and neonatal outcome
- Evaluating the Growth Assessment Protocol for stillbirth prevention: progress and challenges
- Prospective risk of stillbirth according to fetal size at term
- Understanding the Pathology of Stillbirth
- Placental findings in singleton stillbirths: a case-control study from a tertiary-care center in India
- Abnormal placental villous maturity and dysregulated glucose metabolism: implications for stillbirth prevention
- Comparison of prenatal central nervous system abnormalities with postmortem findings in fetuses following termination of pregnancy and clinical utility of postmortem examination
- Cardiac ion channels associated with unexplained stillbirth – an immunohistochemical study
- Viral infections in stillbirth: a contribution underestimated in Mexico?
- Audit and Bereavement Care
- Investigation and management of stillbirth: a descriptive review of major guidelines
- Delivery characteristics in pregnancies with stillbirth: a retrospective case-control study from a tertiary teaching hospital
- Perinatal bereavement care during COVID-19 in Australian maternity settings
- Beyond emotional support: predictors of satisfaction and perceived care quality following the death of a baby during pregnancy
- Stillbirth aftercare in a tertiary obstetric center – parents’ experiences