Robot Adoption at German Plants
-
Liuchun Deng


Abstract
Using a newly collected dataset at the plant level from 2014 to 2018, we provide the first microscopic portrait of robotization in Germany and study the correlates of robot adoption. Our descriptive analysis uncovers five stylized facts: (1) Robot use is relatively rare. (2) The distribution of robots is highly skewed. (3) New robot adopters contribute substantially to the recent robotization. (4) Robot users are exceptional. (5) Heterogeneity in robot types matters. Our regression results further suggest plant size, high-skilled labor share, exporter status, and labor shortage to be strongly associated with the future probability of robot adoption.
1 Introduction
The recent advances in automation technology, robotics in particular, have sparked a heated debate over the future of labor and human society at large. The ongoing process of robotization may engender profound impacts on various segments of the labor market. Given the far-reaching implications of robots, it is thus very important to understand the scale and scope of robot use and characteristics of robot users. However, the main challenge is the limited availability of robot data at the microeconomic level (Raj and Seamans 2018). Due to the data constraint, the bulk of the existing literature relies on cross-country industry-level data from the International Federation of Robotics (IFR). The lack of micro-level robot data makes it difficult to paint a comprehensive picture of robotization in industrial settings, and perhaps more importantly, to assess how within-industry firm level heterogeneity manifests itself in robot use and adoption.
In this paper, we leverage the newly collected plant-level information on the use and adoption of robots in the 2019 wave of the IAB Establishment Panel Survey to portray the state, the recent development, and the correlates of robot use and adoption in Germany, a country especially known for robot production and adoption.[1] Five stylized facts emerge. First, robot use is relatively rare, as only 1.55 % of German plants used robots in 2018. Even in the manufacturing sector, only 8.22 % of the plants were robot users. The finding is striking because Germany is the largest robot market in Europe and among the countries with the highest robot intensity in the world.[2] Second, the distribution of robots is highly skewed. Top 5 % of the robot-using plants, in terms of robot stock, owned more than half of the total robot stock in 2018. Third, the new robot adopters, which represent the growth in the extensive margin, contributed substantially to the growth in the aggregate stock of robots (the intensive margin) from 2014 to 2018. Fourth, robot users are exceptional. Robot users in 2018 are found to be larger, have higher labor productivity, invest more, and be more likely to export and adopt up-to-date technology than non-robot-using plants. Last, plants use different types of robots and heterogeneity in robot types matters for an array of plant-level characteristics.
We further examine how robot adoption is correlated with ex ante plant-level characteristics.[3] Our regression results demonstrate plant size to be the most robust predictor of future robot adoption. Conditional on plant size, the share of high-skilled labor is negatively correlated and the exporter status is positively correlated with subsequent robot adoption. We also note different labor shortage measures to be differentially associated with robot adoption. Moreover, exploiting the introduction of minimum wage in 2015 in Germany, we obtain suggestive evidence that manufacturing plants that raise wages due to the minimum wage regulation are associated with a higher likelihood of robot adoption.[4] It is worth noting that we have established in one of the stylized facts that robot users are different from non-users. This fact is based on the cross-sectional regressions that relate plant-level characteristics with the contemporaneous status of whether a plant uses robots. Our main analysis is then to further explore what plant-level characteristics in 2014 are predictive of robot adoption in the subsequent period of 2015–2018. The exercise is correlational in nature and intended to shed light on the potential causes rather than consequences of robot adoption.
This paper joins a growing strand of work that collects and assembles firm- or plant-level data on robot use. Coming the closest is Koch, Manuylov, and Smolka (2021) which is among the first to study robot adoption and its effects at the firm level based on a Spanish survey. Also using the Spanish data, Alguacil, Lo Turco, and Martínez-Zarzoso (2022) provide robust evidence of a positive effect of robot adoption on export performance.[5] The survey dataset in both papers, unlike ours, does not contain direct intensive margin information on robot stock at the firm level. Dinlersoz and Wolf (2018) analyze the US Census Bureau’s Survey of Manufacturing Technology which covers a variety of automation technologies including robots. Since large-scale robot-related surveys are still rare, an alternative data collection strategy is to infer robot use through international trade data. Humlum (2019) obtains Danish firm-level robot adoption data from the customs records and supplements that with a firm survey on the extensive margin information of robot use. Both Bonfiglioli et al. (2019) and Acemoglu, Lelarge, and Pascual (2020) study robotization in France. The former examines robot importers and the latter identifies robot users by the French import data supplemented with robot sales information. To study the nexus between robots and organizational capital, Rodrigo (2022) also infer robot information at the municipality level from the Brazilian customs data.[6] We focus on Germany. Because of Germany’s high robot density and its leading role in robot production, our analysis thus provides a microscopic portrait of a country on the frontier of robotization. The descriptive results can be informative for policymakers in Germany as well as in countries where robotization raises increasingly eminent policy discussions.[7]
Our findings on the correlates of robot adoption add to a vast literature on the diffusion of new technologies. Based on a 2018 large-scale data collection effort, Zolas et al. (2020) describe the current state of advanced technologies adoption and use by the US firms. Bloom et al. (2021) adopt a big-data approach to study the diffusion of what they identify as disruptive technologies, including several automation technologies like autonomous cars and machine learning, across firms and regions in the US. As a first attempt to empirically assess firms’ automation decisions in Germany, Zator (2019) exploits the broader measures of automation, including robots and CNC machines, and digitalization in the earlier waves of the IAB Establishment Panel Survey and highlights the role of labor scarcity in technology adoption. An emerging body of work in this literature focuses more specifically on the determinants of robot adoption. Similar to our findings, Koch, Manuylov, and Smolka (2021) document positive effects of plant size, low-skilled labor intensity, and exporter status on subsequent probability of robot adoption. Using the firm-level data from China, Fan, Hu, and Tang (2021) find that higher labor costs, brought about by minimum wage legislation, incentivize firms to adopt robots.
Our work complements the existing studies based on the IFR data that exploit regional or cross-country industry-level variation in robot use. The seminal work by Graetz and Michaels (2018) documents a strong impact of robot use on labor productivity growth. de Vries et al. (2020) provide cross-country evidence of the rise of robots being associated with a decline in routine manual task intensive jobs. Based on a shift-share design, Acemoglu and Restrepo (2020) and Dauth et al. (2021) provide detailed analysis of how robots impact local labor markets in the US and Germany, respectively.[8] Our paper does not examine the effects of robot adoption, but the stylized facts we document provide a useful context for the readers to interpret the existing findings that are based on more aggregate data. Among the few studies that study the causal determinants of robot adoption using (mainly) cross-country data, Acemoglu and Restrepo (2022) demonstrate demographic change to be an important driver of robot adoption. Our findings also add to this strand of work by linking the underlying plant-level characteristics with robot adoption.
The rest of the paper is organized as follows. In the next section, we introduce the dataset and present the five stylized facts on robot use and adoption. In Section 3, we present the empirical results on the potential determinants of robot adoption. We provide concluding remarks in Section 4.
2 The Data and Stylized Facts
2.1 The Plant-Level Data
The basis of our empirical analysis is drawn from the IAB Establishment Panel, an annual survey of nearly 16,000 plants, sampled from around 2 million German employers with a particular focus on employment.[9] The IAB Establishment Panel is a high-quality, long-standing panel data set that is nationally representative as a whole but also at the sector level, for firm-size classes, and across German federal states. In the 2019 wave, we included a dedicated section on robot use. Our definition of robots follows the ISO definition: A robot is any automated machine with multiple axes or directions of movement, programmed to perform specific tasks (partially) without human intervention. The difference between robots and traditional CNC machines is explicitly stated in the survey. The survey questions include (1) whether a plant used robots from 2014 to 2018; if so, (2a) the number of robots used in each year from 2014 to 2018 and (2b) the number of robots newly purchased in 2018; (3) heterogeneity regarding the types of robots in use.[10] The resulting plant-level data on robots is of high quality[11] and the distribution across industries is highly correlated with the industry-level IFR data for Germany (Plümpe and Stegmaier 2022).
Our dataset is the first longitudinal dataset that reports direct measure of robot use and intensity at the plant level. Due to the scarcity of microeconomic information on robotization, most of the existing papers infer the firm- or plant-level robot information indirectly from the import data (Acemoglu, Lelarge, and Pascual 2020; Barth et al. 2020; Bonfiglioli et al. 2019; Humlum 2019).[12] This approach not only suffers from the measurement error in trade classifications and domestic resales of robots as noted in the literature but also is much less feasible in the German context given the country’s prominent role in robot production. Coming closest to our direct survey-based robot measures is the Spanish data used in Koch, Manuylov, and Smolka (2021), whereas we also obtain direct robot information on the intensive margin.
Given the panel structure, we incorporate a wide array of plant-level variables since the 2013 wave of the IAB Establishment Panel. The resulting dataset is an unbalanced panel of 15,307 plants spanning from 2014 to 2018. Within our survey sample, 616 plants report using robots during the sample period. Table 1 reports the summary statistics for the main non-robot variables in 2014 and 2018. The sample size is larger in 2018 because of the survey attrition when constructing our sample retrospectively based on the 2019 surveyed plants.
Summary statistics.
| Year 2018 | Year 2014 | |||||
|---|---|---|---|---|---|---|
| Variable | Mean | Std. Dev. | N | Mean | Std. Dev. | N |
| log (Employment) | 2.93 | 1.68 | 15,307 | 3.02 | 1.60 | 7852 |
| log (Labor productivity) | 10.63 | 0.84 | 8267 | 10.57 | 0.86 | 4945 |
| log (TFP) | 4.65 | 1.25 | 4264 | 4.48 | 1.30 | 4262 |
| log (Wage) | 7.38 | 0.68 | 8563 | 7.38 | 0.66 | 5542 |
| High-skilled labor | 0.09 | 0.19 | 11,470 | 0.09 | 0.19 | 6942 |
| Exporter | 0.22 | 0.41 | 12,912 | 0.23 | 0.42 | 6533 |
-
Notes: (1) The summary statistics are based on the sample of plants that provided a non-missing answer to whether they used robots in 2018. (2) No survey weights are applied. (3) Employment is the total employment count. Labor productivity is defined as value added per worker in €1000/Worker. TFP (total factor productivity) is the residual obtained by regressing the business volume on labor, capital, and intermediate input by industry. Capital stock is approximated using the method as in Müller (2017). Wage is the average monthly wage of all employees that are subject to social insurance contributions, including part-time employees and apprentices, calcuated as the total wage bill divided by the number of employees. High-skilled labor is the share of workers with a university degree. Exporter is a dummy variable for exporter status.
2.2 Stylized Facts
Based on the newly collected plant-level information on robots, we present five stylized facts concerning the use and adoption of robots in Germany. As the IAB Establishment Panel is based on a disproportionately stratified sample design, survey weights are applied to obtain representative results for Germany.[13] In what follows, we define a plant to be a robot user in a given year if that plant is identified to have a positive number of robots in that year and a plant to be a robot adopter over a given period if that plant is identified to have no robots at the beginning of that period and become a robot user by the end of the period.
Fact I: Robot use is relatively rare. In 2018, only 1.55 % of the plants were robot users in Germany. Even within the manufacturing sector, the share of robot users is surprisingly small. According to Table 2, the manufacturing sector, which has undergone a continued process of robotization for more than five decades, has 8.22 % of the plants being robot users in 2018.[14] The top two industries ranked by the share of robot users are plastics and motor vehicles. 25.55 % of the plants in the plastics industry and 24.26 % of the plants in the motor vehicles industry use robots, so the remaining three-quarters of the plants in these two most robot-intensive industries have not installed a single robot. In the precision/optical industry or other manufacturing industries like textiles and clothing, the share of robot users is below 5 %, suggesting that robot use is rather an exception than norm even within the manufacturing sector. In the non-manufacturing sector, where robotic technology was brought into applications not long ago, 0.94 % of the plants were robot users in 2018. Many non-manufacturing industries, especially service industries, have less than 1 % of their plants being robot users.
The extensive margin: Share of robot users by industry in 2018.
| Industry/sector | Weighted (%) | Unweighted (%) | # of plants |
|---|---|---|---|
| All manufacturing | 8.22 | 14.52 | 3257 |
| Plastics | 25.55 | 30.98 | 184 |
| Motor vehicles | 24.26 | 30.50 | 200 |
| Basic metals | 12.67 | 21.00 | 200 |
| Electrical equipment | 11.33 | 15.34 | 163 |
| Machinery and equipment | 11.29 | 15.90 | 434 |
| Furniture/jewelry/sports/medical | 9.67 | 8.68 | 265 |
| Glass/ceramic | 7.74 | 14.44 | 187 |
| Paper/print/wood | 7.61 | 10.96 | 228 |
| Chemical/pharmaceutical | 7.12 | 5.85 | 205 |
| Fabricated metal | 6.22 | 17.07 | 457 |
| Food/luxury | 5.87 | 10.54 | 313 |
| Precision/optical equipment | 4.16 | 11.18 | 152 |
| Other manufacturing | 1.27 | 1.49 | 269 |
| All non-manufacturing | 0.94 | 1.16 | 12,050 |
| Agriculture/forestry | 7.41 | 4.79 | 334 |
| Wholesale trade and retail trade | 1.48 | 2.06 | 1649 |
| Building/installation | 1.23 | 1.18 | 1103 |
| Human health | 0.34 | 1.04 | 1828 |
| Other non-manufacturing | 0.50 | 0.81 | 7136 |
| Total | 1.55 | 4.00 | 15,307 |
-
Notes: (1) Column weighted reports the share of robot users with survey weights. (2) Column unweighted reports the share of robot users without survey weights. (3) The last column reports the total number of surveyed plants (robot users and non-users combined). (4) The industries are based on the 2-digit IAB Establishment Panel Survey classification (aggregated from 2-digit NACE Rev.2 industries). (5) Due to very few observations of robot users, the following industries are combined into the other manufacturing category: textiles/clothing, repair/installation, and chemical/pharmaceutical. The residual category other non-manufacturing combines the sectors energy, sales/maintenance/repair of motor vehicles, financial/insurance sector, consulting, research/development, marketing/design/translation, veterinary industry, renting, placement/temporary provision of labor, itinerant trading/landscaping, activities of membership, and other services.
It should be noted that despite a relatively small share of plants using robots, those robot users employ a nontrivial fraction of the German workforce. Within the manufacturing sector, about 30 % of the employees work for robot-using plants. Further, the share of robot users based on our sample is very similar to the 3 % share of German enterprises using industrial robots based on the Eurostat ICT Community Survey in 2018 (Sostero 2020). Our findings can also be usefully compared with the numbers based on the US data. In the 2018 Annual Business Survey (ABS) that covered more than 850,000 US firms in the nonfarm sectors, Zolas et al. (2020) document that 1.3 % of the firms use robotics, which is slightly lower than the robot-user share of 1.55 % (adjusted for survey weights) in Germany. In the US Census Bureau’s Survey of Manufacturing Technology (SMT) which was conducted in 1988, 1991, and 1993, Dinlersoz and Wolf (2018) document a larger share of plants used robots for five manufacturing industries.[15] For example, they find that 7.7 % of the plants in 1988 used pick and place robots. The industry-level user share in Germany as in Table 2 suggests a similar pattern: the more capital-intensive manufacturing industries tend to use robots more extensively.
Fact II: The robot distribution is highly skewed. Among the robot users, robots are highly concentrated in a handful of heavy users and high concentration is mainly driven by the skewed distribution of robots in the manufacturing sector. In 2018, 52 % of the total robot stock is estimated, based on the survey weights, to be installed in top 5 % of the robot using plants (ranked by the plant-level robot count) in Germany, whereas within the survey sample, 85 % of the total robot stock is installed in top 5 % of the robot using plants.
According to the first panel of Figure 1, manufacturing plants in the top decile on average have 40 robots, 20 times as many as the median number of robots among robot users. Within the top decile, the distribution of robots is also highly skewed: the highest two percentiles have on average 141 robots.[16] Based on the same sorting of plants, the second panel of Figure 1 further demonstrates that the high concentration of robots is not just reminiscent of the skewed distribution of plant size. The average robot density, measured by the number of robots per 1000 employees, is substantially higher for the top decile, so the distribution of robots is more skewed than the employment distribution across plants.
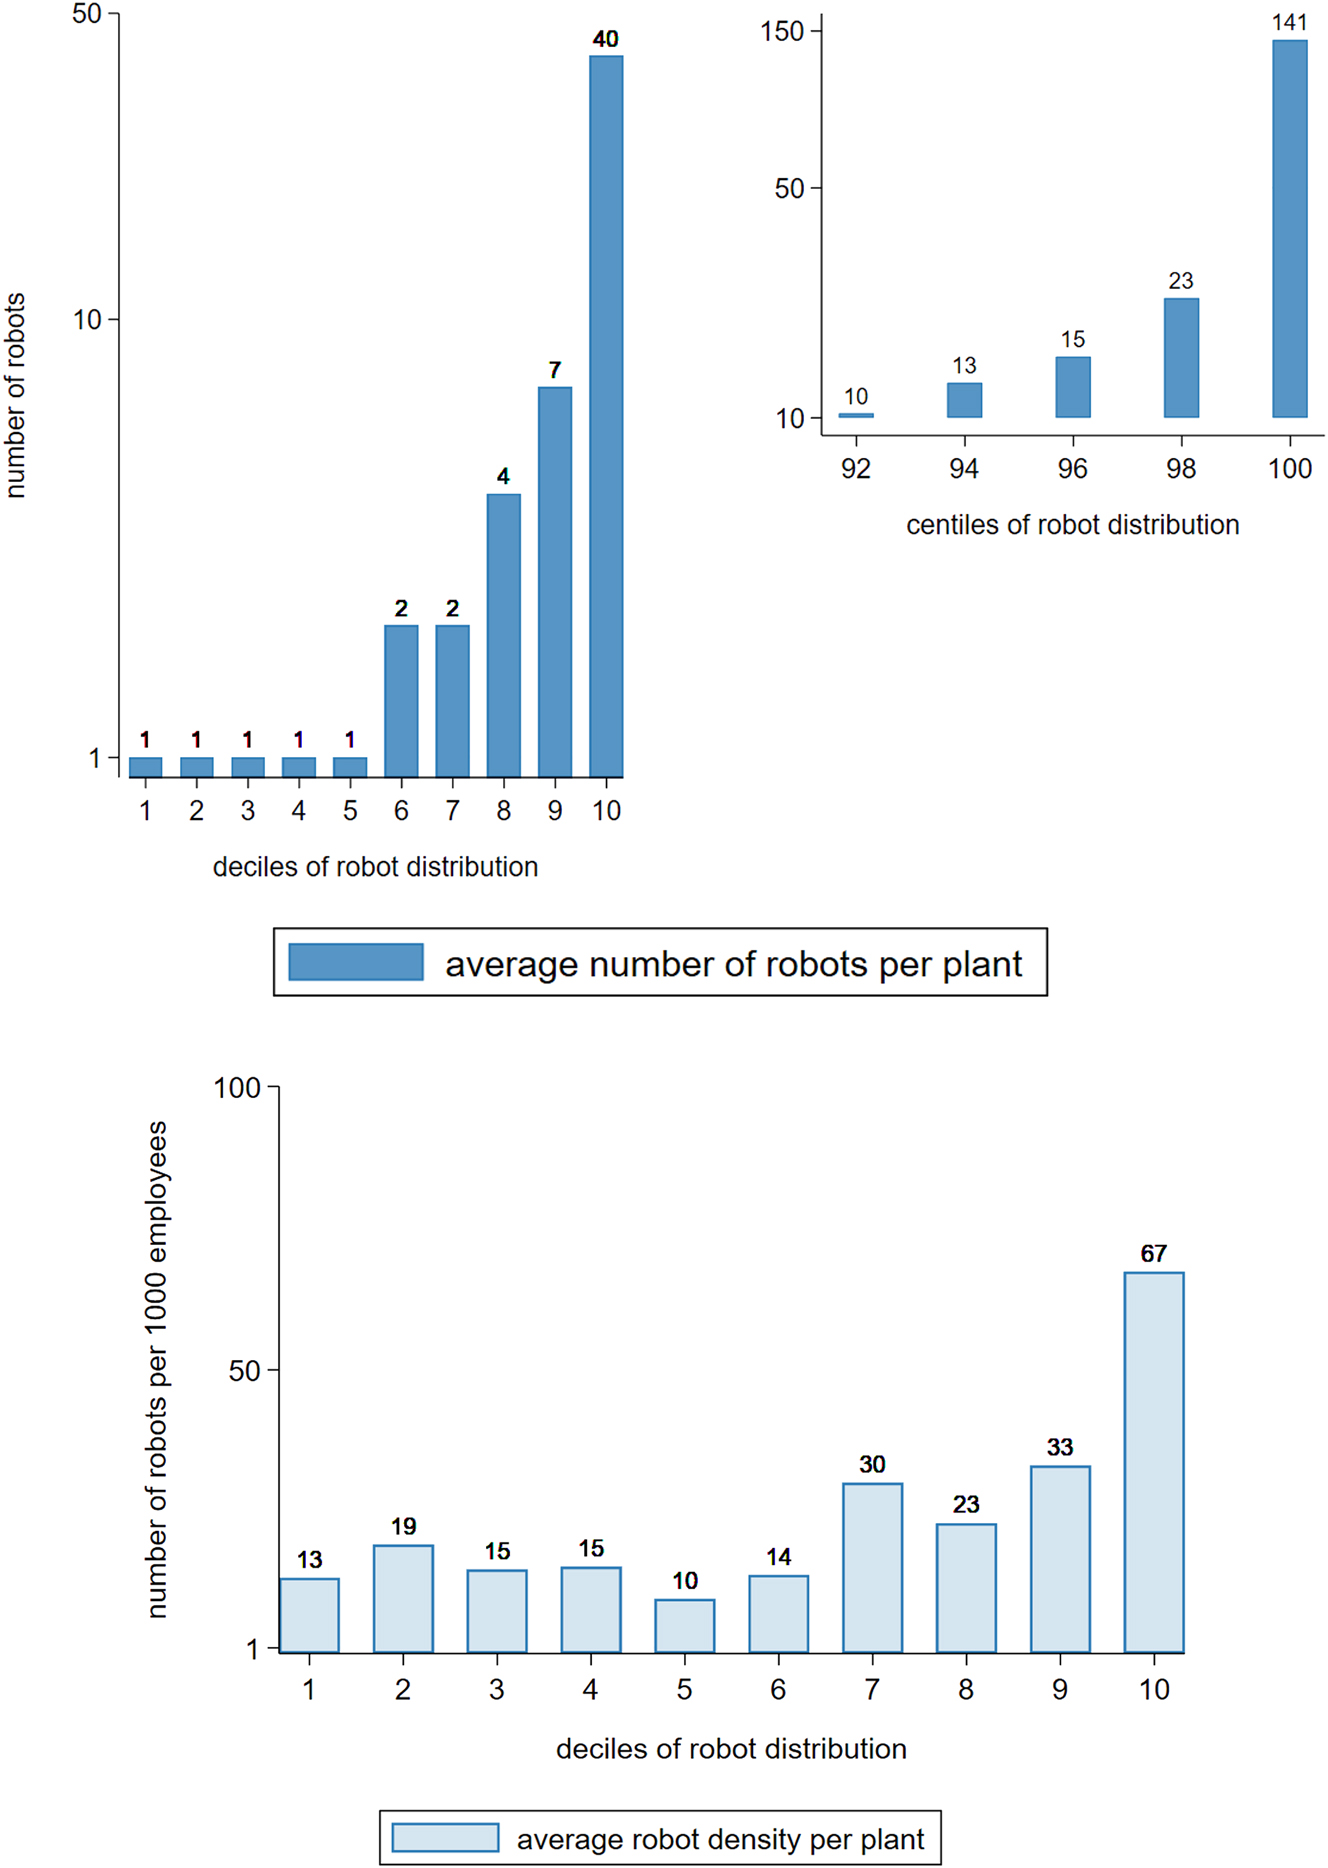
The intensive margin: distribution of robots in manufacturing in 2018. Notes: (1) We sort plants by the number of robots reported in 2018. For plants with the same number of robots, they are randomly sorted (a further sorting by plant-level attributes like plant size could artificially skew the distribution of robot intensity). The same sorting is applied to both panels. (2) Survey weights are applied. (3) Average robot count or robot density (measured by robot count per 1000 employees) is calculated within each decile or bi-centile and rounded to the closest integer. (4) Due to skewedness of the distribution, the first panel is plotted in log scale.
It is worth noting that high concentration of robots in the manufacturing sector is not just driven by the large automobile plants. Indeed, the plants with the highest number of robots are mainly in the motor vehicle industry, but the robot distribution for the non-automobile manufacturing plants remains very skewed. An inspection of the within-industry robot distribution suggests that robots are highly concentrated in almost all manufacturing industries.[17]
In contrast, the distribution of robots is much less skewed in the non-manufacturing sector. Using the survey weights, we estimate about a quarter of the robots to be installed in the non-manufacturing sector. The median user installed one robot in 2018 while the users in the top decile had 7 robots on average. The lack of skewedness is largely a reflection of the early stage of robotization in the non-manufacturing sector. It is worth tracking if the different nature of robotic technology (for example, service robots) used in non-manufacturing may also impact the concentration of robots in this sector in the long run.
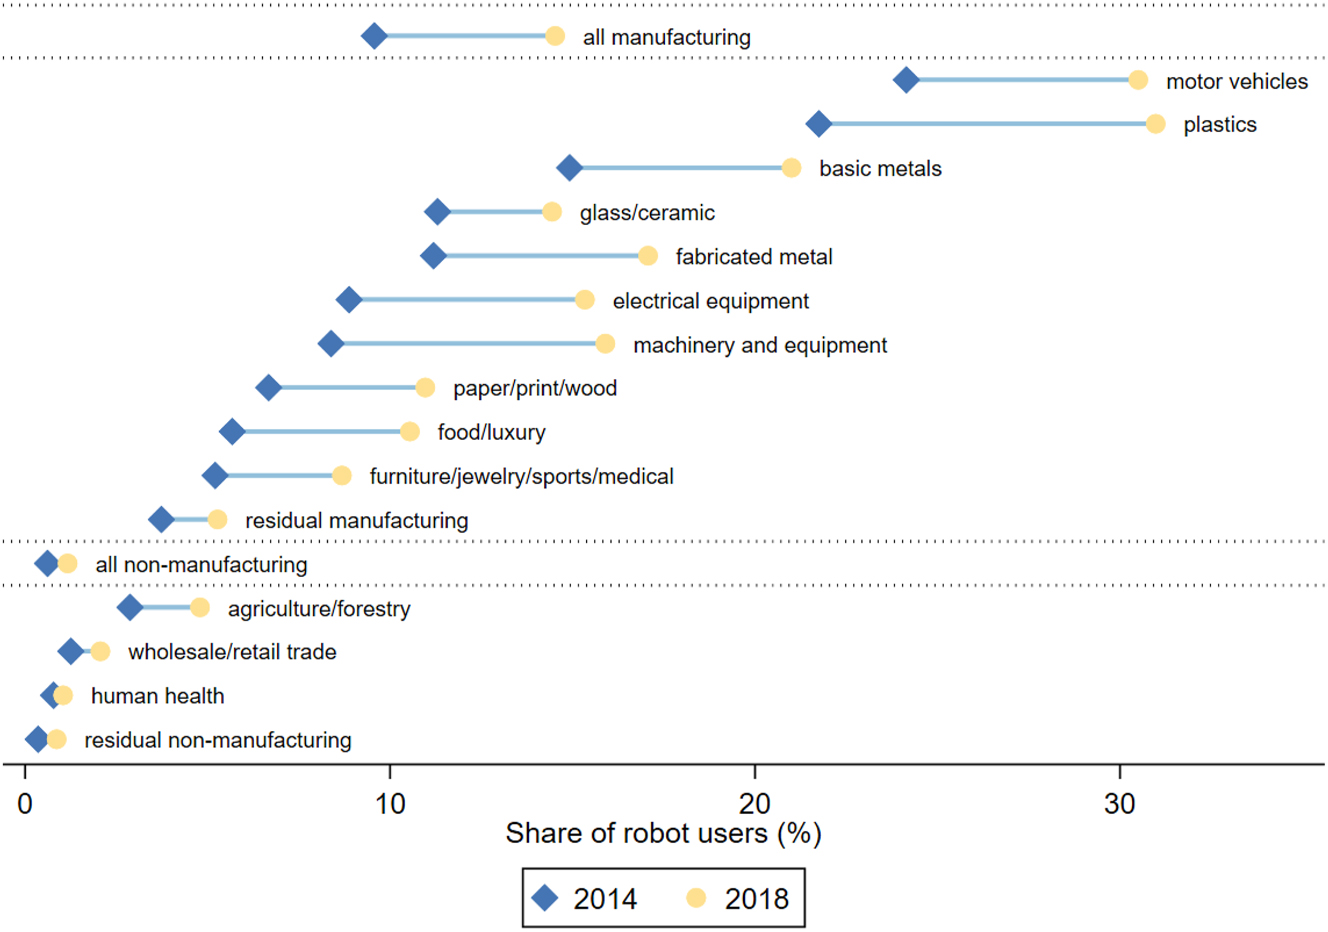
Fact III: The extensive margin contributes substantially to robotization. Robot adopters, the plants that newly adopted robots from 2014 to 2018, make a substantial contribution to the growth in both the share of robot users and the total robot stock. In our survey sample, 184 plants, around 30 % of all the robot users in 2018, report that they newly adopted robots during the period from 2014 to 2018. Figure 2 compares across industries the share of robot users in 2014 with that in 2018.[18] The share of robot users in the manufacturing sector increases by more than 50 % from 5.16 % to 8.22 %.[19] The user share in the non-manufacturing sector almost doubles from 0.51 % to 0.94 %. In the motor vehicle industry, one of the most robot-intensive industries, the user share increases from 16.90 % to 24.26 %.[20] Moreover, divestment in robots is rarely observed in our sample. Only two plants that once used robots report decreasing their robot stock to zero by the end of the sample period.
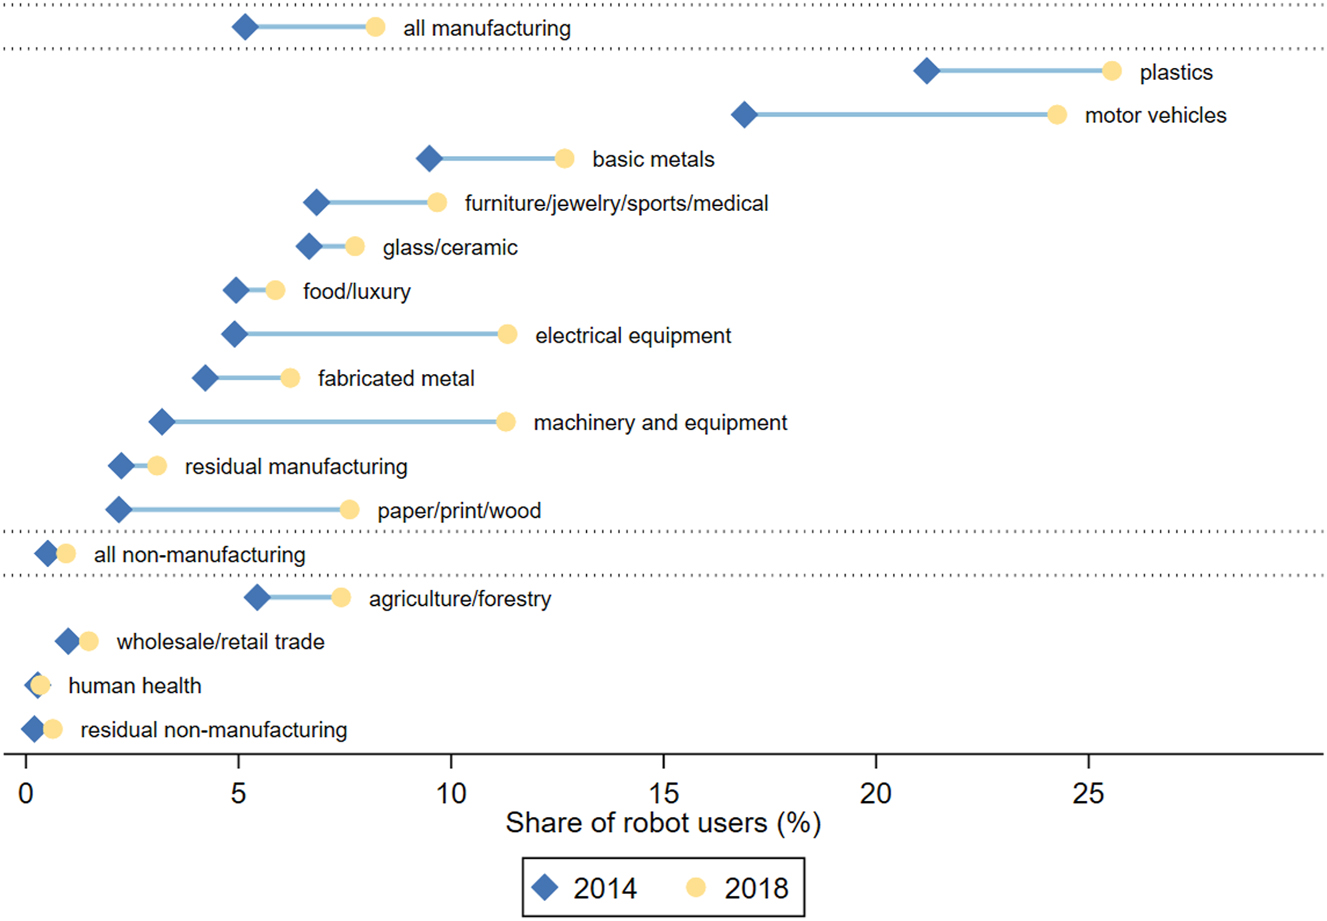
Share of robot users: 2014 versus 2018. Notes: (1) A plant is identified as a robot user in 2018 if it answered yes to the question of whether it used robots from 2014 to 2018 and its robot stock in 2018 was not zero. (2) Survey weights in 2018 are applied. (3) The estimated share of robot users in 2014 is the share of robot users in 2018 times the share of plants reporting a positive robot stock in 2014 within the sample of robot users in 2018 reporting a non-missing robot stock in 2014. (4) the industries included in the figure are based on the 2-digit IAB establishment panel survey classification (aggregated from 2-digit NACE Rev.2 industries). Due to very few observations of robot users, the following industries are combined into a residual manufacturing category: textiles/clothing, repair/installation, precision/optical equipment, and chemical/pharmaceutical.
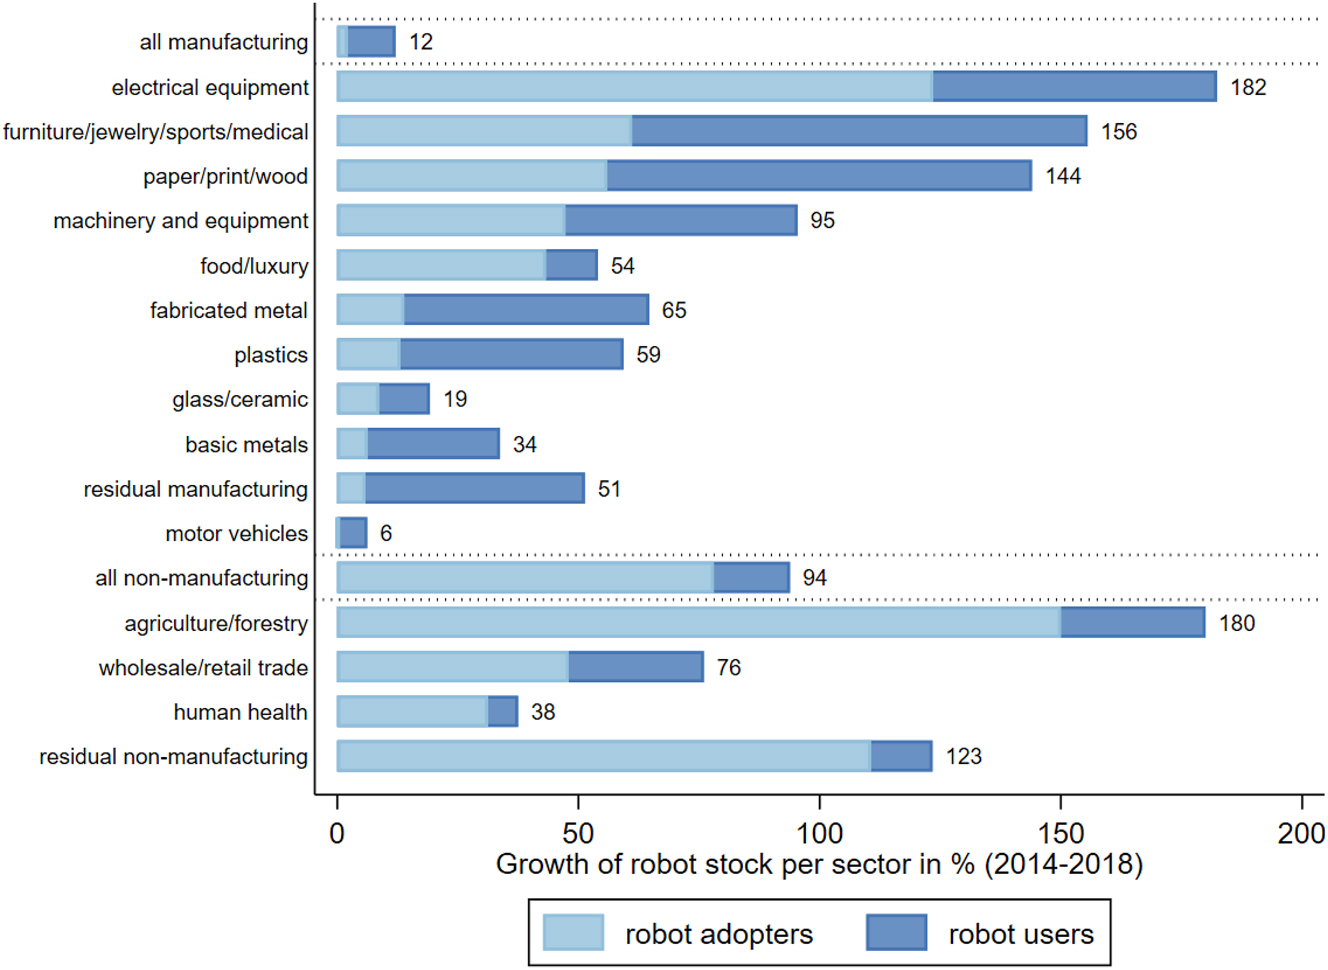
To bring out the role of the intensive margin, Figure 3 plots the growth of robot stock by industry from 2014 to 2018.[21] The industry-level growth is decomposed into the extensive and intensive margins. The extensive margin, illustrated by the light-colored bars, is the contribution of robot adopters from 2014 to 2018 to the overall growth of robots, whereas the intensive margin, illustrated by the dark-colored bars, is the contribution of the plants that already used robots in 2014. In the manufacturing sector, the overall growth in robot stock is 44 % and 13 % points are contributed by new adopters; In the non-manufacturing sector, robot stock in total increases by 132 % and 114 % points are contributed by new adopters. Two notable features are worth highlighting. First, the aggregate numbers for the manufacturing sector mask substantial heterogeneity across industries. For example, in the electrical equipment industry, the new adopters play a dominant role in robot growth, raising the industry-level robot stock by about 260 % (out of the overall growth rate of 312 %). Similarly, in paper, print, and wooden products industry, robot stock grows by 214 %, among which 157 % points are contributed by new adopters. The growth pattern in those industries stands in sharp contrast to the motor vehicle industry where robots have been traditionally heavily used and the overall growth in robot stock is mainly contributed by the existing users. Second, the contribution of the extensive margin to growth is much greater in the non-manufacturing sector. The new robot purchases are predominantly made by robot adopters, consistent with rapid growth in the robot user share of the non-manufacturing sector as shown in Figure 2.[22]
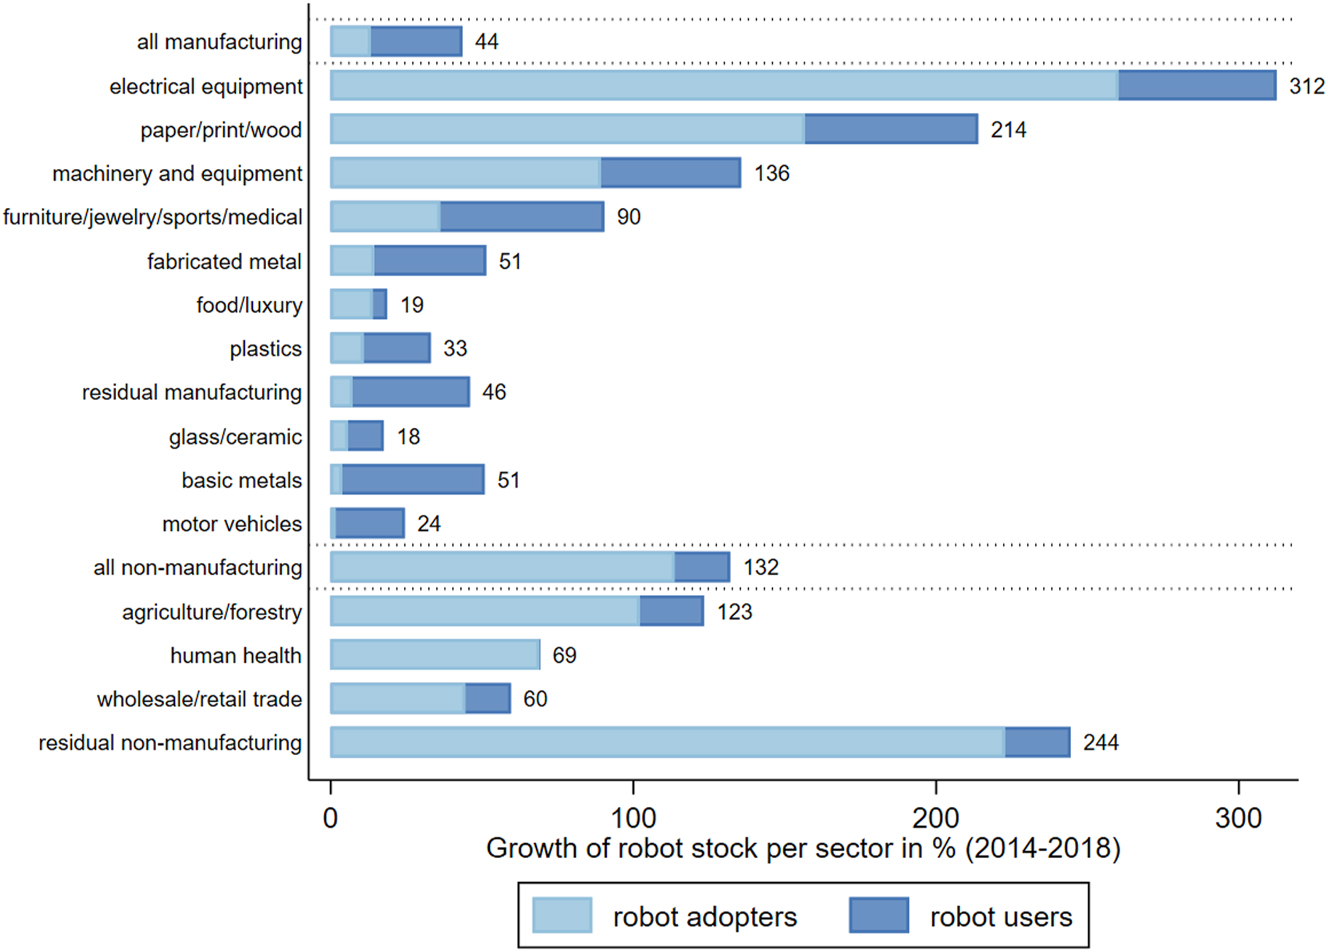
Decomposition of growth in robot stock: The extensive versus intensive margin. Notes: (1) Calculations are based on the surveyed plants that reported their robot use in each year from 2014 to 2018. Survey weights in 2018 are applied. (2) For each industry (sector), the contribution of the robot adopters to growth is defined as the ratio of the total robot stock of robot adopters in 2018 to the robot stock aggregated over the existing users in 2014. The contribution of the existing robot users to growth is defined as the percentage change of the aggregate robot stock from 2014 to 2018 for the plants that already used robots in 2014. (3) The industries included in the figure are based on the 2-digit IAB establishment panel survey classification (aggregated from 2-digit NACE Rev.2 industries). Due to very few observations of robot users, the following industries are combined into a residual manufacturing category: textiles/clothing, repair/installation, precision/optical equipment, and chemical/pharmaceutical.
Our findings, taken together, point to the importance of the extensive margin. It indicates that the recent wave of robotization is not only a process of capital deepening for the existing users but also a classic example of technology diffusion, as more and more plants reap the benefits of the new automation technology.
Fact IV: Robot users are exceptional. Robot users are different. In 2018, only 1.55 % of the German plants used robots, but they employed 3.2 million workers, which account for about 8 % of the total labor force in Germany. To capture robotization premia,[23] that is, how robot users differ from non-users in a wide array of plant-level characteristics, we use the 2018 cross-sectional sample to perform the following bivariate regressions:
where X ijk is a given characteristic of interest for plant i in industry j and state k; RobotUse ijk is a dummy variable which equals one if plant i used robots in 2018 and zero otherwise; ϕ j and ψ k are the industry and state fixed effects; Emp ijk is the plant-level employment count. Our specification takes into account important features that approximate the sample design of the IAB Establishment Panel (plant size, state, and industry), so we do not weight our regressions and present regression results without survey weights throughout this paper for conciseness.[24] We have also run the same regression specification with survey weights, but the implications based on these results are qualitatively the same. Thus, our regression results can be viewed as representative for Germany.
Table 3 presents the estimates of β for a number of plant-level characteristics for five different specifications. In the first row, all the bivariate regressions are based on the full sample without any fixed effects or a plant size control. We then include industry and state fixed effects in the second row and additionally employment as a plant size control in the third row. In the last two rows, we run the bivariate regressions with the fixed effects and the employment control for the manufacturing and non-manufacturing sample separately. Since employment is used as an additional control, the point estimates for employment drop out in Columns (1) and (2) for the last three specifications. It should be noted that the sample size varies across different columns in Table 3 because the fraction of missing values varies with the plant-level characteristics.[25]
Robotization premia: the extensive margin.
| Dependent variable | ||||||||||
|---|---|---|---|---|---|---|---|---|---|---|
| Employment | Labor productivity | TFP | High-skilled labor | Wage | Exporter | Up-to-date technology | Product improvement | Process improvement | Investment | |
| (1) | (2) | (3) | (4) | (5) | (6) | (7) | (8) | (9) | (10) | |
| None | 1.783*** | 0.551*** | −0.082 | 0.003 | 0.408*** | 0.462*** | 0.032 | 0.347*** | 0.305*** | 2.289*** |
| Full | (0.162) | (0.062) | (0.134) | (0.013) | (0.061) | (0.037) | (0.030) | (0.024) | (0.025) | (0.218) |
| FE | 1.418*** | 0.306*** | 0.093* | 0.020*** | 0.216*** | 0.228*** | 0.117*** | 0.237*** | 0.250*** | 1.657*** |
| Full | (0.122) | (0.043) | (0.049) | (0.007) | (0.040) | (0.026) | (0.025) | (0.020) | (0.022) | (0.158) |
| FE + size | 0.123*** | 0.087* | −0.009 | −0.018 | 0.168*** | 0.086*** | 0.152*** | 0.191*** | 0.600*** | |
| Full | (0.042) | (0.053) | (0.008) | (0.036) | (0.025) | (0.026) | (0.020) | (0.022) | (0.097) | |
| FE + size | 0.055 | 0.041 | −0.019*** | −0.043 | 0.072*** | 0.060* | 0.091*** | 0.140*** | 0.383*** | |
| Manuf. | (0.042) | (0.035) | (0.006) | (0.026) | (0.026) | (0.032) | (0.023) | (0.028) | (0.094) | |
| FE + size | 0.095 | 0.237* | 0.018 | −0.079 | 0.090** | 0.139*** | 0.173*** | 0.215*** | 0.706*** | |
| Non-manuf. | (0.083) | (0.142) | (0.018) | (0.105) | (0.040) | (0.042) | (0.039) | (0.048) | (0.196) | |
-
Notes: (1) The table reports OLS regression results of Equation (1). Each column reports for five different specifications, the estimated coefficient of the dummy variable of robot use by regressing a given plant-level characteristic on the robot-use dummy (and additional controls). (2) No survey weights are applied. (3) The dependent variables, Employment, Labor productivity, TFP, Wage, and Investment, are all in log values. Exporter, Update-to-date technology, Product improvement, and Process improvement are dummy variables. High-skilled labor is the share of employees with a university degree. (4) Each row represents a different regression specification. The first three specifications are based on the full sample (N = 14,263). The fourth specification is based on the manufacturing sample (N = 3068) and the fifth is based on the non-manufacturing sample (N = 11,195). The actual sample size varies across plant-level characteristics due to the missing values. For the full sample estimation, the sample size is 14,263 for (1), 7671 for (2), 3974 for (3), 10,440 for (4), 7807 for (5), 11,933 for (6), 10,142 for (7), 14,174 for (8), 14,177 for (9), and 8167 for (10). In the first specification (“No Control”), there is no additional control. The second specification (“FE”) includes industry (2-digit NACE Rev.2 industries) and federal state fixed effects. The last three specifications (“FE + Size”) include both fixed effects and plant-level employment (in log) as controls. (5) Standard errors are clustered at 3-digit NACE Rev.2 level and reported in parentheses. (6) *** p
Overall, the estimated coefficients suggest that robot users are about four times (e 1.418 ≈ 4.129) as large as non-users (Column (1)). Without controlling for the plant size, our point estimates in the second row suggest that robot users are different from non-users along all dimensions of plant-level characteristics. However, once we control for the plant size as in the third row, the differences between the users and non-users in skill intensity and wage (Columns (4)–(5)) are no longer statistically significant. Columns (2) and (3) suggest that even after controlling for the plant size, robot users are more productive than non-users. Columns (6)–(9) report the point estimates for four dummy variables, capturing the exporter and technological status as well as product and process improvement. According to Column (6), the probability of being an exporter is 16.8 % points higher for robot users. According to Column (7), the probability of adopting up-to-date or relatively up-to-date technology increases by 8.6 % points for robot users.[26] This correlation between robot use and technological status is consistent with the findings of the adoption of new technologies being interconnected in Zolas et al. (2020). Further, Columns (8) and (9) suggest a positive association between automation and innovation: robot users are more likely to engage in product and process improvement. In Column (10), we find that robot users also make significantly more investments.
We now turn to the last two rows in Table 3 which estimate robotization premia separately for the manufacturing and non-manufacturing plants. The main patterns for the two subsamples are largely similar to those for the full sample, with two notable exceptions. First, the estimated premium for labor productivity in Column (2) is no longer significant for both subsamples with reduced magnitude,[27] so there is a caveat in interpreting labor productivity premium based on the full sample result. Second, Column (4) reveals an interesting asymmetry concerning the skill intensity. In the manufacturing sector, the share of high-skilled labor (employees with a university degree), with the plant size being controlled for, is 1.9 % points lower for robot users, whereas in the non-manufacturing sector, robot users are as skill-intensive (measured by the high-skilled labor share) as non-users. We will revisit this asymmetry later as we explore the correlates of robot adoption.[28]
Fact V: Heterogeneity of robots matters. Technological progress in the last decade has been shaking the stereotype of (industrial) robots. Robots that can be used in collaboration with human workers, usually smaller in size and cheaper in price, are on the rise. To have a fuller picture of robotization, it is important to account for the composition of different types of robots at the plant level and how the compositional difference manifests itself in plant-level outcomes. The questions on heterogeneity in robots in our survey enable this inquiry.
According to our survey, 49 % of the German robot-using plants report using robots that are separated from employees during regular operations with the help of a protection device (labeled as “cage robots” henceforth), which are distinguished from the new collaborative robots, and 53 % of the robot using plants report using robots that cost more than 50,000 Euros (labeled as “expensive robots” henceforth) in 2018. Among those cage robot users, 94 % of them have all of their robots operated in separation from employees, accounting for 72 % of the total robot stock. Among those expensive robot users, 80 % of them have all of their robots purchased at a price above 50,000 Euros, accounting for 45 % of the total robot stock.[29]
Leveraging the information on robot types, we reexamine robotization premia on the extensive margin. We consider the regression of the following form:
where RobotUse ijk is the dummy of whether a plant is a robot user as we have defined before, Cage ijk is a dummy variable that equals one if a robot user has its all robots being cage robots, and Expensive ijk is a dummy variable that equals one if a robot user has its all robots being purchased at a price of above 50,000 Euros. Note that cage robot users and expensive robot users are not mutually exclusive. The control group in this specification is the non-robot-using plants.
Table 4 reports the estimation results. According to Column (1), robot users are significantly larger than non-users, but this size premium is particularly large for cage robot and expensive robot users. Compared with other robot users, cage robot users are on average about 46.7 % larger (e 0.383 − 1 ≈ 0.467) and expensive robot users are about 55.3 % larger (e 0.440 − 1 ≈ 0.553). Conditional on plant size being controlled, however, expensive robot users do not significantly differ from other robot users along other plant-level characteristics, whereas cage robot users tend to hire less high-skilled labor (Column (4)) and enjoy a much higher premium in the probability to export (Column (6)).[30]
Robotization premia: Heterogeneity in robot types.
| Dependent Variable | ||||||
|---|---|---|---|---|---|---|
| Employment | Labor productivity |
TFP | High-skilled Labor | Wage | Exporter | |
| (1) | (2) | (3) | (4) | (5) | (6) | |
| RobotUse | 0.766*** | −0.025 | 0.117 | 0.015 | 0.009 | 0.081** |
| (0.188) | (0.074) | (0.125) | (0.018) | (0.059) | (0.036) | |
| RobotUse × Cage | 0.383** | 0.116 | −0.094 | −0.035** | −0.005 | 0.099** |
| (0.163) | (0.075) | (0.103) | (0.016) | (0.050) | (0.044) | |
| RobotUse × Expensive | 0.440** | 0.092 | 0.052 | 0.007 | −0.034 | 0.031 |
| (0.193) | (0.060) | (0.085) | (0.013) | (0.049) | (0.036) | |
| Plant size | No | Yes | Yes | Yes | Yes | Yes |
| Industry FE | Yes | Yes | Yes | Yes | Yes | Yes |
| State FE | Yes | Yes | Yes | Yes | Yes | Yes |
| N | 14,166 | 7630 | 3,960 | 10,391 | 7,786 | 11,861 |
| Adjusted R 2 | 0.271 | 0.282 | 0.798 | 0.281 | 0.423 | 0.309 |
-
Notes: (1) This table reports the OLS regression results for Equation (2). (2) No survey weights are applied. (3) In 2018, 391 plants solely used cage robots (RobotUse × Cage = 1), 323 plants solely used expensive robots (RobotUse × Expensive = 1), and 268 plants solely used both cage and expensive robots (RobotUse × Cage = RobotUse × Expensive = 1). (4) The dependent variables, Employment, Labor productivity, TFP, and Wage, are all in log values. Exporter is a dummy variable. High-skilled Labor is the share of employees with a university degree. (5) All regressions are based on the full sample (both manufacturing and non-manufacturing plants included) and include both 2-digit NACE Rev.2 industry and federal state fixed effects and the employment count (in log) as controls. (6) Standard errors are clustered at 3-digit NACE Rev. 2 level and reported in parentheses. (7) *** p
Those results taken together point to the importance of accounting for different types of robots: not all robots are the same. Since robotization premia are heterogeneous across robot types, it could be the case that the labor market consequences of robotization may also hinge on which type of robots is more complementary or substitutable to human labor. With the rapid development in robotics, our correlational observations thus call for a more systematic attempt in future survey designs to solicit more details on heterogeneity in robot types.
3 Plant-Level Correlates of Robot Adoption
In this section, we explore the correlates of robot adoption. In Germany, robot users differ from non-users in a number of ways, as shown in Stylized Fact IV. To examine whether these differences precede the adoption of robots and what may constitute the potential determinants of adoption, we focus on the sample of plants that reported no robot use in 2014 to investigate which plant-level characteristics in the base year correlate with robot adoption in subsequent years.[31] Our baseline cross-sectional specification is given by
where
The task-based theoretical framework of robot adoption with firm heterogeneity has identified a variety of microeconomic factors that can influence firms’ automation decisions (Acemoglu and Restrepo 2018; Koch, Manuylov, and Smolka 2021). Assuming the fixed cost of robot adoption, Koch, Manuylov, and Smolka (2021) demonstrate theoretically that larger firms or firms with access to international markets have more incentives to adopt robots because they are more likely recover the fixed adoption cost, whereas firms with higher skill intensity are less likely to adopt robots because tasks that required more skilled labor to perform are generally more difficult to automate. It is also shown that the labor cost matters as higher labor cost can imply larger cost savings by robot adoption. Our empirical analysis will focus on plant size and productivity, skill composition and labor cost measures, and internationalization measures as potential correlates of robot adoption. We will also consider direct survey responses to various labor market constraints that plants are faced with.
Table 5 presents the baseline regression results for the full sample. In all specifications, we include industry and state fixed effects. In Columns (1) and (2), we find future robot adoption to be positively associated with labor productivity and employment. Consistent with the theoretical prediction and earlier empirical findings, larger and more productive plants are more likely to adopt robots.[32] In Columns (3)–(8), we include employment as a plant size control. Plant size always enters the regression significantly with a positive sign. With the plant size being controlled for, we do not find evidence of TFP to be associated with subsequent robot adoption in Column (3). In Column (4), we find the share of high-skilled labor (employees with a university degree) in the initial year lowers the probability of robot adoption. This again is consistent with the skill composition channel identified in theory: other things equal, high-skilled labor which has comparative advantage in performing more complex and less automatable tasks is less likely to be replaced by robots. According to Column (5), the average wage, arguably a crude measure of plant-level skill intensity, however, shows no significant association with robot adoption. In Column (6), we consider the effect of the introduction of minimum wage in 2015 in Germany. We define the minimum wage dummy as one if a plant answered in the 2015 survey that it raised its wages due to the new minimum wage regulation. The dummy variable enters the regression positively but with no statistical significance. In Columns (7) and (8), we examine the two internationalization measures, exporter status and foreign ownership, with the former being strongly and positively correlated with adoption, similar to the findings in Koch, Manuylov, and Smolka (2021). In Columns (9) and (10), we introduce two labor shortage measures to capture whether plants have demand for further training of their employees and whether they have difficulties in finding skilled labor. The two measures enter the regressions with opposite signs. The demand for further training is associated with a higher probability of subsequent robot adoption, whereas the shortage of skilled labor, despite the lack of statistical significance, is associated with a lower adoption probability. The point estimates in Columns (9) and (10) suggest a nuanced picture of how labor shortage impacts robot adoption. In contrast to the findings in Benmelech and Zator (2021) that general labor shortage measures are associated with stronger automation incentives, we find that the lack of qualified skilled employees, which are likely complementary factors to robots, may potentially lower the probability for firms to adopt robots.
Correlates of robot adoption: Baseline specification (full Sample).
| Dependent variable: robot adoption dummy (=1 if a plant newly adopted robots between 2014 and 2018) | ||||||||||
|---|---|---|---|---|---|---|---|---|---|---|
| (1) | (2) | (3) | (4) | (5) | (6) | (7) | (8) | (9) | (10) | |
| Labor productivity | 0.005* | |||||||||
| (0.003) | ||||||||||
| Employment | 0.008*** | 0.013*** | 0.009*** | 0.010*** | 0.008*** | 0.009*** | 0.011*** | 0.008*** | 0.009*** | |
| (0.002) | (0.003) | (0.002) | (0.002) | (0.002) | (0.002) | (0.002) | (0.002) | (0.002) | ||
| TFP | −0.002 | |||||||||
| (0.002) | ||||||||||
| High-skilled labor | −0.012* | |||||||||
| (0.006) | ||||||||||
| Wage | −0.003 | |||||||||
| (0.003) | ||||||||||
| Minimum wage | 0.004 | |||||||||
| (0.005) | ||||||||||
| Exporter | 0.028*** | |||||||||
| (0.006) | ||||||||||
| Foreign ownership | 0.023 | |||||||||
| (0.015) | ||||||||||
| Demand for training | 0.011** | |||||||||
| (0.006) | ||||||||||
| Skilled labor shortage | −0.006 | |||||||||
| (0.004) | ||||||||||
|
|
||||||||||
| Industry FE | Yes | Yes | Yes | Yes | Yes | Yes | Yes | Yes | Yes | Yes |
| State FE | Yes | Yes | Yes | Yes | Yes | Yes | Yes | Yes | Yes | Yes |
| N | 4242 | 6822 | 3803 | 5978 | 4776 | 6610 | 5616 | 4731 | 5849 | 5849 |
| Adjusted R 2 | 0.028 | 0.043 | 0.041 | 0.042 | 0.043 | 0.042 | 0.047 | 0.042 | 0.042 | 0.042 |
-
Notes: (1) The table reports the OLS regression results for Equation (3). (2) No survey weights are applied. (3) All the independent variables are measured as of year 2014, except for the minimum wage dummy which is taken from the 2015 survey. (4) The independent variables, Employment, Labor productivity, TFP, and Wage, are all in log values. High-skilled labor is the share of employees with a university degree. Minimum wage is a dummy variable that equals one if the plant raised wages due to the minimum wage regulation in 2015. Exporter, Foreign ownership, Demand for training, and Skilled labor shortage are dummy variables for the exporter status, foreign ownership, whether a plant experienced staffing problems that demand for further training, and whether a plant reported skilled workers hard to find, respectively. (5) Both industry (2-digit NACE Rev.2) and federal state fixed effects are included. (6) Standard errors are clustered at the 3-digit NACE Rev.2 level and reported in parentheses. (7) *** p
The correlational findings in Table 5, albeit intriguing, may be viewed as inconclusive given its parsimonious specification. Table 6 then presents the regression results for specifications in which we include simultaneously all the main correlates of robot adoption.[33] In Column (1), plant size, high-skilled labor share, exporter status, and labor shortage measures are estimated significantly and consistent with the baseline results. In Column (2), our preferred specification for the full sample, we further control for a wide array of plant-level characteristics which may potentially impact robot adoption,[34] and the result remains robust. According to the point estimates, a one-standard-deviation difference in log (employment) in 2014, which is 1.6, is associated with a 1.28 %-point difference in the probability of robot adoption. A one-standard-deviation difference in the share of high-skilled labor in 2014, which is 0.19, is associated with a 0.57 %-point (0.19 × (−0.030) ≈ −0.57 %) difference in adoption probability, and being an exporter is associated with a higher adoption probability by 3.0 % points. Compared with the within-sample unconditional probability of robot adoption being around 2.5 % over this period, the effects of plant size, skill composition, and exporter status on robot adoption are quite substantial in their magnitude.
Correlates of robot adoption: Full specification.
| Dependent variable: robot adoption dummy | ||||||
|---|---|---|---|---|---|---|
| Full sample | Manufacturing | Non-manufacturing | ||||
| (1) | (2) | (3) | (4) | (5) | (6) | |
| Employment | 0.010*** | 0.008*** | 0.032*** | 0.024*** | 0.003*** | 0.002 |
| (0.002) | (0.002) | (0.007) | (0.007) | (0.001) | (0.002) | |
| High-skilled labor | −0.025* | −0.030* | −0.139*** | −0.137*** | 0.003 | 0.003 |
| (0.013) | (0.016) | (0.043) | (0.044) | (0.011) | (0.015) | |
| Minimum wage | 0.004 | 0.008 | 0.016 | 0.030* | −0.000 | −0.002 |
| (0.005) | (0.006) | (0.016) | (0.016) | (0.004) | (0.004) | |
| Exporter | 0.032*** | 0.030*** | 0.037*** | 0.037*** | 0.014** | 0.014** |
| (0.007) | (0.006) | (0.013) | (0.012) | (0.006) | (0.006) | |
| Demand for training | 0.016** | 0.016* | 0.038* | 0.032 | 0.008 | 0.010 |
| (0.008) | (0.008) | (0.022) | (0.022) | (0.006) | (0.007) | |
| Skilled labor shortage | −0.010** | −0.008 | −0.009 | −0.003 | −0.009*** | −0.008** |
| (0.005) | (0.005) | (0.013) | (0.014) | (0.003) | (0.003) | |
|
|
||||||
| Other controls | No | Yes | No | Yes | No | Yes |
| Industry FE | Yes | Yes | Yes | Yes | Yes | Yes |
| State FE | Yes | Yes | Yes | Yes | Yes | Yes |
| N | 4698 | 4241 | 1294 | 1231 | 3404 | 3010 |
| Adjusted R 2 | 0.064 | 0.070 | 0.098 | 0.102 | 0.024 | 0.031 |
-
Notes: (1) The table reports the OLS regression results for Equation (3). (2) No survey weights are applied. (3) All the independent variables are measured as of year 2014, except for the minimum wage dummy which is taken from the 2015 survey. (4) The independent variables, Employment and Labor productivity are all in log values. High-skilled labor is the share of employees with a university degree. Minimum wage is a dummy variable which equals one if the plant raised wages due to the minimum wage regulation in 2015. Exporter, Demand for training, and Skilled labor shortage are dummy variables for the exporter status, whether a plant experienced staffing problems that demand for further training, and whether a plant reported skilled workers hard to find, respectively. (5) Other controls are a set of dummy variables for works council, up-to-date technology, process improvement, high competitive pressure, and foreign ownership. (6) Both industry (2-digit NACE Rev.2) and federal state fixed effects are included. (7) Standard errors are clustered at the 3-digit NACE Rev.2 level and reported in parentheses. (8) *** p
Columns (3)–(6) in Table 6 further report the full-specification regression results separately for the manufacturing and non-manufacturing samples. The starkest difference between the manufacturing and non-manufacturing sample results lies in the high-skilled labor share. For the manufacturing sample, this skill composition measure is estimated highly significant with an increased magnitude, as in Columns (3) and (4). A larger share of college-educated employees predicts a much smaller probability of robot adoption in the future. In contrast, this effect is muted in the non-manufacturing sample. According to Columns (5) and (6), there is virtually no correlation between the share of high-skilled labor and adoption. Recall that we have documented earlier that robot users employ a significantly smaller share of high-skilled labor than non-robot-using plants in the manufacturing sector, but that is not the case for the non-manufacturing sector. In light of the findings here, this interesting asymmetry perhaps precedes robot adoption and reflects the differential selection mechanisms of plants into adoption in the two sectors. Beyond this skill composition channel, the association between plant size and adoption is stronger in the manufacturing sector, whereas in the non-manufacturing sector, this association loses statistical significance when additional controls are included as in Column (6). The introduction of minimum wage is identified to be positively correlated with adoption in the manufacturing sector as in Column (4), consistent with the findings in Fan, Hu, and Tang (2021) based on the Chinese firm-level data. In both sectors, exporter status is positively associated with adoption with the manufacturing exporters seeing a larger effect. The robust results on exporter status underscore the role of international trade in robotization: since both plant size and productivity are controlled for, the effect of trade on robot adoption perhaps operates through a channel that goes beyond market size and productivity selection. The labor shortage measures, on the contrary, play a much more prominent role in the non-manufacturing sector. In particular, shortage of skilled labor is strongly associated with a lower probability of adoption. These findings, being correlational in nature, indeed suggest that there can be important differences in the determinants of robot adoption between manufacturing and non-manufacturing plants. For instance, as collaborative robots are used more intensively in the non-manufacturing sector, the elasticity of substitution between robots and human workers may depend on the type of robots and thus be different across sectors.
Because the panel dataset of robot use is based on retrospective questions in the 2019 survey, more than 40 % of the robot adopters in our sample adopted robots in 2018, while the cross-sectional specification has the base year as of 2014. To address this issue, and also to better exploit the timing information of robot adoption, we construct a panel dataset by dividing the sample period equally into two two-year windows. The regression specification is given by
where the base year t is 2014 for the first period and 2016 for the second period and
Table 7 reports the regression results using the panel data. The results confirm all the findings in the cross-sectional specifications for the full sample as well as for the two subsamples. Compared with Table 6, the point estimates for the total employment, the share of high-skilled labor, and exporter status are about half of the cross-sectional estimates with the statistical significance being preserved. This is reassuring because we study the effect of plant-level characteristics on adoption in the two subsequent years in the panel specification as opposed to four subsequent years in the cross-sectional specification.
Correlates of robot adoption: Panel specification.
| Dependent Variable: Robot Adoption Dummy | ||||||
|---|---|---|---|---|---|---|
| Full sample | Manufacturing | Non-manufacturing | ||||
| (1) | (2) | (3) | (4) | (5) | (6) | |
| Employment | 0.005*** | 0.004*** | 0.017*** | 0.012*** | 0.001** | 0.001* |
| (0.001) | (0.001) | (0.003) | (0.003) | (0.001) | (0.001) | |
| High-skilled labor | −0.013*** | −0.016*** | −0.074*** | −0.074*** | 0.001 | 0.001 |
| (0.005) | (0.006) | (0.021) | (0.022) | (0.004) | (0.005) | |
| Minimum wage | 0.002 | 0.004 | 0.008 | 0.015** | −0.000 | −0.001 |
| (0.003) | (0.003) | (0.007) | (0.007) | (0.002) | (0.002) | |
| Exporter | 0.016*** | 0.015*** | 0.017*** | 0.017*** | 0.007* | 0.007* |
| (0.003) | (0.004) | (0.007) | (0.007) | (0.004) | (0.004) | |
| Demand for training | 0.008* | 0.008* | 0.019 | 0.017 | 0.004 | 0.005 |
| (0.004) | (0.004) | (0.013) | (0.013) | (0.003) | (0.003) | |
| Skilled labor shortage | −0.005** | −0.004* | −0.006 | −0.003 | −0.004** | −0.004** |
| (0.002) | (0.002) | (0.007) | (0.007) | (0.002) | (0.002) | |
|
|
||||||
| Other controls | No | Yes | No | Yes | No | Yes |
| Industry-period FE | Yes | Yes | Yes | Yes | Yes | Yes |
| State-period FE | Yes | Yes | Yes | Yes | Yes | Yes |
| N | 10,120 | 9181 | 2814 | 2689 | 7306 | 6492 |
| Adjusted R 2 | 0.038 | 0.041 | 0.059 | 0.061 | 0.020 | 0.024 |
-
Notes: (1) The table reports the OLS regression results for Equation (4) using the panel that consists of two periods: 2015–2016 and 2017–2018. (2) No survey weights are applied. (3) All the independent variables are measured at the beginning of each period, 2014 or 2016, except for the minimum wage dummy which is taken from the 2015 survey. (4) The independent variables, Employment and Labor productivity are all in log values. High-skilled labor is the share of employees with a university degree. Minimum wage is a dummy variable which equals one if the plant raised wages due to the minimum wage regulation in 2015. Exporter, Demand for training, and Skilled labor shortage are dummy variables for the exporter status, whether a plant experienced staffing problems that demand for further training, and whether a plant reported skilled workers hard to find, respectively. (5) Other controls are a set of dummy variables for works council, up-to-date technology, process improvement, high competitive pressure, and foreign ownership. (6) Both industry-period (2-digit NACE Rev.2) and state-period fixed effects are included. (7) Standard errors are clustered at the plant level and reported in parentheses. (8) ***p
To summarize, we empirically document several plant-level correlates of robot adoption. It should be noted that all the findings that we have discussed so far are correlational in nature. Besides a robust association between plant size and robot adoption, we find suggestive evidence of the task-based channel (high-skilled labor share) and the relative factor price channel (minimum wage introduction) of robot adoption in the manufacturing sector. The findings lend support to the existing theoretical framework of robot adoption in the context of Germany.
4 Concluding Remarks
Using a newly collected dataset, we provide the first portrait of the use and adoption of robots at the plant level in Germany. Five stylized facts emerge from our descriptive analysis. First, robot use is still relatively rare. Second, the distribution of robots is highly skewed. Third, plants that adopt robots for the first time contribute substantially to the recent wave of robotization. Fourth, robot users are different from non-users. Fifth, the difference between robot users and non-users hinges on the type of robots in use. We view the stylized facts we document as an integral part of the ongoing investigation of robotization across countries at the microeconomic level. Going beyond the descriptive analysis, we further examine the correlates of robot adoption and document plant size, skill composition, the minimum wage introduction, exporter status, and labor shortage to be correlated with robot adoption in the subsequent years. We also provide evidence of how the association between those plant-level characteristics and robot adoption varies between the manufacturing and non-manufacturing sector.
Our empirical results point to several open questions. First, in light of the existing theories of technology diffusion, it would be of direct theoretical and policy relevance to examine the dynamic diffusion process of robotic technologies at the micro level. Second, it is natural to ask whether the correlates of robot adoption we have documented indeed causally impact plants’ adoption decisions. Micro-level causal evidence in this regard will be highly informative for policymakers. Last, and perhaps most importantly, as the theoretical literature mostly focuses on the medium- and long-run implications of robots on growth and labor share (Ray and Mookherjee 2022), with the continued effort of data collection, we envisage that one would be able to shed light on those important theoretical questions by going beyond the short-term effects of robot adoption.
A Appendix
A.1 Survey Questions
We provide below a word-to-word English translation of the section on robot use in the 2019 IAB Establishment Survey.
Question 77.
Have you used robots over the last 5 years for operational performance or production? [A robot is any automated machine with multiple axes or directions of movement, programmed to perform specific tasks (partially) without human intervention. This includes industrial robots but also service robots. This excludes machine tools, e.g. CNC-machines.] Yes/No.
If so:
How many robots have you used in total over the last five years? An estimation will suffice. If more robots are used in one robot cell, please count them individually. An estimation will suffice. [Interviewer: If “none” enter “0”. Please enter “XXXX” if there is no information possible to single years.]
If in 2018 no use of any robot or no information possible, go to question 81. If there was use of at least one robot in 2018, go to question 78.
Question 78.
If there was use of at least one robot in 2018: How many of the robots used in 2018 were purchased at a price of less than 50,000 Euros? Please – if possible – consider only the purchase price, without any further costs for tools or the integration of the robots into your production circle.
Question 79.
How many of the robots used in 2018 are separated from employees during the regular operations with the help of a protection device, e.g. cage, fence, separate room, light barrier or sensor mat?
Question 80.
How many of the robots used in 2018 did you just purchase in 2018?
A.2 Robotization Premia on the Intensive Margin
In the paper, we have tackled robotization premia on the extensive margin. Since the survey dataset has the robot count at the plant level, we can also examine, within the sample of robot users, robotization premia on the intensive margin. We consider, analogous to Equation (1), the following regression specification:
where log (Robot) is the log number of robots in a given plant in 2018.
Table A1 reports the estimates of β for intensive margin regressions. The upper panel includes industry and state fixed effects and the lower panel includes additionally the plant size control. Since employment is used as a control variable, the point estimate for employment in the lower panel drops out. According to the upper panel, plants that install more robots are larger, have higher labor productivity, and pay higher wages. Column (1) suggests that a 10 % difference in robot stock is associated with a 3.96 % difference in plant size measured by employment. In connection with Fact II, it also implies that the high concentration of robots is likely to be driven by larger plants. However, once plant size is controlled for as in the lower panel, the regression results are inconclusive. We do not find strong evidence of differences in plant-level characteristics other than employment between different robot users.
Robotization premia: The intensive Margin
| Dependent variable | ||||||
|---|---|---|---|---|---|---|
| Employment | Labor productivity | TFP | High-skilled labor | Wage | Exporter | |
| (1) | (2) | (3) | (4) | (5) | (6) | |
| log (Robots) | 0.396*** | 0.073*** | −0.039 | 0.005 | 0.067*** | 0.013 |
| (0.082) | (0.028) | (0.031) | (0.005) | (0.018) | (0.017) | |
| Plant size | No | No | No | No | No | No |
| Industry FE | Yes | Yes | Yes | Yes | Yes | Yes |
| State FE | Yes | Yes | Yes | Yes | Yes | Yes |
| N | 533 | 377 | 210 | 385 | 323 | 501 |
| Adjusted R 2 | 0.437 | 0.320 | 0.375 | 0.335 | 0.458 | 0.311 |
|
|
||||||
| log (Robots) | −0.022 | −0.001 | 0.012 | −0.014 | ||
| (0.037) | (0.005) | (0.014) | (0.019) | |||
| Plant size | Yes | Yes | Yes | Yes | Yes | Yes |
| Industry FE | Yes | Yes | Yes | Yes | Yes | Yes |
| State FE | Yes | Yes | Yes | Yes | Yes | Yes |
| N | 533 | 377 | 210 | 385 | 323 | 501 |
| Adjusted R 2 | 0.437 | 0.376 | 0.375 | 0.357 | 0.552 | 0.341 |
-
Notes: (1) The table reports the OLS regression results for Equation (5). (2) No survey weights are applied. (3) The dependent variables, Employment, Labor productivity, TFP, and Wage, are all in log values. Exporter is a dummy variable. High-skilled labor is the share of employees with a university degree. (4) Both specifications are based on the full sample of robot users in 2018. The first specification includes industry (2-digit NACE Rev.2 industries) and state fixed effects. The second specification includes both fixed effects and plant-level employment (in log). (5) Standard errors are clustered at 3-digit NACE Rev.2 level and reported in parentheses. (6) *** p
Moreover, to study the role of robot heterogeneity in the intensive margin, we incorporate into Equation (5) the share of cage robots and the share of expensive robots and report the estimation results based on the sample of robot users in Table A2. The two new variables enter the regression positively and significantly in Column (1), suggesting the additional plant size premium associated with the use of cage or expensive robots. According to the point estimates, conditional on the plant-level robot stock, a plant that solely uses cage robots is 82.6 % (e 0.602 − 1 ≈ 0.826) larger than a plant that only uses non-cage robots, and a plant that solely uses expensive robots is 57.0 % (e 0.451 − 1 ≈ 0.570) larger than a plant that only uses cheap robots. Consistent with the extensive margin result, a larger share of cage robots to be associated with a higher probability to export.
Robotization premia: Heterogeneity in the intensive margin.
| Dependent variable | ||||||
|---|---|---|---|---|---|---|
| Employment | Labor productivity | TFP | High-skilled labor | Wage | Exporter | |
| (1) | (2) | (3) | (4) | (5) | (6) | |
| log (Robots) | 0.389*** | 0.019 | −0.016 | −0.002 | 0.008 | −0.014 |
| (0.091) | (0.027) | (0.043) | (0.005) | (0.016) | (0.020) | |
| Share of cage robots | 0.602*** | 0.013 | −0.043 | −0.020 | 0.011 | 0.119** |
| (0.163) | (0.105) | (0.185) | (0.020) | (0.077) | (0.055) | |
| Share of expensive robots | 0.451** | 0.030 | 0.018 | −0.007 | −0.048 | 0.005 |
| (0.180) | (0.063) | (0.126) | (0.018) | (0.056) | (0.041) | |
| Plant size | No | Yes | Yes | Yes | Yes | Yes |
| Industry FE | Yes | Yes | Yes | Yes | Yes | Yes |
| State FE | Yes | Yes | Yes | Yes | Yes | Yes |
| N | 493 | 360 | 206 | 362 | 313 | 473 |
| Adjusted R 2 | 0.460 | 0.389 | 0.357 | 0.361 | 0.534 | 0.344 |
-
Notes: (1) This table reports the OLS regression results for Equation (5) with the share of different types of robots being incorporated. (2) No survey weights are applied. (3) The dependent variables, Employment, Labor productivity, TFP, and Wage, are all in log values. Exporter is a dummy variable. High-skilled labor is the share of employees with a university degree. (4) All regressions are based on the full sample (both manufacturing and non-manufacturing plants included) and include both 2-digit NACE Rev.2 industry and federal state fixed effects and the employment count (in log) as controls. (5) Standard errors are clustered at 3-digit NACE Rev. 2 level and reported in parentheses. (6) *** p
A.3 Additional Figures
See Figures A1–A4.
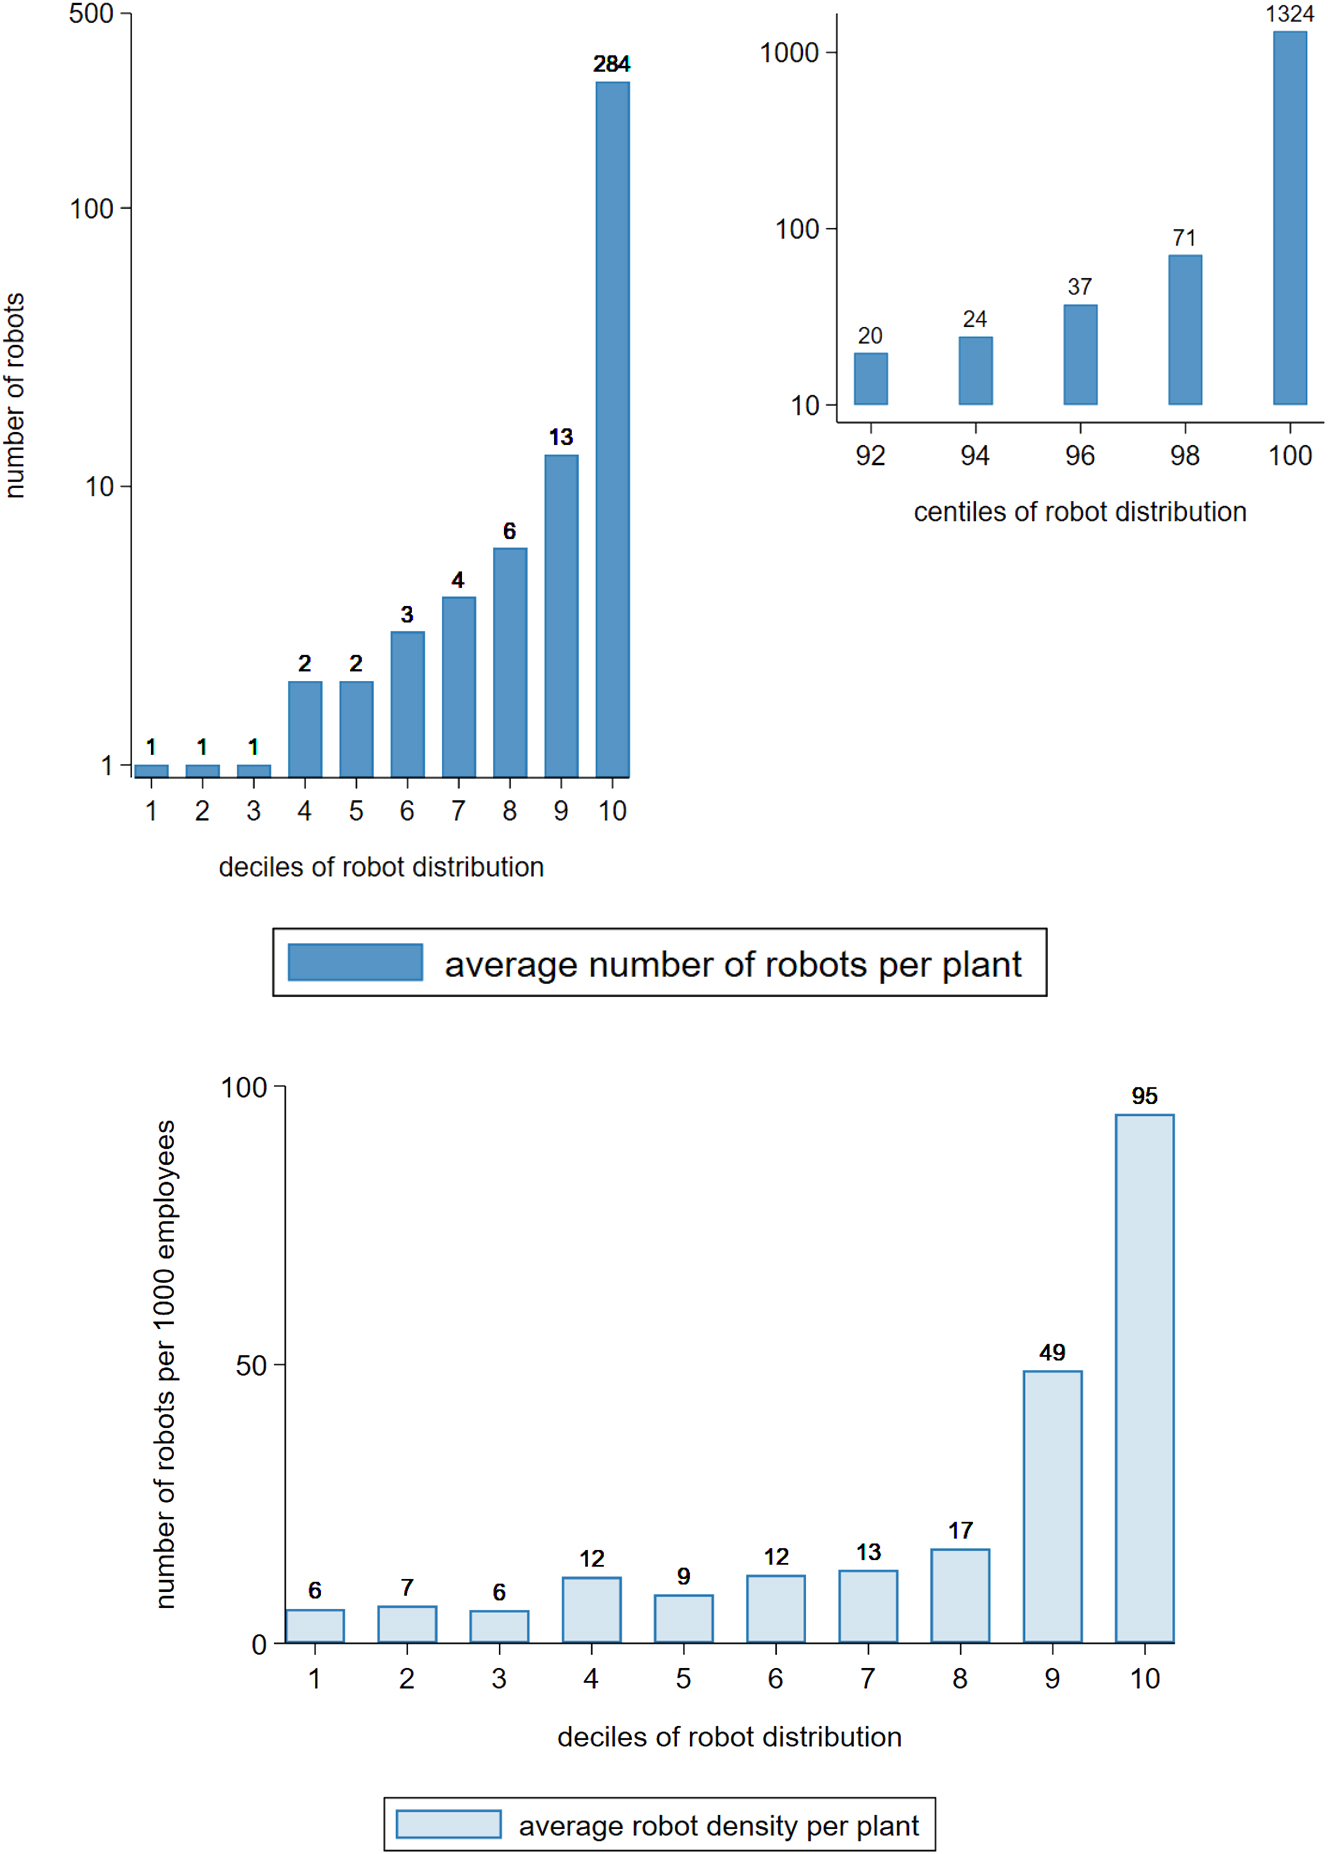
Distribution of robots in manufacturing in 2018 (without survey weights). Notes: (1) We sort plants by the number of robots reported in 2018. For plants with the same number of robots, they are randomly sorted (a further sorting by plant-level attributes like plant size could artificially skew the distribution of robot intensity). The same sorting is applied to both panels. (2) No survey weights are applied. (3) Average robot count or robot density (measured by robot count per 1000 employees) is calculated within each decile or bi-centile and rounded to the closest integer. (4) Due to skewness of the distribution, the first panel is plotted in log scale.
Share of robot users: 2014 versus 2018 (without survey weights). Notes: (1) No survey weights are applied. (2) A plant is identified as a robot user in 2018 if it answered yes to the question of whether it used robots from 2014 to 2018 and its robot stock in 2018 was not zero. (3) The estimated share of robot users in 2014 is the product of the share of robot users in 2018 and the share of plants reporting a positive robot stock in 2014 in the robot users in 2018 reporting a non-missing robot stock in 2014. (4) The industries included in the figure are based on the 2-digit IAB establishment panel survey classification (aggregated from 2-digit NACE Rev.2 industries). Due to very few observations of robot users, the following industries are combined into a residual manufacturing category: textiles/clothing, repair/installation, precision/optical equipment, and chemical/pharmaceutical.
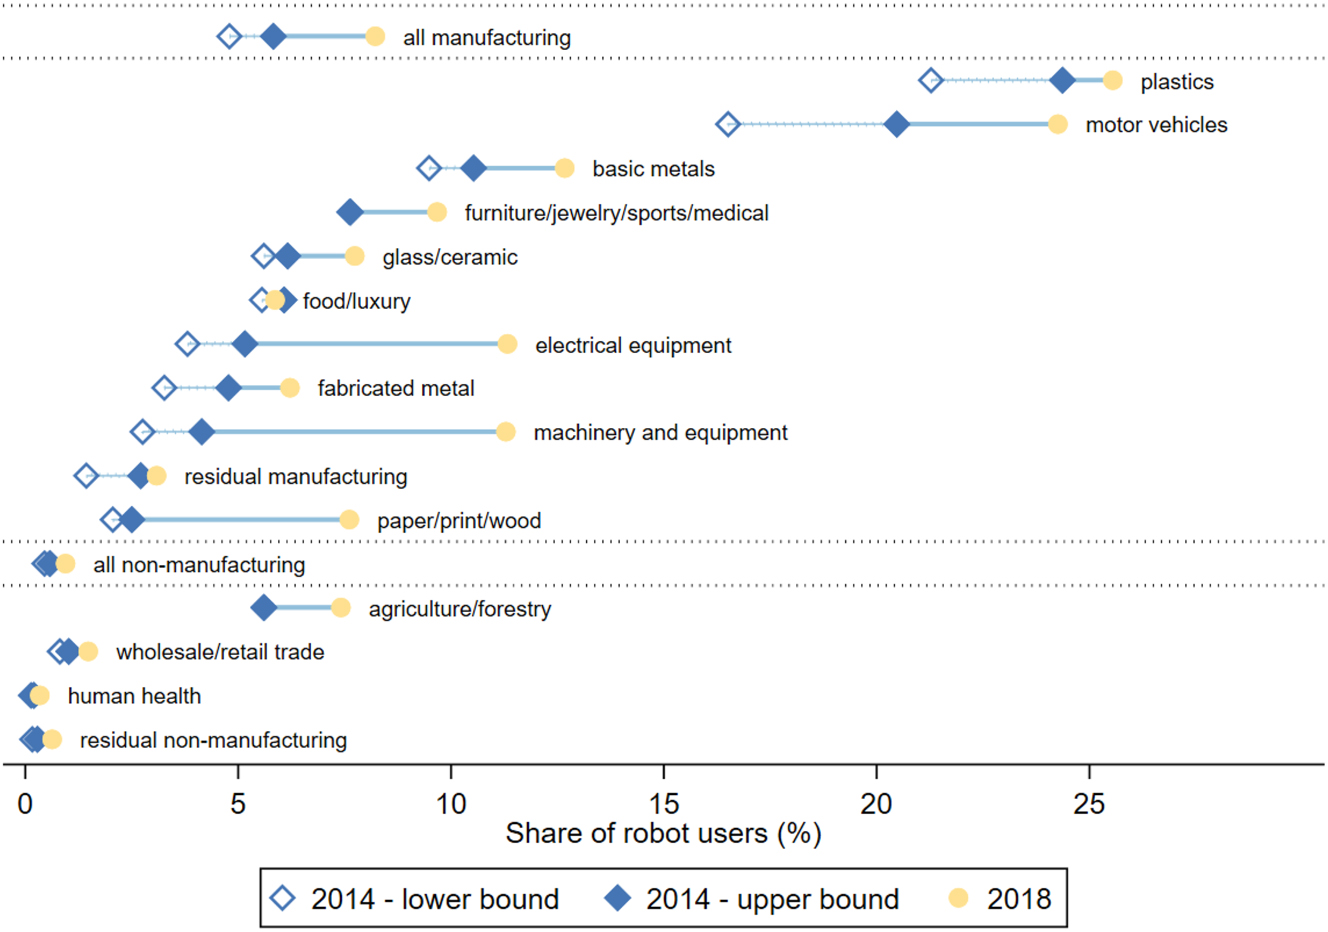
Share of robot users: 2014 versus 2018 (lower and upper bounds). Notes: (1) Survey weights in 2018 are applied. (2) A plant is identified as a robot user in 2018 if it answered yes to the question of whether it used robots from 2014 to 2018 and its robot stock in 2018 was not zero. (3) The lower bound for the share of robot users in 2014 is based on the share of plants stating their robot stock being positive in 2014, assuming missing values to be zero. (4) The upper bound for the share of robot users in 2014 is based on the share of plants stating their robot stock being positive in 2014, assuming missing values to be positive, such that these plants with missing robot stock are counted as robot users in 2014. (5) The industries included in the figure are based on the 2-digit IAB establishment panel survey classification (aggregated from 2-digit NACE Rev.2 industries). Due to very few observations of robot users, the following industries are combined into a residual manufacturing category: textiles/clothing, repair/installation, precision/optical equipment, and chemical/pharmaceutical.
Decomposition of growth in robot stock (without survey weights). Notes: Calculations are based on the surveyed plants that reported their robot use in each year from 2014 to 2018. (2) No survey weights are applied. (3) For each industry (sector), the contribution of the robot adopters to growth is defined as the ratio of the total robot stock of robot adopters in 2018 to the robot stock aggregated over the existing users in 2014. The contribution of the robot users to growth is defined as the percentage change of the aggregate robot stock from 2014 to 2018 for the plants that already used robots in 2014. (4) The industries included in the figure are based on the 2-digit IAB Establishment Panel Survey classification (aggregated from 2-digit NACE Rev.2 industries). Due to very few observations of robot users, the following industries are combined into a residual manufacturing category: textiles/clothing, repair/installation, precision/optical equipment, and chemical/pharmaceutical.
References
Acemoglu, Daron, Claire Lelarge, and Restrepo Pascual. 2020. “Competing with Robots: Firm-Level Evidence from France.” AEA Papers and Proceedings 110: 383–8. https://doi.org/10.1257/pandp.20201003.Suche in Google Scholar
Acemoglu, Daron and Pascual Restrepo. 2018. “The Race between Man and Machine: Implications of Technology for Growth, Factor Shares, and Employment.” The American Economic Review 108 (6): 1488–542.10.1257/aer.20160696Suche in Google Scholar
Acemoglu, Daron, and Pascual Restrepo. 2020. “Robots and Jobs: Evidence from US Labor Markets.” Journal of Political Economy 128 (6): 2188–244. https://doi.org/10.1086/705716.Suche in Google Scholar
Acemoglu, Daron, and Pascual Restrepo. 2022. “Demographics and Automation.” The Review of Economic Studies 89 (1): 1–44. https://doi.org/10.1093/restud/rdab031.Suche in Google Scholar
Aghion, Philippe, Céline Antonin, Simon Bunel, and Xavier Jaravel. 2020. “What Are the Labor and Product Market Effects of Automation? New Evidence from France.” CEPR Discussion Paper 14443.Suche in Google Scholar
Alguacil, Maite, Alessia Lo Turco, and Inmaculada Martínez-Zarzoso. 2022. “Robot Adoption and Export Performance: Firm-Level Evidence from Spain.” Economic Modelling 114: 105912. https://doi.org/10.1016/j.econmod.2022.105912.Suche in Google Scholar
Artuc, Erhan, Paulo Bastos, and Bob Rijkers (2020). “Robots, Tasks, and Trade.” CEPR Discussion Paper 14487.Suche in Google Scholar
Ballestar, María Teresa, Ángel Díaz-Chao, Jorge Sainz, and Joan Torrent-Sellens. 2020. “Knowledge, Robots and Productivity in SMEs: Explaining the Second Digital Wave.” Journal of Business Research 108: 119–31. https://doi.org/10.1016/j.jbusres.2019.11.017.Suche in Google Scholar
Barth, Erling, Marianne Roed, Pål Schøne, and Janis Umblijs. 2020. “How Robots Change Within-Firm Wage Inequality.” IZA Discussion Paper 13605.10.2139/ssrn.3679011Suche in Google Scholar
Bechmann, Sebastian, Nikolai Tschersich, Peter Ellguth, Susanne Kohaut, and Elisabeth Baier. 2019. “Technical Report on the IAB Establishment Panel.” FDZ-Methodenreport.Suche in Google Scholar
Benhabib, Jess, and Aldo Rustichini. 1991. “Vintage Capital, Investment, and Growth.” Journal of Economic Theory 55 (2): 323–39. https://doi.org/10.1016/0022-0531(91)90043-4.Suche in Google Scholar
Benmelech, Efraim and Michał Zator (2021). “Robots and Firm Investment.” Working Paper.10.3386/w29676Suche in Google Scholar
Bernard, Andrew B, J Bradford Jensen, J Redding Stephen, and K Schott Peter. 2007. “Firms in International Trade.” The Journal of Economic Perspectives 21 (3): 105–30. https://doi.org/10.1257/jep.21.3.105.Suche in Google Scholar
Bernard, Andrew B, J Bradford Jensen, J Redding Stephen, and K Schott Peter. 2018. “Global Firms.” Journal of Economic Literature 56 (2): 565–619. https://doi.org/10.1257/jel.20160792.Suche in Google Scholar
Bessen, James E, Maarten Goos, Anna Salomons, and Wiljan Van den Berge. 2019. “Automatic Reaction – what Happens to Workers at Firms that Automate.” Working Paper.10.2139/ssrn.3328877Suche in Google Scholar
Bloom, Nicholas, Tarek Alexander Hassan, Aakash Kalyani, Josh Lerner, and Ahmed, Tahoun. 2021. “The Diffusion of Disruptive Technologies.” NBER Working Paper 28999.10.2139/ssrn.3880232Suche in Google Scholar
Bonfiglioli, Alessandra, Rosario Crino, Harald Fadinger, and Gino Gancia. 2019. “Robots Imports and Firm-Level Outcomes.” CEPR Discussion Paper 14593.10.2139/ssrn.3744604Suche in Google Scholar
Borjas, J. George, and Richard B. Freeman. 2019. “From Immigrants to Robots: The Changing Locus of Substitutes for Workers.” RSF: The Russell Sage Foundation Journal Of the Social Sciences 5 (5): 22–42.10.7758/rsf.2019.5.5.02Suche in Google Scholar
Bossler, Mario, Gregor Geis, and Jens Stegmaier. 2018. “Comparing Survey Data with an Official Administrative Population: Assessing Sample-Selectivity in the IAB Establishment Panel.” Quality and Quantity 52 (2): 899–920. https://doi.org/10.1007/s11135-017-0495-6.Suche in Google Scholar
Bossler, Mario, and Hans-Dieter Gerner. 2020. “Employment Effects of the New German Minimum Wage: Evidence from Establishment-Level Microdata.” ILR Review 73 (5): 1070–94. https://doi.org/10.1177/0019793919889635.Suche in Google Scholar
Boucekkine, Raouf, Marc Germain, and Omar Licandro. 1997. “Replacement Echoes in the Vintage Capital Growth Model.” Journal of Economic Theory 74 (2): 333–48. https://doi.org/10.1006/jeth.1996.2265.Suche in Google Scholar
Caliendo, Marco, Linda Wittbrodt, and Carsten Schröder. 2019. “The Causal Effects of the Minimum Wage Introduction in Germany–an Overview.” German Economic Review 20 (3): 257–92. https://doi.org/10.1111/geer.12191.Suche in Google Scholar
Cheng, Hong, Ruixue Jia, Dandan Li, and Hongbin Li. 2019. “The Rise of Robots in China.” The Journal of Economic Perspectives 33 (2): 71–88. https://doi.org/10.1257/jep.33.2.71.Suche in Google Scholar
Chiacchio, Francesco, Georgios Petropoulos, and David Pichler. 2018. “The Impact of Industrial Robots on EU Employment and Wages: A Local Labour Market Approach”. Bruegel Working Paper.Suche in Google Scholar
Dauth, Wolfgang, Sebastian Findeisen, Jens Suedekum, and Nicole Woessner. 2021. “The Adjustment of Labor Markets to Robots.” Journal of the European Economic Association 19 (6): 3104–53. https://doi.org/10.1093/jeea/jvab012.Suche in Google Scholar
Deng, Liuchun, Verena Plümpe, and Jens Stegmaier. 2020. “Robot Adoption at German Plants.” IWH Discussion Paper 19.Suche in Google Scholar
Dinlersoz, Emin and Zoltan Wolf. 2018. “Automation, Labor Share, and Productivity: Plant-Level Evidence from US Manufacturing.” Working Paper.Suche in Google Scholar
Dixon, Jay, Bryan Hong, and Lynn Wu. 2021. “The Robot Revolution: Managerial and Employment Consequences for Firms.” Management Science 67 (9): 5586–605. https://doi.org/10.1287/mnsc.2020.3812.Suche in Google Scholar
Domini, Giacomo, Marco Grazzi, Daniele Moschella, and Tania Treibich. 2021. “Threats and Opportunities in the Digital Era: Automation Spikes and Employment Dynamics.” Research Policy 50 (7): 104137. https://doi.org/10.1016/j.respol.2020.104137.Suche in Google Scholar
Faber, Marius. 2020. “Robots and Reshoring: Evidence from Mexican Labor Markets.” Journal of International Economics 127: 103384. https://doi.org/10.1016/j.jinteco.2020.103384.Suche in Google Scholar
Fan, Haichao, Yichuan Hu, and Lixin Tang. 2021. “Labor Costs and the Adoption of Robots in China.” Journal of Economic Behavior & Organization 186: 608–31. https://doi.org/10.1016/j.jebo.2020.11.024.Suche in Google Scholar
Fernandez-Macias, Enrique, David Klenert, and Jose-Ignacio Anton. 2021. “Not So Disruptive yet? Characteristics, Distribution and Determinants of Robots in Europe.” Structural Change and Economic Dynamics 58: 76–89. https://doi.org/10.1016/j.strueco.2021.03.010.Suche in Google Scholar
Furusawa, Taiji, Shoki Kusaka, and Yoichi Sugita (2022). “The Impacts of AI, Robots, and Globalization on Labor Markets: Analysis of a Quantitative General Equilibrium Trade Model.” In Robots and AI, edited by Lili Yan Ing and Grossman Gene M, 123–49. London: Routledge.10.4324/9781003275534-5Suche in Google Scholar
Graetz, Georg, and Guy Michaels. 2018. “Robots at Work.” The Review of Economics and Statistics 100 (5): 753–68. https://doi.org/10.1162/rest_a_00754.Suche in Google Scholar
Hirvonen, Johannes, Aapo Stenhammar, and Joonas Tuhkuri. 2022. “New Evidence on the Effect of Technology on Employment and Skill Demand.” Working Paper.10.2139/ssrn.4081625Suche in Google Scholar
Humlum, Anders. 2019. “Robot Adoption and Labor Market Dynamics.” Working Paper.10.5089/9781513519265.001Suche in Google Scholar
Klenert, David, Enrique Fernandez-Macias, and José-Ignacio Antón. 2023. “Do Robots Really Destroy Jobs? Evidence from Europe.” Economic and Industrial Democracy 44 (1): 280–316.10.1177/0143831X211068891Suche in Google Scholar
Koch, Michael, Ilya Manuylov, and Marcel Smolka. 2021. “Robots and Firms.” The Economic Journal 131: 2553–84. https://doi.org/10.1093/ej/ueab009.Suche in Google Scholar
Krenz, Astrid, Klaus Prettner, and Holger Strulik. 2021. “Robots, Reshoring, and the Lot of Low-Skilled Workers.” European Economic Review 136: 103744. https://doi.org/10.1016/j.euroecorev.2021.103744.Suche in Google Scholar
Müller, Steffen. 2017. “Capital Stock Approximation with the Perpetual Inventory Method: An Update.” FDZ-Methodenreport 5.Suche in Google Scholar
Plümpe, Verena, and Jens Stegmaier. 2023. “Micro Data on Robots from the IAB Establishment Panel.” Journal of Economics and Statistics 243 (3–4): 397–413.10.1515/jbnst-2022-0045Suche in Google Scholar
Raj, Manav, and Robert Seamans. 2018. “Artificial Intelligence, Labor, Productivity, and the Need for Firm-Level Data.” In The Economics of Artificial Intelligence: An Agenda, edited by Ajay Agrawal, Joshua Gans, and Avi Goldfarb, 553–65. Chicago: University of Chicago Press.10.7208/chicago/9780226613475.003.0022Suche in Google Scholar
Ray, Debraj, and Dilip Mookherjee. 2022. “Growth, Automation, and the Long-Run Share of Labor.” Review of Economic Dynamics 46: 1–26. https://doi.org/10.1016/j.red.2021.09.003.Suche in Google Scholar
Rodrigo, Rodimiro. 2022. “Robot Adoption, Organizational Capital, and the Productivity Paradox.” Working Paper.10.5465/AMPROC.2023.16171abstractSuche in Google Scholar
Sostero, Matteo (2020). “Automation and Robots in Services: Review of Data and Taxonomy.” Working Paper.Suche in Google Scholar
Stapleton, Katherine and Michael Webb (2020). “Automation, Trade and Multinational Activity: Micro Evidence from Spain.” Working Paper.10.2139/ssrn.3681143Suche in Google Scholar
Stiebale, Joel, Jens Suedekum, and Nicole Woessner (2020). “Robots and the Rise of European Superstar Firms.” CEPR Discussion Paper.Suche in Google Scholar
de Vries, J. Gaaitzen, Elisabetta Gentile, Sébastien Miroudot, and Konstantin M. Wacker. 2020. “The Rise of Robots and the Fall of Routine Jobs.” Labour Economics 66: 101885. https://doi.org/10.1016/j.labeco.2020.101885.Suche in Google Scholar
Zator, Michał. 2019. “Digitization and Automation: Firm Investment and Labor Outcomes.” Working Paper.10.2139/ssrn.3444966Suche in Google Scholar
Zolas, Nikolas, Zachary Kroff, Erik Brynjolfsson, Kristina McElheran, David N Beede, Cathy Buffington, Nathan, Goldschlag, Lucia Foster, and Emin Dinlersoz (2020). “Advanced Technologies Adoption and Use by US Firms: Evidence from the Annual Business Survey.” NBER Working Paper 28290.10.3386/w28290Suche in Google Scholar
© 2023 the author(s), published by De Gruyter, Berlin/Boston
This work is licensed under the Creative Commons Attribution 4.0 International License.
Artikel in diesem Heft
- Frontmatter
- Editorial
- Editorial: 2023 Best Paper Award
- Original Articles
- Time Scales of the Low-Carbon Transition: A Data-Driven Dynamic Multi-Sector Growth Model
- Robot Adoption at German Plants
- Literature Review
- The Nexus of COVID-19 and Climate Change: A Systematic Literature Review
- Data Observer
- The High Frequency Firm Survey “Bundesbank Online Panel – Firms”
- The IWH Forecasting Dashboard: From Forecasts to Evaluation and Comparison