Sexist jokes don’t appear to increase rape proclivity among men high in hostile sexism: Evidence from two pre-registered direct replications of Thomae and Viki (2013)
-
Neil McLatchie
Neil McLatchie was a lecturer in the Social Processes group in the Psychology Department at Lancaster University. His primary research interests included statistical inference and factors affecting pro- and anti-social behaviour, although he also had a keen interest in hypnosis, body perceptions and contributing to open science projects. He recently left academia and today spends more time walking his dog Louis.

 und
Manuela Thomae
und
Manuela Thomae
Manuela Thomae relocated to Germany in 2018 and currently works as a psychologist in a psychiatric hospital, training to become a psychotherapist. In her last academic role she was a Senior Lecturer in Psychology at the University of Winchester, UK, where she taught and researched the Social Psychology of Intergroup Relations.

Abstract
Thomae and Viki (2013) reported that increased exposure to sexist humor can increase rape proclivity among men who score high on measures of Hostile Sexism. Here we report two pre-registered direct replications (Total N = 530) of Study 2 from Thomae and Viki (2013) and assess replicability via (i) statistical significance, (ii) Bayes factors, (iii) a small-telescope approach, and (iv) a mini meta-analysis across the original and replication studies. The original results were not supported by any of the approaches. Combining both the original studies and replications yielded strong evidence in support of the null over the experimental hypothesis (Bayes factor = 0.04). The evidence provided by the current studies therefore suggests sexist jokes do not increase rape proclivity among males high in hostile sexism. We encourage researchers to continue to conduct pre-registered and open research to further understand the potential (lack of) impact of sexist humor in the future.
1 Introduction
Prejudiced norm theory (Ford and Ferguson 2004; Ford et al. 2001) explains the apparent prejudice-releasing function of disparagement humor through several interacting social and psychological processes (e.g., Ford et al. 2008): According to the theory, disparagement humor activates a humorous mindset in the audience. For this non-critical humor mindset to be activated, listeners must interpret and accept the communication as funny and, consequently, not assess the communicated content in a serious or critical manner. Moreover, listeners must interpret the social situation in which disparagement humor is presented as tolerant towards the expression of prejudices (Ford and Ferguson 2004). Together, the humor mindset and the interpretation of the social norms increase the likelihood of observers expressing their pre-existing prejudices.
Evidence for the prejudiced norm theory has been established in a long program of empirical research (e.g., Ford 2000; Ford et al. 2001, 2002, 2008). Moreover, in recent years, the research efforts putting prejudiced norm theory to the test have evolved from an initial focus of disparagement humor targeting women (Ford et al. 2008, 2013; Thomae and Viki 2013; Viki et al. 2007) to a wider range of groups (Muslims, gay men, politicians, lawyers; e.g., Ford et al. 2013; Mendiburo-Seguel and Ford 2019; Thomae and Page 2016). An important theoretical development was the finding that disparagement humor particularly harms the attitudes towards groups whom societal attitudes are ambivalent (Ford et al. 2013; Mendiburo-Seguel and Ford 2019). Only for groups occupying a position of normative ambiguity disparagement humor increases the acceptability of prejudice expressed against the group (e.g., Muslims, Ford et al. 2013; gay men, Mendiburo-Seguel and Ford 2019). For groups generally perceived without ambiguity (e.g., terrorists, Ford et al. 2013; politicians, Mendiburo-Seguel and Ford 2019), adopting a humor mindset does not seem to increase the expression of prejudices against them.
Arguably, women have been a societal group viewed with normative ambiguity (see Glick and Fiske 1996, 2001) and sexist humor has been linked to men’s rape myth acceptance (Viki et al. 2007), decreased attributions of sexism (Mallett et al. 2016) and the triggering of self-objectification among women (Ford et al. 2015). But can simply reading a series of sexist jokes enhance the reader’s self-reported likelihood of engaging in hypothetical acts of rape? A number of studies suggests so (Romero-Sánchez et al. 2010; Thomae and Viki 2013; Viki et al. 2007). These studies report that, after being presented with a series of sexist jokes, men report an increased willingness to engage in hypothetical acts of rape. That is, sexist humor increases self-reported rape proclivity (Malamuth 1981).
Furthermore, research has identified several moderators for this effect. Thomae and Viki (2013; TV2) had participants complete a measure of hostile sexism (HS; Glick and Fiske 1996) before asking them to read a series of jokes. In the sexist humor condition, participants read four sexist jokes (e.g., “Q. Why do women have small feet? A. So they can get closer to the sink!”) and one non-sexist joke (e.g., “Q. Why was the leper stopped for speeding? A. He couldn’t take his foot off the accelerator!”), while participants in the control condition read four non-sexist jokes and one sexist joke. The study then measured the participants’ self-reported proclivity towards committing hypothetical acts of rape and found that rape proclivity increased following exposure to sexist jokes, but only for men high in HS. Likewise, Viki et al. (2007) also reported that rape proclivity increased, but only when the rape victim was an acquaintance (versus a stranger). Romero-Sanchez et al. (2010) found the effect only when the reader did not have an aversive response to the joke. More recently, Romero-Sánchez et al. (2017) extended this research by demonstrating that anti-female sexist humor enhanced rape proclivity especially when the joke was told by a woman rather than a man. If accurate, these results suggest that merely reading a series of sexist jokes can increase the willingness of some men to engage in acts of rape, at least in some situations having what researchers have called “devastating” consequences (p. 12, Thomae and Pina 2015). Support for the auxiliary hypothesis that sexist humor increases rape proclivity, especially for men high in hostile sexism, is thought to corroborate the prejudiced norm theory (Romero-Sánchez et al. 2010; Thomae and Viki 2013).
Science is a cumulative process, and replicability is a core feature of a thriving field of science. Yet, large-scale replication efforts have highlighted the difficulty of reproducing psychological findings (Open Science Collaboration 2015). The literature investigating the impact of sexist humor on rape proclivity includes a number of successful internal and direct replications (e.g., Romero-Sánchez et al. 2010; Thomae and Viki 2013, Study 3). However, to our knowledge, there has been no attempted pre-registered replications of the effect. Pre-registration requires experimenters to specify their hypotheses, materials, and analytic plan prior to recruitment. Furthermore, studies that do not obtain support for the experimental hypothesis will often remain unpublished (the file-drawer problem; Rosenthal 1979) which can result in the field overestimating the size of the effect if one exists. We therefore conducted two pre-registered replications of Thomae and Viki (2013, Study 2; hereafter referred to as TV2).
To our knowledge, there have been two direct replications of TV2. In their third study, Thomae and Viki (2013) conducted a replication while controlling for the sexual content of the jokes. They reported that the significant interaction between joke condition and HS replicated successfully, although the main effect of joke condition was no longer significant. Additionally, Romero-Sanchez et al. (2010) attempted to replicate the study using jokes from the Escala de Apreciación Humor (Humor Appreciation Scale; Carretero-Dios et al. 2009), and while they concluded that sexist jokes were shown to enhance rape proclivity relative to non-sexist control jokes, they failed to replicate the interaction between joke condition and hostile sexism. However, sensitivity analyses indicate that Romero-Sanchez et al. (2010) only had sufficient power to detect medium to large effect sizes, and so might not have been sufficiently powered to detect the interaction effect.
Our first replication used identical materials to TV2, while the second replication used updated jokes based on a recent pilot study conducted to ensure that the jokes were considered equally funny and sexist to a contemporary sample. We report how we determined our sample sizes, all data exclusions, all manipulations, and all measures used in the studies. Experimental pre-registrations, data and code are available on the Open Science Framework (https://osf.io/7g3t2/).
2 Deviations from original study
The original study reported using a 7-point Likert scale to measure how funny and sexist participants considered the jokes, but reviewing the original dataset showed they had in fact used a 9-point Likert scale (this has been confirmed by the first author of TV2, an author on the current article). This was only noticed after the completion of the replication studies. We have therefore scaled the results accordingly whenever the original study’s results were used to model the experimental hypotheses when calculating Bayes factors.
While Replication 1 used otherwise identical materials to the original study, Replication 2 deviated in several ways. First, we used the full Social Desirability Scale (Crowne and Marlowe 1960) instead of the five items used by TV2 (items: 6, 12, 21, 28, 30) as we felt using the full validated and reliable measure of SDS would be a better measure than the selection of items used in both the original study and Replication 1. The first author of TV2 confirmed prior to data collection that this change was not expected to impact the results. Second, while the jokes used in Replication 1 were identical to those used by TV2 (originally used by Ford 2000, and Ford et al. 2001), Replication 2 used different jokes (see Appendix A for all jokes used in the current studies). These jokes were selected based on the results of a recent pilot study conducted by the lead author of TV2, in an effort to ensure that the jokes used across conditions were considered equally funny but that the sexist jokes were considered to be more sexist. We updated the jokes for Replication 2 as the pilot study for the original jokes had been conducted approximately 15 years prior (Thomae 2004).
3 Deviations from pre-registration
3.1 Replication 1
For Replication 1, we preregistered[1] that Bayes factors would be calculated for results that TV2 interpreted as support for the null hypothesis using the room-to-move heuristic[2] (see tutorial by Dienes 2019, for details) to model the experimental hypothesis. However, the room-to-move heuristic is appropriate when comparing mean differences, so for regression analyses we in fact used its equivalent, the ratio-of-scales heuristic,[3] to calculate Bayes factors whenever TV2 inferred evidence for the null hypothesis.
For Replication 1, we pre-registered that we would stop recruiting at 220 participants unless any of the key tests were inconclusive, and that we would then recruit in batches of 10 until either all three Bayes factors were >3 or <0.33, or until we had recruited a further 50 participants, whichever came first. The use of Bayes factors permits such optional stopping (Rouder 2014). However, as we had the resources available, we instead opted to immediately recruit a further 50 participants prior to conducting further analyses. Sequential analysis – checking the Bayes factors after every 10 of the new participants – confirmed that we would have had to recruit the additional 50 participants, as at least one of the key Bayes Factors was inconclusive every 10 participants.
3.2 Replication 2
There were no deviations from the pre-registration for Replication 2.
4 Analyses
Bayes factors were conducted to determine whether the results of the replication studies supported the experimental hypotheses (H1, modelled using the raw effect sizes reported by TV2) or the null hypothesis (H0, modelled assuming effect size = 0). Bayes factors provide a continuous measure of how probable the obtained data are under one hypothesis relative to another. Bayes factors >3 or <0.33 were interpreted as “moderate” evidence for the experimental hypothesis and null hypothesis respectively, and Bayes factors >10 or <0.10 were interpreted as strong evidence for the experimental hypothesis and null hypothesis respectively. Bayes factors between 0.33 and 3 were interpreted as weak and inconclusive. Bayes factors are a continuous measure, and we report these thresholds only to make transparent the decision criteria used throughout the replication studies. The result of the Bayes factor depends on the specific models used to represent the hypotheses, and so we also report robustness regions to indicate the smallest and largest effect size that could be used to model H1 and still yield the same conclusion as the model of H1 used to calculate the reported Bayes factor (for an introduction to the use of robustness regions, see p. 76 McLatchie et al. 2020).
In addition to reporting the results of the pre-registered Bayes factors and significance tests, and in line with other recent replication attempts in social psychology (see e.g., Gervais et al. 2020), we also report the results of a small-telescopes approach and a mini meta-analysis. The small telescopes approach assesses the detectability of effects by retrospectively evaluating the power of the original study to detect the effect sizes obtained by the replications. If an original study lacks sufficient power to detect the replication’s effect size (here, we consider sufficient power to be >0.80), the replication is considered unsuccessful (Simonsohn 2015). We also report the results of a mini meta-analysis of the original study and the two replication studies. The meta-analysis provides the best estimate of the effects from the three studies (we provide the results with and without the original study), and Bayes factors were conducted on the meta-analytic results. The mini meta-analysis serves only to provide an indication as to whether the data from TV2 and the current replication studies relatively support the experimental hypothesis, the null, or are inconclusive, and is not meant to summarize the literature overall.
5 Design
The design of the replications was identical to TV2, with only a few minor exceptions detailed above. A between-subjects design was employed with participants randomly allocated to either the sexist joke condition (4 sexist jokes, 1 non-sexist joke) or the control joke condition (4 non-sexist jokes, 1 sexist joke) using the online research suite Qualtrics (www.Qualtrics.com). Participants for both replications were recruited via Amazon’s Mechanical Turk online recruitment pool (www.mturk.com; see Paolacci et al. 2010). The replications took approximately 10–15 min to complete, and participants received $1.25 for their participation.
5.1 Participants
The number of participants required for the replications was calculated following Dienes’s (2015) procedure, which identifies the required sample size to obtain a minimum level of evidence (here, a Bayes factor of 3 in support of either H1 or H0) based on the raw effect size and standard error reported by a prior study (TV2). This process revealed that we would require a minimum of 215 participants. For the significance tests, sensitivity analyses indicated that a sample size of 215 participants would have a power of 0.80.
For Replication 1, we pre-registered that we would recruit 220 participants, but, if the Bayes factors revealed that the key analyses (hostile sexism, joke condition, hostile sexism*joke condition) were inconclusive, we would continue recruitment, checking every 10 participants as to whether the Bayes factors were now >3 or <0.33, with an upper limit of 270 participants. After 220 participants, the data provided extremely strong evidence that HS predicted rape proclivity (b = 0.63, SE = 0.08, p < 0.001, B H(0,0.17) = 3.34 × 10⁹), but the evidence was inconclusive for both joke condition (b = −0.12, SE = 0.15, p = 0.42, B H(0,0.14) = 0.50), and the HS*joke condition interaction (b = −0.16, SE = 0.12, p = 0.63, B H(0,0.14) = 0.46). We therefore recruited a further 50 participants.
For Replication 2, we pre-registered that we would recruit 270 participants.
5.1.1 Replication 1 participants
Two-hundred and seventy participants were recruited. The final sample consisted of 268 male participants (M age = 34.34, SDage = 10.08, range = 18–70), as two participants were excluded due to missing data. Sensitivity analyses indicated that Replication 1 had 0.88 power to detect the HS*joke condition interaction effect reported by TV2.
5.1.2 Replication 2 participants
Two-hundred and seventy-seven[4] participants were recruited. Fifteen participants were excluded for not completing all the experimental questions. The final sample consisted of 262 male participants (M age = 37.26, SDage = 9.97, range = 20–73). Replication 2 had 0.88 power to detect the HS*joke condition interaction effect reported by TV2.
5.2 Procedures and materials
Participants provided informed consent prior to participation in the replications. As in the original study, it was explained to participants that they might be asked to read offensive materials, and that they could exit the study at any time by closing the browser. Participants provided demographic information (sex, age, nationality, their first language), before completing the measure of Social Desirability Bias (Crowne and Marlowe 1960; Cronbach’s alpha for Replication 1 and 2: 0.60, 0.80) and the Ambivalent Sexism Inventory (ASI, Glick and Fiske 1996; Hostile Sexism Cronbach’s alpha for Replication 1 and 2: 0.91, 0.92; Benevolent Sexism Cronbach’s alpha for Replication 1 and 2: 0.87, 0.89). As in TV2, the ASI subscales in both replications positively correlated (Replication 1: r(266) = 0.44, p < 0.001, B H(0,0.36) = 9.34 × 10¹¹; Replication 2: r(260) = 0.27, p < 0.001, B H(0,0.36) = 5,777.52).
Participants were then presented with five jokes. They were asked to rate each joke in terms of how funny and sexist they considered the joke ranging from 1 (“Not at all”) to 7 (“Extremely”). Jokes were presented one at a time in a randomized order. As in TV2, participants in the sexist joke condition read four jokes targeting women and one neutral joke, while participants in the control condition read four neutral jokes and one joke targeting women (see Appendix A). Replication 1 used the same jokes as TV2, whereas Replication 2 used updated jokes that the lead author of the original study provided following a pilot study matching the jokes on how funny, offensive and discriminatory the jokes were considered. Analyses confirmed that both sets of jokes used in each Replication study were considered equally funny (Replication 1: M Control = 3.81, SDControl = 1.82, M Sexist = 3.97, SDControl = 1.66, B H(0,1.56) = 0.18, RR[0.81, >6]; Replication 2: M Control = 3.98, SDControl = 1.35, M Sexist = 4.22, SDControl = 1.35, B H(0,1.56) = 0.29, RR[1.35, >6]), but the sexist jokes were considered more sexist than the control jokes (Replication 1: M Control = 3.63, SDControl = 1.72, M Sexist = 5.05, SDControl = 1.07, B H(0,3.76) = 1.95×10¹³, RR[0.03, >6]; Replication 2: M Control = 3.10, SDControl = 1.57, M Sexist = 3.83, SDControl = 1.30, B H(0,3.76) = 349.83, RR[0.06, >6]). As in the original study, after viewing the five jokes, participants were given the opportunity to write their own joke if they so wished.
Participants were then presented with the five scenarios from the rape proclivity scale developed by Bohner et al. (1998; Cronbach’s alpha for Replication 1 and 2: 0.95, 0.91). Participants were asked to imagine themselves in the same position as the protagonist in a series of date rape scenarios and to report how arousing and enjoyable they would find the scenario, and whether they would have behaved the same way as the protagonist. As in TV2, the latter item was used as the measure of rape proclivity.
Upon completion of the rape proclivity scale, participants were debriefed, thanked for their participation and compensated.
6 Results
The results of the original and replication studies are presented in Table 1.
The results of the original study (TV2) and the current replication studies.
| Predictor | Study | b | 95 % CI [LL, UL] | SE | t |
|---|---|---|---|---|---|
| (Intercept) | TV2 | 1.33 | [0.81, 1.86] | 0.27 | 5.01*** |
| Replication 1 | 2.36 | [2.00, 2.71] | 0.18 | 13.05*** | |
| Replication 2 | 2.23 | [1.49, 2.96] | 0.37 | 5.98** | |
| SDS | TV2 | 0.03 | [−0.09, 0.15] | 0.06 | 0.49 |
| Replication 1 | −0.03 | [−0.11, 0.06] | 0.04 | −0.65 | |
| Replication 2 | −0.05 | [−0.20, 0.01] | 0.08 | −0.63 | |
| BS | TV2 | 0.11 | [0.01, 0.22] | 0.06 | 2.08* |
| Replication 1 | 0.47 | [0.36, 0.58] | 0.06 | 8.31*** | |
| Replication 2 | 0.33 | [0.22, 0.43] | 0.05 | 6.22** | |
| HS | TV2 | 0.17 | [0.08, 0.26] | 0.04 | 3.81*** |
| Replication 1 | 0.49 | [0.39, 0.60] | 0.05 | 9.36*** | |
| Replication 2 | 0.34 | [0.23, 0.44] | 0.05 | 6.22** | |
| Joke type | TV2 | 0.14 | [0.02, 0.26] | 0.06 | 2.24* |
| Replication 1 | −0.02 | [−0.15, 0.11] | 0.07 | −0.24 | |
| Replication 2 | 0.01 | [−0.12, 0.15] | 0.07 | 0.22 | |
| BS*HS | TV2 | 0.05 | [−002, 0.12] | 0.04 | 1.44 |
| Replication 1 | 0.19 | [0.13, 0.26] | 0.03 | 5.96*** | |
| Replication 2 | 0.11 | [0.05, 0.18] | 0.03 | 3.63*** | |
| BS*Joke type | TV2 | −0.02 | [−0.13, 0.09] | 0.05 | −0.32 |
| Replication 1 | −0.01 | [−0.13, 0.10] | 0.06 | −0.26 | |
| Replication 2 | −0.03 | [0.13, 0.08] | 0.05 | −0.49 | |
| HS*Joke type | TV2 | 0.09 | [0.00, 0.18] | 0.05 | 1.99* |
| Replication 1 | −0.12 | [−0.44, −0.03] | 0.05 | −2.29* | |
| Replication 2 | −0.04 | [−0.22, −0.02] | 0.05 | −0.83 | |
| BS*HS*Joke type | TV2 | 0.01 | [−0.06, 0.08] | 0.04 | 0.30 |
| Replication 1 | −0.07 | [−0.14, −0.01] | 0.05 | −2.29* | |
| Replication 2 | −0.03 | [−0.10, 0.03] | 0.03 | −1.04 |
-
Note. Conditions coded as: Sexist joke = 1, Control jokes = −1. SDS, Social Desirability Scale; BS, Benevolent Sexism (mean-centered); HS, hostile sexism (mean-centered), LL and UL indicate the lower and upper limits of the interval respectively. * indicates p < 0.05. ** indicates p < 0.01. *** indicates p < 0.001.
6.1 Replication 1
In contrast to the results reported by TV2, there was moderate evidence for the null hypothesis against a model of H1 predicting a positive raw slope for the interaction between HS and joke condition, B H(0,0.09) = 0.17, RR[0.05, ∞] (see Figure 1, centre panel). Simple slope analyses confirmed that the data provided moderate evidence for the null hypothesis for participants high in HS, b = −0.18, SE = 0.09, p = 0.05, B H(0,0.24) = 0.13, RR[0.09, ∞], although the data were inconclusive for participants low in HS, b = 0.15, SE = 0.11, p = 0.15, B H(0,0.24) = 1.73, RR[0, 1.63]. The data from Replication 1 were inconclusive as to whether joke condition predicted rape proclivity, B H(0,0.14) = 0.36, RR[0,0.15], and whether exposure to sexist jokes (M = 2.36, SD = 1.42) relative to control jokes (M = 2.40, SD = 1.42) enhanced rape proclivity, F(1,265) = 0.04, p = 0.85, η 2 G < 0.001, B H(0,0.26) = 0.57, RR[0, 0.52].
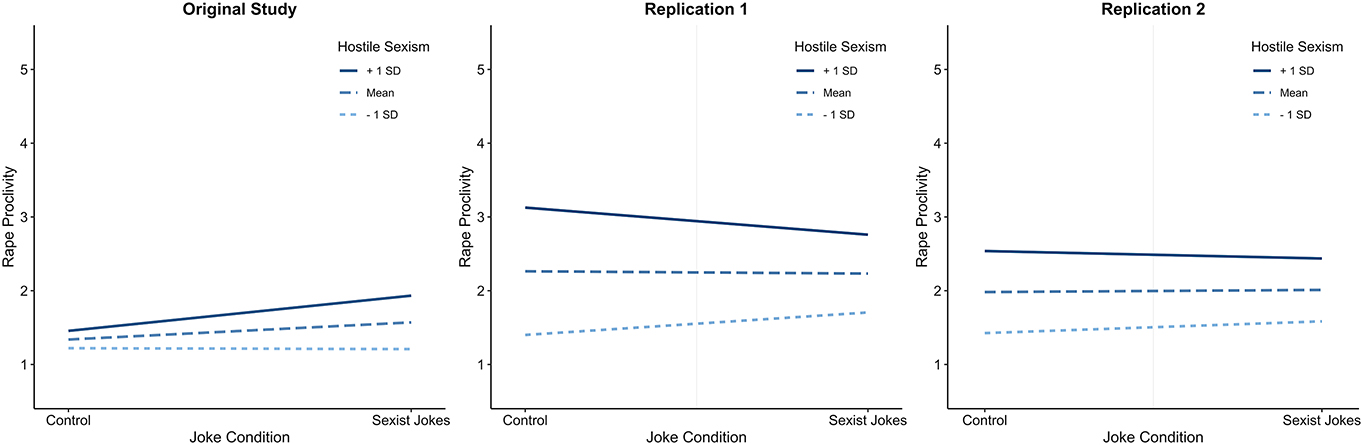
Interaction plots showing the impact of hostile sexism on rape proclivity as a function of joke condition for the original study (left), replication 1 (centre) and replication 2 (right). Created using the R package interactions (Long 2019).
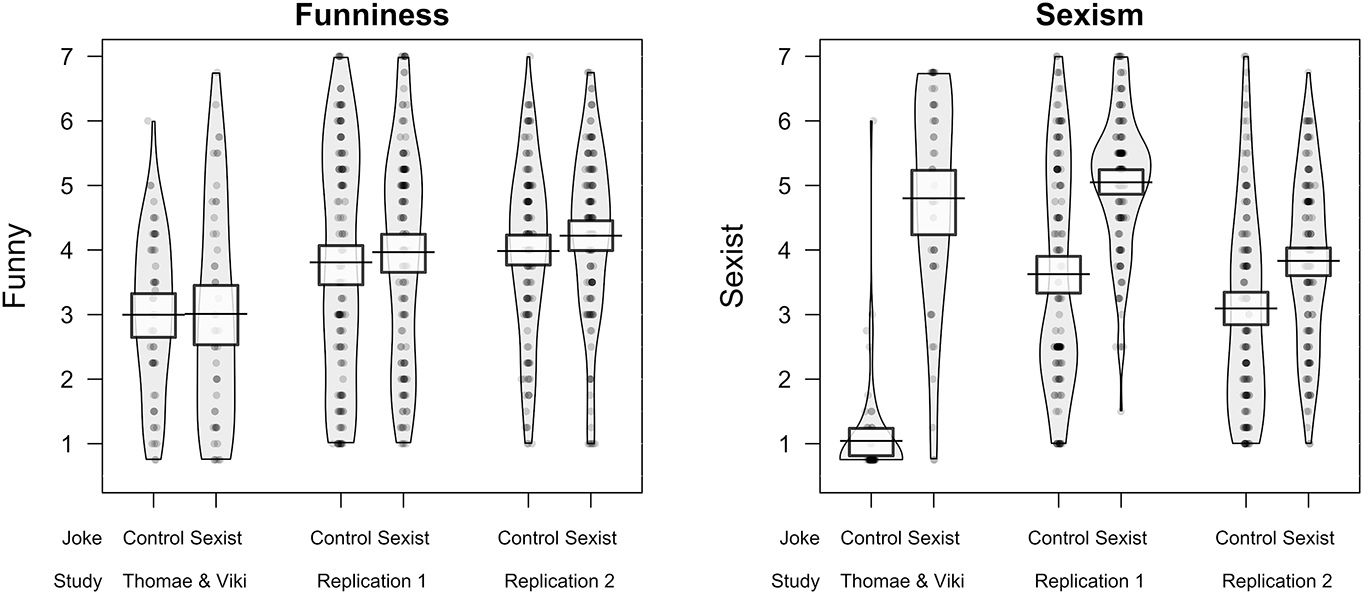
The perceived funniness (left panel) and sexism (right panel) of the sexist and control jokes reported by Thomae and Viki (2013) and the current replication studies. Means (horizontal bars) and 95 % Highest Density Intervals are presented. Created using the R package yarrr (Phillips 2017).
6.1.1 Small telescopes approach
For the key outcome of the HS*joke condition interaction, the original study had a power of 0.30 for the effect size obtained by Replication 1. Furthermore, for the outcome of whether joke condition predicted rape proclivity, the original study had a power of 0.03 for the effect size obtained by Replication 1. The original study would therefore be considered severely under-powered to detect the effect sizes obtained by the current research.
6.2 Replication 2
In contrast to the results reported by TV2, there was moderate evidence for the null hypothesis against the model of H1 that predicted a positive slope for the interaction between hostile sexism and joke condition, B H(0,0.09) = 0.31, RR[0.09, ∞] (see Figures 1 and 2, right panel). Simple slope analyses confirmed that the data provided moderate evidence for the null hypothesis for participants high in HS, b = −0.05, SE = 0.10, p = 0.60, B H(0,0.24) = 0.26, RR[0.18, ∞], although the data were inconclusive for participants low in HS, b = 0.08, SE = 0.11, p = 0.47, B H(0,0.24) = 0.77, RR[0, 0.63]. The data from Replication 2 were inconclusive as to whether joke condition predicted rape proclivity, B H(0,0.14) = 0.50, RR[0, 0.22], and whether exposure to sexist jokes (M = 2.08, SD = 1.22) relative to non-sexist jokes (M = 2.03, SD = 1.19) enhanced rape proclivity, F(1,259) = 0.08, p = 0.77, η 2 G < 0.001, B H(0,0.26) = 0.94, RR[0, 1.80].
6.2.1 Small telescopes approach
For the key outcome of the HS*joke condition interaction, the original study had a power of 0.07 for the effect size obtained by Replication 2. Furthermore, for the outcome of whether joke condition predicted rape proclivity, the original study had a power of 0.03 for the effect size obtained by Replication 2. The original study would therefore be considered severely under-powered to detect the effect sizes obtained by Replication 2.
7 Mini meta-analysis
A mini meta-analysis was conducted with Bayes factors to assess whether the data from all three studies, as well as the two replication studies only, supported the experimental hypothesis or the null hypothesis. As one should not use the results of a study (e.g., the results of TV2) to model H1 for a Bayes factor that assesses results that include that study, the experimental hypothesis was specified using heuristics outlined by Dienes (2019) that provide an approximate prediction for a theory. Using the ratio-of-scales heuristic, the results of the meta-analysis revealed that the results from all three studies indicated that the interaction between joke condition and HS provided strong evidence for the null hypothesis, b Meta = −0.01, SEMeta = 0.03, B H(0,0.5) = 0.04, RR[0.06, ∞], when predicting rape proclivity, and similarly strong support for the null when including only the replications, b Meta = −0.08, SEMeta = 0.04, B H(0,0.5) = 0.02, RR[0.04, ∞]. The effect sizes were also considerably smaller and in the opposite direction than in the original study.
Furthermore, the combined evidence from all three studies was inconclusive as to whether joke condition predicted rape proclivity, b Meta = 0.05, SEMeta = 0.04, B H(0,0.5) = 0.34, RR[0, 0.51], although the evidence from only the replications provided strong support for the null hypothesis, b Meta = −0.005, SEMeta = 0.05, B H(0,0.5) = 0.09, RR[0.13, ∞]. Compared to the results obtained by the original study, the effect sizes were considerably smaller for the meta-analytic results, and in the opposite direction.
8 Exploratory analyses
Here we explore a number of factors that might have affected the outcome of the replications. These analyses were not pre-registered and should be considered exploratory.
8.1 Data quality
The current replications unfortunately did not include attention checks, which may have reduced the validity of the data. However, in line with the original study, after rating the jokes participants were invited to submit their own joke if they wanted to. Some participants responded with irrelevant answers to this question (e.g., prose that appeared to be copied and pasted from another source), although the percentage of participants who responded appropriately to the request to leave their own joke was comparable or larger in Replication 1 (42/268 = 16 %) and Replication 2 (46/262 = 18 %) than in the original study (14/107 = 13 %). Furthermore, removal of those participants who responded incoherently (Replication 1: N = 29, Replication 2: N = 17) made negligible differences to the conclusions, although the Bayes factor for the main effect of joke condition in Replication 2 increased from weak evidence for the null hypothesis, B H(0,0.14) = 0.50, to just moderate evidence for the null hypothesis, B H(0,0.14) = 0.32, using our pre-specified interpretation of the evidence. The only changes to the meta-analytic conclusions drawn after excluding these participants were that the evidence for the null hypothesis increased from just weak (B H(0,0.50) = 0.34) to moderate (B H(0,0.50) = 0.23) when comparing the main effect of joke condition with all three studies included. All other meta-analytic conclusions remained the same.
8.2 English as a first language
In the original study, 56 % of participants were from the UK (N = 60), 10 % were from the USA (N = 11), and 44 % were from other countries (N = 36), whereas in the replications, the majority were from the USA (Replication 1: 65 %, N = 174; Replication 2: 60 %, N = 155), a smaller proportion were from India (Replication 1: 28 %, N = 75; Replication 2: 18 %, N = 47), and no participants were from the UK. As it is possible that non-native English speakers in the current study may have misunderstood the jokes or the instructions due to these differences, we reproduced the analyses after excluding participants that reported English was not their first language (Replication 1 excluded N = 45; Replication 2 excluded N = 39). The pattern of results and inferences drawn were identical for the key analyses with the exception that the HS*joke condition interaction in Replication 2 reduced from moderately favoring H0 according to our pre-specified interpretations (all participants: B H(0,0.09) = 0.31) to only weakly favoring H0 (English as a first language only: b = −0.03, SE = 0.06, p = 0.62, B H(0,0.09) = 0.39). Note that the meta-analysis with non-English speakers removed still indicated that the replications provided strong evidence for the null hypothesis for the interaction between HS and joke condition when all three studies were included, B H(0,0.50) = 0.07, RR[0.10, ∞], and when just including the replication studies, B H(0,0.50) = 0.03, RR[0.05, ∞], and therefore the meta-analytic conclusions remain unchanged.
8.3 Age
There was a significant effect of age across all three studies, with the original study (M = 22.33, SD = 4.57) having recruited a younger sample than either of the replications (Replication 1: M = 34.34, SD = 10.08; Replication 2: M = 37.26, SD = 9.97), F(1,630) = 97.40, p < 0.001, η 2 G = 0.24). However, the same patterns of results were obtained when age was included as a covariate (joke condition: 0.43 < Bs < 0.83; HS*joke condition: 0.15 < Bs < 0.29). The conclusions drawn from the mini meta-analysis did not change when comparing across joke conditions with age included as a covariate (B H(0,0.50) = 0.54), but did reduce the strength of evidence for the interaction from strong (B H(0,0.50) = 0.02) to moderate (B H(0,0.50) = 0.11) evidence for H0 when including only the replication studies.
8.4 Differences in joke ratings
Although Replication 1 used the same jokes as the original study, and Replication 2 used updated jokes based on recent pilot testing, two 2 (condition: control, sexist) x 3 (Experiment: original, replication 1, replication 2) ANOVAs on measures of funniness and sexism indicated that the jokes were evaluated differently in the replications. For ratings of funniness, the interaction was not significant, F(2,627) = 0.16, p = 0.85, η 2 G < 0.001. For ratings of sexism, however, the interaction was significant, F(2,627) = 43.001, p < 0.001, η 2 G = 0.12. As can be seen in Figure 1, while participants in the original study (M = 1.04, SD = 0.82) did not consider the control jokes to be sexist, the participants in the two replication studies perceived the control jokes to be more sexist, scoring mid-way in the scale (Replication 1: M = 3.63, SD = 1.72; Replication 2: M = 3.10, SD = 1.57). This might reflect the increased tendency of participants in the replication studies to respond using the centre of the scale, or it might reflect the tendency of modern samples to perceive neutral stimuli as relatively more sexist. Nonetheless, the reduced differences in perceived sexism in the replications might have impacted on the reduced effects observed in each study. It is possible, for example, that perceiving the jokes as sexist may have prevented participants from activating the humorous mindset (Ford et al. 2001), which might have then reduced the subsequent impact on rape proclivity. However, if this were the case, it is unclear why participants still reported finding the jokes equally funny.
9 Discussion
A series of studies have previously reported that exposure to sexist jokes can enhance rape proclivity among certain men (Romero-Sanchez et al. 2010, 2017; Thomae and Viki 2013; Viki et al. 2007). We attempted two sufficiently powered pre-registered direct replications of one such study, Study 2 by Thomae and Viki (2013), which reported that men who scored high in hostile sexism demonstrated increased proclivity towards rape following exposure to sexist jokes. Neither replication study successfully reproduced the results reported in the original study, and the combined datasets provide evidence for the null hypothesis for all key analyses over the alternative hypothesis.
For the critical test of the interaction between joke condition and hostile sexism, Bayes factors provided strong support for the null hypothesis, as did the evidence from only the replications. Similarly, the key null-hypothesis significance tests were not significant. Although Replication 1 did obtain a significant effect for the interaction between joke condition and HS, it was in the opposite direction to the results reported by TV2. Lastly, the small telescopes approach revealed that the original study was not sufficiently powered to detect the effect sizes obtained by the replications.
In summary, the results of our replication studies do not support the idea that sexist humor releases pre-existing hostile sexist attitudes (see Ford et al. 2008; Martineau 1972), at least not if expressed through self-reported rape proclivity (Bohner et al. 1998). Our findings do not necessarily imply that the interacting social and psychological processes as proposed by prejudiced norm theory no longer apply to the release of sexist prejudices, only that the mechanism investigated and replicated previously (Romero-Sanchez et al. 2010, 2017; Viki et al. 2007) does not seem to be reproducible in the current studies. Future research could investigate whether and where along the explanatory chain of social and psychological processes (levels of pre-existing prejudice, the activation of the non-critical humor mindset, the interpretation of the communication as funny, the non-critical assessment of the humor content, the interpretation of the social context as tolerant of sexism; see Ford 2000; Ford et al. 2008; Ford and Ferguson 2004; Ford et al. 2002; Ford et al. 2001) required for the prejudice-releasing function of sexist humor to take effect, changes may have occurred.
There are several possible reasons why the current replications did not successfully reproduce the findings reported by TV2. It is possible that the samples differed along dimensions we did not measure. For example, Romero-Sanchez et al. (2010) reported that joke condition only impacted on rape proclivity if participants did not find the jokes aversive. Sample differences between the original and the replication studies along such unmeasured moderator variables could explain why the effects did not successfully replicate. Still, using the same methodology as Thomae and Viki (2013), neither of the current replications support the idea that hostile sexism interacts with joke condition to increase men’s rape proclivity.
There was also some evidence that a relatively large minority of our participants did not pay attention to certain questions (e.g., when asked to enter a joke of their own). A weakness of the current replications was that we did not include attention checks to ensure participants were paying attention and answering questions in an appropriate manner, and this could have reduced the validity and reliability of the current results. Future studies should look to include attention checks throughout to ensure the quality of their data (for examples see Curran and Hauser 2019; Meade and Craig 2012). Although the current replications did not include such checks, our exploratory meta-analytic analyses showed that our conclusions were robust even after excluding participants suspected of not paying attention. There was also evidence that, despite our best efforts to match the jokes, the control jokes in the current study were perceived as more sexist than the control jokes in the original study. It is possible that the replications did not reproduce the results because the differences in the perceived sexism of the sexist jokes relative to the control jokes is less.
It is also possible that the effects of sexist humor on rape proclivity have been over-estimated by published findings in the literature. TV2 recruited 107 participants, which, given the average effect size in social psychology (d = 0.43, Richard et al. 2003), suggests the original study was likely underpowered. In conjunction with publication bias, such under-powered studies can result in published studies over-estimating effect sizes because only those studies with sufficiently large effect sizes to obtain significant results get published (resulting in the so-called winner’s curse; Button et al. 2013). Additionally, the p-values reported by TV2 were, despite being significant, relatively large (joke condition: p = 0.03, HS*joke condition: p = 0.05). Such large p-values are more likely under the null hypothesis (which is expected to produce a uniform distribution of p-values) than when genuine effects exist (Simonsohn et al. 2014). Finally, the evidence provided by the original study was relatively weak. Bayes factors show that although TV2 obtained significant results, the evidence in favor of the experimental hypothesis relative to the null was only just moderate for the effect of joke condition (B H(0,0.33) = 3.99, RR[0.04, 0.46]) and was inconclusive for the interaction between joke condition and HS (B H(0,0.33) = 1.85, RR[0, 1.92]).[5]
Regardless of the reasons why the results reported by TV2 did not replicate, we encourage researchers to exercise caution before claiming that brief exposure to sexist humor increases men’s rape proclivity, or that hostile sexism moderates this effect, until further pre-registered and transparent research has been conducted to demonstrate the effect and the social and psychological steps preceding it (see Ford 2000, Ford et al. 2008; Ford and Ferguson 2004; Ford et al. 2002; Ford et al. 2001) are reproducible and can reliably obtained today.
About the authors
Neil McLatchie was a lecturer in the Social Processes group in the Psychology Department at Lancaster University. His primary research interests included statistical inference and factors affecting pro- and anti-social behaviour, although he also had a keen interest in hypnosis, body perceptions and contributing to open science projects. He recently left academia and today spends more time walking his dog Louis.
Manuela Thomae relocated to Germany in 2018 and currently works as a psychologist in a psychiatric hospital, training to become a psychotherapist. In her last academic role she was a Senior Lecturer in Psychology at the University of Winchester, UK, where she taught and researched the Social Psychology of Intergroup Relations.
Acknowledgments
We would like to thank Ella Heskerth for her help designing the replication studies.
Appendix A
Original Study + Replication 1 Jokes
Control Condition Jokes
Psychiatrist: What’s your problem?
Patient: I think I’m a chicken.
Psychiatrist: How long has this been going on?
Patient: Ever since I was an egg!
Q. How do you know when elephants have had sex in your house?
A. The trash can liners are missing!
Q. What’s the difference between a golfer and a skydiver?
A. A golfer goes whack … “Damn!” A skydiver goes “Damn!” … whack.
Q. Why was the leper stopped for speeding?
A. He couldn’t take his foot off the accelerator!
Q. Why are women like carpets?
A. If you lay them properly the first time, you can walk all over them for years.
Sexist Condition Jokes
Q. Why are women like carpets?
A. If you lay them properly the first time, you can walk all over them for years.
Q. Why do women have small feet?
A. So they can get closer to the sink!
Q. How many men does it take to change a light bulb?
A. None, let her do the dishes in the dark.
Q. What is the best thing about a blowjob?
A. Ten minutes’ silence.
Psychiatrist: What’s your problem?
Patient: I think I’m a chicken.
Psychiatrist: How long has this been going on?
Patient: Ever since I was an egg!
Replication 2 Jokes
Control Condition Jokes
Q. Why was the washing machine laughing?
A. Because it was taking the piss out of the pants.
I do not think of Donald Trump as an idiot, OK?
I like to think of him more as an intellectual celibate.
Q: What do a near-sighted gynaecologist and a dog have in common?
A: Wet noses.
When asked for his name by the coffee shop clerk, my brother-in-law answered, “Marc, with a C.” Minutes later, he was handed his coffee with his name written on the side: Cark.
Q. What do a whore and a bungee jumper have in common?
A. They cost the same, last as long, and if the rubber breaks you’re fucked.
Sexist Condition Jokes
Q. What do a whore and a bungee jumper have in common?
A. They cost the same, last as long, and if the rubber breaks you’re fucked.
Q: Is Google male or female?
A: Female, because it doesn’t let you finish a sentence before making a suggestion.
Wife: “I look fat. Can you give me a compliment?”
Husband: “You have perfect eyesight."
Everyone says the world would be better off if it was run by women. Sure, maybe there wouldn’t be violence and territorial conquests fuelled by male testosterone. But instead, we’d have a bunch of jealous countries that aren’t talking to each other.
Q. Why was the washing machine laughing?
A. Because it was taking the piss out of the pants.
References
Bohner, Gerd, Marc‐André Reinhard, Stefanie Rutz, Sabine Sturm, Bernd Kerschbaum & Dagmar Effler. 1998. Rape myths as neutralizing cognitions: Evidence for a causal impact of anti-victim attitudes on men’s self-reported likelihood of raping. European Journal of Social Psychology 28(2). 257–268. https://doi.org/10.1002/(sici)1099-0992(199803/04)28:2<257::aid-ejsp871>3.0.co;2-1.10.1002/(SICI)1099-0992(199803/04)28:2<257::AID-EJSP871>3.0.CO;2-1Suche in Google Scholar
Button, Katherine S., John P. A. Ioannidis, Claire Mokrysz, Brian A. Nosek, Jonathan Flint, Emma S. J. Robinson & Marcus R. Munafò. 2013. Power failure: Why small sample size undermines the reliability of neuroscience. Nature Reviews Neuroscience 14(5). 365–376. https://doi.org/10.1038/nrn3475.Suche in Google Scholar
Carretero-Dios, Hugo, Cristino Pérez & Gualberto Buela-Casal. 2009. Content validity and metric properties of a pool of items developed to assess humor appreciation. Spanish Journal of Psychology 12(2). 773–787. https://doi.org/10.1017/s1138741600002146.Suche in Google Scholar
Crowne, Douglas P. & David Marlowe. 1960. A new scale of social desirability independent of psychopathology. Journal of Consulting Psychology 24(4). 349. https://doi.org/10.1037/h0047358.Suche in Google Scholar
Curran, Paul G. & Kelsey A. Hauser. 2019. I’m paid biweekly, just not by leprechauns: Evaluating valid-but-incorrect response rates to attention check items. Journal of Research in Personality 82. 103849. https://doi.org/10.1016/j.jrp.2019.103849.Suche in Google Scholar
Dienes, Zoltan. 2015. How many participants might I need? Youtube. Available at: https://www.youtube.com/watch?v=10Lsm_o_GRg&t=195s.Suche in Google Scholar
Dienes, Zoltan. 2019. How do I know what my theory predicts? Advances in Methods and Practices in Psychological Science 2(4). 364–377. https://doi.org/10.1177/2515245919876960.Suche in Google Scholar
Ford, Thomas E. 2000. Effects of sexist humor on tolerance of sexist events. Personality and Social Psychology Bulletin 26(9). 1094–1107. https://doi.org/10.1177/01461672002611006.Suche in Google Scholar
Ford, Thomas E. & Mark A. Ferguson. 2004. Social consequences of disparagement humor: A prejudiced norm theory. Personality and Social Psychology Review 8(1). 79–94. https://doi.org/10.1207/s15327957pspr0801_4.Suche in Google Scholar
Ford, Thomas E., Mark A. Ferguson & S. Kalair. 2002. Effects of sexist humor on tolerance of sexist events: The role of normative structure. In Annual conference of the American Sociological Association. Chicago.Suche in Google Scholar
Ford, Thomas E., Christie F. Boxer, Jacob Armstrong & Jessica R. Edel. 2008. More than “just a joke”: The prejudice-releasing function of sexist humor. Personality and Social Psychology Bulletin 34(2). 159–217. https://doi.org/10.1177/0146167207310022.Suche in Google Scholar
Ford, Thomas E., Erin R. Wentzel & Joli Lorion. 2001. Effects of exposure to sexist humor on perceptions of normative tolerance of sexism. European Journal of Social Psychology 31(6). 677–691. https://doi.org/10.1002/ejsp.56.Suche in Google Scholar
Ford, Thomas E., Julie A. Woodzicka, Whitney E. Petit, Kyle Richardson & Shaun K. Lappi. 2015. Sexist humor as a trigger of state self-objectification in women. Humor 28(2). 253–269. https://doi.org/10.1515/humor-2015-0018.Suche in Google Scholar
Ford, Thomas E., Julie A. Woodzicka, Shane R. Triplett & Annie O. Kochersberger. 2013. Sexist humor and beliefs that justify societal sexism. Current Research in Social Psychology 21(7). 64–81.Suche in Google Scholar
Gervais, Will M., Stephanie E. McKee & Sarah Malik. 2020. Do religious primes increase risk taking? Evidence against “Anticipating divine Protection” in two preregistered direct replications of Kupor, Laurin, and Levav (2015). Psychological Science 31(7). 858–864. https://doi.org/10.1177/0956797620922477.Suche in Google Scholar
Glick, Peter & Susan T. Fiske. 1996. The ambivalent sexism inventory: Differentiating hostile and benevolent sexism. Journal of Personality and Social Psychology 70(3). 491. https://doi.org/10.1037/0022-3514.70.3.491.Suche in Google Scholar
Glick, Peter & Susan T. Fiske. 2001. An ambivalent alliance: Hostile and benevolent sexism as complementary justifications for gender inequality. American Psychologist 56(2). 109–118.10.1037/0003-066X.56.2.109Suche in Google Scholar
Long, Jacob A. 2019. Interactions: Comprehensive, User-friendly Toolkit for probing interactions, R package version 1.1.0. Available at: https://cran.r- project.org/package=interactions.10.32614/CRAN.package.interactionsSuche in Google Scholar
Malamuth, Neil M. 1981. Rape proclivity among males. Journal of Social Issues 37(4). 138–157. https://doi.org/10.1111/j.1540-4560.1981.tb01075.x.Suche in Google Scholar
Mallett, Robyn K., Thomas E. Ford & Julie A. Woodzicka. 2016. What did he mean by that? Humor decreases attributions of sexism and confrontation of sexist jokes. Sex Roles 75(5–6). 272–284. https://doi.org/10.1007/s11199-016-0605-2.Suche in Google Scholar
McLatchie, Neil, Lara Warmelink & Daria Tkacheva. 2020. Reply to Mac Giolla and Ly (2019): On the reporting of Bayes factors in deception research. Legal and Criminological Psychology 25(2). 72–79. https://doi.org/10.1111/lcrp.12177.Suche in Google Scholar
Meade, Adam W. & S. Bartholomew Craig. 2012. Identifying careless responses in survey data. Psychological Methods 17(3). 437. https://doi.org/10.1037/a0028085.Suche in Google Scholar
Mendiburo-Seguel, Andrés & Thomas E. Ford. 2019. The effect of disparagement humor on the acceptability of prejudice. Current Psychology. 1–12. https://doi.org/10.1007/s12144-019-00354-2.Suche in Google Scholar
Martineau, William. H. 1972. A model of the social functions of humor. In Jeffrey H. Goldstein & Paul. E McGhee (eds.), The psychology of humor, 101–125. Cambridge: Academic Press.10.1016/B978-0-12-288950-9.50011-0Suche in Google Scholar
Paolacci, Gabriele, Jesse Chandler & Panagiotis G. Ipeirotis. 2010. Running experiments on amazon mechanical turk. Judgment and Decision Making 5(5). 411–419. https://doi.org/10.1017/s1930297500002205.Suche in Google Scholar
Phillips, Nathaneil. 2017. Yarrr: A Companion to the e-Book “YaRrr!: The Pirate’s Guide to R.” R package version 0.1.5. Available at: https://CRAN.R-project.org/package=yarrr.10.32614/CRAN.package.yarrrSuche in Google Scholar
Richard, F. Dan, Charles F. Bond Jr & Juli J. Stokes-Zoota. 2003. One hundred years of social psychology quantitatively described. Review of General Psychology 7(4). 331–363. https://doi.org/10.1037/1089-2680.7.4.331.Suche in Google Scholar
Romero-Sánchez, Mónica, Hugo Carretero-Dios, Jesús L. Megías, Miguel Moya & Thomas E. Ford. 2017. Sexist humor and rape proclivity: The moderating role of joke teller gender and severity of sexual assault. Violence Against Women 23(8). 951–972. https://doi.org/10.1177/1077801216654017.Suche in Google Scholar
Romero-Sánchez, Mónica, Mercedes Durán, Hugo Carretero-Dios, Jesús L. Megías & Miguel Moya. 2010. Exposure to sexist humor and rape proclivity: The moderator effect of aversiveness ratings. Journal of Interpersonal Violence 25(12). 2339–2350. https://doi.org/10.1177/0886260509354884.Suche in Google Scholar
Rosenthal, Robert. 1979. The file drawer problem and tolerance for null results. Psychological Bulletin 86(3). 638. https://doi.org/10.1037/0033-2909.86.3.638.Suche in Google Scholar
Rouder, Jeffrey N. 2014. Optional stopping: No problem for Bayesians. Psychonomic Bulletin & Review 21(2). 301–308. https://doi.org/10.3758/s13423-014-0595-4.Suche in Google Scholar
Simonsohn, Uri. 2015. Small telescopes: Detectability and the evaluation of replication results. Psychological Science 26(5). 559–569. https://doi.org/10.1177/0956797614567341.Suche in Google Scholar
Simonsohn, Uri, Leif D. Nelson & Joseph P. Simmons. 2014. P-Curve: A key to the file-drawer. Journal of Experimental Psychology: General 143(2). 534. https://doi.org/10.1037/a0033242.Suche in Google Scholar
Thomae, Manuela & E. Page. 2016. That joke’s so gay. The effect of homophobic humour on perceptions of lesbian women and gay men. In Paper presented at the International society for humor studies conference 2016, Dublin, Ireland, June 27th to July 1st 2016.Suche in Google Scholar
Thomae, Manuela. 2004. Why did the woman cross the road?: Effects of hostile sexism and sexist jokes on rape proclivity. University of Kent. Unpublished MSc thesis.Suche in Google Scholar
Thomae, Manuela & Afroditi Pina. 2015. Sexist humor and social identity: The role of sexist humor in men’s in-group cohesion, sexual harassment, rape proclivity, and victim blame. Humor 28(2). 187–204. https://doi.org/10.1515/humor-2015-0023.Suche in Google Scholar
Thomae, Manuela & G. Tendayi Viki. 2013. Why did the woman cross the road? The effect of sexist humor on men’s rape proclivity. Journal of Social, Evolutionary, and Cultural Psychology 7(3). 250. https://doi.org/10.1037/h0099198.Suche in Google Scholar
Viki, G. Tendayi, Manuela Thomae, Amy Cullen & Hannah Fernandez. 2007. The effect of sexist humor and type of rape on men’s self-reported rape proclivity and victim blame. Current Research in Social Psychology 13(10). 122–132.Suche in Google Scholar
© 2023 the author(s), published by De Gruyter, Berlin/Boston
This work is licensed under the Creative Commons Attribution 4.0 International License.
Artikel in diesem Heft
- Frontmatter
- Full Length Articles
- “Waiter, there’s a fly in my soup!”: tipping behavior in restaurants as a function of food servers’ humor, opinion conformity, and other-enhancement
- ‘Just kidding?’ – an exploratory audience study into the ways Flemish youth with a minoritized ethnic identity make sense of ethnic humor and the politics of offense
- Sexist jokes don’t appear to increase rape proclivity among men high in hostile sexism: Evidence from two pre-registered direct replications of Thomae and Viki (2013)
- Clown doctors virtualized: hospital professionals’ perception regarding online visits during confinement in Portuguese public hospitals
- Humor style predicts sarcasm use – evidence from Turkish speakers
- What makes Mormons laugh
- The role of humor in social, psychological, and physical well-being
- Book Reviews
- Judith Yaross Lee and John Bird: Seeing Mad: Essays on Mad Magazine’s Humor and Legacy
- Rachel Trousdale: Humor, Empathy, and Community in Twentieth-Century American Poetry
- Conners, Carrie: Laugh Lines: Humor, Genre, and Political Critique in Late Twentieth-Century American Poetry
- Wiggins, Bradley: The Discursive Power of Memes in Digital Culture: Ideology, Semiotics, and Intertextuality