The Export Strategy and SMEs Employment Resilience During Slump Periods
-
Daniel Aparicio-Pérez
 und
María E. Rochina-Barrachina
und
María E. Rochina-Barrachina

Abstract
The Spanish economy was the most hit by the Great Recession. It suffered a greater decrease in the gross domestic product (GDP) (affecting especially internal demand). However, it suffered a greater increase in exports (the so-called Spanish “miracle”). Particularly, Spanish SMEs incorporation into exports has been spectacular since 2008. Further, this has coincided with a huge increase in unemployment. Therefore, our main objective is to investigate the moderating role of exports in job destruction associated with recessive contexts of domestic demand using Spanish manufacturing SMEs as a case study. We obtain for SMEs that export participation helps compensate for the decrease in the number of workers generated by a (domestic) downturn, also increasing their survival. Otherwise, SMEs’ survival is negatively affected by financial constraints, production costs, and a recessive demand. This compensatory effect of exports on employment works in favor of permanent workers, meaning that the ratio of permanent to temporary workers may increase for SMEs during recessive periods. Finally, we provide evidence that supports that participation of SMEs in exports is also due to a reaction to the fall in the domestic demand (the so-called “venting out” hypothesis) and, mainly, that this occurs for firms with high utilization of its productive capacity.
1 Introduction
Our main research question in this article is whether, for SMEs, exporting helps to mitigate job losses in periods of recession especially characterized by a slump in domestic demand. Thus, the main objective of this section is to motivate our study and to shed light on the relationships of the mentioned variables.
When a crisis arrives, there may be multiple consequences in the economic, political, or social fields, but they differ across countries and firms. Focusing on the latter, recessions have been considered a time when the most unproductive firms are forced to exit, what is known as the cleansing effect of recessions (Caballero & Hammour, 1994; Osotimehin & Pappadà, 2017). Therefore, not all firms are affected in the same way when a recession comes.
More precisely, firms’ size is one characteristic that especially affects the behavior of firms when bad times arrive. That is to say, SMEs tend to suffer more during these times. First, they are much more sensitive to the business cycle or other market frictions (Bakhtiari, Breunig, Magnani, & Zhang, 2020; Beck, Demirgüç-Kunt, & Maksimovic, 2008; Crouzet & Mehrotra, 2020), and second, recession periods can be especially harmful to them since they tend to be also less efficient than their bigger counterparts, leading to fewer chances of survival (Bartoloni, Arrighetti, & Landini, 2020; Melitz, 2003). In addition, boom periods such as those before the Great Recession appear to be characterized by misallocation of capital, that is, capital may have been too directed toward unproductive firms (Cette, Fernald, & Mojon, 2016), which may have helped to the survival of relatively inefficient firms during prerecessive periods. In this line, Gopinath, Kalemli-Ozcan, Karabarbounis, and Villegas-Sanchez (2017) showed for Spain that such capital distortions have contributed to the survival of small and relatively inefficient firms. This was also confirmed for Portugal by Dias, Robalo Marques, and Richmond (2014). Consequently, when a recession arrives, there may be a reallocation of capital to the most productive firms, which can lead to the death of the most inefficient ones.
Likewise, the crisis period not only goes hand in hand with the exit of firms but also with the rise of unemployment, where it is especially noteworthy the case of the Great Recession. However, this increase in unemployment was again not equally distributed. Workers in small firms were more likely to become unemployed during the 2007–2009 recession than comparable workers in large firms (Duygan-Bump, Levkov, & Montoriol-Garriga, 2015). Nevertheless, this effect on employment for SMEs is not casual. The poorer financial conditions they face are one of the drivers of this negative impact on employment. It has been largely documented that SMEs face tighter resource constraints than large businesses, becoming particularly tough when financial markets are volatile and unfavorable, as it happened during the crisis of 2008 (Bakhtiari et al., 2020). Hence, this impacts, among others, a firm’s survival and employment. Indeed, in times where SMEs experience a negative demand shock, credit constraints play a detrimental role on employment among this type of business (Campello, Graham, & Harvey, 2010; Cornille, Rycx, & Tojerow, 2019; Westergaard-Nielsen & Neamtu, 2012). Besides, SMEs may have relied particularly on the layoff of temporary employees to carry out the job adjustment (Cornille et al., 2019).
Therefore, an important question for SMEs is what makes them more resilient to recessions. Which characteristics help them overcome the negative impact of bad times on issues like firms’ employment? In the literature, some works point out that operating in a market with lower competition reduces the risk of being affected by a crisis (Westergaard-Nielsen & Neamtu, 2012), while others affirm that firms with a superior enterprise risk management capability can cope better with downturns (Nair, Rustambekov, McShane, & Fainshmidt, 2014). More particularly, although SMEs are expected to suffer the most during the crisis as discussed earlier, they also tend to be more flexible and more open to opportunities (Eggers, 2020). In this line, some authors have highlighted that one key factor to proactively react to a recession is the SMEs’ engagement in foreign trade (Geroski & Gregg, 1997; Máñez, Rochina Barrachina, & Sanchis, 2020). In general, exporters are expected to perform better in terms of employment, chances of survival, and sales growth in comparison with nonexporters when facing a crisis (Görg & Spaliara, 2014), being the smallest firms the most benefited by export promotion activities (Munch & Schaur, 2018). In this way, new seminal works have pointed out this strategic decision of exporting as a way to deal with recessions in a context of an important drop in domestic demand, the so-called “venting out” hypothesis (Almunia, Antràs, Lopez-Rodriguez, & Morales, 2021).
Several articles in the literature have investigated the role of exports on employment, identifying a positive impact. At an industry level, Feenstra, Ma, and Xu (2019) found that export job creation offsets the import job destruction in the United States, while Kiyota (2016) showed that in China, Indonesia, Japan, and Korea, exports can create employment, although this effect is not limited to the export industries, it may have an impact on industries that are not particularly export oriented through vertical interindustry linkages. Likewise, with regards to the relationship between exports and unemployment, the literature has used aggregate data to find that the former can help reduce the latter. Dritsakis and Stamatiou (2018) showed that, for European countries, exports are important not only to promote economic growth but also to reduce unemployment. The same result is found for developing countries such as Malaysia (Subramaniam, 2008). Moreover, it has been even established that after World War II, the boom in exports in the United States played a strong and key role to prevent a significant increase in unemployment (Taylor, Basu, & McLean, 2011).
On the other hand, at a firm level, Bernard and Jensen (1999) showed that in the United States, exporting not only increases the probability of survival but also leads to higher employment growth on any horizon. More recently, and also along this line, Lo Turco and Maggioni (2013) found evidence of a positive impact of firms’ internationalization activities on firms’ employment in Turkey, while Biscourp and Kramarz (2007) showed a positive relationship between exports and employment growth in France. Likewise, using Danish firm-level data, Munch and Schaur (2018) found that export promotion leads to an increase of 4% points on employment. Finally, Capuano and Schmerer (2015) found a negative relationship between trade and unemployment in Germany, indicating that trade liberalization helps reduce unemployment in the long run.
Hence, it seems from the previous studies that exports have a positive impact on employment, being a factor that helps mitigate the problem of unemployment. This leads us to the following question: What factors facilitate or discourage firms to export? One that we cannot ignore is the presence of financial restrictions as it influences trade and internationalization strategies. For instance, financial constraints are critical when engaging in FDI (Buch, Kesternich, Lipponer, & Schnitzer, 2014; Gil-Pareja, Llorca-Vivero, & Paniagua, 2013). Moreover, in the same way, the financial constraints of domestic firms have a deterrent effect not only on their probability to export but also on their export intensity (Kim, 2019). Besides, for SMEs in particular, Máñez and Vicente-Chirivella (2021) found that, using a financial score to measure the degree of financial constraints, SMEs with better financial health are more likely to export. Equally, they showed that financial health is positively associated with export persistence. This is another argument that supports that SMEs are very likely to be the most affected as a result of a recession since they tend to have more financial constraints and are more likely to disappear and suffer an adverse effect on employment. This is coupled with the fact that SMEs are especially relevant in Europe since they account for 99% of all businesses in the EU and provide two out of three jobs in the private sector (Interreg Europe, 2021). Although they account for fewer resources because of their size, they have proven to be flexible actors with a certain capacity to deal with turbulent times. Nevertheless, as stated at the beginning, the consequences of the Great Recession differ not only between firms of different sizes but also between countries. In relation to this, it must be said that the 2008 financial crisis particularly affected southern Europe (Zamora-Kapoor & Coller, 2014). But more precisely, the most interesting case for this work is Spain, since it was the only country in the EU that suffered a sharp drop in the gross domestic product (GDP), a record rise in unemployment rates, but at the same time experienced an incredible take-off in its export participation, especially for SMEs.
In addition to financial restrictions, there are two more relevant variables to explain the decision to export of SMEs. First, in a Melitz (2003) type model of trade, the decision to export is a function of productivity, and precisely, the most productive firms export. Second, the incentives to export if the aforementioned “venting out” hypothesis (Almunia et al., 2021) is met. The model in the article by Almunia et al., (2021) establishes a theoretical causal link between a fall in domestic demand and an increase in firms’ incentives to export (more details on this will be provided in Section 4). Furthermore, their model also predicts that this substitution between internal and external demand should be stronger for firms with a greater use of their productive capacity.
Having said all this, once firms export, our main objective in this work is to investigate the role of export participation as a means for Spanish manufacturing SMEs to maintain employment in recessive periods in which the domestic demand is depressed and external markets can pull employment. Exporting SMEs can begin to use their productive capacity released in the short term due to the fall in the domestic demand and hire workers to respond to the increase in the external demand. Furthermore, we also want to find out whether the effect of exports on SMEs’ employment affects the composition of their workforce in terms of permanent versus temporary contracts. Finally, the theoretical framework in Section 4 reveals in detail why it is also relevant for us to explain what lies behind the SMEs’ decision to export. At this stage, we will pay special attention to supply and demand factors (including access to finance).
To anticipate the main results in this article, we obtain that exporter SMEs not only have a higher level of employment than nonexporters but can also offset part of the employment losses that are generated during a recessionary period that mainly affects the domestic demand. This compensation acts in the favor of permanent workers, meaning that the ratio of permanent to temporary workers increases during these recessive periods. Thus, exporting SMEs show greater resilience in terms of employment when affected by a recession than nonexporters. In addition, SMEs use the export strategy as a means to avoid death and overcome periods of downturn in their domestic sales. In relation to this last point, we throw new empirical evidence on the “venting out” hypothesis (Almunia et al., 2021; De Lucio, Mínguez, Minondo, & Requena, 2019; Máñez et al., 2020). Finally, but very importantly, we also confirm the theoretical prediction in Almunia et al. (2021): those firms with the highest capacity utilization have the greatest incentives to export when domestic demand falls.
The main contributions of our work are as follows. First, it provides new evidence to the literature exploring the effects of exports on employment at the firm level. Second, it helps to understand the role of firms’ export decisions in mitigating unemployment when a domestic recession hits the economy. Third, it focuses especially on SMEs, the most vulnerable group of firms in a crisis. Fourth, it delves into the compositional effects on employment in relation to the different types of contracts (permanent and temporary) to eventually offer policy recommendations not only on how to mitigate the drop in employment after a shock but also on how to improve its quality in terms of the duration of contracts. Finally, and regarding the hypothesis of “venting out” already tested in some previous works, a step forward has been taken and the prediction related to firms’ capacity utilization in the theoretical model of Almunia et al. (2021) has been directly tested. This has been possible because the database used for this work has information on the percentage in which the firm uses its productive capacity. To our knowledge, this is the only work that addresses all of these issues simultaneously and within a unified theoretical framework based on the work of Almunia et al. (2021), fundamental to our analysis. This has been a challenge for us since their work is focused on explaining firms’ export decisions, and in its empirical part, it does not include employment equations as a dependent variable nor does it distinguish between temporary and permanent works in their equations. However, its theoretical model and its empirical application are rich and interesting enough to inspire our work.
The remainder of this article is organized as follows. In Section 2, we show why the Spanish case has been chosen as a relevant case study to investigate the moderating role of exports in employment destruction associated with recessive contexts, especially characterized by the poor performance of the domestic demand. Section 3 describes the database used in this work. Section 4 reports our theoretical framework and estimation results. Finally, Section 5 concludes this study.
2 The Spanish Case
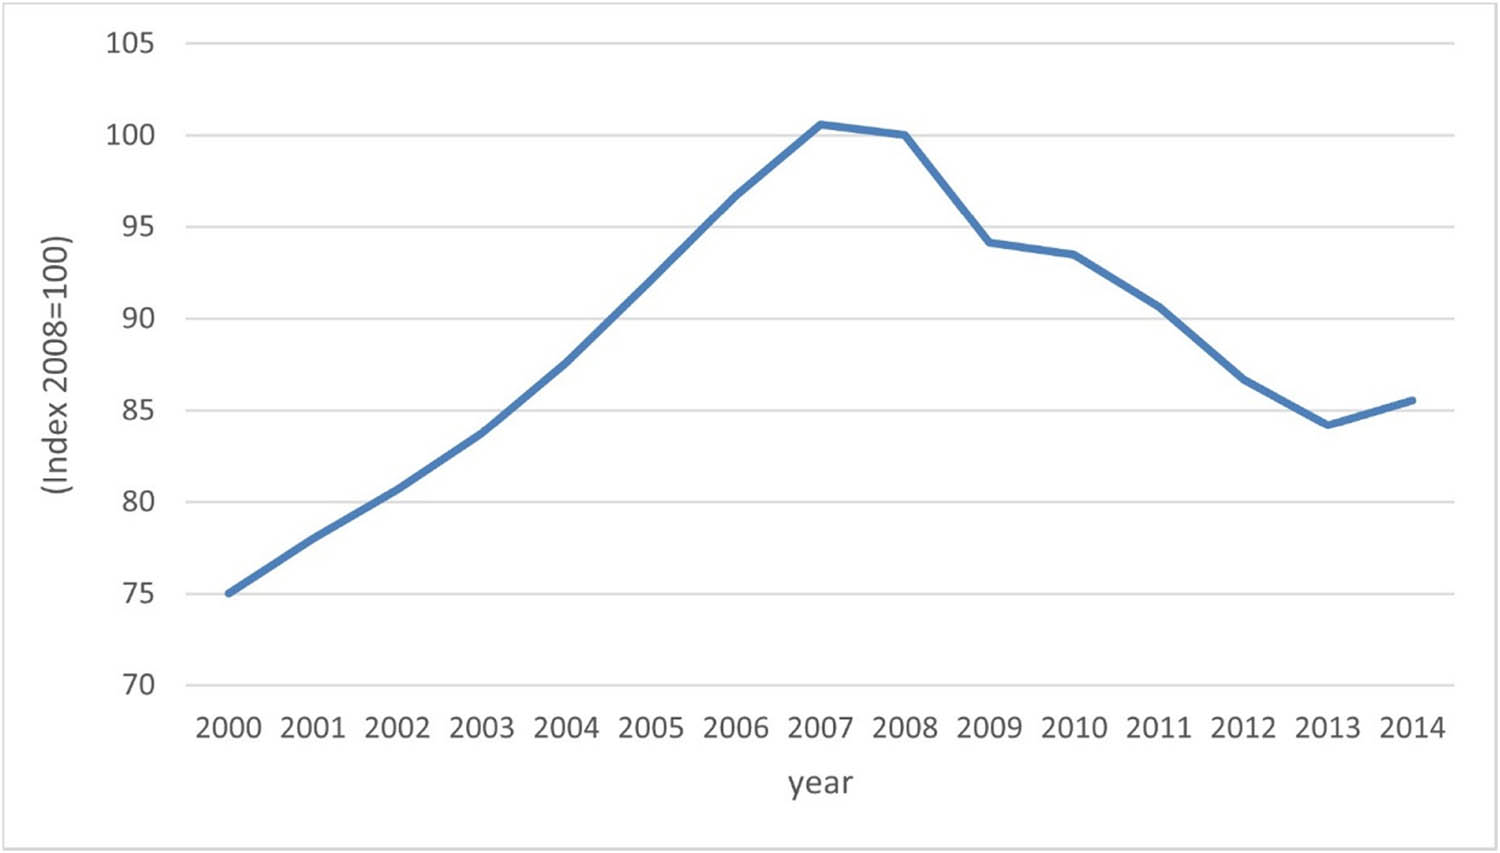
As commented in Section 1, the effects of a crisis differ from one country to another. In this way, the Great Recession that started by late 2007 was an economic downturn that was global in nature but hit sharply countries in Southern Europe (Goldstein, Kreyenfeld, Jasilioniene, & Örsal, 2013; Zamora-Kapoor & Coller, 2014). Figure 1 shows evidence of the severity of this crisis by showing the evolution of GDP for economies in Southern Europe (namely, Portugal, Spain, Italy, and Greece) as well as for France, Germany, and the whole euro area along the period of analysis in this article, 2000–2014.[1]
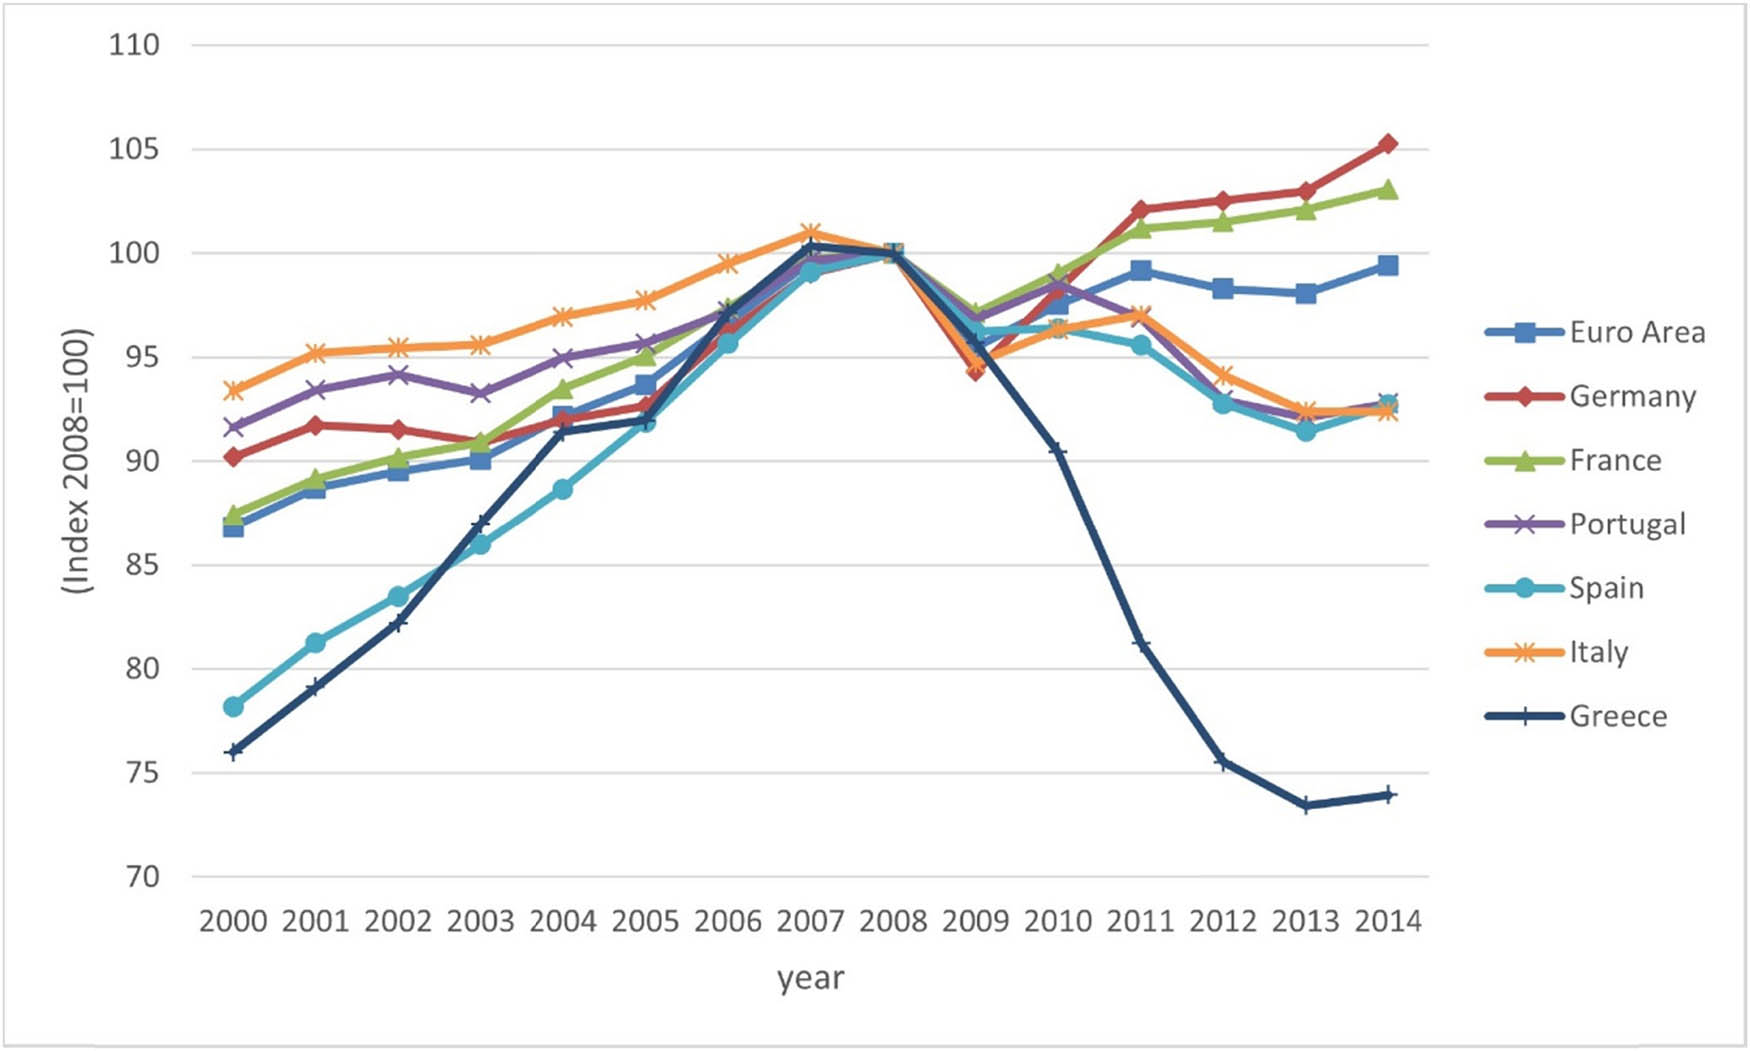
Evolution of the GDP. Source: Data from AMECO-EU.
Until 2008, all countries saw how their GDP grew substantially, experiencing the so-called boom years. Nevertheless, in the ongoing years, the GDP fell in all cases, heading the economies toward a recession. However, what is remarkable is that only the southern economies were unable to recover their precrisis levels. In 2014, the French GDP had grown by 3.07% in comparison with 2008, the German GDP was 5.26% larger, and the GDP for the whole euro area was practically the same as in 2008. But in the case of the Southern European countries, the situation was completely the opposite. Neither Spain nor Italy, Portugal, or Greece were able to recover from the crisis after 6 years.
However, the financial crisis of 2008 had also a severe effect on the labor market, increasing the unemployment rates in all countries as shown in Figure 2. Before the crisis, all economies presented relatively low unemployment rates, being all less than 10%. However, the crisis entailed a shock in the labor market for all economies, but its magnitude and impact differed widely across countries. In 2014, the scenarios for different economies were very diverse. The best evolution took place in Germany, which was able to reduce its unemployment rate by 2.5% points in comparison to the precrisis level. On the contrary, the euro area and France suffered a moderate increase since the unemployment rate increased by 4 and 3% points, respectively. A worse scenario was present in Italy and Portugal, where the unemployment rates doubled. But, in any case, the most worrying rates were in Greece and Spain, where they arrived to surpass 25%.
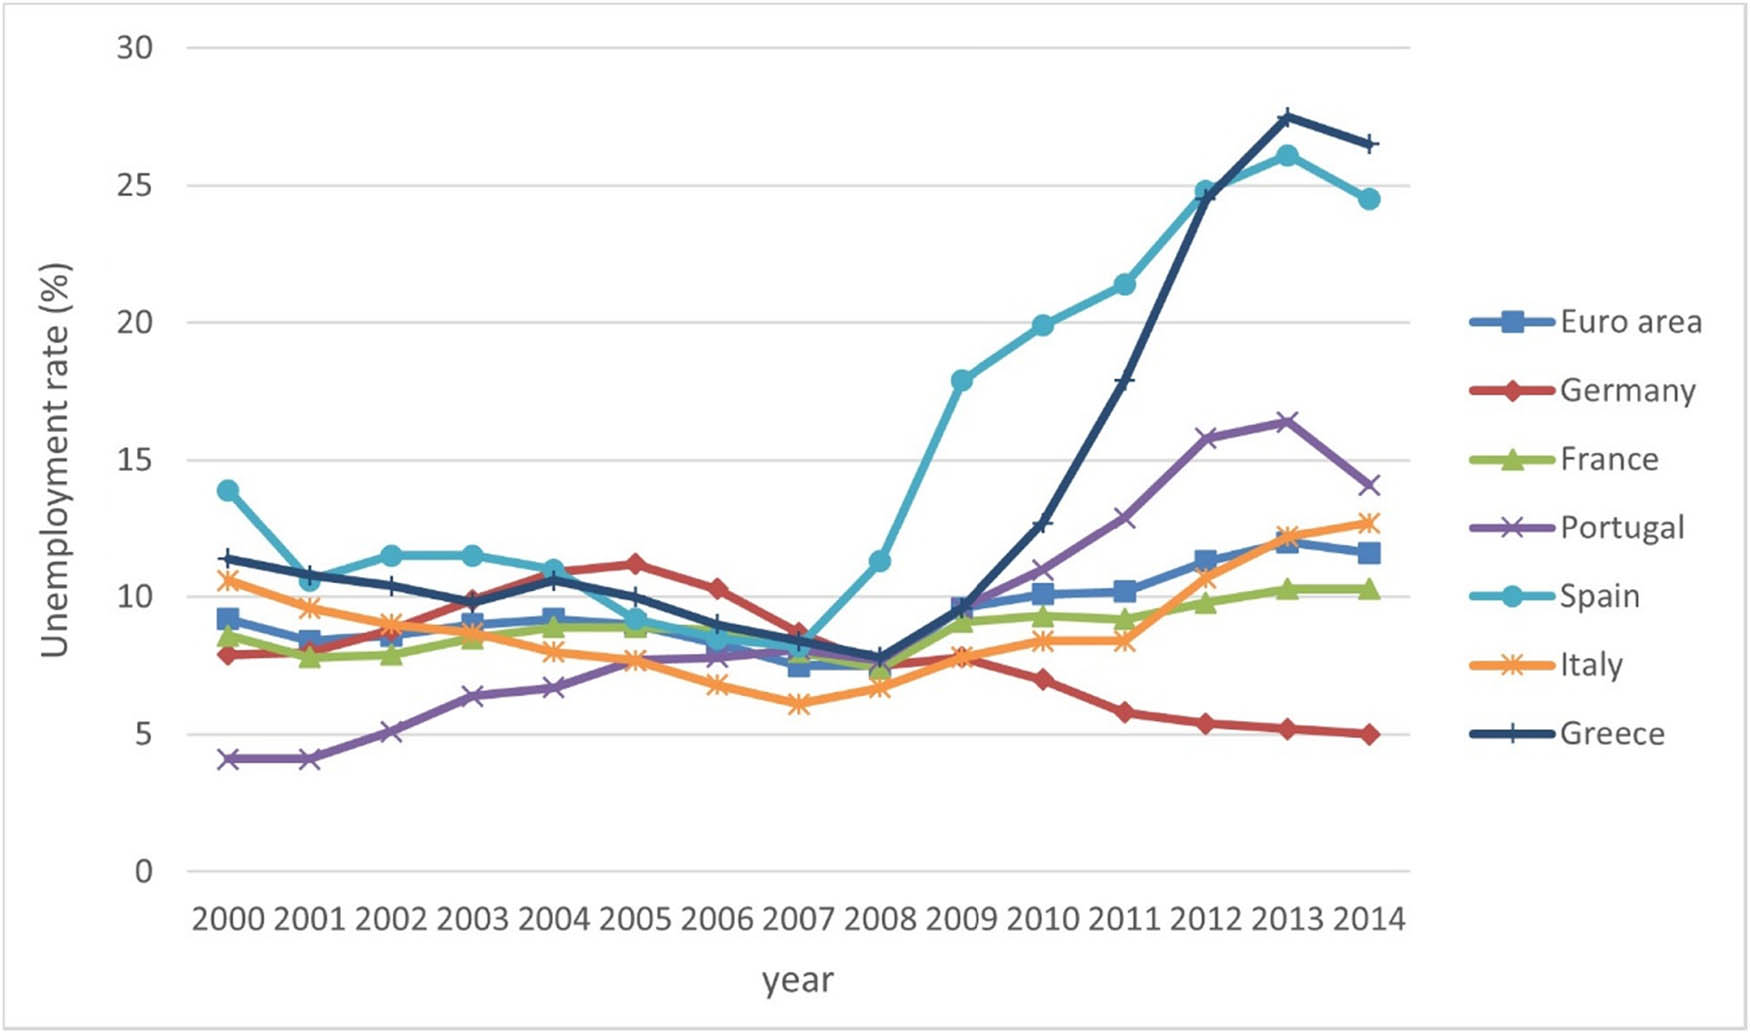
Evolution of unemployment rates. Source: AMECO-EU.
Given this scenario, firms needed to adapt to these conditions, but as explained in Section 1, when it comes to a recession, they could react differently. Engagement in foreign trade has been pointed out as one of the key factors to deal with recessions. Thus, it is interesting to see how exports have evolved during the boom and slump periods for the different economies mentioned earlier, and Figure 3 shows this evolution.
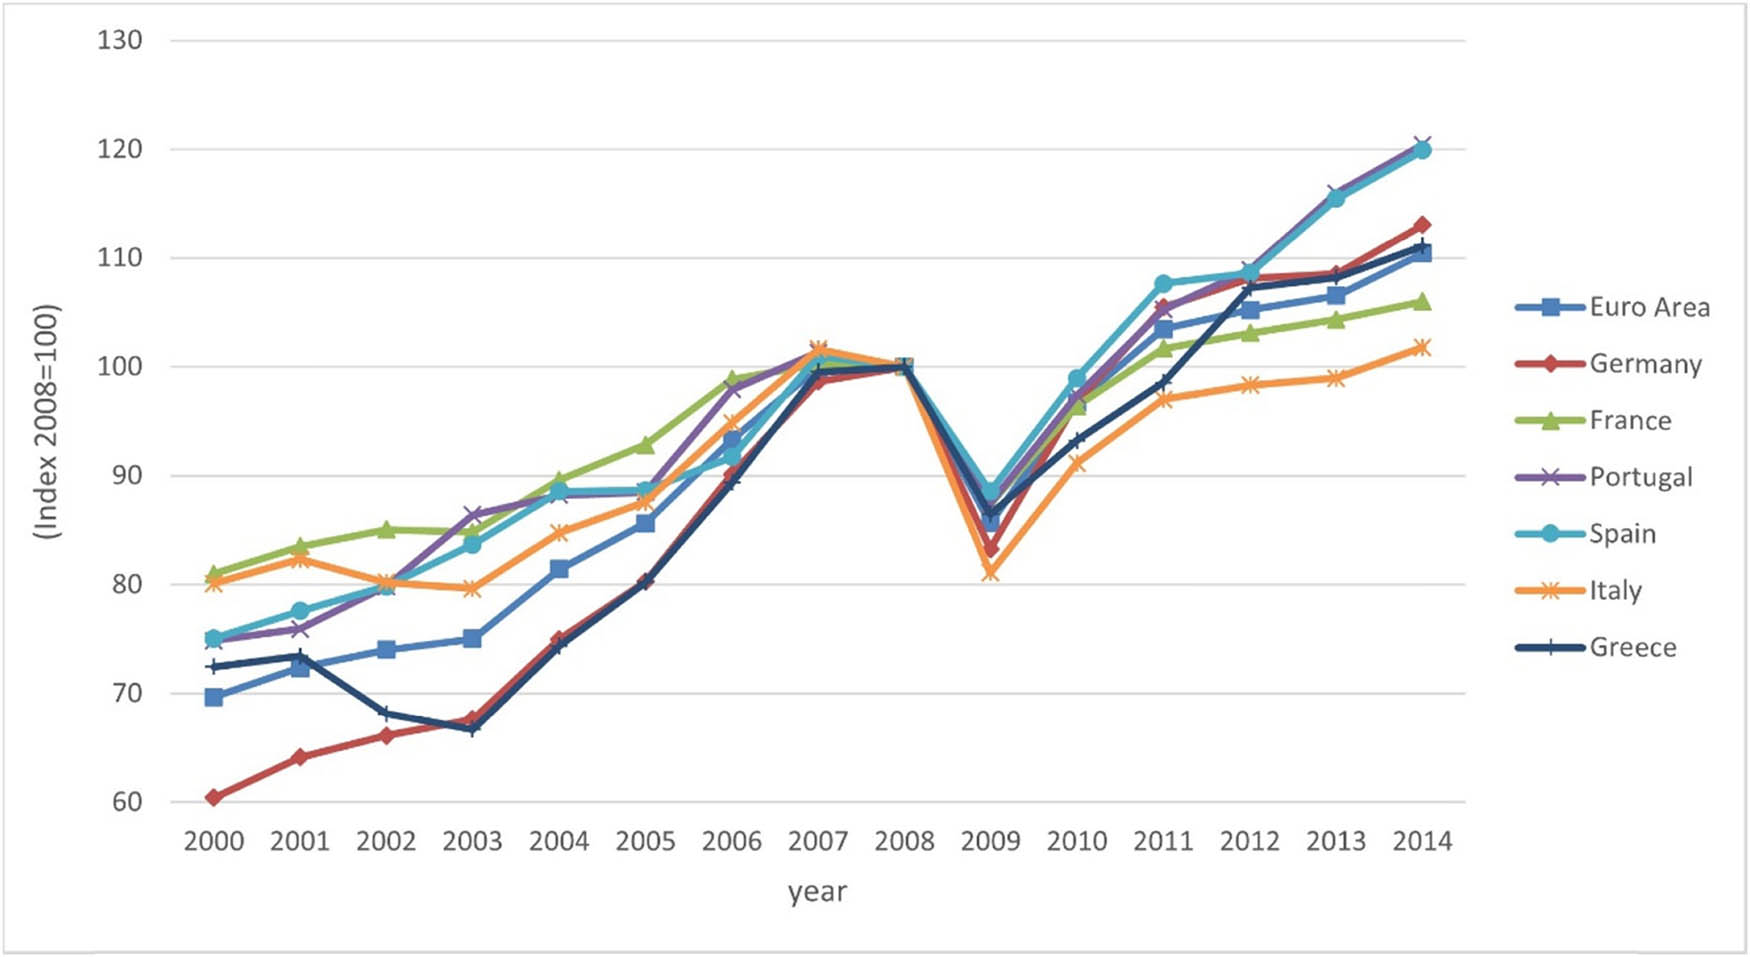
Evolution of exports. Source: AMECO-EU.
Exports were experiencing a positive trend until the crisis arrived. After 2008, they shrunk, but countries were able to recover the growing path rapidly. However, this growth was not equal for all economies. Italy arrived virtually to the precrisis level in 2014, and France only experienced a 6% growth. Germany and Greece managed to increase their exports by 10% approximately, in line with the euro area. However, the outstanding increase took place in Spain and Portugal, where exports grew 20% in comparison to 2008.
Hence, the only country hit severely by the crisis with a sharp fall in GDP and a high increase in the unemployment rate but with an important take-off of its exports was Spain. Thus, this makes this southern economy an interesting country to analyze these phenomena and to study whether this increase in exports helped offset the problem of unemployment.
Unemployment has been pointed out as one of the most severe problems in Spain (Furió & Alonso, 2015). As shown in Figure 2, there was a general increase in unemployment rates in Europe, but the problem in Spain is more serious since it is structural and systematic. Several articles have analyzed this Spanish problem deeper, trying as well to identify the potential solutions (Royo, 2009; Verick, 2009). However, what is also noteworthy for Spain is the employment structure, which is characterized by a high number of temporary workers, traditionally associated with a higher degree of vulnerability and precariousness (López & Malo, 2015). To show this, Figure 4 shows how the two different types of workers, permanent and temporary, were affected by the increase in unemployment after the crisis started.[2]
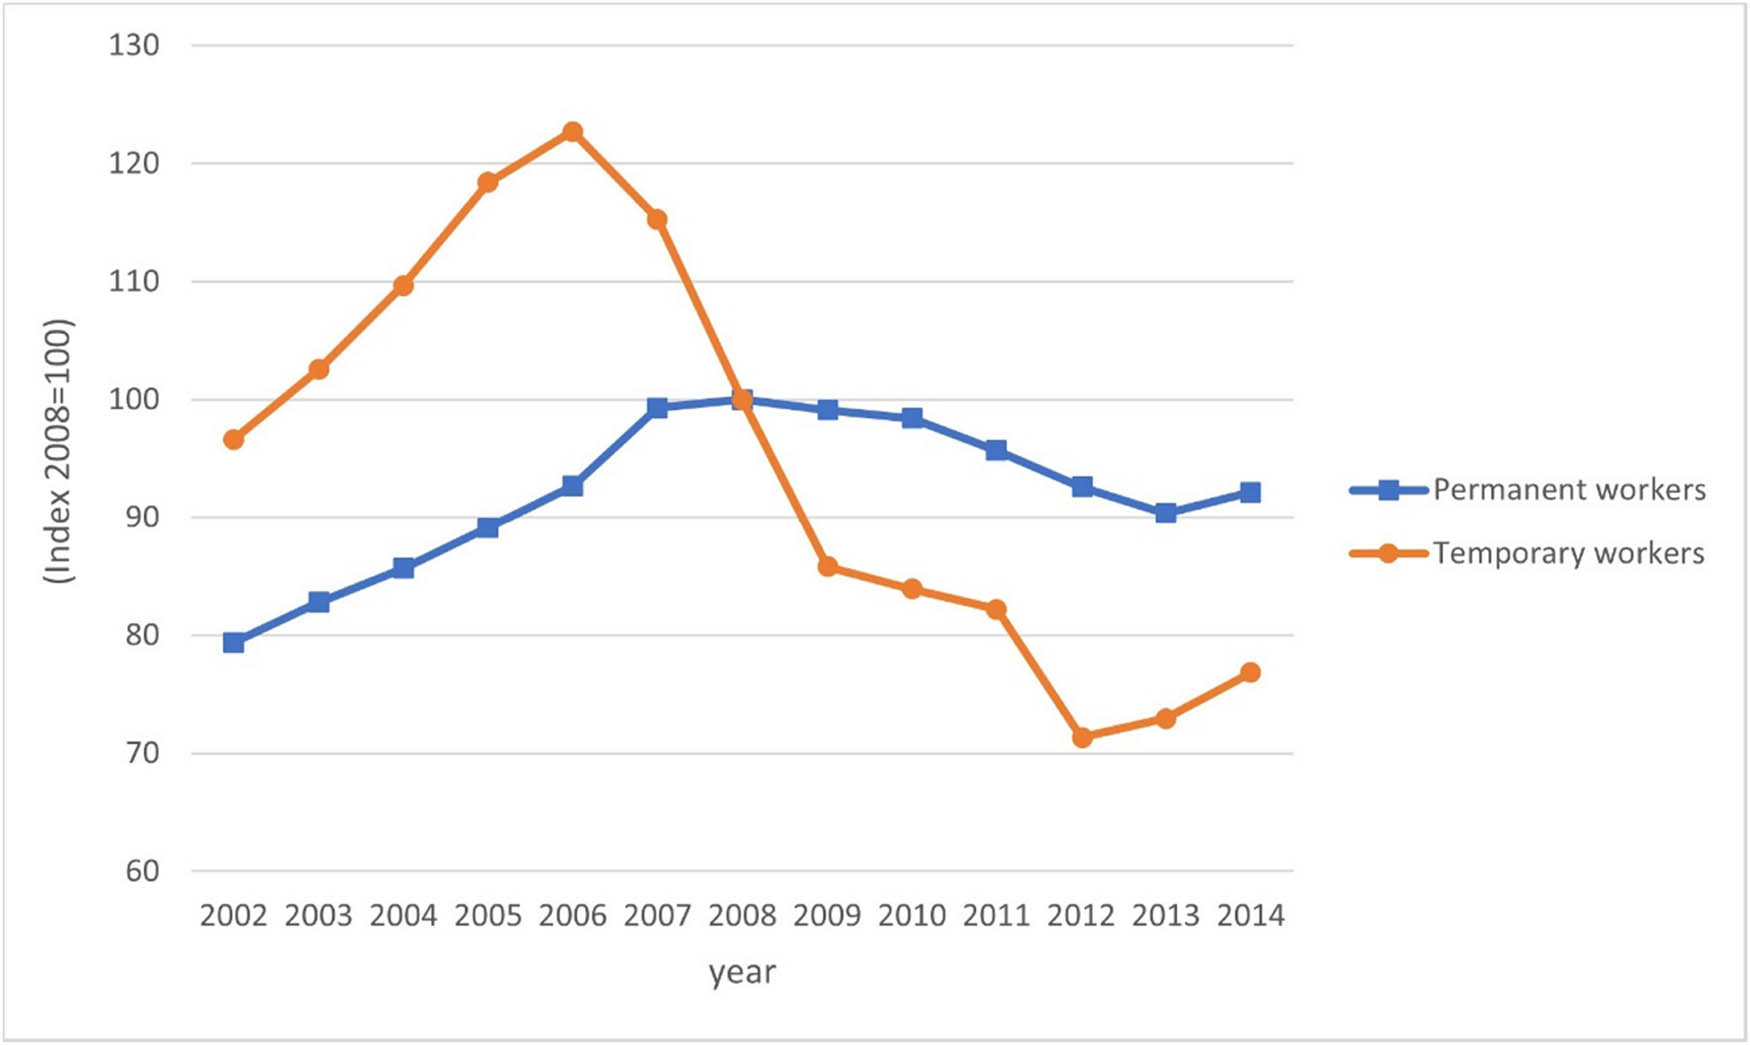
Permanent and Temporary workers in Spain. Source: Instituto Nacional de Estadística (INE).
As shown in Figure 4, the evolution of temporary workers is more volatile. While the growth of this type of workers was notable before the crisis, being higher than the growth of permanent workers, it decreased considerably when the recession arrived. It fell by 50% from 2006 to 2012, while the number of permanent workers was virtually the same. The intuition for this is that when a firm needs to face a crisis, it is easier to fire temporary workers, since the firing costs for the permanent ones could become a high burden for the firm. This implies a huge flow of temporary workers entering and going out of unemployment (Bentolila, Cahuc, Dolado, & Le Barbanchon, 2012). Thus, this reinforces the idea that it is interesting not only to analyze the link between exports and employment but also to differentiate between workers under the two types of contracts.
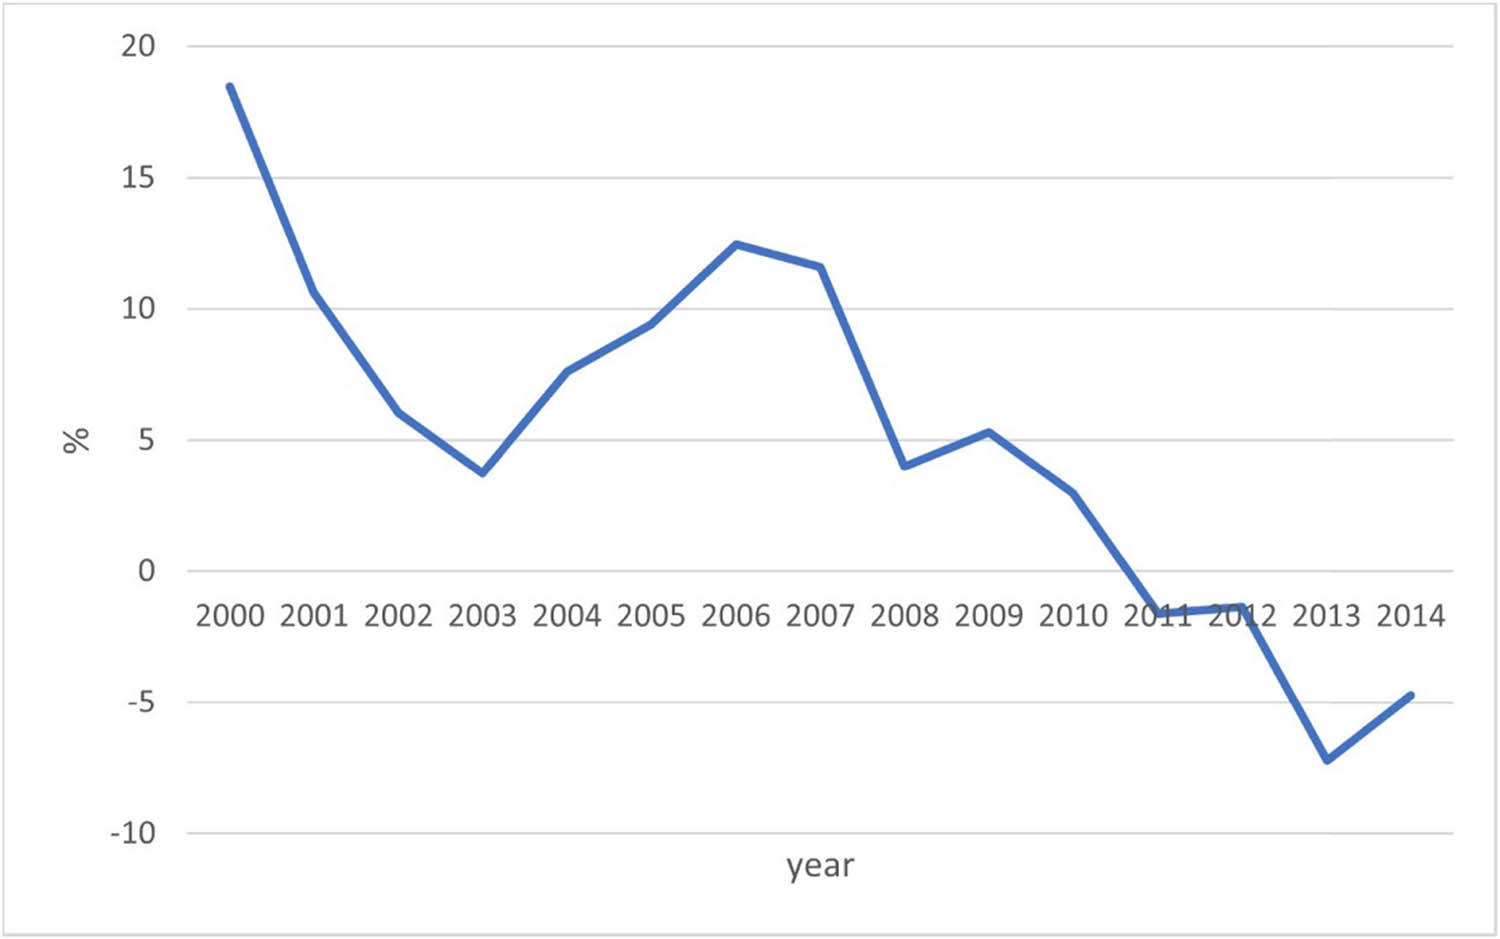
In addition, the spectacular growth in exports in Spain has been coined as the “Spanish miracle” (Eppinger, Meythaler, Sindlinger, & Smolka, 2017), for which two possible explanations have been proposed: an increase in competitiveness due to supply-side factors and the so-called “venting out” hypothesis. The latter attributes the increase in exports (in their extensive and intensive margins) to a strategic response made by firms to face the fall in the internal demand (Almunia et al., 2021). Thus, Figure 5 shows the evolution of the internal demand in Spain to see which was the impact when the recession came.
Evolution of the internal demand in Spain. Source: AMECO-EU.
As shown in Figure 5, the internal demand was experiencing a positive trend before 2007, but it changed its path when the crisis arrived, being 15% lower in comparison with the precrisis level. Thus, the “venting out” hypothesis may be a potential explanation for the increase in exports in Spain during the slowdown as shown in other studies (Almunia et al., 2021; De Lucio et al., 2019; Máñez et al., 2020).
However, as discussed in Section 1, when it comes to a recession similar to the one we are dealing with, it is particularly important the fact that financial constraints may become an important obstacle for firm performance. We plot the evolution of loans to nonfinancial institutions in Figure 6, so that we can see how they fell when the crisis arrived.
Yearly growth of credit to nonfinancial institutions. Source: Bank for International Settlements.
The rate of growth of credit to nonfinancial institutions became negative in 2011, not being able to recover in 2014. This confirms the increase in financial restrictions, so we cannot forget this phenomenon in our study, since it was a reality that became a problem for firms in the Spanish economy.
Therefore, as has been made clear in this section, Spain is especially suitable and relevant to study whether exports may help offset unemployment in a context of depressed internal demand and increasing financial restrictions, in a labor market characterized by a strong duality between permanent and temporary workers.
3 Database and Descriptives
In this study, we use a firm-level panel data set obtained from the Spanish Survey on Business Strategies (ESEE) for the period 2000–2014. The selected period allows considering both the boom phase (2000–2008) and the slump period that occurred after 2008. The ESEE is a yearly survey, carried out by the SEPI Foundation, which is representative (by industry and size) of the manufacturing sector in Spain. Firms are classified into 20 different sectors following the NACE-CLIO two-digit classification.
The sampling design of the ESEE is as follows. No firms with employees below 10 are included in the survey. Firms with 10–200 employees (SMEs) are randomly included, being about 5% of the population of firms within this size range in 1990. All firms bigger than 200 workers (large firms) are invited to contribute to the survey, with a participation of about 70% in 1990. To minimize attrition in the initial sample, important efforts have been conducted. Thus, annually new firms are incorporated with the same criterion of the base year to preserve the sample representativeness across[3] time.[4]
In our work, as explained in Section 1, we focus on SMEs, since, among other things, large firms tend to have fewer financial constraints and are less sensitive to demand conditions.[5] In addition to excluding large firms, we drop out all firms’ observations that do not provide information on the relevant variables used in our analysis. Therefore, after cleansing those observations, we have a main working sample of 18,286 observations that correspond to 2,723 firms.
However, to reinforce the idea that SMEs and large firms and exporters and nonexporters behave differently, we show in Table 1 some descriptive statistics regarding the main variables used in this article. Table A1 in the Appendix presents a detailed description of the variables used.
Descriptive statistics – Average of the main variables
| SMEs | Large Firms | |||
|---|---|---|---|---|
| Exporters | Nonexporters | Exporters | Nonexporters | |
| Total employment | 65.198 | 29.517 | 754.224 | 479.987 |
| (53.376) | (32.506) | (1335.788) | (569.471) | |
| Permanent employment | 57.602 | 23.955 | 668.384 | 418.61 |
| (49.312) | (28.201) | (1215.701) | (535.993) | |
| Temporary employment | 7.596 | 5.562 | 85.841 | 61.377 |
| (15.231) | (11.633) | (198.778) | (103.409) | |
| InnovProduct (dummy) | 0.219 | 0.066 | 0.382 | 0.207 |
| (0.414) | (0.249) | (0.486) | (0.406) | |
| InnovProcess (dummy) | 0.32 | 0.174 | 0.519 | 0.382 |
| (0.466) | (0.379) | (0.500) | (0.486) | |
| Recessive_demand (dummy) | 0.316 | 0.331 | 0.246 | 0.2 |
| (0.465) | (0.471) | (0.431) | (0.4) | |
| Recessive_Index | 55.137 | 58.512 | 49.223 | 46.012 |
| (31.879) | (32.323) | (31.500) | (32.75) | |
| Financial_Restrictions | 0.054 | 0.182 | −0.315 | −0.304 |
| (0.821) | (0.800) | (0.836) | (0.755) | |
| Growth_Domestic_Sales | −0.05 | −0.049 | −0.007 | 0.042 |
| (0.469) | (0.335) | (0.54) | (0.373) | |
| Capacity utilization (%) | 77.959 | 77.178 | 82.279 | 81.868 |
| (17.008) | (19.073) | (13.894) | (14.536) | |
| High capac. utiliz. (dummy) | 0.575 | 0.586 | 0.674 | 0.695 |
| (0.494) | (0.493) | (0.469) | (0.461) | |
| Average_Wage (euros) | 32160.61 | 25097.394 | 40110.635 | 40365.316 |
| (27544.284) | (17902.068) | (13707.006) | (16167.42) | |
| Intermediates price change (%) | 4.012 | 4.292 | 3.318 | 3.608 |
| (8.332) | (7.701) | (8.829) | (7.868) | |
| LabProd (euros) | 199873.19 | 109161.01 | 306954.89 | 284071.52 |
| (242771.03) | (126194.37) | (379822.45) | (233222.05) | |
| rat_temporary | 0.116 | 0.167 | 0.121 | 0.142 |
| (0.174) | (0.234) | (0.145) | (0.172) | |
| Foreign participation (dummy) | 0.142 | 0.018 | 0.462 | 0.233 |
| (0.349) | (0.134) | (0.499) | (0.423) | |
| Age (years) | 30.552 | 22.604 | 41.985 | 39.987 |
| (21.678) | (17.373) | (25.442) | (29.267) | |
Note: (i) Standard deviations are given in parenthesis. (ii) A detailed description of the variables used is presented in Table A1.
First, there are differences between SMEs and large firms at first sight. On average, regarding employment, SMEs not only employ less workers but also pay lower wages and are less productive in comparison with large firms. They also have more limitations in the sense that they introduce fewer innovations, have less capacity used, and receive less foreign participation. In addition, they suffer more recessive periods, also having more financial restrictions and suffering more variation in the prices of their intermediate inputs. Finally, they are younger.
Second, regarding the differences between exporters and nonexporters, it is noteworthy that, regardless of the firm’s size, on average, exporters are larger, innovate more, are more productive, have more foreign participation, and are older. On the contrary, nonexporters suffer more financial constraints, present more variation in the prices of their intermediate inputs, and employ relatively more temporary workers.
Hence, SMEs and large firms are different, and being an exporter also plays a key role. However, it is interesting as well to see the differences in some key factors for this study during the recession. In other words, it is remarkable to see how exports, employment, and financial constraints have evolved before and after the Great Recession. To shed light on this direction, we find in the first place that most of the large firms in Spain are involved in export activities, while the percentage of SMEs that do so is much lower (see Table 2).[6]
Export participation of large firms and SMEs during the preslump and slump periods
| Mean (%) | ||
|---|---|---|
| Large firms | Preslump | 92.35 |
| Slump | 93.66 | |
| SMEs | Preslump | 51.36 |
| Slump | 61.97 |
Source: Data from ESEE (Spanish survey on business strategies, SEPI foundation). Own elaboration. Preslump corresponds to the years 2000–2008. Slump corresponds to the years 2009–2014.
The number of Spanish manufacturing large firms that export was more than 90%, and in the recession, this share was still so high although it experienced a slight increase. Conversely, the situation for SMEs was different since the percentage of firms in this group that export increased from 51.4% in the precrisis period to nearly 62% in the slump period. Thus, the evolution of SMEs in terms of export participation is, at least, considerable and remarkable and reveals a relevant incorporation pattern to this internationalization activity.
This increase in export participation for SMEs was not common in all European countries. After the crisis, the general trend in Europe was a decline in the export intensity of SMEs. Germany or France saw how their exports from SMEs declined after the crisis, accounting in 2014 for 20% of total exports, while Spain was able to not only increase the number of exporter SMEs as shown in Table 2 but also to increase their value up to a 50% of total exports in 2014.[7]
In addition, after the fall in the internal demand as shown in Figure 5, among SMEs, the exporter firms were the ones presenting better results in terms of employment, as presented in Table 3. Thus, exporting SMEs seem to show greater resilience in terms of employment in a period of recession than nonexporting SMEs.
Employment for exporter and nonexporter SMEs during the preslump and slump periods
| Mean | Std. dev. | ||
|---|---|---|---|
| Exporter SMEs | Preslump | 63.16 | 53.17 |
| Slump | 67.54 | 53.52 | |
| Non-exporter SMEs | Preslump | 30.74 | 32.78 |
| Slump | 27.23 | 31.87 |
Source: Data from ESEE (Spanish survey on business strategies, SEPI foundation). Own elaboration. Preslump corresponds to the years 2000–2008. Slump corresponds to the years 2009–2014.
Finally, as discussed in Section 2 and as shown in the descriptive statistics table (Table 1), being an SME has also implications when it comes to financial constraints since their export or employment growth strategies, among others, may depend on access to financial resources. In Table 4, for the period analyzed in this article, we show that large firms obtain cheaper bank financing than SMEs and that SMEs obtain, compared to large firms, more expensive bank financing during the recession period. This table offers the annual deviation of the financial cost of the long-term debt of firms with financial institutions with respect to the average cost paid by other firms in the same year.
Financial costs (deviations with respect to the mean) for SMEs versus large firms during the preslump and slump periods
| Mean | Std. dev. | ||
|---|---|---|---|
| Large firms | All periods | −0.30 | 0.84 |
| Preslump | −0.21 | 0.76 | |
| Slump | −0.50 | 0.95 | |
| SMEs | All periods | 0.11 | 0.81 |
| Preslump | 0.09 | 0.78 | |
| Slump | 0.13 | 0.84 |
Source: Data from ESEE (Spanish survey on business strategies, SEPI foundation). Own elaboration. Preslump corresponds to the years 2000–2008. Slump corresponds to the years 2009–2014.
Therefore, we can have a first intuition after reviewing the literature and the data. SMEs may suffer more during the crisis in terms of financial constraints, but their export participation may help them become more resilient in terms of employment. In the following section, we will continue with our theoretical framework, our empirical approach, and the estimation results to answer our main research questions in this article.
4 Theoretical Framework and Estimation Results
As mentioned earlier, we aim to disentangle the role of export participation on SMEs employment resilience during recessionary periods particularly affecting the domestic demand. This type of recessionary periods may affect negatively firms’ employment directly due to the lack of demand, the decrease in production, and hence, the firing of workers. However, for some firms, this can be just a short-term effect in employment that can be partly offset by entering export markets. The moderating effect of the export strategy on job destruction when there is a lack of domestic demand can be theoretically understood if, starting from a traditional model à la Melitz (2003), with constant marginal production costs, we introduce increasing marginal production costs. This type of model is fully developed in the study by Almunia et al. (2021) and allows establishing a theoretical causal link between drops in domestic demand and greater firms’ incentives to export (a substitutability of domestic demand by exports termed “venting out”). The way to introduce increasing marginal production costs in their theoretical model is with a close to the reality cost structure where a firm combines a fixed factor such as capital with a more flexible factor such as labor. This type of cost structure results in a convex curvature of the firm’s marginal cost function, which implies that in the short term, that is, when the installed productive capacity cannot be varied, the closer a firm is to its capacity constraint, the more pronounced the slope of its marginal cost curve. A result derived directly from this curvature is that it is those firms closest to their production capacity limit that will benefit the most in the short term from a drop in marginal costs when their domestic demand falls. If this prediction of the model is true, it will imply that there is a negative causal link between domestic demand and exports that is mainly driven by firms with high utilization of their production capacity. When these firms in the short term adapt to the situation of domestic demand by laying off workers, they move down their marginal cost curve, release productive capacity, can lower prices, and be more competitive. All this together makes their export profits increase, and therefore, their incentives to export grow.
In short, once firms export, regardless of whether exports are encouraged by the aforementioned mechanism or by a different one, they begin to use their productive capacity released in the short term and hire workers to respond to the increase in the external demand. Therefore, in our employment equations, we expect both a negative direct effect of the deterioration of domestic demand conditions and attenuation of this effect for firms that export. Delving into these equations, we can interpret the two effects as follows based on the arguments in Almunia et al.’s (2021) theoretical model: (1) in the short term, when facing a fall in the domestic demand, firms reduce the production by diminishing their use of flexible inputs (e.g., workers) relative to their use of fixed inputs (e.g., capital). In our estimated employment equations, this effect is expected to be captured by the variable that controls for the recessive demand. Moreover, not only that but it is also expected that this adjustment in employment will be greater for temporary workers, the most flexible part of the firm’s workforce with the lowest firing costs. (2) The fall in short-term marginal costs due to the behavior of the domestic demand frees up the production capacity that can be used to satisfy the external demand when firms export. This substitution effect for exporters of the domestic demand by foreign demand is what explains the moderating effect of exporting on job destruction generated by a domestic demand crisis. In our estimated employment equations, the moderating effect that modifies the initial job destruction is expected to be captured by a positive coefficient on the crossed product variable between demand conditions and the firm’s export strategy.
Is it indeed true in our data that the “venting out” hypothesis holds, and thereby helps us to explain the aforementioned moderating effect? Answering this question is the reason why, before presenting our estimation results for the employment equations, we are interested in explaining the firm’s decision to export. In addition, we will also use the export decision equation to check whether the prediction in the study by Almunia et al. (2021), whereby the firms with the highest production capacity used are the ones that react most strongly to a drop in the internal demand, becoming exporters, holds.
Hence, we present in Table 5 the results of a probit model that estimates this strategic firms’ decision. We include presample means of the dependent variable in the estimation equation to deal with correlated unobserved individual heterogeneity. In particular, we control for correlated unobserved individual heterogeneity through the method suggested by Blundell, Griffith, and Van Reenen, (1999) and Blundell, Griffith, and Windmeijer (2002), which is applicable in both linear and nonlinear models. In fact, it is very convenient for the case of nonlinear models due to the so-called incidental parameter problem in the fixed-effect estimators for this type of model. Blundell et al.’s (1999, 2002) approach implies modeling firms’ unobserved heterogeneity as a linear function of presample means of the dependent variable plus a firm-specific random term that follows a conditional normal distribution. Therefore, this methodology to allow firms’ unobserved individual effects to be correlated with regressors requires including the presample means Exp i,Mean,0 among regressors in the export equation. As we start estimation in 2000 and regressors are lagged one period, we use 1997 and 1998 as the presample period.[8]
Panel probit estimates for SMEs export strategy
| (1) | (2) | |
|---|---|---|
| Variables | Export t | Export t |
| Export t−1 | 1.912*** | 1.920*** |
| (0.072) | (0.072) | |
|
|
0.158*** | 0.157** |
| (0.061) | (0.062) | |
|
|
0.115** | 0.121** |
| (0.054) | (0.053) | |
| Financial_Restrictions t−1 | −0.041* | −0.041* |
| (0.025) | (0.025) | |
| Growth_Domestic_Sales t−1,t | −0.127** | 0.003 |
| (0.057) | (0.100) | |
| Growth_Domestic_Sales t−1,t *High capac.utiliz. t−1 | −0.239** | |
| (0.115) | ||
| High capac.utiliz t−1 | 0.014 | |
| (0.055) | ||
| log(Average_wage t−1) | 0.093 | 0.087 |
| (0.098) | (0.100) | |
| Intermediates price change (%) t−1,t | −0.002 | −0.003 |
| (0.003) | (0.003) | |
| log(LabProd) t−1 | 0.284*** | 0.286*** |
| (0.047) | (0.047) | |
| Ratio temporary employment0 | −0.014 | −0.018 |
| (0.131) | (0.131) | |
| Foreign participation t−1 | 0.198† | 0.195† |
| (0.124) | (0.125) | |
| Medium t−1 | 0.409*** | 0.408*** |
| (0.058) | (0.058) | |
| log(Age t−1) | 0.041 | 0.043 |
| (0.039) | (0.039) | |
| Export presample mean | 2.172*** | 2.163*** |
| (0.170) | (0.169) | |
| Lambda cont.operation | −0.935* | −0.820† |
| (0.497) | (0.531) | |
| Constant | −5.600*** | −5.571*** |
| (0.810) | (0.825) | |
| Proportion of total variance contributed by the panel level variance | 0.415***(0.036) | 0.413***(0.036) |
| Log pseudo-likelihood | −3271.7460 | −3268.4431 |
| N observations | 18,167 | 18,165 |
| N firms | 2,714 | 2,714 |
Note: All estimations include industry and time dummies. Clustered robust standard errors are in parentheses. When a previously estimated variable is included among regressors, we provide block-bootstrapped standard errors in parentheses. ***, **, and * mean significant at the 1, 5, and 10% level, respectively. † means slightly above the 10% level (11 and 11.7% for the foreign participation variable in columns 1 and 2, respectively, and 12.2% for the Lambda continuation in operation variable in column 2).
We also correct the export equation for nonrandom attrition due to the observability of SMEs export decisions only for firms continuing in operation. To consider this problem, we implement a Heckman’s (1979) two-stage selection correction. In the first stage, we estimate a probit model with the probability of firms’ survival until period t (from our sample period), conditional on their survival until period t − 1. From the estimates of this survival equation (estimated with 19,866 observations corresponding to 2,824 firms), we construct the Heckman’s lambda continuation in operation term (also known as the inverse Mills ratio). Next, in a second stage, we include this term among regressors in the export decision equation.[9] At the bottom part of Table 5, we show the estimated coefficient associated with the lambda selection correction term for the export equation. Its statistical significance is indicative of the need to include it in the export equation to avoid bias caused by nonrandom attrition in our estimation sample.
In the Probit model for firms’ survival, we explain firms’ continuation in operation until period t with the one period lagged regressors that follow: the firms’ export status, the degree of firms’ innovativeness as captured by the introduction of product or process innovation, a variable for the degree of financial restrictions that firms face, demand conditions as proxy by an index of market recession (which has been constructed as the opposite of the market dynamism index provided in the survey and, hence, now the closer to 100 the worse the market situation),[10] some variables to proxy for changes in competitiveness due to supply-side factors (cost shifters) such as log of labor productivity, log wage per worker, the (initial) firm-level share of temporary workers or the percentage change in prices of intermediates, control variables at the firm level (such as a firm size dummy distinguishing between small- and medium-size firms and the log of age), time dummies, and sector dummies.[11] In addition, we add a variable (lagged one period) on the utilization of the firm’s productive capacity (percentage of the production capacity that is being used). As we have already mentioned, this variable is expected to be crucial in a capacity-constrained model (Almunia et al. 2021). However, unlike in the subsequent export equation, in the firms’ continuation in operation equation, a lower utilization of the firms’ productive capacity may be indicative of an economic slump and, therefore, reinforce the role of the index of market recession in this equation.
As for the variable of financial restrictions that firms may face, following Beneito, Rochina-Barrachina, and Sanchis-Llopis (2015) and Máñez-Castillejo, Rochina-Barrachina, Sanchis-Llopis, and Vicente (2014), we construct, with information on the financial statements in the ESEE survey, a measure of the financial cost of firms’ debt with financial institutions. Although the financial crisis has gone hand in hand with a significant decrease in the average cost of debt, it was also characterized by a severe difficulty of access to credit (see Figure 6 for the decrease in the yearly growth rate of loans to nonfinancial institutions in Spain). Unfortunately, we do not have information in the survey to capture this firm’s dimension of financial restrictions. Hence, even if we acknowledge, as in the study by Almunia et al. (2021), that firms’ financial restrictions could have been better captured by a firms’ measure of credit rationing, similar to them, our assumption here is that firms facing higher costs of debt should be the ones who suffer most from credit restrictions. Given this assumption, we introduce in the estimation a transformation of the firm’s financial cost variable that consists of its per-year deviation with respect to the average cost paid by other firms in the same year.[12]
Due to the nature of the dependent variable in the survival equation, with a value of 1 if the firm survives in period t and 0 otherwise, we cannot treat unobserved correlated individual heterogeneity with the inclusion of presample means of the dependent variable in the equation to estimate. This means that presample years would be, by definition, 1 for all firms. Note that if firms are still alive in the future periods, they were necessarily previously alive. For this reason and also due to the so-called incidental parameter problem in fixed-effect estimators for nonlinear models, this particular equation is first estimated with a random-effects Probit. However, since the estimated proportion of the total variance contributed by the variance component at the panel level is not statistically significantly different from zero (see the end of Table A2), the panel Probit estimator is not different from the pooled probit estimator. Due to both this and the fact that this equation is merely an auxiliary equation in our work, the final estimates that we present for this equation correspond to those of the more efficient pooled probit.
According to the results presented in Table A2 (column 1: original annual data) from the estimation of this auxiliary equation, the probit model of firms’ survival versus death, we see that for SMEs, exporting, being more productive or introducing innovations (mainly process innovations but also product) increase their likelihood of survival. Conversely, SMEs that suffer more financial restrictions, face a more recessive market situation, pay higher wages per worker, have a higher share of temporary workers, or suffer a greater increase in the prices of their intermediate inputs reduce their chances of survival. As expected, a lower utilization of the firms’ productive capacity reinforces the negative role of the recessive index in firms’ survival. Finally, foreign participation per se does not guarantee survival, and we find evidence of positive duration dependence since the older a firm is, the greater its prospects for survival.[13]
Although ESEE providers declare that new firms are incorporated in the panel to avoid reductions in population coverage across industries and size segments, on the survey website, there are some years in which there is no entry in the sample.[14] To check whether our results in column 1 of Table A2 are robust to this potential noise in the estimation of the survival equation, we add column 2 estimates. Unlike column 1, in which each observation in the time dimension corresponds to 1 year, column 2 presents estimates where each observation in the time dimension corresponds to a 3-year rolling average of each variable for each firm.[15] Since with this approach the results are remarkably similar, we trust our results in column 1 as plausible and stick to them to take advantage of the full-time variation in our annual data.
After having tackled, both the econometric issue of correlated unobserved individual heterogeneity and that of nonrandom attrition into the sample, we estimate the export equation by pseudo-simulated maximum likelihood applied to the likelihood function of the following panel probit model (Roodman, 2011):[16]
where θ 0 controls for persistence in the export strategy generated by sunk costs associated with this activity; θ 1 is a vector that accounts for firms’ expected returns from exporting to be affected by firms’ product and process innovation activities; θ 2 takes into account whether firms that are more financially constrained face problems that decrease their likelihood of exporting;[17] θ 3 captures the effect of demand conditions on firms’ decisions to invest in export activities; and the vector C it−1 includes (following Almunia et al., 2021) variables affecting firms’ competitiveness from the supply side such as log labor productivity, log average wages, the (initial) firm-level share of temporary workers, and price variation of intermediate inputs.[18] All these factors may encourage exports by affecting production costs (costs shifters). Furthermore, average wages may have undergone a downward adjustment in response to the effects of a recession in the labor market (the so-called internal devaluation). These factors are relevant to our export equation since they allow us to distinguish between the export incentives generated by “internal devaluation,” production costs, and supply-side effects from those generated by a firm’s strategic reaction to the fall in the internal demand. In addition, the vector Z it−1 includes control variables at the firm level (the foreign capital participation dummy, log age, and the dummy variable for medium firms versus small firms). Sector (s j ) and year (δ t ) dummies are also included. Finally, ε it is a composite error term that includes permanent individual unobserved heterogeneity and an idiosyncratic error term.
In the export equation, the variable for demand conditions is simply the growth (in percent) of domestic sales (from period t − 1 to t). The reason for this is to verify with our data the hypothesis of “venting-out” in the study by Almunia et al. (2021), which show that once supply factors are controlled, there is a negative relationship between domestic sales growth and export decisions due to a firms’ strategic reaction.
Next, we comment on the estimates for expression (1) presented in Table 5 (columns 1 and 2). First, as for the continuation in operation correction term included, it is statistically significant. Its negative sign suggests that unobservables that increase firms’ survival decrease the likelihood of exporting. This interesting result reinforces the idea that SMEs use the export strategy as a means to avoid death. Consequently, when the death is less likely to occur, some SMEs may be discouraged from entering foreign markets. Furthermore, we find high persistence (state dependence) in the firm’s export status, which is in favor of the existence of sunk costs in that activity. A different type of persistence generated by the presence of unobserved individual heterogeneity (captured by export pre-sample means) also exists. We also find that innovation activities affect positively the payoffs from exporting. Moreover, we confirm that the previously more productive firms are the ones that self-select into exports.
Regarding the results for the variables capturing firms’ financial restrictions and demand conditions, we obtain the following: first, that financial restrictions are binding, and second, we confirm the “venting out” hypothesis in the study by Almunia et al. (2021). This means that a slump in domestic sales encourages SMEs’ export decisions (see in Table 5 that the coefficient on the variable Growth_domestic_sales in column 1 is negative and significant). However, the “internal devaluation” argument that operates through the average wage variable is not supported by our data since this variable is not statistically significant. Neither is the ratio of temporary workers nor the price variation in intermediates. Therefore, from the group of supply-side variables (or costs shifters), the one that is relevant is labor productivity.
As for the firm-level control variables, the ones statistically significant are foreign capital participation and the medium-size dummy variable, but not the age variable. The positive signs of the coefficients associated with these variables indicate, first, that being foreign participated may facilitate access to foreign markets and, hence, facilitate exports and, second, that in the group of SMEs, small firms are less likely to export.
Before leaving the results on the firms’ export decision and comment on the employment equations, we must remark on an important result in our specification in column 2 of Table 5. This column presents an extension of our baseline specification of the export equation in column 1. This extension incorporates two new regressors to the previous specification: a dummy variable with value 1 when the utilization of the firm’s productive capacity is above the median (mean) in the sample (80%), 0 otherwise, and the crossed product of the variable growth in domestic sales and the previous dummy. The purpose of this extension of the model is to directly test the theoretical prediction presented by Almunia et al. (2021): That with increasing marginal costs in production, the firms with the greatest use of their productive capacity benefit the most from their short-term downward movement in their marginal cost curve (caused by their adjustment in flexible factors to the decrease in the domestic demand). These firms should be the ones that can lower prices the most by reducing marginal costs and, therefore, those that can increase competitiveness the most and have more export incentives and opportunities. In fact, this is shown in column 2. The growth variable of the domestic demand is no longer significant but, on the contrary, it is significant for exporting firms for which it also maintains its negative sign. The coefficient for the variable growth in domestic sales for exporters in column 2 of Table 5 has a value of –0.236 (with a p-value of 0.000), and it comes from adding the coefficient of the growth variable of domestic sales with the coefficient of the cross product of this variable with the dummy variable of firms with high utilization of their production capacity.
Now that the theoretical issues relevant to our work have been discussed and some of them tested, we can move on to presenting our employment equations. Notice that, the final goal of our study is to say something about the role of export participation on SMEs employment resilience during recessionary periods particularly affecting the domestic demand. Thus, to achieve it, we estimate a baseline specification for the employment equation of a firm that does not yet distinguish workers by the type of contract (temporary or permanent) nor does it allow export participation to play a specific role in situations of adverse demand. Hence, in this first specification, we use the log of firms’ employment as the dependent variable in an equation where the main explanatory variables are a firm’s export participation dummy, a variable capturing firms’ demand conditions, and some controls. In particular, we estimate the following dynamic equation that relates the firms’ number of workers with the firms’ export participation strategy:
where log(Emp it ) is the log of the number of workers of firm i in period t, log(Emp it−1) is its one period lagged value, and Exp it−1 is a dummy variable that captures if the firm exported in period t − 1. Therefore, β 2 measures the firm’s employment premium from exporting. Firms’ demand conditions are captured by a dummy variable (RecessDemand it−1) that is constructed from the index of market dynamism provided by the ESEE. The index of market dynamism (that ranges from 0 to 100) is a weighted average of the recession, stability, or expansion situation of the five most relevant different markets where firms operate. From this index, the dummy variable RecessDemand it−1 is constructed as being equal to one when the index value is between 0 and 35. Doraszelski and Jaumandreu (2013) also use this information from the ESEE to proxy for the macroeconomic business cycle in Spain. They show that in the 1990s, this variable mirrors the macroeconomic cycle since, for instance, in growth periods, firms tend to report that their markets are in expansion. Furthermore, we also corroborate this in our sample period in this article, since from 2000–2008, the percentage of firms declaring a recessive demand is 17.88%, while in the period 2008–2014, the percentage grows to 46.84%.[19] Furthermore, the recessive demand dummy is clearly dominated by the behavior of the internal demand because even for exporters, the percentage of domestic sales is 72%. Equation (2) also includes a vector Z it−1 of control variables at the firm level that comprises our measure of firms’ financial restrictions and the log of firms’ age. In addition, we also include in equation (2) a vector of time (δ t ) and sector dummies (s j ). Finally, u it is a composite error term equal to α i + e it , where α i represents individual unobserved heterogeneity and e it is an idiosyncratic error term. The reason why our specification in equation (2) is dynamic is being able to consider persistence in firms’ employment.
As we are not only interested in firms’ total employment but also in its composition as regards types of contracts (permanent or temporary), one of the departures from our baseline specification in equation (2) will consist of substituting total employment for the number of permanent or temporary workers in the firm.
Estimation results for equation (2) are presented in Table 6. Columns 1–3 correspond to the firms’ total number of workers, number of workers under permanent contracts, and number of workers under temporary contracts, respectively. In addition, in columns 4–6, our baseline specification in (2) is widen to include further among regressors the interaction term between the export dummy and the dummy variable for adverse demand conditions. The purpose of this extension is precisely to answer our main research question: Whether participating in the export market acts as a buffer against the adverse effects of the economic cycle on firms’ employment. We wonder if exporting helps mitigate job losses in recessionary periods.
Export participation and SMEs employment resilience
| (1) | (2) | (3) | (4) | (5) | (6) | (7) | (8) | (9) | (10) | (11) | (12) | |
|---|---|---|---|---|---|---|---|---|---|---|---|---|
| Variables | Total employment | Permanent employment | Temporary employment | Total employment | Permanent employment | Temporary employment | Total employment | Permanent employment | Temporary employment | Total employment | Permanent employment | Temporary employment |
| log (Total employment) t−1 | 0.815*** | 0.814*** | 0.776*** | 0.775*** | ||||||||
| (0.033) | (0.033) | (0.025) | (0.025) | |||||||||
| log (Permanent employment) t−1 | 0.768*** | 0.768*** | 0.720*** | |||||||||
| (0.034) | (0.034) | (0.023) | 0.718*** | |||||||||
| log (Temporary employment) t−1 | 0.718*** | 0.719*** | 0.729*** | (0.023) | 0.728*** | |||||||
| (0.019) | (0.019) | (0.021) | (0.021) | |||||||||
| Export t−1 | 0.027*** | 0.044*** | 0.030 | 0.017*** | 0.034*** | 0.016 | 0.027*** | 0.023*** | 0.004 | 0.027*** | 0.022*** | −0.002 |
| (0.006) | (0.007) | (0.025) | (0.006) | (0.007) | (0.022) | (0.007) | (0.007) | (0.029) | (0.007) | (0.007) | (0.030) | |
| Recessive_demand t−1 | −0.046*** | −0.045*** | −0.169*** | −0.067*** | −0.065*** | −0.200*** | −0.070*** | −0.065*** | −0.214*** | −0.072*** | −0.068*** | −0.221*** |
| (0.005) | (0.006) | (0.023) | (0.008) | (0.010) | (0.031) | (0.008) | (0.009) | (0.040) | (0.008) | (0.010) | (0.041) | |
| Export t−1*recessive_demand t−1 | 0.035*** | 0.033*** | 0.051 | 0.036*** | 0.036*** | 0.058 | 0.037*** | 0.036*** | 0.057 | |||
| (0.010) | (0.011) | (0.042) | (0.009) | (0.010) | (0.052) | (0.009) | (0.010) | (0.052) | ||||
| Financial_restrictions t−1 | 0.000 | 0.003 | −0.009 | 0.000 | 0.003 | −0.009 | 0.001 | 0.003 | −0.009 | 0.001 | 0.003 | −0.009 |
| (0.002) | (0.003) | (0.011) | (0.002) | (0.003) | (0.011) | (0.002) | (0.002) | (0.010) | (0.002) | (0.002) | (0.010) | |
| log (Age t−1) | −0.019*** | −0.029*** | −0.108*** | −0.019*** | −0.029*** | −0.108*** | −0.024*** | −0.029*** | −0.112*** | −0.022*** | −0.027*** | −0.111*** |
| (0.005) | (0.005) | (0.024) | (0.005) | (0.006) | (0.024) | (0.005) | (0.007) | (0.020) | (0.005) | (0.007) | (0.021) | |
| log (Lab prod) t−1 | 0.050*** | 0.051*** | 0.038* | 0.050*** | 0.051*** | 0.033* | ||||||
| (0.006) | (0.007) | (0.020) | (0.006) | (0.007) | (0.020) | |||||||
|
|
0.006 | 0.014** | 0.027 | |||||||||
| (0.006) | (0.007) | (0.028) | ||||||||||
|
|
0.017*** | 0.017*** | 0.063** | |||||||||
| (0.005) | (0.007) | (0.024) | ||||||||||
| Foreign participation t−1 | 0.002 | 0.026** | 0.057 | |||||||||
| (0.010) | (0.012) | (0.049) | ||||||||||
| log (Tot. employ.) presample mean | 0.153*** | 0.153*** | 0.172*** | 0.171*** | ||||||||
| (0.028) | (0.028) | (0.020) | (0.020) | |||||||||
| log (Perm. employ.) presample mean | 0.168*** | 0.169*** | 0.195*** | 0.193*** | ||||||||
| (0.027) | (0.027) | (0.017) | (0.017) | |||||||||
| log (Temp. employ.) presample mean | 0.313*** | 0.313*** | 0.283*** | 0.280*** | ||||||||
| (0.019) | (0.019) | (0.018) | (0.017) | |||||||||
| Lambda cont. operation | −0.319*** | −0.430*** | −1.075*** | −0.309*** | −0.420*** | −1.061*** | −0.236*** | −0.364*** | −0.948*** | −0.173*** | −0.300*** | −0.730*** |
| (0.046) | (0.055) | (0.182) | (0.046) | (0.056) | (0.182) | (0.047) | (0.059) | (0.213) | (0.052) | (0.066) | (0.242) | |
| Constant | 0.084*** | 0.223*** | −0.482*** | 0.090*** | 0.228*** | −0.475*** | −0.433*** | −0.298*** | −0.841*** | −0.436*** | −0.290*** | −0.808*** |
| (0.030) | (0.035) | (0.130) | (0.029) | (0.034) | (0.130) | (0.070) | (0.078) | (0.251) | (0.070) | (0.078) | (0.251) | |
| N observations | 18,286 | 18,286 | 18,286 | 18,286 | 18,286 | 18,286 | 18,117 | 18,117 | 18,117 | 18,117 | 18,117 | 18,117 |
| N firms | 2,723 | 2,723 | 2,723 | 2,723 | 2,723 | 2,723 | 2,795 | 2,795 | 2,795 | 2,795 | 2,795 | 2,795 |
Note: All estimations include industry and time dummies. Since all regressions include the estimated lambda term, we provide block-bootstrapped standard errors in parentheses. ***, **, and *mean significant at the 1, 5, and 10% level, respectively.
From a methodological point of view, we initially tackle two econometric issues. The first is related to firms’ unobserved heterogeneity (unobserved individual effects α i ), which may be correlated with regressors in equation (2) as simply by model construction they are correlated with the included lagged dependent variable among regressors. Although our regressions for total employment and permanent employment are linear, this is not the case for the temporary employment regression. In this case, we find in our data that 42% of SMEs declare to have zero temporary workers. Given the considerable amount of zeros, we will use a Tobit model for estimation of the temporary workers equation. Given that in this case the model would not be linear and also to give a homogeneous econometric treatment to individual firms’ effects in all employment equations (which will facilitate the interpretation of comparative results between permanent or temporary employment), we chose to control them again using the correlated individual effects methodology developed by Blundell et al. (1999, 2002), which is applicable to both linear and nonlinear models. Hence, we model the distribution of α i conditional on the presample mean of the dependent variable log(Employment i,Mean,0) as follows:
where π i |(log(Employment i,Mean,0)) ∼ Normal(0,σ π 2). Next, we add the variable log(Employment i,Mean,0) among regressors in equation (2). This new regressor is calculated as the within the firm mean of log(Employment i,Mean,0) for the considered presample years. Since our sample period for estimation starts at year 2000 and most of regressors are lagged one period to avoid potential simultaneity bias, we consider as presample years 1997 and 1998. This method allows for correlation of firms’ individual effects with regressors in equation (2). We observe at the bottom of Table 6 that persistent firms’ effects are relevant to explain firms’ number of workers. Persistent firms’ effects that positively affect employment might be indicative of higher quality or managerial ability. Notice that modeling unobserved individual heterogeneity with presample means requires replacing in equation (2) the variable log(Employmenti,Mean, 0) by log (Permanent employmenti,Mean,0) or log (Temporary employmenti,Mean,0) in the regressions where the dependent variables are the number of permanent or temporary workers, respectively.
The second econometric issue is related to the fact that we only observe employment conditional on firms surviving until period t, and hence, estimated coefficients in the employment equations may suffer from nonrandom attrition bias when, for instance, firms that survive are simultaneously more likely to export and have larger workforces. If this was the case, we would be facing an endogenous exit of firms from the market. To solve it, we follow the same strategy as in the export equation, implementing therefore the Heckman’s (1979) two-stage selection correction.
After having tackled these econometric issues, we will now comment on the results obtained for the main regressors in the employment equations (Table 6). In our specifications in columns 1–3, we obtain that there is a high persistence (state dependence) in the evolution of SMEs employment (the coefficient on the variable log(Employment it−1) is positive and significant for total, permanent, or temporary workers). The positive and significant estimates for β 2 (associated to the export decision in period t − 1 in expression (2)) for total and permanent employment suggest that exporting allows SMEs to maintain a higher level of employment. These rewards in employment are 2.7% for total employment and 4.4% for permanent employment. However, there is a nonsignificant effect of SMEs export participation on temporary employment. Hence, exporting contributes to increasing the number of firm’s workers, and since it seems to be more oriented to the hiring/consolidation of permanent workers, it contributes to the change in the composition of SMEs workforce by increasing the ratio of permanent to temporary workers. Thus, exporting also contributes to increasing the quality of contracts within the firm. Consequently, an exporting firm will tend to have a higher level of employment with a higher number of permanent contracts and a lower proportion of temporary workers compared to a nonexporting firm. In addition, for SMEs, facing a recessive demand has a negative impact on their level of employment in all cases (total, permanent, or temporary employment). However, as expected, employment destruction related to recessive demand conditions is much larger for temporary employment. In particular, firms have a decrease almost four times greater in temporary contracts than permanent contracts since being in a recessive period reduces the number of temporary workers by 16.9% and that of permanent workers by 4.5%. Total employment and, specially, temporary employment are much more sensitive to firms’ recessive periods than to firms’ exporting decisions. For the case of permanent employment, both effects are of a similar magnitude but with an opposite sign.
As highlighted earlier, in this article, we are especially interested not only in the direct role of exports in employment but also in its particular effect during recessions. This leads us to add the cross variable Exp it−1 × RecessDemand it−1 to our previous specifications. The estimation results of these widened regressions are provided in columns 4–6 of Table 6. Interestingly enough, an exporting firm can offset around a half of the effect of a recessive period on employment destruction. This comes from the effect that exporting has on permanent employment in recessions since no significant effect is found for temporary employment. In addition, for exporters in recessive periods, there is an extra increase in the ratio of permanent to temporary workers. In particular, according to our results, SMEs exporters (in comparison to nonexporters) not only get higher total/permanent employment in good times (1.7%/3.4% reward, respectively) but also this advantage is reinforced when facing recessive demand conditions (1.7% + 3.5% = 5.2%/3.4% + 3.3% = 6.7% reward, respectively). Hence, for SMEs, exporting during recessive periods helps offset the negative effect that a downturn in the cycle has per se in SMEs employment. This compensation acts for permanent employment and, therefore, favors the ratio of permanent to temporary workers.
In the case of control variables in estimation, for financial restrictions, there was no effect on employment either for permanent or temporary workers. This may be coherent with the fact that this variable only affects employment through its indirect effect on firms’ survival chances and export decisions. The effect of firm age is negative and significant and may also suggest that by controlling for nonrandom selection determining continuation in operation, where age is a clear factor of firms’ survival, the age variable in the employment equations might be capturing instead the effects of the product life cycle and its maturity.
Finally, in columns 7–12, we extend the specifications in columns 4–6 to control for some confounding factors that may both affect firms’ export decisions and firms’ employment. The confounding factors considered are variables that were not originally included in our employment equations but that are significant to explain the firms’ export decision. A clear candidate for this robustness check of our benchmark results in columns 4–6 is undoubtedly productivity. In a model suggested by Melitz (2003), export is a function of productivity, and when productivity improves, both the probability of exporting and the size of the firm grow. The results of this extension are in columns 7–9 in Table 6. Labor productivity is statistically significant and with a positive sign in the employment equations (although with a more significant and higher coefficient for permanent employment than for temporary employment). Nevertheless, the inclusion of productivity in the employment equations does not alter the previous results or the previous conclusions that we derived from columns 4–6.
In a second robustness check, the results of which we present in columns 10–12 in Table 6, we control for potential additional confounders that affect the decision to export. These are related to firms’ innovation activities, such as the introduction of new products and processes, and the presence of foreign capital. Productivity continues to be statistically significant, and with a positive sign, process innovation is positively related to both types of employment, permanent and temporary, and product innovation and the participation of foreign capital only present effects on permanent employment. Most importantly, our previous benchmark results and the conclusions in columns 4–6 still hold.
Overall, the summary results from Table 6 are as follows. First, there is persistence in employment both coming from state dependence and individual unobserved heterogeneity. Second, for SMEs, export activities have a positive effect on total employment that is especially relevant in bad times and that only occurs through permanent employment. Hence, there are compositional effects on employment from the export activity that work in the direction of increasing the ratio of permanent to temporary workers. Thus, for SMEs, we have obtained rewards in employment from exporting. Furthermore, these rewards from the export activity (versus nonexporters) have been reinforced during the most difficult part of the business cycle, helping exporters compensate for declining employment associated with poor demand conditions. In fact, all these effects come from the behavior of permanent employment, which is also reflected in the total employment of firms.
Moreover, and even more relevant to us, we conclude that with our empirical exercise, we provide some evidence on the following two hypotheses already in our theoretical framework at the beginning of Section 4. First, it seems that in the short term, when facing a fall in domestic demand, SMEs reduce the use of flexible inputs such as labor and especially temporary workers. Second, exporting SMEs can halve this job destruction in their total employment, and this is due to the evolution of permanent workers.
5 Concluding Remarks
Spain, among the southern European countries, is a relevant case study to analyze the effect of SMEs export participation on their resilience to job destruction generated by recessive periods associated with the domestic demand. During the Great Recession, it was the only country in this group that simultaneously suffered a sharp drop in GDP and domestic demand, a sharp increase in the unemployment rate, and a significant take-off in its exports and in the participation of SMEs in this activity. Furthermore, a high number of temporary workers, typically considered more vulnerable and precarious, characterized the composition of employment in Spain at the beginning of the recession. For all these reasons, in this study, we were interested not only in analyzing the link between SMEs export participation and their level of employment in recessive periods but also in differentiating its effects for workers with temporary or permanent contracts.
By using a firm-level panel dataset for manufacturing SMEs provided by the Spanish Survey on Business Strategies (ESEE) for the period 2000–2014, we obtain that exporting SMEs show greater resilience in terms of employment in a period of recession than nonexporting SMEs. Furthermore, this compensatory effect of exports on employment works in favor of permanent workers, being statistically insignificant for temporary workers. This implies that the ratio of permanent to temporary workers increases for SMEs during recessive periods. In addition, exporting increases SMEs survival chances. Otherwise, SMEs survival is negatively affected by financial constraints, production costs, and a recessive demand. Finally, we provide further evidence supporting that SMEs participation in exports also obeys to a reaction to the fall in the domestic demand (the so-called “venting out” hypothesis). Likewise, we confirm the theoretical prediction in the study by Almunia et al. (2021), which states that firms with a higher production capacity used can benefit the most by adapting in the short term to the fall in the domestic demand. These firms can move downward in their marginal cost curve by adjusting their labor input. With this, they can lower prices, consequently increase their competitiveness, and therefore, export and increase their profits.
We can extract several policy recommendations for SMEs from this article. Given that, on the one hand, exporting in recessive periods has helped SMEs to offset the negative effect of the downturn per se in their levels of employment, and on the other hand, it has also been a good strategy for SMEs survival, public policies should facilitate this activity among SMEs. For instance, according to our results for the export equation, this can be done by promoting innovation activities among SMEs, alleviating their financial constraints, facilitating their access to external markets, or increasing their competitiveness by promoting productivity enhancing policies. These policies would not only help offset the job losses suffered by SMEs in recessive periods but also, according to our results, would favor permanent employment over temporary employment, which can help alleviating instability and precariousness in the Spanish labor market.
Our study contributes to the European needs of boosting SMEs performance. Interreg Europe presents in its agenda the necessity of implementing better policies to boost and support SMEs since the competitiveness of these firms is at the forefront of their objectives (Interreg Europe, 2021). To achieve this increase in competitiveness, the Horizon 2030 of the European Commission also highlights the necessity of promoting the internationalization of SMEs (Bichisao, Mora, & Pizzi, 2019). Hence, this article sheds light on how this internationalization of SMEs, more precisely through exporting, can help offset the shocks on employment suffered during downturns, gaining this way in competitiveness.
-
Funding information: María Engracia Rochina Barrachina acknowledges financial support from Grant ECO2017-86793-R funded by MCIN/AEI/10.13039/501100011033 and by “ERDF A way of making Europe” as well as from Generalitat Valenciana (PROMETEO/2019/095). Carolina Calatayud Galiana also thanks the previous PROMETEO project and financial support from the Spanish Ministerio de Universidades (reference number FPU20/02097). Daniel Aparicio Pérez acknowledges financial support from the Conselleria de Hisenda i Model Econòmic (HIECPU/2020/01). The usual disclaimer applies.
-
Conflict of interest: Authors state no conflict of interest.
Appendix
Variables description
| Variables | Description |
|---|---|
| Export | Dummy variable taking value 1 if the firm exports and 0 otherwise |
| Total employment | Number of workers |
| Permanent employment | Number of permanent workers |
| Temporary employment | Number of temporary workers |
| InnovProduct | Dummy variable taking value 1 if the firm has introduced a product innovation and 0 otherwise |
| InnovProcess | Dummy variable taking value 1 if the firm has introduced a process innovation and 0 otherwise |
| Recessive demand | Dummy variable taking value 1 if the index of market dynamism is between 0 and 35 (indicating a recessive demand) and 0 if the index is between 36 and 100 (indicating a stable or expansive demand) |
| Recessive index | It is based on the index of market dynamism that ranges between 0 and 100, whose direction has been reversed, so that the closer to 100, the more recessive the market is |
| Financial restrictions | Deviation of the firm’s financial cost of long-term loans with financial institutions with respect to the average cost paid by other firms in the same year |
| Growth_Domestic_Sales | Growth of domestic sales, expressed on a per unit basis |
| Capacity utilization | Percentage of the productive capacity used by the firm |
| High capac. utiliz. | Dummy variable taking value 1 if the productive capacity used is 80% or higher and 0 otherwise |
| Average_wage | Average salary per worker (in euros) |
| Intermediates price change (%) | Change in the prices of intermediate inputs (in percentage) |
| LabProd | Labor productivity measured as output per worker (in euros) |
| rat_temporary | Temporary employment over total employment, expressed on a per unit basis |
| Foreign participation | Dummy variable taking value 1 if the firm has foreign capital participation and 0 otherwise |
| Age | Firm’s age in years |
Probit estimates for SMEs continuation in operation
| (1) | (2) | |
|---|---|---|
| Variables | Continuation in operation t | Continuation in operation t |
| (Annual data) | (3-Year rolling average) | |
| Export t−1 | 0.093*** | 0.067† |
| (0.035) | (0.042) | |
|
|
0.098** | 0.097† |
| (0.048) | (0.065) | |
|
|
0.234*** | 0.255*** |
| (0.040) | (0.057) | |
| Financial_restrictions t−1 | −0.039** | −0.072** |
| (0.016) | (0.029) | |
| Recessive_index t−1 | −0.002*** | −0.003*** |
| (0.001) | (0.001) | |
| log(Average_wage t−1) | −0.441*** | −0.416*** |
| (0.057) | (0.071) | |
| Intermediates price change (%) t−1,t | −0.003** | −0.007** |
| (0.002) | (0.003) | |
| log(Lab prod) t−1 | 0.154*** | 0.185*** |
| (0.028) | (0.032) | |
| Ratio temporary employment0 | −0.170** | −0.017 |
| (0.066) | (0.076) | |
| Capacity utilization t−1 | 0.007*** | 0.007*** |
| (0.001) | (0.001) | |
| Foreign participation t−1 | −0.129** | −0.192*** |
| (0.058) | (0.067) | |
| Medium t− 1 | −0.007 | −0.062 |
| (0.038) | (0.046) | |
| log(Age t−1) | 0.070*** | 0.167*** |
| (0.020) | (0.024) | |
| Constant | 8.550*** | 7.494*** |
| (0.557) | (0.637) | |
| Proportion of total variance contributed by the panel level variance | ||
| 9.32 × 10⁻⁷ | 0.047 | |
| (0.038) | (0.035) | |
| Log pseudo-likelihood | −4178.8394 | −3581.4707 |
| N observations | 19,866 | 15,368 |
| N firms | 2,824 | 2,477 |
Note: All estimations include industry and time dummies. Clustered robust standard errors are in parentheses. ***, **, and * mean significant at the 1, 5, and 10% level, respectively. † means slightly above 10% level (11% for the export variable and 13% for the Product innovation variable). The dataset used in column 2 is constructed calculating 3-year rolling averages of all the variables for each firm. Since the dependent variable is a binary variable 0/1 and we are estimating a probit model, the rolling average of the dependent variable is set to 0 when in a particular interval the firm dies.
References
Almunia, M. , Antràs, P. , Lopez-Rodriguez, D. , & Morales, E. (2021). Venting out: Exports during a domestic Slump. American Economic Review, 111(11), 3611–3662.10.3386/w25372Suche in Google Scholar
Bakhtiari, S. , Breunig, R. , Magnani, L. , & Zhang, J. (2020). Financial constraints and small and medium enterprises: A review. Economic Record, 6(315), 506–523.10.1111/1475-4932.12560Suche in Google Scholar
Bartoloni, E. , Arrighetti, A. , & Landini, F. (2020). Recession and firm survival: is selection based on cleansing or skill accumulation? Small Business Economics, 1–22.10.1007/s11187-020-00378-0Suche in Google Scholar
Beck, T. , Demirgüç-Kunt, A. , & Maksimovic, V. (2008). Financing patterns around the world: Are small firms different? Journal of Financial Economics, 89(3), 467–487.10.1016/j.jfineco.2007.10.005Suche in Google Scholar
Beneito, P. , Rochina-Barrachina, M. E. , & Sanchis-Llopis, A. (2015). Ownership and the cyclicality of firms’ R&D investment. International Entrepreneurship and Management Journal, 11(2), 343–359.10.1007/s11365-014-0320-9Suche in Google Scholar
Bentolila, S. , Cahuc, P. , Dolado, J. J. , & Le Barbanchon, T. (2012). Two-tier labour markets in the great recession: France versus Spain. The Economic Journal, 122(562), 155–187.10.1111/j.1468-0297.2012.02534.xSuche in Google Scholar
Bernard, A. B. , & Jensen, J. B. (1999). Exceptional exporter performance: cause, effect, or both?. Journal of International Economics, 47(1), 1–25.10.3386/w6272Suche in Google Scholar
Bichisao, G. , Mora, M. , & Pizzi, E. (2019). Horizon 2030. Looking ahead to challenges and opportunities. Deloitte: European Investment Bank.Suche in Google Scholar
Biscourp, P. , & Kramarz, F. (2007). Employment, skill structure and international trade: Firm-level evidence for France. Journal of International Economics, 72(1), 22–51.10.1016/j.jinteco.2006.07.005Suche in Google Scholar
Blundell, R. , Griffith, R. , & Van Reenen, J. (1999). Market share, market value and innovation in a panel of British manufacturing firms. The Review of Econometric Studies, 66(3), 529–554.10.1111/1467-937X.00097Suche in Google Scholar
Blundell, R. , Griffith, R. , & Windmeijer, F. (2002). Individual effect and dynamics in count data model. Journal of Econometrics, 108, 113–131.10.1920/wp.ifs.1999.9903Suche in Google Scholar
Buch, C. M. , Kesternich, I. , Lipponer, A. , & Schnitzer, M. (2014). Financial constraints and foreign direct investment: firm-level evidence. Review of World Economics, 150(2), 393–420.10.1007/s10290-013-0184-zSuche in Google Scholar
Caballero, R. J. , & Hammour, M. L. (1994). The cleansing effect of recessions. American Economic Review, 84(5), 1350–68.10.3386/w3922Suche in Google Scholar
Campello, M. , Graham, J. R. , & Harvey, C. R. (2010). The real effects of financial constraints: Evidence from a financial crisis. Journal of Financial Economics, 97(3), 470–487.10.3386/w15552Suche in Google Scholar
Capuano, S. , & Schmerer, H. J. (2015). Trade and unemployment revisited: Do institutions matter? The World Economy, 38(7), 1037–1063 10.1111/twec.12220Suche in Google Scholar
Cette, G. , Fernald, J. , & Mojon, B. (2016). The pre-Great recession slowdown in productivity. European Economic Review, 88, 3–20.10.1016/j.euroecorev.2016.03.012Suche in Google Scholar
Cornille, D. , Rycx, F. , & Tojerow, I. (2019). Heterogeneous effects of credit constraints on SMEs’ employment: Evidence from the European sovereign debt crisis. Journal of Financial Stability, 41, 1–13.10.1016/j.jfs.2019.02.001Suche in Google Scholar
Crouzet, N. , & Mehrotra, N.R. (2020). Small and large firms over the business cycle. American Economic Review, 110(11), 3549–3601.10.1257/aer.20181499Suche in Google Scholar
De Lucio, J. , Mínguez, R. , Minondo, A. , & Requena, F. (2019). Does a crisis increase the number of regular exporters?. Applied Economics Letters, 26(20), 1700–1704.10.1080/13504851.2019.1591595Suche in Google Scholar
Dias, D. A. , Robalo Marques, C. , & Richmond, C. (2014). Resource allocation, productivity and growth in Portugal. Economic Bulletin and Financial Stability Report Articles, Bank of Portugal.Suche in Google Scholar
Doraszelski, U. , & Jaumandreu, J. (2013). R&D and productivity: Estimating endogenous productivity. Review of Economic Studies, 80(4), 1338–1383.10.1093/restud/rdt011Suche in Google Scholar
Dritsakis, N. , & Stamatiou, P. (2018). Causal nexus between FDI, exports, unemployment and economic growth for the old european union members. evidence from panel data. International Journal of Economic Sciences, VII(2), 35–56.10.20472/ES.2018.7.2.002Suche in Google Scholar
Duygan-Bump, B. , Levkov, A. , & Montoriol-Garriga, J. (2015). Financing constraints and unemployment: Evidence from the Great Recession. Journal of Monetary Economics, 75, 89–105 10.1016/j.jmoneco.2014.12.011Suche in Google Scholar
Eggers, F. (2020). Masters of disasters? Challenges and opportunities for SMEs in times of crisis. Journal of Business Research, 116, 199–208.10.1016/j.jbusres.2020.05.025Suche in Google Scholar
Eppinger, P. S. , Meythaler, N. , Sindlinger, M. M. , & Smolka, M. (2017). The great trade collapse and the spanish export miracle: Firm-level evidence from the crisis. The World Economy, 41(2), 457–493.10.1111/twec.12530Suche in Google Scholar
Feenstra, R. C. , Ma, H. , & Xu, Y. (2019). US exports and employment. Journal of International Economics, 120, 46–58.10.3386/w24056Suche in Google Scholar
Furió, E. , & Alonso, M. (2015). Desempleo y reforma laboral en España durante la Gran Recesión. Cahiers de Civilisation Espagnole Contemporaine, 14(14). 10.4000/ccec.5721.Suche in Google Scholar
Geroski, P. , & Gregg, P. (1997). Coping with recession: UK company performance in adversity. Cambridge: Cambridge University Press.Suche in Google Scholar
Gil-Pareja, S. , Llorca-Vivero, R. , & Paniagua, J. (2013). The effect of the great recession on foreign direct investment: global empirical evidence with a gravity approach. Applied Economics Letters, 20(13), 1244–1248.10.1080/13504851.2013.802082Suche in Google Scholar
Goldstein, J. R. , Kreyenfeld, M. , Jasilioniene, A. , & Örsal, D. K. (2013). Fertility reactions to the ‘Great recession’ in Europe: Recent evidence from order-specific data. Demographic Research, 29, 85–104.10.4054/DemRes.2013.29.4Suche in Google Scholar
Gopinath, G. , Kalemli-Ozcan, S. , Karabarbounis, L. , & Villegas-Sanchez, C. (2017). Capital allocation and productivity in South Europe. The Quarterly Journal of Economics, 132, 1915–1967.10.3386/w21453Suche in Google Scholar
Görg, H. , & Spaliara, M. (2014). Exporters in the financial crisis. National Institute Economic Review, 228, R49–R57.10.1177/002795011422800105Suche in Google Scholar
Heckman, J. J. (1979). Sample selection bias as a specification error. Econometrica, 47(1), 153–161.10.2307/1912352Suche in Google Scholar
Interreg Europe . (2021). SME competitiveness. Retrieved from: https://www.interregeurope.eu/policy-learning-platform-old/sme-competitiveness/.Suche in Google Scholar
Kim, M. (2019). Effects of financial constraints on export performance of firms during the global financial crisis: Microeconomic evidence from Korea. Applied Economics Letters 26(1), 10–15.10.1080/13504851.2018.1430346Suche in Google Scholar
Kiyota, K. (2016). Exports and Employment in China, Indonesia, Japan, and Korea. Asian Economic Papers, 15(1), 57–72.10.1162/ASEP_a_00402Suche in Google Scholar
Lo Turco, A. , & Maggioni, D. (2013). Does trade foster employment growth in emerging markets? Evidence from Turkey. World Development, 52, 1–18.10.1016/j.worlddev.2013.06.003Suche in Google Scholar
López, E. , & Malo, M. Á. (2015). El mercado de trabajo en España: El contexto europeo, los dos viejos desafíos y un nuevo problema. Ekonomiaz, 87, 32–59.Suche in Google Scholar
Máñez-Castillejo, J. A. , Rochina-Barrachina, M. E. , Sanchis-Llopis, J. A. , & Vicente, O. (2014). Financial constraints and R&D and exporting strategies for Spanish manufacturing firms. Industrial and Corporate Change, 23(6), 1563–1594.10.1093/icc/dtu034Suche in Google Scholar
Máñez, J. A. , Rochina Barrachina, M. E. , & Sanchis, J. A. (2020). The effects of export and R&D strategies on firm's markups in downturns: The Spanish case. Journal of Small Business Management. (Forthcoming). 10.1080/00472778.2020.1725847.Suche in Google Scholar
Máñez, J. A. , & Vicente-Chirivella, O. (2021). Exports of Spanish manufacturing firms and financial constraints. BRQ Business Research Quarterly, 24(1), 53–90.10.1177/2340944420916308Suche in Google Scholar
Melitz, M. J. (2003). The impact of trade on intra-industry reallocations and aggregate industry productivity. Econometrica, 71(6), 1695–1725.10.3386/w8881Suche in Google Scholar
Munch, J. , & Schaur, G. (2018). The effect of export promotion on firm-level performance. American Economic Journal: Economic Policy, 10(1), 357–387.10.1257/pol.20150410Suche in Google Scholar
Nair, A. , Rustambekov, E. , McShane, M. , & Fainshmidt, S. (2014). Enterprise Risk Management as a Dynamic Capability: A test of its effectiveness during a crisis. Managerial and Decission Economics, 35(8), 555–566.10.1002/mde.2641Suche in Google Scholar
Osotimehin, S. , & Pappadà, F. (2017). Credit frictions and the cleansing effect of recessions. The Economic Journal, 127(602), 1153–1187.10.1111/ecoj.12319Suche in Google Scholar
Roodman, D. (2011). Estimating fully observed recursive mixed-process models with cmp. Stata Journal, 11(2), 159–206.10.2139/ssrn.1392466Suche in Google Scholar
Royo, S. (2009). After the Fiesta: The Spanish economy meets the global financial crisis. South European Society and Politics, 14(1), 19–34.10.1080/13608740902995828Suche in Google Scholar
Subramaniam, T. (2008). The dynamic interactions among foreign direct investment, unemployment, economic growth and exports: Evidence from Malaysia. Journal of Southeast Asian Studies, 13, 35–48.Suche in Google Scholar
Taylor, J. , Basu, B. , & McLean, S. (2011). Net exports and the avoidance of high unemployment during reconversion, 1945–1947. The Journal of Economic History, 71(2), 444–454.10.1017/S0022050711001598Suche in Google Scholar
Verick, S. (2009). Who is hit hardest during a financial crisis? The vulnerability of young men and women to unemployment in an economic downturn. IZA Discussion Papers, No. 4359.10.2139/ssrn.1455521Suche in Google Scholar
Westergaard-Nielsen, N. , & Neamtu, I. (2012). How are firms affected by the crisis and how do they react. IZA Discussion Paper No. 6671.10.2139/ssrn.2096801Suche in Google Scholar
Zamora-Kapoor, A. , & Coller, X. (2014). The effects of the crisis: Why Southern Europe? American Behavioral Scientist, 58(12), 1511–1516.10.1177/0002764214530649Suche in Google Scholar
© 2021 Daniel Aparicio-Pérez et al., published by De Gruyter
This work is licensed under the Creative Commons Attribution 4.0 International License.
Artikel in diesem Heft
- Editorial
- Editorial
- Regular Articles
- Houses as Collateral and Household Debt Deleveraging in Korea
- Methods Used in Economic Research: An Empirical Study of Trends and Levels
- Money for the Issuer: Liability or Equity?
- Corruption Accusations and Bureaucratic Performance: Evidence from Pakistan
- Subsidising Formal Childcare Versus Grandmothers' Time: Which Policy is More Effective?
- The Impact of Foreign Direct Investments on Poverty Reduction in the Western Balkans
- New Issues in International Economics
- Structural Breaks and Explosive Behavior in the Long-Run: The Case of Australian Real House Prices, 1870–2020
- Measuring the Cost of Covid-19 in Terms of the Rise in the Unemployment Rate: The Case of Spain
- Digital Gender Divide and Convergence in the European Union Countries
- Disentangling Permanent and Transitory Monetary Shocks with a Nonlinear Taylor Rule
- The Export Strategy and SMEs Employment Resilience During Slump Periods
- Corruption and International Trade: A Re-assessment with Intra-National Flows
- Fiscal Rules in Economic Crisis: The Trade-off Between Consolidation and Recovery, from a European Perspective