Subsidising Formal Childcare Versus Grandmothers' Time: Which Policy is More Effective?
-
Victoria Osuna


Abstract
This article quantifies the relative effectiveness of childcare subsidies and subsidies on grandmothers’ time on married mothers’ employment and fertility rates, paying special attention to heterogeneous effects. A heterogeneous agent model, populated by married households who make decisions related to labour supply and fertility, and the Spanish economy are used as a benchmark for calibration. The results indicate that childcare subsidies conditional on employment are more effective than subsidies on grandmothers’ time to foster the participation of married mothers in the labour force. However, they induce women to work fewer hours, unless after-school hours are also subsidised. This overtime subsidy is also necessary for the fertility rate to increase, but it implies a significant adjustment in tax rates to maintain the same fiscal balance. If the aim is simply to raise the employment rate of mothers of children aged 2 years or younger, then subsidising childcare costs only is more effective because the fiscal effort is lower. Regarding the heterogeneous effects, in all the policies studied, the growth in female employment is mainly accounted for by the behaviour of women without tertiary education while that of fertility is accounted for by women with tertiary education. Considerations related to inequality and distributional effects of these policies would also seem to favour childcare subsidies versus subsidies on grandmothers’ time.
1 Introduction
Over the last few decades, the participation of married women in the labour force has increased substantially, while fertility rates have simultaneously dropped. Some countries, such as France and Northern European countries, have succeeded in stabilising fertility rates so they remain close to replacement rates. Other countries, particularly Southern European countries, have not been so successful.[1] Neoclassical models of female labour supply and fertility (Becker, 1965) show that children affect labour market and household production decisions by raising the opportunity cost of working and lowering the effective market wage through the cost of childcare. The theory suggests that measures to help reconcile work and family life will prove beneficial to increase female labour supply and fertility. In the case of a Southern European country like Spain, the evolution of maternal employment and fertility may have to do with the lower public support as well as with the shortage of affordable childcare driven by the long work hours in the Spanish labour market.[2] According to OECD Data, Spanish net costs of childcare are lower than the OECD average; however, a high percentage of households claim that they need more childcare than they can afford (see, for instance, OECD (2019, 2020)). Where childcare is unsuitable or non-affordable, families often turn to grandmothers to pick up the slack. However, the availability of grandmothers might be at risk due to the progressive rise in the retirement age (see Bratti, Frattini, & Scervini, 2018). As Méndez (2015) has pointed out, an increase in the provision of public childcare could partially offset the likely negative effects of the reduced availability of grandmothers’ childcare on female employment and fertility in Southern European countries.[3] This naturally leads us to the following question: how does subsidising formal childcare compare to subsidising grandmothers’ time? In fact, in some countries such as Germany and Great Britain, there have been proposals to subsidise grandmothers’ time to encourage the use of family time in the care of children. This policy, by freeing up the time mothers need to care for their children and by simultaneously reducing childcare costs, could positively affect both married women’s employment and fertility. While the effects of subsidising formal childcare on female employment and fertility have been extensively surveyed (see, e.g., Gauthier, 2007), the so-called “granny leave” policy has received little attention in the literature (see, e.g., Collins & Carlson, 1998).
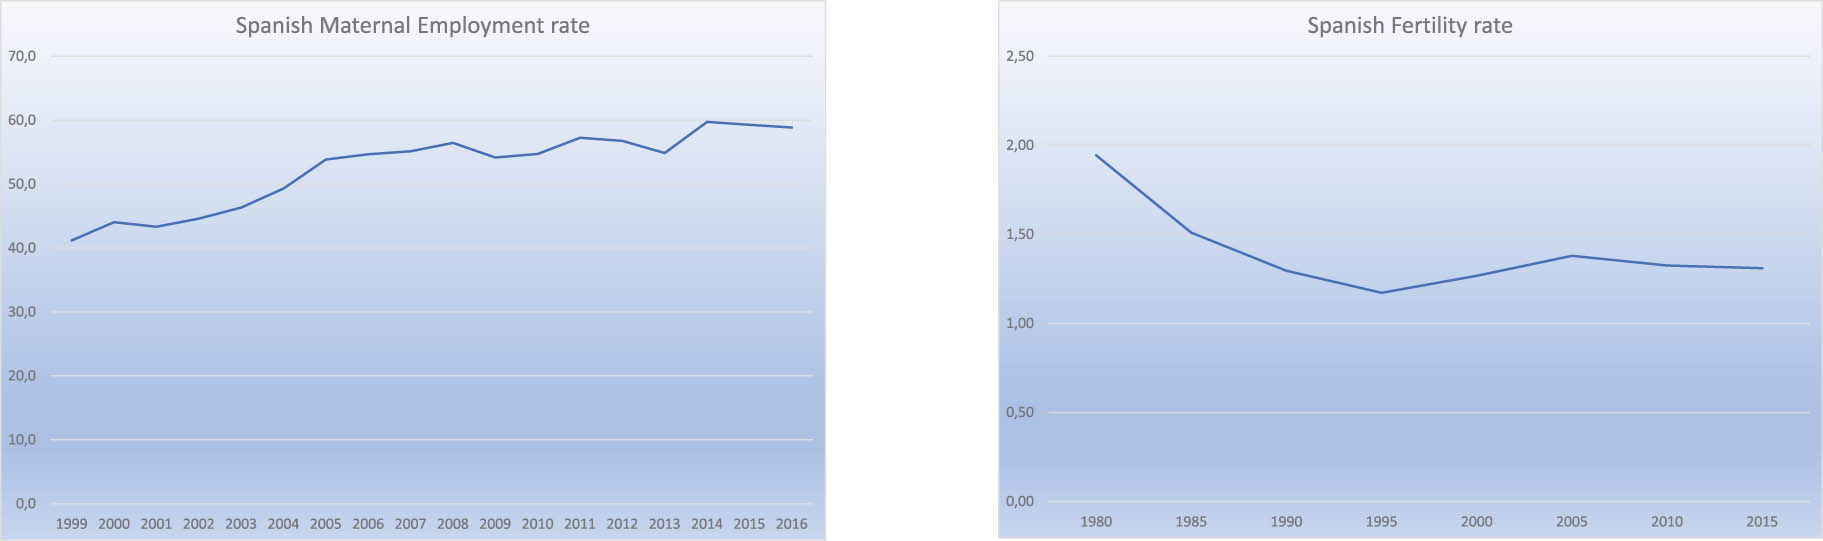
Spanish employment rates of partnered mothers aged 15–64 years with at least one child (left), Spanish total fertility rate (right). Sources: OECD Family Data base and INE Data.
To evaluate the relative effectiveness of subsidising formal childcare versus grandmothers’ time, I use a heterogeneous agent model, populated by married households who take decisions related to labour supply and fertility, and the Spanish economy as a benchmark for calibration. Spain is an interesting country in the context of the present study for the following reasons. First, formal childcare is perceived to be non-affordable or unsuitable for a high percentage of families. According to EU-SILC data, more than
A version of the model described in García-Morán and Kuehn (2017) was used for the computations. In the economic model, married women, who, together with their spouses, have differing educational attainment levels, make decisions related to labour supply and fertility. Mothers of children aged 5 years or younger need childcare in order to work. Childcare arrangements can be either formal or informal (i.e. provided by grandmothers). Child quality is affected by the time mothers spend taking care of them, and by the time children spend in childcare facilities and/or with grandmothers. The decision on how much time to allocate to the labour market will be basically driven by the opportunity costs (in terms of forgone wages), how much weight a mother attributes to the importance of spending time with her child, the availability of grandmothers, and the price and public provision of formal childcare. Government policy may affect those decisions through changes in income taxes, family benefits, childcare subsidies and by subsidizing grandmothers’ time.
The key contribution of this article is to offer a first approximation in terms of fiscal cost/elasticity to quantifying the relative effectiveness of childcare subsidies and subsidies on grandmothers’ time on married mothers’ employment and fertility rates, paying special attention to heterogeneous effects. The present study sheds light on the debate over the type of family policies needed to promote a simultaneous increase in female employment and fertility rates in a context of declining ratios of economically active individuals, very low fertility rates and unsustainable social security systems. The granny leave policy may not be the panacea, given the difficulties in implementing it on a large scale (due to death, illness, geographical distance, other caring duties, etc.), but it is worth exploring it because it may serve as a complementary policy to current subsidies for formal childcare. All the more so since many grandmothers, particularly in Southern European countries, are in fact, devoting their time to care for their grandchildren, while others may be willing to do so if some incentives were provided. As Rupert and Zanella (2018) claimed every employed family member who is a potential source of childcare may benefit from a temporary leave for childcare duties. A second contribution is the capability of computing the necessary adjustments in income taxes so that the policies are neutral in terms of government savings. A third contribution is the integration into the framework developed by García-Morán and Kuehn (2017) of the Spanish institutional details needed to address these issues, such as the progressive tax system, child allowances, cash benefits for working mothers of young children, childcare costs, income-related subsidies for kindergarten expenses, and subsidised public education.
The study led to several interesting findings. Childcare subsidies conditional on employment are more effective than subsidising grandmothers’ time to foster the participation of married mothers in the labour force. However, they induce women to work fewer hours, unless after-school hours are also subsidised. This “double subsidy” is also necessary for the fertility rate to increase, but it implies a significant adjustment in tax rates to maintain the same fiscal balance. If the aim is simply to raise the employment rate of mothers of children aged 2 years or younger, then subsidising childcare costs only is more effective because the fiscal effort is lower. Regarding the heterogeneous effects, in all cases, the rise in female employment is mainly accounted for by the behaviour of women without tertiary education, while that of fertility is accounted for by the behaviour of women with tertiary education. Finally, considerations related to inequality and distributional effects of these policies would also seem to favour childcare subsidies versus subsidies on grandmothers’ time.
Concerning the related literature, there is a substantial body of empirical literature on the effects of formal versus informal childcare arrangements on female employment and fertility. Most studies stress the positive effects of affordable and available formal childcare. For instance, Apps and Rees (2004) and Rindfuss, Guilkey, Morgan, and Kravdal (2010) attribute a weaker negative relationship between rising female labour supply and decreasing fertility to the availability of cheap and good quality care possibilities outside the home. Del Boca, Pasqua, and Pronzato (2009) stated that the provision of childcare is highly influential, especially for the employment rate of less educated women and the fertility rate of college women. Haan and Wrohlich (2011) showed that increasing childcare subsidies conditional on employment significantly increases female participation rates but, on average, does not affect fertility. On the other hand, Aassve, Meroni, and Pronzato (2012), Aparicio-Fenoll and Vidal-Fernández (2015) as well as Zamarro (2011) have emphasised the positive aspects of grandmother-provided childcare on female employment and fertility. Aassve et al. (2012) showed that the availability of grandmother has a notable effect on individual decisions on whether to have children, especially in Southern Europe where public childcare is limited. Zamarro (2011) also found that in countries where childcare is more costly, grandmothers are more likely to provide care. Aparicio-Fenoll and Vidal-Fernández (2015) showed that daughters are more likely to have children but less likely to work when grandmothers participate in the labour market, thus providing less childcare.
Regarding the theoretical literature, there is a recent article by Guner, Remzi, and Ventura (2020) very closely related to this study. Using a heterogeneous agent model the authors study the macroeconomic effects of child-related transfers on female labour supply and welfare. They also find that childcare subsidies conditional on employment have large effects for married mothers labour supply, especially for low educated women, but they do not study the effects on fertility. Concerning the two types of childcare studied in the present study, only a few papers have incorporated them into a single framework to study both female labour force participation and fertility. For instance, Cardia and Ng (2003), using a general equilibrium model, found that subsidising grandparents’ time is more effective than providing childcare subsidies. Bick (2016), using a life cycle model, where individuals take decisions concerning formal and informal childcare, concluded that subsidies have a very low impact on female labour force participation and no effect on fertility. García-Morán and Kuehn (2017), based on a model of residence choice, fertility decisions, and female labour market participation, studied the effects of grandparent-provided childcare on female labour market outcomes and geographical mobility. None of these works propose to examine the quantitative implications of childcare subsidies and subsidies on grandmothers’ time for female employment and fertility based on a model with a rich institutional structure regarding family policies, including the necessary fiscal adjustments and paying special attention to heterogeneous effects. The present study attempts to fill this gap.
The rest of this article is structured as follows: the model is presented in Section 2; the calibration of the baseline model economy is explained in Section 3; in Section 4, the results of the policy experiments are described; Section 5 is devoted to perform some robustness exercises. Finally, conclusions are presented in Section 6.
2 The Model
Let us consider an economy populated by a continuum of married households of mass one.[6] We assume that people live for two 3 year periods, corresponding to the first 6 years of a child’s life. This time-span was selected as it corresponds to that of a mother’s most relevant childcare decisions. In fact, most differences in mothers’ decisions concerning labour force participation and childcare arrangements during early childhood take place around the age of 3. Each member of the household is characterised by a given productivity (education) type. These productivity types determine wage rates in the labour market. At the beginning of the first period a woman of type
In the first period, women take a fertility decision: whether to have a child
In order to provide labour, working mothers need to make childcare arrangements, since the time the mother is at work is assumed to be equal to the time spent on childcare
Childcare costs depend on the age of the child. Attending a childcare centre for a child aged 2 years or younger is optional. If the child attends a childcare centre, the household may be entitled to a subsidy,
Regarding informal childcare, mothers are here assumed to have access to free childcare by grandmothers with probability
The utility function of a woman, who values consumption,
where
As far as government policy is concerned, the government needs to raise revenue through income taxes,
2.1 Value Functions
The model is solved backwards. Therefore, I first present the value functions for women in the second period.
2.1.1 Value Function in the Second Period for Childless Women
Utility for childless women in the second period is given by the following expression:
subject to the budget constraint
2.1.2 Value Functions in the Second Period for Mothers
A mother in period 2 without access to grandmother-provided childcare needs to purchase formal childcare at price
subject to the budget constraint
The value function for a mother in period 2 with access to grandmother-provided childcare is given by
subject to the budget constraint
2.1.3 Value Functions in the First Period for Mothers
In the first period, women need to decide whether to have a child or not and how much time to work. With probability
The value function of women with access to free childcare is given by
subject to the budget constraint
The value function of women without access to free childcare is given by
subject to the budget constraint
Finally, the government budget constraint is given by the following expression:
where
where
3 Calibration
3.1 Data
To calibrate the main parameters of the model, data from the European Union Statistics on Income and Living Conditions (EU-SILC) were used. Year 2016 was chosen because, in that particular year, a special module on “Access to Services” with information about childcare costs was made available. The EU-SILC is an annual household survey that provides information on individual and household characteristics, such as employment, education and family status, income, and childcare use (formal and informal).
The analysis is confined to a sample of married individuals because the main focus is the labour supply of married females. In order to analyse individuals who are potentially in the labour force and need childcare, I restricted the sample to women between ages 25 and 45. Women working less than 20 h a month were not considered as employed, given that they need little childcare. Self-employed women were also excluded because of the specificities of their work schedules. To compute the statistics related to childcare arrangements, a smaller sample of mothers with children aged 5 years or younger was considered.
The population was divided into three educational groups: people who have less than a high school degree (
Couple distribution and female employment
| Educational distribution | Employment rate | ||||||
|---|---|---|---|---|---|---|---|
| Male | Male | ||||||
| Female |
|
|
|
Female |
|
|
|
|
|
13.0 | 4.9 | 4.1 |
|
42.7 | 46.3 | 48.5 |
|
|
8.0 | 8.2 | 6.3 |
|
63.4 | 55.5 | 59.4 |
| col | 8.2 | 12.3 | 35.1 |
|
79.6 | 75.4 | 77.6 |
Table 2 shows that mothers who are helped by grandmothers tend to be less educated. This may be related to their earnings and, consequently, to the affordability of formal childcare. In fact, hourly wages are higher for mothers of young children not helped by grandmothers: 13.2 versus 12.8. Concerning employment, an opposite pattern emerges: the employment rate of mothers of young children who are helped by grandmothers is higher than the employment rate of those who are not helped by them. This is true at all educational levels, but specially for the less educated. The latter may reflect difficulties in finding affordable childcare when grandparents are not available.
Mothers of children aged 5 or less, helped or not by grannies
| Mother’s educational distribution | Mothers employment rate | |||
|---|---|---|---|---|
| Female | Not helped by grannies | Helped by grannies | Not helped | Helped by grannies |
|
|
11.0 | 16.4 | 42.0 | 66.7 |
|
|
17.5 | 16.4 | 45.9 | 58.3 |
| col | 71.5 | 67.2 | 71.7 | 84.6 |
In order to further explore this hypothesis I make use of the information included in the EU-SILC special module on “Access to Services” concerning affordability of childcare, unmet needs, and payments. For the sub-sample of mothers with children aged 5 or younger,
Affordability of child care
| Answer | Percentage |
|---|---|
| With great difficulty | 6 |
| With difficulty | 11 |
| With some difficulty | 25 |
| Fairly easily | 32 |
| Easily | 21 |
| Very easily | 4 |
Whether formal childcare is affordable or not, what is true is that most children attend some kind of preschool:
Childcare arrangements and average hours
| Age of children | Cared for by grannies (%) | Informal hours | At preschool facility (%) | Formal hours |
|---|---|---|---|---|
| 0–5 | 13.7 | 19.4 | 80.9 | 30.3 |
| 0–2 | 14.7 | 25.4 | 53.7 | 29.5 |
| 3–5 | 12.9 | 13.4 | 99.1 | 30.7 |
3.2 Calibrated Parameters
In this section, I explain how values were assigned to the model’s parameters. The policy parameters and the parameters related to childcare costs were taken directly from Spanish data. The value of the discount factor,
Baseline calibration
| Parameters | Description | Value |
|---|---|---|
|
|
Discount factor | 0.89 |
|
|
Utility curvature of consumption | 0.85 |
|
|
Utility curvature of child quality | 0.82 |
|
|
Weight of child quality in utility | 1.76 |
|
|
Fixed utility cost of children | 0.49 |
|
|
Weight of mother’s time for child quality | 0.84 |
|
|
Probability of free care in period 1 | 0.09 |
|
|
Conditional probability of free care in period 2 | 0.95 |
|
|
Mean of the distribution of wage offers | 1.00 |
|
|
Standard deviation of the distribution of wage offers | 0.01 |
The employment rate of mothers with children aged 3–5 years was used to match the curvature of consumption in the utility function,
3.2.1 Wages
In the model, women’s and men’s average hourly wages were assigned according to education levels (Table 6). The underlying distribution of wage changes was assumed to be the same for men and women, and was broken down into a grid of five different wage changes: each of the nine couples previously defined received 25 different offers. The mean distribution,
Hourly wages
| Education | Women | Spouses |
|---|---|---|
|
|
9.10 | 9.39 |
|
|
10.22 | 12.5 |
|
|
14.18 | 16.5 |
3.2.2 Childcare Cost Parameters
Information on the prices of attending a childcare facility (regular hours, extended hours, and canteen service) was used to set the values of the price parameters,
Childcare cost parameters
| Parameters | Description | Value |
|---|---|---|
|
|
Cost of childcare for regular hours in period 1 | 1.74 |
|
|
Cost of childcare for extended hours in period 1 | 0.35 |
|
|
Cost of childcare paid by the government in period 1 | 0.46 |
|
|
Cost of childcare for regular hours in period 2 | 0.13 |
|
|
Cost of childcare for extended hours in period 2 | 0.84 |
|
|
Cost of childcare paid by the government in period 2 | 2.19 |
|
|
Regular hours at a childcare facility in period 1 | 0.42 |
|
|
Regular hours at a nursery school in period 2 | 0.42 |
3.2.3 Policy Parameters
In this section, I describe the parameters related to government policy. As previously stated, the income tax system is progressive. Tax rates,
Mothers with a child aged 2 years or younger attending a childcare facility may be entitled to a subsidy,
Finally, working women with a child aged 2 years or younger are entitled to a monthly cash benefit of 100 euros. This non-refundable tax credit,
3.3 Calibration Results
Parameter values were chosen so that the model is consistent with 2016 Spanish data related to the labour market, fertility, and childcare statistics. Table 8 shows that the baseline model is a suitable starting point for carrying out policy experiments because it matches real data relatively well. In addition, it is necessary to assess the model’s performance in matching moments that have not been used for calibration. Table 9 shows that the model accounts reasonably well for most of them. The model captures the fact that working mothers earn a higher wage than the female average. The average hourly wage of childless women is 11.2 euros, while that of mothers is 12.9 euros. Mothers of younger children earn on average higher hourly wages (13.2 euros), probably as a result of selection. Generally, the number of hours of childcare generated by the model is relatively close to the number of hours in the data. Table 3 shows that working mothers of younger children tend to use more hours of grandmother-provided childcare than mothers of older children. The model generates this pattern but underestimates the number of hours that children aged 3–5 years spend with grandmothers and overestimates the number of childcare hours of children aged 2 years or younger. The model also accounts for the fact that children aged 2 years or younger spend more time in childcare facilities (roughly 3 more hours) than with grandmothers. This is probably explained by the fact that women with tertiary education work more hours than women without tertiary education and also make less use of grandmothers’ help (Table 2).[23]
Data and model moments: targeted
| Statistics | Data | Baseline |
|---|---|---|
| Mean hourly wage rate of women | 12.5 | 12.7 |
| Percentage of women being mothers | 45.1 | 44.6 |
| Employment rate of mothers, children aged 0–2 | 53.0 | 51.2 |
| Employment rate of mothers, children aged 3–5 | 65.1 | 65.8 |
| Employment rate of mothers, children aged 0–5 | 59.1 | 58.5 |
| % of work-mothers using free care, children aged 0–2 | 15.7 | 15.7 |
| % of work-mothers using free care, children aged 3–5 | 11.7 | 11.6 |
| Child care costs as a % of average household income | 12.0 | 12.1 |
| Child care costs as a % of mother’s non-college wage | 23.3 | 21.0 |
Data and model moments: non-targeted
| Statistics | Data | Baseline |
|---|---|---|
| Ratio of mother’s working wage to women’s working wage | 1.06 | 1.18 |
| Number of hours of grandparenting, children aged 0–2 | 25.4 | 30.5 |
| Number of hours of grandparenting, children aged 3–5 | 13.4 | 7.10 |
| Number of hours in childcare facilities, children aged 0–2 | 29.5 | 34.2 |
| Number of hours in childcare facilities, children aged 3–5 | 30.7 | 29.8 |
| Proportion of college working mothers/college working women | 46.5 | 40.6 |
| Proportion of college working mothers/college mothers | 77.8 | 80.6 |
| Distributions | Data | Baseline |
| Mother’s distribution by education | ||
|
|
20.3 | 19.7 |
|
|
20.9 | 21.6 |
|
|
58.8 | 58.7 |
| Working mother’s distribution by education | ||
|
|
13.8 | 7.0 |
|
|
16.5 | 12.2 |
|
|
69.7 | 80.8 |
| Working women’s distribution by education | ||
|
|
14.7 | 18.3 |
|
|
18.4 | 18.0 |
|
|
67.0 | 63.7 |
Concerning distributions, the model is able to capture the qualitative patterns and, to some extent, quantitative numbers. The model replicates mother’s and working women’s distributions relatively accurately. However, it fails to quantitatively account for working mother’s distribution by education: the model overestimates the percentage of working mothers with the highest level of education, and largely underestimates the percentage of working mothers in the lowest category of education.[24] The model reproduces the behaviour of women with tertiary education particularly well. Both the proportion of college working mothers over college working women and the proportion of college working mothers over college mothers are very close to those observed in the data.
4 Policy Experiments
In this section, I quantify the effects of subsidies for formal childcare and subsidies on grandmothers’ time, on mothers’ labour force participation, fertility, and the extent of use of formal versus informal childcare. Before proceeding to the experiments it is worth exploring in more detail the main mechanisms underlying the baseline model that affect the choice of hours worked by women helped and not helped by grandmothers (see, e.g., Tables A1 and A2 in the Appendix).
First, I compare women’s decisions to become a mother and mothers’ employment rates. Those who are helped by grandmothers exhibit a larger fertility rate:
Second, female employment rates and hours worked were observed according to the wages of men and women. Generally, the higher the husband’s wage the lower the employment rate and hours worked of a mother due to an income effect. However, given the husband’s wage, the higher the woman’s wage, the lower the fertility rate and the more a woman work because of the higher opportunity cost of not working. This behaviour is also to a certain extent corroborated by the data (see Table 1 in Section 3.1).
Third, heterogeneous effects were examined. There are some differences in terms of fertility and employment across different educational categories. Low-education women married to high school or college men exhibit a larger fertility rate (and work less) than low-education women married to low-education men. This is in part due to a low opportunity cost of not working and to an income effect, which induces low-education women to stay at home and devote more time to care for their children as the husband’s wage increases. Most low-education women either have children and work zero hours or do the opposite. Only a few, especially those with the highest wages try to reconcile work and family. As can be seen by comparing Tables A1 and A2, this is more prevalent when grandmothers are available.
If we compare high school women married to high school men with those married to college men, the same pattern applies: as the husband’s wage increases, they tend to have more children and leave the labour market, again due to an income effect. On the other hand, most high school women married to low type men have children and work part of their disposable time, particularly if they are helped by their grandmothers. Finally, college women have less children if they are not helped by grandmothers, especially those married to low-education men, because of the high opportunity cost for this type of woman, i.e. staying at home and caring for their children is too costly in terms of forgone wages.
4.1 Childcare Subsidies for Children Aged 2 Years or Younger
In this section, I show the effects of increasing means-tested subsidies for formal childcare for working mothers with children aged 2 years or younger. This experiment was implemented as described next. I set a particular value for the employment rate of mothers of children aged 2 years or younger as a target and computed the change in the value of the childcare subsidy in period 1,
Table 10 shows that the employment rate of mothers with children aged 2 years or younger grows by 6% points, which implies a value of 0.15 for the elasticity with respect to childcare costs. This result is consistent with the values that have been estimated in previous literature, which for Europe range from 0.14 for UK, to 0.46 for Romania.[26] However, mothers work on average fewer hours. This does not happen just because the mothers who enter the labour market will supply very few hours (composition effects), but rather due to income effects and to the tax adjustment, which make the working activity less rewarding.[27] This reduction in average hours worked generates a
Experiments
| Subsidising childcare costs in pdo 1 (
|
Baseline |
|
% var |
|
|---|---|---|---|---|
| Percentage of women being mothers | 44.6 | 44.4 | −0.48 | −0.19 |
| Employment rate of mothers, children aged 0–5 | 58.5 | 61.4 | 4.78 | 1.91 |
| Employment rate of mothers, children aged 0–2 | 51.2 | 57.1 | 10.9 | 4.36 |
| Employment rate of mothers, children aged 3–5 | 65.8 | 65.7 | −0.25 | −0.10 |
| % of work-mothers using free care, children 0–2 | 15.7 | 13.8 | −12.8 | −5.10 |
| % of work-mothers using free care, children 3–5 | 11.6 | 11.8 | 1.07 | 0.43 |
| Ratio of mother’s wage to women’s wage | 1.18 | 1.15 | −2.87 | −1.15 |
| Hours in childcare facilities, children aged 0–2 | 34.2 | 32.2 | −6.02 | −2.41 |
| Hours in childcare facilities, children aged 3–5 | 29.8 | 29.8 | −0.14 | −0.06 |
| Subsidising after school hours in pdo 2 (
|
Baseline | (
|
% var |
|
|---|---|---|---|---|
| Percentage of women being mothers | 44.6 | 52.2 | 15.8 | 2.25 |
| Employment rate of mothers, children aged 0–5 | 58.5 | 64.3 | 9.5 | 1.35 |
| Employment rate of mothers, children aged 0–2 | 51.2 | 57.8 | 12.1 | 1.73 |
| Employment rate of mothers, children aged 3–5 | 65.8 | 70.8 | 7.3 | 1.04 |
| % of work-mothers using free care, children 0–2 | 15.7 | 11.6 | −30.1 | −4.30 |
| % of work-mothers using free care, children 3–5 | 11.6 | 9.3 | −22.8 | −3.26 |
| Ratio of mother’s wage to women’s wage | 1.18 | 1.15 | −2.50 | −0.36 |
| Hours in childcare facilities, children aged 0–2 | 34.2 | 32.1 | −6.26 | −0.89 |
| Hours in childcare facilities, children aged 3–5 | 29.8 | 30.5 | 2.21 | 0.32 |
| Subsidising grandmothers’ time (
|
Baseline |
|
% var |
|
|---|---|---|---|---|
| Percentage of women being mothers | 44.6 | 48.6 | 8.68 | 0.96 |
| Employment rate of mothers, children aged 0–5 | 58.5 | 63.4 | 8.08 | 0.90 |
| Employment rate of mothers, children aged 0–2 | 51.2 | 58.2 | 12.8 | 1.42 |
| Employment rate of mothers, children aged 3–5 | 65.8 | 68.7 | 4.23 | 0.47 |
| % of work-mothers using free care, children 0–2 | 15.7 | 49.5 | 103 | 11.5 |
| % of work-mothers using free care, children 3–5 | 11.6 | 41.3 | 112 | 12.4 |
| Ratio of mother’s wage to women’s wage | 1.18 | 1.19 | 0.69 | 0.08 |
| Hours in childcare facilities, children aged 0–2 | 34.2 | 34.2 | −0.02 | 0.00 |
| Hours in childcare facilities, children aged 3–5 | 29.8 | 29.7 | −0.5 | −0.06 |
I now look at disaggregated results according to the educational types of women to observe the model’s predictions along these lines. Table 11 shows that all types of mothers participate more in the labour market. The growth in the proportion of working mothers over mothers is particularly significant for women with low and medium educational levels: 13 and 11%, respectively. This explains the drop in the ratio of mother’s wage to women’s wage, which decreases by close to 3% (see Table 10). This outcome agrees with the results in the related literature. For instance, Del Boca et al. (2009) found that less educated women are more sensitive to changes in the price of formal childcare, and Guner et al. (2020) showed that the change in labour supply is particularly strong for women at the bottom of the skill distribution when child-related transfers are expanded.
Distributions by education under alternative scenarios
| Statistics | Baseline | 3
|
(3
|
4
|
|---|---|---|---|---|
| Mother’s distribution by education | ||||
|
|
19.7 | 20.5 | 19.4 | 19.5 |
|
|
21.6 | 22.0 | 20.5 | 20.9 |
|
|
58.7 | 57.5 | 60.2 | 59.6 |
| Working mother’s distribution by education | ||||
|
|
6.97 | 7.88 | 9.45 | 7.5 |
|
|
12.2 | 13.2 | 13.5 | 12.3 |
|
|
80.8 | 78.9 | 77.0 | 80.1 |
| Proportion of mothers/women | ||||
|
|
40.2 | 41.5 | 46.2 | 43.3 |
|
|
45.6 | 46.2 | 50.7 | 48.2 |
|
|
45.9 | 44.8 | 55.1 | 50.9 |
| Proportion of working mothers/mothers | ||||
|
|
20.7 | 23.6 | 31.4 | 24.6 |
|
|
33.1 | 37.0 | 42.5 | 37.5 |
|
|
80.6 | 84.1 | 82.4 | 85.3 |
It comes as a surprise that for women with tertiary education fertility is not positively affected. According to Del Boca et al. (2009) this type of family policies may positively affect the fertility rate of highly educated women because they reduce the opportunity cost of child-bearing. In fact, this occurs for some college women married to non-college men, but this effect is compensated by the decrease in fertility of some college women married to college men, who do not qualify for the subsidy, but are particularly affected by the tax increase. This is consistent with the results of Haan and Wrohlich (2011), mentioned earlier in the related literature, who concluded that childcare subsidies do not affect fertility on average, though with heterogeneous effects.
4.2 Childcare Subsidies in Periods 1 and 2: the “Double-subsidy”
The childcare subsidy studied in Section 4.1 did not affect the employment rates of mothers of children aged 3–5 years because the target was childcare in period 1. Given the shortage of affordable childcare driven by long work schedules mentioned earlier in the Introduction, an “overtime” subsidy (
The effects of this “double-subsidy” are displayed in Table 10. The percentage of women being mothers increases substantially, from 44.6 to 52.2%, especially for women not helped by grandmothers, which grows by 17.5%. As expected, the additional subsidy induces more women to have children, especially women with tertiary education: the proportion of mothers over women rises by
Regarding employment effects, the reduction in the cost of after school hours increases the employment rate of mothers of children aged 3–5 years by
Concerning childcare use, cheaper access to formal childcare reduces the percentage of working mothers using free care by 30 and 23% in periods 1 and 2, respectively. As in the previous scenario, the number of hours spent in childcare facilities by children aged 2 years or younger decreases by
4.3 Subsidising Grandmothers’ Time
In the following paragraphs, I explain how subsidies on grandmothers’ time are introduced in the model, and how to compute the fiscal cost associated with this policy. To keep the analysis tractable, I abstain from modelling the endogenous decision of whether to provide childcare or not from the point of view of the grandmother.[29] The idea is that a certain fraction of grandmothers in the economy receive a subsidy to care for their grandchildren. The amount of the subsidy is computed as the product of the daughters’ hourly wages and the daughters’ working hours (for which they need childcare).[30] The value of the grandmother’s availability parameter is set exogenously, together with the value of the subsidy, to meet the employment targets such that this experiment is comparable to the previous ones. The exercise is done in such a way that taxes adjust to finance the granny subsidy so that the fiscal balance stays the same. Grandmother availability turns out to be four times larger than that in the baseline economy (4
The bottom panel of Table 10 shows the effects of the rise in the probability of grandmother-provided childcare for mothers of children aged 2 years or younger, from
Having greater access to grandmother provided childcare, not only positively affects the female employment rate, but also the fertility rate: the percentage of mothers increases by almost
Conversely, the positive effects on employment are concentrated among women with non-tertiary education, in line with the positive association between making use of grandparents and labour force participation for low-education women shown in Table 2 in Section 3.1. The proportion of working mothers over mothers increases by 17 and 12% for women with low and medium educational levels, respectively. Concerning women with tertiary education, the rise in the proportion of working mothers over mothers is more modest for two reasons. First, as in the “double-subsidy” scenario, the rise in the fertility rate compensates to some extent the growth in labour involvement. And second, more than 80% of women with tertiary education were already working in the baseline. For highly educated women the availability of grandmothers is not as essential as for low-education women because they earn higher wages and, consequently, can afford paying for formal childcare. In addition, they face higher opportunity costs of not working.
4.4 Comparing Subsidising Formal Childcare and Grandmothers’ Time
If we compare the results of subsidising formal childcare and grandmothers’ time, the combination of the two types of subsidies for formal childcare, i.e. a “double-subsidy,” turns out to be more effective than the granny subsidy in terms of mothers’ employment and fertility.[31] For each additional point increase in taxes, the aggregate employment and fertility rates in the double-subsidy scenario increase by 1.35 and 2.25% against 0.9 and 0.96% in the granny subsidy experiment (see these elasticities in the last column in Table 10). However, both experiments require a substantial tax adjustment, 7 and
Regarding the heterogeneous effects, the subsidy experiments seem to favour the employment rate of women without tertiary education or women married to non-tertiary educated men the most. The reason is quite simple. Subsidies to cover childcare expenses in the first period are means-tested; therefore, high-income families do not qualify for them. By contrast, the greater availability of grandparents does not depend on income. These institutional differences generate variations in the distribution of working mothers by the level of education. In particular, women with tertiary education lose less weight in the distribution of working mothers in the granny subsidy scenario. For instance, the growth in the proportion of college working mothers to college mothers in the granny subsidy experiment is
The results obtained in this analysis contrast to what other authors have suggested. For instance, Cardia and Ng (2003) claimed that subsidising grandparents’ time is the most effective childcare policy. When they compare the effects of time transfers to that of money transfers, they arrive at the conclusion that money transfers may decrease female labour supply because the income effect can compensate the substitution effect. This result stems from the fact that money transfers are not made contingent on female employment. This is not the case in the present study. It is true that average working hours decrease, but the fact that more mothers participate more than compensates.[32] Furthermore, Cardia and Ng (2003) do not compute the fiscal cost of the policy, which, here, is found to be quite significant. Rupert and Zanella (2018) also held the opinion that childcare subsidies may not be very successful due to the substitution between informal and formal childcare. This does not occur here. The drop in the percentage of mothers using free care is basically driven by the fact that more women decide to work.
All in all, according to the model, subsidies on grandmothers’ time do not seem to deliver better results than childcare subsidies because they are less effective/more costly. In addition, implementing a granny leave policy in the real world may be very difficult because the reasons why grandmothers do not help with their grandchildren may not be all due to the lack of monetary incentives. Rather, other caring duties (to other children, to their partners or to their own elderly relatives), their physical ability to care for a child (due to the prevalence of chronic illness or other health problems) may also play a role. Another factor that may undermine the importance of monetary incentives is social norms. Southern European grandmothers were likely helped by their own grandmothers and may tend to feel like their duty to help with their care. Last, the satisfaction a grandmother gets from being a “helper” to her family may also be relevant. How much do these factors matter versus opportunity costs is uncertain, and out of the scope of this article, but on the future agenda. Finally, considerations related to inequality and distributional effects of these policies would also seem to favour childcare subsidies versus granny leaves because childcare subsidies improve more the labour market opportunities of women at the bottom of the skill distribution.
5 Robustness Exercises
In this section, I perform some robustness concerning the childcare policies available in the baseline model. I quantify to what extent childcare subsidies account for married mothers’ employment and fertility by removing them completely. I also explore the quantitative importance of the tax credit introduced in 2003 by doing a similar exercise.
5.1 No Subsidy for Working Mothers of Children Aged 2 Years or Younger
Some authors, Bick (2016) among others, claim that the rise in maternal employment is too small to conclude that the lack of subsidised childcare accounts for the low labour force participation of mothers with children aged 2 years or younger in Germany. In this section, the childcare subsidy for working mothers of children aged 2 years or younger is removed to test this hypothesis for the case of Spain.
The upper panel in Table 12 shows that the effects are non-negligible. The employment rate of mothers of children aged 2 years or younger drops by 27%, while that of mothers of children 3–5 years is also significantly reduced (by close to
Robustness
| No childcare subsidy in period 1 | Baseline |
|
% var |
|---|---|---|---|
| Employment rate of mothers, children aged 0–2 | 51.2 | 39.9 | −27.1 |
| Employment rate of mothers, children aged 3–5 | 65.8 | 57.4 | −13.7 |
| Ratio of mother’s wage to women’s wage | 1.18 | 1.22 | 3.43 |
| % of work-mothers using free care, children 0–2 | 15.7 | 25.8 | 48.3 |
| % of work-mothers using free care, children 3–5 | 11.6 | 16.7 | 35.7 |
| Hours in childcare facilities, children aged 0–2 | 34.2 | 36.7 | 7.06 |
| Hours with grandmothers, children aged 0–2 | 30.5 | 30.5 | 0.0 |
| Percentage of women being mothers | 44.6 | 35.8 | −22.0 |
| % of women being mothers, helped by grannies | 57.5 | 57.5 | 0.0 |
| % of women being mothers, not helped by grannies | 43.4 | 33.8 | −25.0 |
| No tax credit in period 1 | Baseline |
|
% var |
|---|---|---|---|
| Employment rate of mothers, children aged 0–2 | 51.2 | 42.5 | −18.6 |
| Employment rate of mothers, children aged 3–5 | 65.8 | 59.8 | −9.58 |
| Ratio of mother’s wage to women’s wage | 1.18 | 1.17 | −1.09 |
| % of work-mothers using free care, children 0–2 | 15.7 | 21.2 | 29.6 |
| % of work-mothers using free care, children 3–5 | 11.6 | 14.4 | 20.8 |
| Hours in childcare facilities, children aged 0–2 | 34.2 | 36.7 | 6.87 |
| Hours with grandmothers, children aged 0–2 | 30.5 | 32.3 | 5.80 |
| Percentage of women being mothers | 44.6 | 37.9 | −16.2 |
| % of women being mothers, helped by grannies | 57.5 | 55.4 | −3.70 |
| % of women being mothers, not helped by grannies | 43.4 | 36.3 | −17.8 |
With regard to average hours worked, they raise considerably. This is not driven by the fact that women – not helped by grandmothers and on the verge of participation – stop working when the subsidy is removed. It is mainly driven by women – not helped by grandmothers and married to non-college men – who decide not to have a child and therefore work fulltime; and by mothers (also not helped by grandmothers) who work more hours in the first period as a result of the income effect generated by the elimination of the subsidy (compare Tables A2 and A12 in the Appendix). This last behaviour explains the substantial rise in the number of hours that children aged 2 years or younger spend in childcare facilities, around
These changes in employment and fertility rates are different in magnitude depending on the educational category. The most responsive groups are women married to men without tertiary education and women with tertiary education. For women married to men without tertiary education, childcare subsidies are needed to finance childcare costs and to reconcile work and family. For college women, opportunity costs play a significant role. Table 13 shows that mothers without tertiary education are the main losers in terms of employment because they are more sensitive to the price: the proportion of working mothers over mothers falls by 100 and
Distributions by education under alternative scenarios
| Statistics | Baseline |
|
|
|---|---|---|---|
| Mother’s distribution by education | |||
|
|
19.7 | 21.0 | 21.3 |
|
|
21.6 | 21.1 | 23.0 |
|
|
58.7 | 57.9 | 55.7 |
| Working mother’s distribution by education | |||
|
|
6.97 | 2.94 | 5.67 |
|
|
12.2 | 6.45 | 11.7 |
|
|
80.8 | 90.6 | 86.6 |
| Prop. mothers/women | |||
|
|
40.2 | 34.2 | 36.9 |
|
|
45.6 | 35.8 | 41.3 |
|
|
45.9 | 36.4 | 37.1 |
| Prop. work-mothers/mothers | |||
|
|
20.7 | 6.77 | 13.6 |
|
|
33.1 | 14.7 | 26.1 |
|
|
80.6 | 75.4 | 75.8 |
5.2 No Tax Credit for Working Mothers of Children Aged 2 Years or Younger
A monthly cash benefit of 100 euros for working mothers of children aged up to three was introduced in 2003 (Ley 46/2002 de 18 de Diciembre 2002). Some authors, Azmat and González (2010) and Sánchez-Mangas and Sánchez-Marcos (2008), have found evidence of positive effects of this policy on fertility and on the employment rate of mothers with small children. Table 12 shows to what extent tax credits for working women with children aged 2 years of younger matter for female employment and fertility by removing them. The aggregate effects on employment and fertility are similar to the ones in the previous scenario, but lower in magnitude. The elimination of this transfer not only affects women not helped by grandmothers, as in the previous scenario, but also those helped by grandmothers because this cash benefit is linked to employment, not to childcare expenses. The only requirement for mothers of children aged 2 years or younger is to be employed. This cash transfer is not means-tested (Table A13).
The middle panel in Table 12 shows that the employment rates of mothers in the first and second period fall significantly, 19 and
6 Conclusion
The question of the most effective policies allowing parents to reconcile work and family is currently at the centre of policy debates. This question takes on far greater significance in Southern European countries given the low fertility and mothers’ participation rates and the prevalence of grandmothers’ childcare. The framework developed in this article has allowed us to compare the effects of two such policies, subsidising formal childcare versus subsidising grandmothers’ time. A model economy populated by married households that make employment and fertility decisions has been used to address this question. The model was calibrated to match certain statistics related to female labour force participation of mothers with young children, fertility, the composition of formal versus informal child care, and childcare costs for the Spanish economy. The study, through a series of experiments, quantified the relative effectiveness of changes in grandmothers’ availability (by means of granny subsidies) and subsidies for formal childcare for young mothers’ rates regarding labour force participation and fertility, paying special attention to heterogeneous effects.
The work produced some interesting findings. From a policy perspective, if the objective is simply to rise the labour force participation rate of mothers of children aged 2 years or younger, emulating the Swedish model, that is, devoting more resources to subsidising formal childcare for working mothers of children aged 2 years or younger seems the best option, despite the average decrease in hours worked.[33] Subsidising grandmothers’ time is more expensive in terms of the fiscal adjustment and also more difficult to implement. But if the aim is also to reverse the decline in fertility rates, the “double-subsidy” may be worth taking into account, despite being more expensive.
Concerning heterogeneous effects, in all the experiments, the increase in labour force participation was mainly accounted for by the behaviour of women without tertiary education, while that of fertility was accounted for by the behaviour of women with tertiary education. In fact, childcare policies are not neutral from a distributional point of view. Less educated women are more sensitive to changes in prices than women with more education and better labour market opportunities, a finding that is consistent with economic theory and with previous empirical analysis. Therefore, considerations related to inequality and distributional effects of these policies would also seem to favour childcare subsidies versus granny leaves.
One should naturally be cautious about pushing these conclusions too far. To properly evaluate the benefits and costs of subsidising grandmothers’ time and childcare subsidies, apart from performing a proper welfare analysis, additional aspects should be modelled. The most obvious is grandmothers’ labour supply decisions to capture the trade-offs faced by them. However, making the labour supply decision of grandmothers endogenous will be no panacea. As stated previously, the reasons why grandmothers may decide not to care for their grandchildren may not all be related to monetary incentives. Rather, other caring duties, their physical ability to care for a child, social norms, and altruistic behaviour may undermine the importance of monetary incentives.
Moreover, suppose we overcome the previous caveat, there is still some controversy over whether mothers should rely on grandmothers to care for their children. Who should work? Factors, such as returns to experience, could tip the balance in favour of the granny leave policy because of the adverse consequences for mothers of being absent from the labour force for a long time to care for their children. This type of analysis would require introducing dynamic aspects, such as mothers’ skill depreciation and the rules for the computation of pension schemes, that are absent in this article. Given that the treatment of the granny leave policy is incomplete (for all these reasons), this article should be considered as a first approximation in terms of cost/elasticity of these policies.
Finally, further empirical research concerning the relative value of time spent in formal versus informal childcare is needed. This question is important because grandmother and formally provided childcare might not be perfect substitutes.[34] If one turns out to be better than the other, the modelling of the choice of childcare would be relevant in this context. These avenues of research are beyond the scope of this article, though on the agenda of future analysis.
-
Funding information: Financial support by the Spanish Ministry of Science, Innovation and Universities through grant ECO2017-86780-R (AEI/FEDER, UE) and Junta de Andalucía through I+D+i project P20-00808 is gratefully acknowledged.
-
Conflict of interest: None.
Appendix Mothers’ Policy Functions
The policy functions displayed in this Appendix show mothers’ labour force participation (MLFP). These matrices show the choice of mothers’ hours worked according to the education and productivity types of both partners for mothers helped and not helped by grandmothers.[35] Whenever a dash “–” appears in a matrix, it means that this type of woman (matched to a particular type of man) decided not to become a mother and, therefore, work all their disposable time. Rows order women decisions according to their education level (from low to high education), while columns indicate the education level of their partners. Note that for each educational level there are five productivity types (1,2,3,4,5), again ordered from low to high. For instance, the first five rows indicate the choice of hours worked by women with less than high school education and productivity types in increasing order, and so on. The same pattern applies for men, but across columns.
Baseline scenario: Helped MLFP by productivity type in pdo1
| Men | ||||||||||||||||
|---|---|---|---|---|---|---|---|---|---|---|---|---|---|---|---|---|
|
|
hs | col | ||||||||||||||
| Women | 1 | 2 | 3 | 4 | 5 | 1 | 2 | 3 | 4 | 5 | 1 | 2 | 3 | 4 | 5 | |
| 1 | — | — | — | 0 | 0 | 0 | 0 | 0 | 0 | 0 | 0 | 0 | 0 | 0 | 0 | |
| 2 | — | — | — | — | 0 | — | 0 | 0 | 0 | 0 | 0 | 0 | 0 | 0 | 0 | |
|
|
3 | 0.45 | 0.42 | — | — | — | — | — | — | 0 | 0 | 0 | 0 | 0 | 0 | 0 |
| 4 | 0.52 | 0.47 | 0.42 | — | — | — | — | — | — | 0 | — | 0 | 0 | 0 | 0 | |
| 5 | 0.59 | 0.54 | 0.50 | 0.44 | — | 0.47 | 0.42 | — | — | — | — | — | — | 0 | 0 | |
| 1 | — | — | — | — | 0 | — | 0 | 0 | 0 | 0 | 0 | 0 | 0 | 0 | 0 | |
| 2 | 0.45 | 0.42 | — | — | — | — | — | — | 0 | 0 | 0 | 0 | 0 | 0 | 0 | |
|
|
3 | 0.53 | 0.47 | 0.42 | — | — | — | — | — | — | 0 | — | 0 | 0 | 0 | 0 |
| 4 | 0.59 | 0.55 | 0.50 | 0.44 | — | 0.47 | 0.42 | — | — | — | — | — | — | 0 | 0 | |
| 5 | 0.65 | 0.61 | 0.56 | 0.52 | 0.47 | 0.54 | 0.49 | 0.44 | — | — | 0.42 | — | — | — | 0 | |
| 1 | 0.58 | 0.54 | 0.49 | 0.44 | — | 0.46 | 0.42 | — | — | — | — | — | 0 | 0 | 0 | |
| 2 | 0.64 | 0.60 | 0.56 | 0.51 | 0.46 | 0.53 | 0.48 | 0.43 | — | — | 0.42 | — | — | — | 0 | |
|
|
3 | 0.70 | 0.66 | 0.62 | 0.58 | 0.53 | 0.60 | 0.55 | 0.50 | 0.45 | — | 0.48 | 0.43 | — | — | — |
| 4 | — | 0.71 | 0.68 | 0.64 | 0.60 | 0.66 | 0.62 | 0.58 | 0.52 | 0.47 | 0.56 | 0.50 | 0.45 | — | — | |
| 5 | — | 0.76 | 0.73 | 0.70 | 0.66 | 0.71 | 0.68 | 0.64 | 0.59 | 0.54 | 0.62 | 0.57 | 0.52 | 0.47 | 0.42 | |
Baseline scenario: Not helped MLFP by productivity type in pdo1
| Men | ||||||||||||||||
|---|---|---|---|---|---|---|---|---|---|---|---|---|---|---|---|---|
|
|
hs | col | ||||||||||||||
| Women | 1 | 2 | 3 | 4 | 5 | 1 | 2 | 3 | 4 | 5 | 1 | 2 | 3 | 4 | 5 | |
| 1 | — | — | — | 0 | 0 | 0 | 0 | 0 | 0 | 0 | 0 | 0 | 0 | 0 | 0 | |
| 2 | — | — | — | — | 0 | — | 0 | 0 | 0 | 0 | 0 | 0 | 0 | 0 | 0 | |
|
|
3 | — | — | — | — | — | — | — | — | 0 | 0 | 0 | 0 | 0 | 0 | 0 |
| 4 | 0.53 | 0.48 | — | — | — | — | — | — | — | 0 | — | 0 | 0 | 0 | 0 | |
| 5 | 0.60 | 0.55 | 0.51 | 0 | — | 0.48 | — | — | — | — | — | — | — | 0 | 0 | |
| 1 | — | — | — | — | 0 | — | 0 | 0 | 0 | 0 | 0 | 0 | 0 | 0 | 0 | |
| 2 | — | — | — | — | — | — | — | — | 0 | 0 | 0 | 0 | 0 | 0 | 0 | |
|
|
3 | 0.53 | 0.48 | — | — | — | — | — | — | — | 0 | — | 0 | 0 | 0 | 0 |
| 4 | 0.60 | 0.55 | 0.51 | 0 | — | 0.48 | — | — | — | — | — | — | — | 0 | 0 | |
| 5 | — | 0.62 | 0.58 | 0.53 | 0 | 0.55 | 0.50 | 0 | — | — | — | — | — | — | 0 | |
| 1 | 0.59 | 0.55 | 0.50 | — | — | 0.47 | — | — | — | — | — | — | 0 | 0 | 0 | |
| 2 | 0.66 | 0.61 | 0.57 | 0.52 | 0 | 0.54 | 0.49 | — | — | — | — | — | — | — | 0 | |
|
|
3 | — | — | 0.63 | 0.59 | 0.54 | 0.61 | 0.56 | 0.51 | 0 | — | 0 | — | — | — | — |
| 4 | — | — | — | — | 0.61 | — | 0.63 | 0.59 | 0.53 | 0 | 0.57 | 0.51 | 0 | — | — | |
| 5 | — | — | — | — | — | — | — | 0.65 | 0.60 | 0.55 | 0.63 | 0.58 | 0.53 | 0 | — | |
Baseline scenario: Helped MLFP by productivity type in pdo2
| Men | ||||||||||||||||
|---|---|---|---|---|---|---|---|---|---|---|---|---|---|---|---|---|
|
|
hs | col | ||||||||||||||
| Women | 1 | 2 | 3 | 4 | 5 | 1 | 2 | 3 | 4 | 5 | 1 | 2 | 3 | 4 | 5 | |
| 1 | — | — | — | 0 | 0 | 0 | 0 | 0 | 0 | 0 | 0 | 0 | 0 | 0 | 0 | |
| 2 | — | — | — | — | 0 | — | 0 | 0 | 0 | 0 | 0 | 0 | 0 | 0 | 0 | |
|
|
3 | 0.49 | 0.43 | — | — | — | — | — | — | 0 | 0 | 0 | 0 | 0 | 0 | 0 |
| 4 | 0.57 | 0.51 | 0.45 | — | — | — | — | — | — | 0 | — | 0 | 0 | 0 | 0 | |
| 5 | 0.63 | 0.58 | 0.53 | 0.48 | — | 0.50 | 0.44 | — | — | — | — | — | — | 0 | 0 | |
| 1 | — | — | — | — | 0 | — | 0 | 0 | 0 | 0 | 0 | 0 | 0 | 0 | 0 | |
| 2 | 0.50 | 0.43 | — | — | — | — | — | — | 0 | 0 | 0 | 0 | 0 | 0 | 0 | |
|
|
3 | 0.57 | 0.51 | 0.45 | — | — | — | — | — | — | 0 | — | 0 | 0 | 0 | 0 |
| 4 | 0.63 | 0.58 | 0.53 | 0.48 | — | 0.50 | 0.44 | — | — | — | — | — | — | 0 | 0 | |
| 5 | 0.69 | 0.65 | 0.60 | 0.55 | 0.50 | 0.57 | 0.52 | 0.46 | — | — | 0.44 | — | — | — | 0 | |
| 1 | 0.62 | 0.58 | 0.52 | 0.47 | — | 0.50 | 0.43 | — | — | — | — | — | 0 | 0 | 0 | |
| 2 | 0.68 | 0.64 | 0.59 | 0.54 | 0.49 | 0.57 | 0.51 | 0.46 | — | — | 0.43 | — | — | — | 0 | |
|
|
3 | 0.73 | 0.70 | 0.66 | 0.61 | 0.56 | 0.63 | 0.59 | 0.53 | 0.47 | — | 0.51 | 0.45 | — | — | — |
| 4 | — | 0.75 | 0.71 | 0.67 | 0.63 | 0.69 | 0.65 | 0.60 | 0.55 | 0.49 | 0.58 | 0.53 | 0.47 | — | — | |
| 5 | — | 0.79 | 0.76 | 0.72 | 0.68 | 0.74 | 0.70 | 0.66 | 0.62 | 0.56 | 0.64 | 0.60 | 0.54 | 0.49 | 0.43 | |
Baseline scenario: Not helped MLFP by productivity type in pdo2
| Men | ||||||||||||||||
|---|---|---|---|---|---|---|---|---|---|---|---|---|---|---|---|---|
|
|
hs | col | ||||||||||||||
| Women | 1 | 2 | 3 | 4 | 5 | 1 | 2 | 3 | 4 | 5 | 1 | 2 | 3 | 4 | 5 | |
| 1 | — | — | — | 0 | 0 | 0 | 0 | 0 | 0 | 0 | 0 | 0 | 0 | 0 | 0 | |
| 2 | — | — | — | — | 0 | — | 0 | 0 | 0 | 0 | 0 | 0 | 0 | 0 | 0 | |
|
|
3 | — | — | — | — | — | — | — | — | 0 | 0 | 0 | 0 | 0 | 0 | 0 |
| 4 | 0.46 | 0.42 | — | — | — | — | — | — | — | 0 | — | 0 | 0 | 0 | 0 | |
| 5 | 0.55 | 0.50 | 0.44 | 0.42 | — | 0.42 | — | — | — | — | — | — | — | 0 | 0 | |
| 1 | — | — | — | — | 0 | — | 0 | 0 | 0 | 0 | 0 | 0 | 0 | 0 | 0 | |
| 2 | — | — | — | — | — | — | — | — | 0 | 0 | 0 | 0 | 0 | 0 | 0 | |
|
|
3 | 0.47 | 0.42 | — | — | — | — | — | — | — | 0 | — | 0 | 0 | 0 | 0 |
| 4 | 0.55 | 0.50 | 0.44 | 0.42 | — | 0.42 | — | — | — | — | — | — | — | 0 | 0 | |
| 5 | — | 0.57 | 0.52 | 0.47 | 0.42 | 0.50 | 0.44 | 0.42 | — | — | — | — | — | — | 0 | |
| 1 | 0.54 | 0.49 | 0.43 | — | — | 0.42 | — | — | — | — | — | — | 0 | 0 | 0 | |
| 2 | 0.61 | 0.56 | 0.51 | 0.46 | 0.42 | 0.49 | 0.42 | — | — | — | — | — | — | — | 0 | |
|
|
3 | — | — | 0.59 | 0.54 | 0.49 | 0.56 | 0.51 | 0.46 | 0.42 | — | 0.43 | — | — | — | — |
| 4 | — | — | — | — | 0.57 | — | 0.59 | 0.54 | 0.48 | 0.42 | 0.52 | 0.46 | 0.42 | — | — | |
| 5 | — | — | — | — | — | — | — | 0.61 | 0.56 | 0.51 | 0.59 | 0.54 | 0.49 | 0.43 | — | |
Childcare subsidy scenario: Helped MLFP by productivity type in pdo1
| Men | ||||||||||||||||
|---|---|---|---|---|---|---|---|---|---|---|---|---|---|---|---|---|
|
|
hs | col | ||||||||||||||
| Women | 1 | 2 | 3 | 4 | 5 | 1 | 2 | 3 | 4 | 5 | 1 | 2 | 3 | 4 | 5 | |
| 1 | — | — | — | 0 | 0 | 0 | 0 | 0 | 0 | 0 | 0 | 0 | 0 | 0 | 0 | |
| 2 | — | — | — | — | 0 | — | 0 | 0 | 0 | 0 | 0 | 0 | 0 | 0 | 0 | |
|
|
3 | 0.45 | 0 | — | — | — | — | — | — | 0 | 0 | 0 | 0 | 0 | 0 | 0 |
| 4 | 0.52 | 0.47 | 0.42 | — | — | — | — | — | — | 0 | — | 0 | 0 | 0 | 0 | |
| 5 | 0.59 | 0.54 | 0.50 | 0.44 | — | 0.47 | 0.42 | — | — | — | — | — | — | 0 | 0 | |
| 1 | — | — | — | — | 0 | — | 0 | 0 | 0 | 0 | 0 | 0 | 0 | 0 | 0 | |
| 2 | 0.45 | — | — | — | — | — | — | — | 0 | 0 | 0 | 0 | 0 | 0 | 0 | |
|
|
3 | 0.53 | 0.47 | 0.42 | — | — | — | — | — | — | 0 | — | 0 | 0 | 0 | 0 |
| 4 | 0.59 | 0.55 | 0.50 | 0.44 | — | 0.47 | 0.42 | — | — | — | — | — | — | 0 | 0 | |
| 5 | 0.65 | 0.61 | 0.56 | 0.52 | 0.47 | 0.54 | 0.49 | 0.44 | — | — | 0.42 | — | — | — | 0 | |
| 1 | 0.58 | 0.54 | 0.49 | 0.44 | — | 0.46 | 0.42 | — | — | — | — | — | 0 | 0 | 0 | |
| 2 | 0.64 | 0.60 | 0.56 | 0.51 | 0.46 | 0.53 | 0.48 | 0.43 | — | — | 0.42 | — | — | — | 0 | |
|
|
3 | 0.70 | 0.66 | 0.62 | 0.58 | 0.53 | 0.60 | 0.55 | 0.50 | 0.45 | — | 0.48 | 0.43 | — | — | — |
| 4 | 0.74 | 0.71 | 0.68 | 0.64 | 0.60 | 0.66 | 0.62 | 0.58 | 0.52 | 0.47 | 0.56 | 0.50 | 0.45 | — | — | |
| 5 | — | 0.76 | 0.73 | 0.70 | 0.66 | 0.71 | 0.68 | 0.63 | 0.59 | 0.54 | 0.62 | 0.57 | 0.52 | 0.47 | 0.42 | |
Childcare subsidy scenario: Not helped MLFP by productivity type in pdo1
| Men | ||||||||||||||||
|---|---|---|---|---|---|---|---|---|---|---|---|---|---|---|---|---|
|
|
hs | col | ||||||||||||||
| Women | 1 | 2 | 3 | 4 | 5 | 1 | 2 | 3 | 4 | 5 | 1 | 2 | 3 | 4 | 5 | |
| 1 | — | — | — | 0 | 0 | 0 | 0 | 0 | 0 | 0 | 0 | 0 | 0 | 0 | 0 | |
| 2 | — | — | — | — | 0 | — | 0 | 0 | 0 | 0 | 0 | 0 | 0 | 0 | 0 | |
|
|
3 | 0.45 | — | — | — | — | — | — | — | 0 | 0 | 0 | 0 | 0 | 0 | 0 |
| 4 | 0.52 | 0.47 | — | — | — | — | — | — | — | 0 | — | 0 | 0 | 0 | 0 | |
| 5 | 0.59 | 0.54 | 0.50 | 0.45 | — | 0.47 | — | — | — | — | — | — | — | 0 | 0 | |
| 1 | — | — | — | — | 0 | — | 0 | 0 | 0 | 0 | 0 | 0 | 0 | 0 | 0 | |
| 2 | 0.45 | — | — | — | — | — | — | — | 0 | 0 | 0 | 0 | 0 | 0 | 0 | |
|
|
3 | 0.53 | 0.47 | — | — | — | — | — | — | — | 0 | — | 0 | 0 | 0 | 0 |
| 4 | 0.59 | 0.54 | 0.50 | 0.45 | — | 0.47 | — | — | — | — | — | — | — | 0 | 0 | |
| 5 | 0.65 | 0.61 | 0.57 | 0.52 | 0.47 | 0.54 | 0.49 | 0.44 | — | — | — | — | — | — | 0 | |
| 1 | 0.58 | 0.54 | 0.49 | — | — | 0.46 | — | — | — | — | — | — | 0 | 0 | 0 | |
| 2 | 0.65 | 0.60 | 0.56 | 0.51 | 0.47 | 0.54 | 0.49 | — | — | — | — | — | — | — | 0 | |
|
|
3 | 0.70 | 0.66 | 0.62 | 0.58 | 0.53 | 0.60 | 0.56 | 0.51 | 0.46 | — | 0.49 | — | — | — | — |
| 4 | — | — | — | — | 0.61 | — | 0.63 | 0.59 | — | 0 | 0.57 | 0.51 | 0 | — | — | |
| 5 | — | — | — | — | — | — | — | 0.64 | 0.60 | — | 0.63 | 0.58 | — | 0 | — | |
Double subsidy scenario: Helped MLFP by productivity type in pdo2
| Men | ||||||||||||||||
|---|---|---|---|---|---|---|---|---|---|---|---|---|---|---|---|---|
|
|
hs | col | ||||||||||||||
| Women | 1 | 2 | 3 | 4 | 5 | 1 | 2 | 3 | 4 | 5 | 1 | 2 | 3 | 4 | 5 | |
| 1 | — | — | — | 0 | 0 | 0 | 0 | 0 | 0 | 0 | 0 | 0 | 0 | 0 | 0 | |
| 2 | — | — | — | — | 0 | — | 0 | 0 | 0 | 0 | 0 | 0 | 0 | 0 | 0 | |
|
|
3 | 0.49 | 0.43 | — | — | — | — | — | — | 0 | 0 | 0 | 0 | 0 | 0 | 0 |
| 4 | 0.57 | 0.51 | 0.45 | — | — | — | — | — | — | 0 | — | 0 | 0 | 0 | 0 | |
| 5 | 0.63 | 0.58 | 0.53 | 0.48 | — | 0.50 | 0.44 | — | — | — | — | — | — | 0 | 0 | |
| 1 | — | — | — | — | 0 | — | 0 | 0 | 0 | 0 | 0 | 0 | 0 | 0 | 0 | |
| 2 | 0.50 | 0.43 | — | — | — | — | — | — | 0 | 0 | 0 | 0 | 0 | 0 | 0 | |
|
|
3 | 0.57 | 0.51 | 0.45 | — | — | — | — | — | — | 0 | — | 0 | 0 | 0 | 0 |
| 4 | 0.63 | 0.58 | 0.53 | 0.48 | — | 0.50 | 0.44 | — | — | — | — | — | — | 0 | 0 | |
| 5 | 0.69 | 0.65 | 0.60 | 0.55 | 0.50 | 0.57 | 0.52 | 0.46 | — | — | 0.44 | — | — | — | 0 | |
| 1 | 0.62 | 0.57 | 0.52 | 0.47 | — | 0.50 | 0.43 | — | — | — | — | — | 0 | 0 | 0 | |
| 2 | 0.68. | 64 | 0.59 | 0.54 | 0.49 | 0.57 | 0.51 | 0.46 | — | — | 0.43 | — | — | — | 0 | |
|
|
3 | 0.73 | 0.69 | 0.65 | 0.61 | 0.56 | 0.63 | 0.58 | 0.53 | 0.47 | — | 0.51 | 0.45 | — | — | — |
| 4 | 0.77 | 0.74 | 0.71 | 0.67 | 0.62 | 0.69 | 0.65 | 0.60 | 0.55 | 0.49 | 0.58 | 0.53 | 0.47 | — | — | |
| 5 | — | 0.79 | 0.75 | 0.72 | 0.68 | 0.74 | 0.70 | 0.66 | 0.61 | 0.56 | 0.64 | 0.59 | 0.54 | 0.49 | 0.43 | |
Double subsidy scenario: Not helped MLFP by productivity type in pdo2
| Men | ||||||||||||||||
|---|---|---|---|---|---|---|---|---|---|---|---|---|---|---|---|---|
|
|
hs | col | ||||||||||||||
| Women | 1 | 2 | 3 | 4 | 5 | 1 | 2 | 3 | 4 | 5 | 1 | 2 | 3 | 4 | 5 | |
| 1 | — | — | — | 0 | 0 | 0 | 0 | 0 | 0 | 0 | 0 | 0 | 0 | 0 | 0 | |
| 2 | — | — | — | — | 0 | — | 0 | 0 | 0 | 0 | 0 | 0 | 0 | 0 | 0 | |
|
|
3 | 0.43 | — | — | — | — | — | — | — | 0 | 0 | 0 | 0 | 0 | 0 | 0 |
| 4 | 0.52 | 0.46 | 0.42 | — | — | — | — | — | — | 0 | — | 0 | 0 | 0 | 0 | |
| 5 | 0.59 | 0.54 | 0.49 | 0.42 | — | 0.45 | — | — | — | — | — | — | — | 0 | 0 | |
| 1 | — | — | — | — | 0 | — | 0 | 0 | 0 | 0 | 0 | 0 | 0 | 0 | 0 | |
| 2 | 0.43 | — | — | — | — | — | — | — | 0 | 0 | 0 | 0 | 0 | 0 | 0 | |
|
|
3 | 0.52 | 0.46 | 0.42 | — | — | — | — | — | — | 0 | — | 0 | 0 | 0 | 0 |
| 4 | 0.59 | 0.54 | 0.49 | 0.43 | — | 0.46 | — | — | — | — | — | — | — | 0 | 0 | |
| 5 | 0.65 | 0.61 | 0.56 | 0.51 | 0.45 | 0.53 | 0.48 | 0.42 | — | — | — | — | — | — | 0 | |
| 1 | 0.58 | 0.53 | 0.48 | 0.42 | — | 0.45 | — | — | — | — | — | — | 0 | 0 | 0 | |
| 2 | 0.65 | 0.60 | 0.55 | 0.50 | 0.45 | 0.53 | 0.47 | 0.42 | — | — | — | — | — | — | 0 | |
|
|
3 | 0.70 | 0.66 | 0.62 | 0.57 | 0.52 | 0.60 | 0.55 | 0.49 | 0.43 | — | 0.47 | 0.42 | — | — | — |
| 4 | — | 0.72 | — | 0.64 | 0.60 | — | 0.62 | 0.57 | 0.52 | 0.46 | 0.55 | 0.49 | 0.43 | — | — | |
| 5 | — | — | — | — | 0.66 | — | — | 0.63 | 0.59 | — | 0.61 | 0.57 | — | 0.46 | — | |
Granny leave scenario: Helped MLFP by productivity type in pdo1
| Men | ||||||||||||||||
|---|---|---|---|---|---|---|---|---|---|---|---|---|---|---|---|---|
|
|
hs | col | ||||||||||||||
| Women | 1 | 2 | 3 | 4 | 5 | 1 | 2 | 3 | 4 | 5 | 1 | 2 | 3 | 4 | 5 | |
| 1 | — | — | — | 0 | 0 | 0 | 0 | 0 | 0 | 0 | 0 | 0 | 0 | 0 | 0 | |
| 2 | — | — | — | — | 0 | — | 0 | 0 | 0 | 0 | 0 | 0 | 0 | 0 | 0 | |
|
|
3 | 0.45 | 0 | — | — | — | — | — | — | 0 | 0 | 0 | 0 | 0 | 0 | 0 |
| 4 | 0.52 | 0.47 | 0.42 | — | — | — | — | — | — | 0 | — | 0 | 0 | 0 | 0 | |
| 5 | 0.59 | 0.54 | 0.49 | 0.44 | — | 0.47 | 0.42 | — | — | — | — | — | — | 0 | 0 | |
| 1 | — | — | — | — | 0 | — | 0 | 0 | 0 | 0 | 0 | 0 | 0 | 0 | 0 | |
| 2 | 0.45 | 0.42 | — | — | — | — | — | — | 0 | 0 | 0 | 0 | 0 | 0 | 0 | |
|
|
3 | 0.52 | 0.47 | 0.42 | — | — | — | — | — | — | 0 | — | 0 | 0 | 0 | 0 |
| 4 | 0.59 | 0.54 | 0.50 | 0.44 | — | 0.47 | 0.42 | — | — | — | — | — | — | 0 | 0 | |
| 5 | 0.65 | 0.61 | 0.56 | 0.52 | 0.47 | 0.54 | 0.49 | 0.44 | — | — | 0.42 | — | — | — | 0 | |
| 1 | 0.58 | 0.53 | 0.49 | 0.43 | — | 0.46 | 0.42 | — | — | — | — | — | 0 | 0 | 0 | |
| 2 | 0.64 | 0.60 | 0.56 | 0.51 | 0.46 | 0.53 | 0.48 | 0.43 | — | — | 0.42 | — | — | — | 0 | |
|
|
3 | 0.69 | 0.66 | 0.62 | 0.58 | 0.53 | 0.60 | 0.55 | 0.50 | 0.45 | — | 0.48 | 0.43 | — | — | — |
| 4 | 0.74 | 0.71 | 0.67 | 0.64 | 0.60 | 0.65 | 0.62 | 0.57 | 0.52 | 0.47 | 0.55 | 0.50 | 0.45 | — | — | |
| 5 | — | 0.76 | 0.72 | 0.69 | 0.65 | 0.71 | 0.67 | 0.63 | 0.59 | 0.54 | 0.61 | 0.57 | 0.52 | 0.47 | 0.42 | |
Granny leave scenario: Not helped MLFP by productivity type in pdo1
| Men | ||||||||||||||||
|---|---|---|---|---|---|---|---|---|---|---|---|---|---|---|---|---|
|
|
hs | col | ||||||||||||||
| Women | 1 | 2 | 3 | 4 | 5 | 1 | 2 | 3 | 4 | 5 | 1 | 2 | 3 | 4 | 5 | |
| 1 | — | — | — | 0 | 0 | 0 | 0 | 0 | 0 | 0 | 0 | 0 | 0 | 0 | 0 | |
| 2 | — | — | — | — | 0 | — | 0 | 0 | 0 | 0 | 0 | 0 | 0 | 0 | 0 | |
|
|
3 | — | — | — | — | — | — | — | — | 0 | 0 | 0 | 0 | 0 | 0 | 0 |
| 4 | 0.53 | 0.48 | — | — | — | — | — | — | — | 0 | — | 0 | 0 | 0 | 0 | |
| 5 | 0.59 | 0.55 | 0.50 | 0 | — | 0.48 | — | — | — | — | — | — | — | 0 | 0 | |
| 1 | — | — | — | — | 0 | — | 0 | 0 | 0 | 0 | 0 | 0 | 0 | 0 | 0 | |
| 2 | — | — | — | — | — | — | — | — | 0 | 0 | 0 | 0 | 0 | 0 | 0 | |
|
|
3 | 0.53 | 0.48 | — | — | — | — | — | — | — | 0 | — | 0 | 0 | 0 | 0 |
| 4 | 0.60 | 0.55 | 0.51 | 0 | — | 0.48 | — | — | — | — | — | — | — | 0 | 0 | |
| 5 | 0.65 | 0.62 | 0.57 | 0.53 | 0 | 0.55 | 0.50 | 0 | — | — | — | — | — | — | 0 | |
| 1 | 0.59 | 0.54 | 0.49 | — | — | 0.47 | — | — | — | — | — | — | 0 | 0 | 0 | |
| 2 | 0.65 | 0.61 | 0.56 | 0.52 | 0 | 0.54 | 0.49 | — | — | — | — | — | — | — | 0 | |
|
|
3 | — | 0.67 | 0.63 | 0.59 | 0.54 | 0.61 | 0.56 | 0.51 | 0 | — | 0 | — | — | — | — |
| 4 | — | — | — | 0.65 | 0.61 | — | 0.63 | 0.58 | 0.53 | 0 | 0.57 | 0.51 | 0 | — | — | |
| 5 | — | — | — | — | 0.67 | — | — | 0.64 | 0.60 | 0.55 | 0.62 | 0.58 | 0.53 | 0 | — | |
No childcare subsidy scenario: Helped MLFP by productivity type in pdo1
| Men | ||||||||||||||||
|---|---|---|---|---|---|---|---|---|---|---|---|---|---|---|---|---|
|
|
hs | col | ||||||||||||||
| Women | 1 | 2 | 3 | 4 | 5 | 1 | 2 | 3 | 4 | 5 | 1 | 2 | 3 | 4 | 5 | |
| 1 | — | — | — | 0 | 0 | 0 | 0 | 0 | 0 | 0 | 0 | 0 | 0 | 0 | 0 | |
| 2 | — | — | — | — | 0 | — | 0 | 0 | 0 | 0 | 0 | 0 | 0 | 0 | 0 | |
|
|
3 | 0.45 | 0.42 | — | — | — | — | — | — | 0 | 0 | 0 | 0 | 0 | 0 | 0 |
| 4 | 0.52 | 0.47 | 0.42 | — | — | — | — | — | — | 0 | — | 0 | 0 | 0 | 0 | |
| 5 | 0.59 | 0.54 | 0.50 | 0.44 | — | 0.47 | 0.42 | — | — | — | — | — | — | 0 | 0 | |
| 1 | — | — | — | — | 0 | — | 0 | 0 | 0 | 0 | 0 | 0 | 0 | 0 | 0 | |
| 2 | 0.45 | 0.42 | — | — | — | — | — | — | 0 | 0 | 0 | 0 | 0 | 0 | 0 | |
|
|
3 | 0.53 | 0.47 | 0.42 | — | — | — | — | — | — | 0 | — | 0 | 0 | 0 | 0 |
| 4 | 0.59 | 0.55 | 0.50 | 0.44 | — | 0.47 | 0.42 | — | — | — | — | — | — | 0 | 0 | |
| 5 | 0.65 | 0.61 | 0.56 | 0.52 | 0.47 | 0.54 | 0.49 | 0.44 | — | — | 0.42 | — | — | — | 0 | |
| 1 | 0.58 | 0.54 | 0.49 | 0.44 | — | 0.46 | 0.42 | — | — | — | — | — | 0 | 0 | 0 | |
| 2 | 0.64 | 0.60 | 0.56 | 0.51 | 0.46 | 0.53 | 0.48 | 0.43 | — | — | 0.42 | — | — | — | 0 | |
|
|
3 | 0.70 | 0.66 | 0.62 | 0.58 | 0.53 | 0.60 | 0.55 | 0.50 | 0.45 | — | 0.48 | 0.43 | — | — | — |
| 4 | — | 0.71 | 0.68 | 0.64 | 0.60 | 0.66 | 0.62 | 0.58 | 0.52 | 0.47 | 0.56 | 0.50 | 0.45 | — | — | |
| 5 | — | 0.76 | 0.73 | 0.70 | 0.66 | 0.71 | 0.68 | 0.64 | 0.59 | 0.54 | 0.62 | 0.57 | 0.52 | 0.47 | 0.42 | |
No childcare subsidy scenario: Not helped MLFP by productivity type in pdo1
| Men | ||||||||||||||||
|---|---|---|---|---|---|---|---|---|---|---|---|---|---|---|---|---|
|
|
hs | col | ||||||||||||||
| Women | 1 | 2 | 3 | 4 | 5 | 1 | 2 | 3 | 4 | 5 | 1 | 2 | 3 | 4 | 5 | |
| 1 | — | — | — | 0 | 0 | 0 | 0 | 0 | 0 | 0 | 0 | 0 | 0 | 0 | 0 | |
| 2 | — | — | — | — | 0 | — | 0 | 0 | 0 | 0 | 0 | 0 | 0 | 0 | 0 | |
|
|
3 | — | — | — | — | — | — | — | — | 0 | 0 | 0 | 0 | 0 | 0 | 0 |
| 4 | — | — | — | — | — | — | — | — | — | 0 | — | 0 | 0 | 0 | 0 | |
| 5 | 0.61 | — | — | 0 | — | — | — | — | — | — | — | — | — | 0 | 0 | |
| 1 | — | — | — | — | 0 | — | 0 | 0 | 0 | 0 | 0 | 0 | 0 | 0 | 0 | |
| 2 | — | — | — | — | — | — | — | — | 0 | 0 | 0 | 0 | 0 | 0 | 0 | |
|
|
3 | — | — | — | — | — | — | — | — | — | 0 | 1 | 0 | 0 | 0 | 0 |
| 4 | 0.61 | — | — | 0 | — | — | — | — | — | — | — | — | — | 0 | 0 | |
| 5 | — | 0.63 | 0.58 | — | 0 | — | — | 0 | — | — | — | — | — | — | 0 | |
| 1 | 0.61 | — | — | — | — | 0- | — | — | — | — | — | — | 0 | 0 | 0 | |
| 2 | — | 0.62 | 0.57 | — | 0 | — | — | — | — | — | — | — | — | — | — | |
|
|
3 | — | — | 0.64 | 0.59 | 0.54 | 0.61 | 0.57 | — | 0 | — | 0 | — | — | — | — |
| 4 | — | — | — | — | 0.61 | — | 0.63 | 0.59 | 0.53 | 0 | 0.57 | — | 0 | — | — | |
| 5 | — | — | — | — | — | — | — | 0.65 | 0.60 | 0.55 | 0.63 | 0.58 | 0.53 | 0 | — | |
No tax credit scenario: Helped Mothers’ LFP by productivity type in pdo1
| Men | ||||||||||||||||
|---|---|---|---|---|---|---|---|---|---|---|---|---|---|---|---|---|
|
|
hs | col | ||||||||||||||
| Women | 1 | 2 | 3 | 4 | 5 | 1 | 2 | 3 | 4 | 5 | 1 | 2 | 3 | 4 | 5 | |
| 1 | — | — | — | 0 | 0 | 0 | 0 | 0 | 0 | 0 | 0 | 0 | 0 | 0 | 0 | |
| 2 | — | — | — | — | 0 | — | 0 | 0 | 0 | 0 | 0 | 0 | 0 | 0 | 0 | |
|
|
3 | 0.50 | 0.45 | — | — | — | — | — | — | 0 | 0 | 0 | 0 | 0 | 0 | 0 |
| 4 | 0.57 | 0.52 | 0.46 | — | — | — | — | — | — | 0 | — | 0 | 0 | 0 | 0 | |
| 5 | 0.63 | 0.59 | 0.54 | 0.49 | — | 0.51 | 0.45 | — | — | — | — | — | — | 0 | 0 | |
| 1 | — | — | — | — | 0 | — | 0 | 0 | 0 | 0 | 0 | 0 | 0 | 0 | 0 | |
| 2 | 0.50 | 0.45 | — | — | — | — | — | — | 0 | 0 | 0 | 0 | 0 | 0 | 0 | |
|
|
3 | 0.57 | 52 | 0.47 | — | — | — | — | — | — | 0 | — | 0 | 0 | 0 | 0 |
| 4 | 0.63 | 0.59 | 0.54 | 0.49 | — | 0.51 | 0.46 | — | — | — | — | — | — | 0 | 0 | |
| 5 | 0.69 | 0.65 | 0.60 | 0.56 | 0.50 | 0.58 | 0.53 | 0.47 | — | — | 0.45 | — | — | — | 0 | |
| 1 | 0.63 | 0.58 | 0.53 | 0.48 | — | 0.50 | 0.45 | — | — | — | — | — | 0 | 0 | 0 | |
| 2 | 0.68 | 0.64 | 0.59 | 0.55 | 0.49 | 0.57 | 0.52 | 0.47 | — | — | 0.44 | — | — | — | 0 | |
|
|
3 | — | 0.69 | 0.66 | 0.61 | 0.56 | 0.63 | 0.59 | 0.54 | 0.48 | — | 0.52 | 0.46 | — | — | — |
| 4 | — | — | — | 0.67 | 0.63 | 0.69 | 0.65 | 0.60 | 0.56 | 0.50 | 0.59 | 0.53 | 0.48 | — | — | |
| 5 | — | — | — | — | 0.69 | — | 0.70 | 0.66 | 0.62 | 0.57 | 0.64 | 0.60 | 0.55 | 0.50 | 0.44 | |
No tax credit scenario: Not helped MLFP by productivity type in pdo1
| Men | ||||||||||||||||
|---|---|---|---|---|---|---|---|---|---|---|---|---|---|---|---|---|
|
|
hs | col | ||||||||||||||
| Women | 1 | 2 | 3 | 4 | 5 | 1 | 2 | 3 | 4 | 5 | 1 | 2 | 3 | 4 | 5 | |
| 1 | — | — | — | 0 | 0 | 0 | 0 | 0 | 0 | 0 | 0 | 0 | 0 | 0 | 0 | |
| 2 | — | — | — | — | 0 | — | 0 | 0 | 0 | 0 | 0 | 0 | 0 | 0 | 0 | |
|
|
3 | — | — | — | — | — | — | — | — | 0 | 0 | 0 | 0 | 0 | 0 | 0 |
| 4 | 0.58- | — | — | — | — | — | — | — | — | 0 | 1 | 0 | 0 | 0 | 0 | |
| 5 | — | 0.60 | 0.55 | 0 | — | — | — | — | — | — | — | — | — | 0 | 0 | |
| 1 | — | — | — | — | 0 | — | 0 | 0 | 0 | 0 | 0 | 0 | 0 | 0 | 0 | |
| 2 | — | — | — | — | — | — | — | — | 0 | 0 | 0 | 0 | 0 | 0 | 0 | |
|
|
3 | 0.58- | — | — | — | — | — | — | — | — | 0 | — | 0 | 0 | 0 | 0 |
| 4 | — | 0.60 | 0.55 | 0 | — | — | — | — | — | — | — | — | — | 0 | 0 | |
| 5 | — | — | 0.61 | 0.56 | 0 | 0.59 | 0.54 | 0 | — | — | — | — | — | — | 0 | |
| 1 | — | 0.59- | — | — | — | 0 | — | — | — | — | — | — | 0 | 0 | 0 | |
| 2 | — | — | 0.61 | 0.56 | 0 | 0.58 | 0.53 | — | — | — | — | — | — | — | 0 | |
|
|
3 | — | — | — | 0.62 | 0.57 | — | 0.60 | 0.55 | 0 | — | 0 | — | — | — | — |
| 4 | — | — | — | — | — | — | — | — | 0.57 | 0 | 0.60 | 0.54 | 0 | — | — | |
| 5 | — | — | — | — | — | — | — | — | — | 0.58 | — | 0.61 | 0.56 | 0 | — | |
References
Aassve, A. , Meroni, E. , & Pronzato, C. (2012). Grandparenting and childbearing in the extended family. European Journal of Population, 28(4), 499–518. 10.1007/s10680-012-9273-2Suche in Google Scholar
Aparicio-Fenoll, A. , & Vidal-Fernández, M. (2015). Working women and fertility: The role of grandmothers’ labour force participation. CESifo Economic Studies, 61, 123–147. 10.1093/cesifo/ifu030Suche in Google Scholar
Apps, P. , & Rees, R. (2004). Fertility, taxation and family policy. The Scandinavian Journal of Economics, 106(4), 745–763. 10.1111/j.0347-0520.2004.00386.xSuche in Google Scholar
Azmat, G. , & González, L. (2010). Targeting fertility and female participation through the income tax. Labour Economics, 17, 487–502. 10.1016/j.labeco.2009.09.006Suche in Google Scholar
Baker, M. , Gruber, J. , & Milligan, K. (2005). Universal childcare, maternal labour supply and family well-being. NBER working paper 11832 . 10.3386/w11832Suche in Google Scholar
Bartel, A. P. , Rossin-Slater, M. , Ruhm, C. J. , Stearns, J. , & Waldfogel, J. (2018). Paid Family leave, Fathers Leave-Taking and Leave-Sharing in Dual-Earner Households. Journal of Policy Analysis and Management, 37(1), 10–37. 10.3386/w21747Suche in Google Scholar
Becker, G. (1965). A theory of the allocation of time. The Economic Journal, 75(299), 493–517. 10.2307/2228949Suche in Google Scholar
Bernal, R. , & Keane, M. (2010). Quasi-structural estimation of a model of child-care choices and child cognitive ability production. Journal of Econometrics, 156, 164–189. 10.1016/j.jeconom.2009.09.015Suche in Google Scholar
Bick, A. (2016). The quantitative role of child care for female labour force participation and fertility. Journal of European Economic Association, 14(3), 639–668. 10.1111/jeea.12143Suche in Google Scholar
Blau, D. , & Hagy, A. P. (1998). The demand for quality in child care. Journal of Political Economy, 106(1), 104–146. 10.1086/250004Suche in Google Scholar
Bratti, M. , Frattini, T. , & Scervini, F. (2018). Grandparental availability for child care and maternal labour force participation: Pension reform evidence from Italy. Journal of Population Economics, 31, 1239–1277. 10.1007/s00148-017-0683-7Suche in Google Scholar
Cardia, E. , & Ng, S. (2003). Intergenerational time transfers and childcare. Review of Economic Dynamics, 6, 431–454. 10.1016/S1094-2025(03)00009-7Suche in Google Scholar
Casarico, A. , & Sommacal, A. (2012). Labor income taxation, human capital, and growth: The role of childcare. Scandandinavian Journal of Economics, 114(4), 1182–1207. 10.1111/j.1467-9442.2012.01718.xSuche in Google Scholar
Collins, A. , & Carlson, B. (1998). Child Care by Kith and Kin-supporting family, friends, and neighbors caring for children intergenerational time transfers and childcare. Issue Brief 5, New York: National Center for Children in Poverty. Suche in Google Scholar
Cools, S. , Fiva, J. H. , & Kirkebøen, L. J. (2014). Causal effects of paternity leave on children and parents. Scandandinavian Journal of Economics, 117(3), 801–828. 10.1111/sjoe.12113Suche in Google Scholar
Del Boca, D. , Pasqua, S. , & Pronzato, Q. (2009). Motherhood and market work decisions in institutional context: A European perspective. Oxford Economic Papers, 61, 147–171. 10.1093/oep/gpn046Suche in Google Scholar
Farré, L. , & González, L. (2019). Does partenity leave reduce fertility? Journal of Public Economics, 172, 52–66. 10.1016/j.jpubeco.2018.12.002Suche in Google Scholar
Fernández Cordón, J. A. , & Tobío, C. (2005). Conciliar las responsabilidades familiares y labourales: Políticas y prácticas sociales. Spain: Fundación Alternativas. Suche in Google Scholar
Gauthier, A. H. (2007). The impact of family policies on fertility in industrialized countries: A review of the literature. Population Research and Policy Review, 26, 323–346. 10.1007/s11113-007-9033-xSuche in Google Scholar
García-Morán, E. , & Kuehn, Z. (2017). With strings attached: Grandparent-provided child care and female labour market outcomes. Review of Economic Dynamics, 23, 80–98. 10.1016/j.red.2016.09.004Suche in Google Scholar
Gregg, P. , Washbrook, E. , Propper, C. , & Burguess, S. (2005). The effects of a mother’s return to work decision on child development in the UK. The Economic Journal, 115, 48–80. 10.1111/j.0013-0133.2005.00972.xSuche in Google Scholar
Guner, N. , Remzi, K. , & Ventura, G. (2020). Child-related transfers, household labour supply and welfare. The Review of Economic Studies, 87(5), 2290–2321. 10.1093/restud/rdaa011 Suche in Google Scholar
Haan, P. , & Wrohlich, K. (2011). Can childcare policy encourage employment and fertility? Labour Economics, 18, 498–512. 10.1016/j.labeco.2010.12.008Suche in Google Scholar
Hansen, K. , & Hawkes, D. (2009). Early childcare and child development. Journal of Social Policy, 38(2), 211–239. 10.1017/S004727940800281XSuche in Google Scholar
OECD. (2018). Education at glance. Paris: Organization for Economic Co-Operation and Development. 10.1787/eag-2018-enSuche in Google Scholar
OECD. (2019). Net childcare costs in EU countries. Impact on family incomes and work incentives. Paris: Organization for Economic Co-Operation and Development. Suche in Google Scholar
OECD. (2020). Is childcare affordable?. Policy brief on employment, labour and social affairs. Paris: Organization for Economic Co-Operation and Development.Suche in Google Scholar
Osuna, V. (2018). What accounts for the increase in female labour force participation in Spain. Economics – The Open-Access, Open-Assessment E-Journal, Kiel Institute for the World Economy (IfW), 12, 1–27. Suche in Google Scholar
Méndez, I. (2015). Childcare and geographical mobility in southern Europe. International Labour Review, 154(4), 581–603. 10.1111/j.1564-913X.2015.00032.xSuche in Google Scholar
Peisner-Feinberg, E. S. , Burchinal, M. R. , Clifford, R. M. , Culkin, M. L. , Howes, C. , Kagan, S. L. , & Yazejian, N. (2001). The relation of preschool child-care quality to children’s cognitive and social development trajectories through second grade. Child Development, 72(5), 1534–53. 10.1111/1467-8624.00364Suche in Google Scholar
Rindfuss, R. R. , Guilkey, D. K. , Morgan, S. P. , & Kravdal, O. (2010). Child-care availability and fertility in Norway. Population and Development Review, 36(4), 725–748. 10.1111/j.1728-4457.2010.00355.xSuche in Google Scholar
Rupert, P. , & Zanella, G. (2018). Grandchildren and their grandparents’ labour supply. Journal of Public Economics, 159, 89–103. 10.1016/j.jpubeco.2017.12.013Suche in Google Scholar
Sánchez-Mangas, R. , & Sánchez-Marcos, V. (2008). Balancing family and work: The effect of cash benefits for working mothers. Labour Economics, 15(6), 1127–1142. 10.1016/j.labeco.2007.10.002Suche in Google Scholar
Zamarro, G. (2011). Family labour force participation and childcare decisions: The role of grannies. Rand working paper, WR-833 . 10.7249/WR833Suche in Google Scholar
© 2021 Victoria Osuna, published by De Gruyter
This work is licensed under the Creative Commons Attribution 4.0 International License.
Artikel in diesem Heft
- Editorial
- Editorial
- Regular Articles
- Houses as Collateral and Household Debt Deleveraging in Korea
- Methods Used in Economic Research: An Empirical Study of Trends and Levels
- Money for the Issuer: Liability or Equity?
- Corruption Accusations and Bureaucratic Performance: Evidence from Pakistan
- Subsidising Formal Childcare Versus Grandmothers' Time: Which Policy is More Effective?
- The Impact of Foreign Direct Investments on Poverty Reduction in the Western Balkans
- New Issues in International Economics
- Structural Breaks and Explosive Behavior in the Long-Run: The Case of Australian Real House Prices, 1870–2020
- Measuring the Cost of Covid-19 in Terms of the Rise in the Unemployment Rate: The Case of Spain
- Digital Gender Divide and Convergence in the European Union Countries
- Disentangling Permanent and Transitory Monetary Shocks with a Nonlinear Taylor Rule
- The Export Strategy and SMEs Employment Resilience During Slump Periods
- Corruption and International Trade: A Re-assessment with Intra-National Flows
- Fiscal Rules in Economic Crisis: The Trade-off Between Consolidation and Recovery, from a European Perspective