Microstructural evolution and corrosion behaviour of friction stir-processed QE22 magnesium alloy
-
Ankur Kumar


Abstract
Effect of microstructural changes after friction stir processing (FSP) on the corrosion behaviour of rare earth containing QE22 magnesium alloy is studied. FSP produced ultrafine-grained α-Mg matrix and refined the Mg12Nd precipitates whereas Mg12Nd2Ag precipitates got dissolved in the matrix. Although its hardness increased from 76 to 90 VHN, the FSPed alloy displayed inferior corrosion resistance in 3.5 wt% NaCl solution. This is attributed mainly to the iron contamination from FSP and presence of refined second phase particles which work as active cathodic sites. The role of distributed Mg12Nd precipitates before and after FSP is analysed from micro galvanic corrosion point of view.
1 Introduction
Magnesium alloys are promising modern structural metallic materials due to their low density and easy availability (Krauskape et al. 1995; Seifiyan et al. 2019). Also, these show good weldability, damping performance and good castability for high-pressure die-casting. On the other hand, they exhibit some adverse properties such as limited strength, high chemical reactivity, low elastic modulus, poor cold workability, poor corrosion resistance, and limited creep resistance at elevated temperature (Panigrahi et al. 2012). The latter characteristics limit their applications in various fields (Klein et al. 2017). Nevertheless, due to lightweight, they have prospective applications in electronics, transportation, and biomedical fields (Fakhar and Sabbaghian 2021; Witte 2010). Researchers have been trying for several decades to enhance the mechanical properties along with corrosion resistance to widen their applications.
Grain refinement is one of the effective strengthening mechanisms to enhance the mechanical properties of magnesium alloys. Ultrafine-grained (UFG) material with better strength can be obtained by severe plastic deformation (SPD) methods. In several commercial magnesium alloys, such as AMXX, AZXX, and ZKXX, refined microstructures have been obtained through various SPD techniques such as equal channel angular pressing (ECAP), accumulated roll bonding, differential speed rolling (DSR), etc. (Agnew 2012; Sahoo et al. 2018). However, these UFG microstructures exhibit (i) absence of Zener pinning effect of second phase particles which leads to thermal instability at higher temperature, and (ii) combined effect of strong crystallographic orientation (texture) along the processing direction and grain boundary strengthening leads to better strength but poor ductility at room temperature (Yuan et al. 2011). Due to this, the use of SPD techniques for traditional magnesium alloys is not very effective. It is observed that alloying with rare-earth (RE) elements such as Gd, Nd, and Y is one of the promising ways of texture randomization and increasing the strength from grain refinement that is retained even at elevated temperatures due to the presence of thermally stable precipitates along the grain boundaries (Stanford 2010; Tekumalla et al. 2015). Therefore, superior strength along with good ductility is obtained from the combined effect of grain refinement along with texture modification, which is possible with the help of alloy design and use of suitable SPD process. This was observed in the two-pass friction stir-processed (FSPed) QE22 alloy that showed good strength along with better ductility at room temperature (Khan and Karthik 2019). Although improved mechanical properties result from SPD processing, it is of practical interest to investigate the corrosion resistance of such UFG magnesium alloys.
It has been observed that the corrosion behaviour of magnesium alloys is closely related to grain size (Chen et al. 2015). Corrosion rates and pitting susceptibility of alloys of magnesium, titanium, and aluminium can be altered by microstructural modifications resulting from deformation processing (Liu et al. 2020; Ralston and Birbilis 2010). Hoog and co-workers reported superior corrosion resistance in pure magnesium after SPD through ECAP (Hoog et al. 2008; Liu et al. 2020). Such improvements are also reported for AZ31 and AZ80 alloys after grain refinement (Zhimin et al. 2010). The grain boundaries of AZ31B alloy presented a barrier to corrosion in aqueous solutions (Liu et al. 2021; Song and Atrens 1999). Kim reported that corrosion resistance in AZ61 magnesium alloy improved after processing by high-ratio DSR (Kim and Kim 2013). However, in some other studies on magnesium alloys, an opposite effect has been observed. Pu and Song observed lower corrosion resistance in a severely deformed magnesium alloy in aqueous solutions (Mehrian et al. 2021; Pu et al. 2011). Thus, besides the grain size, corrosion resistance of magnesium alloys is also influenced by various factors such as alloying elements, distribution of second phases, dislocation density and residual stress after SPD. For example, higher residual compressive stress after deep rolling process improved the corrosion resistance of a magnesium–calcium alloy (Chen et al. 1998; Seong et al. 2015).
FSP is an effective SPD technique for the modification of surface microstructure of RE containing magnesium alloys. However, limited attention is given to studying its electrochemical behaviour after SPD processing. Khan and Panigrahi recently used FSP to obtain refined microstructure in QE22 alloy containing nanoscale particles of Mg12Nd phase (Khan and Panigrahi 2016). This QE22 alloy has huge scope in automotive and aircraft industries such as in engine casing, rotor head and wheels in the helicopters (Khan and Panigrahi 2015). Although the microstructural refinements from FSP resulted in an improvement in mechanical properties due to thermally stable Mg12Nd precipitates, the influence of RE elements on the corrosion behaviour is a subject of investigation. Therefore, the present work studies the effect of microstructural modifications obtained from FSP on the corrosion behaviour of UFG QE22 alloy.
2 Materials and methods
Chemical composition of cast QE22 alloy was determined using a Bruker s4 Pioneer wavelength dispersive X-ray fluorescence spectrometer (WDXRF). Its composition is shown in Table 1. FSP was performed with a customized taper-threaded tool using rpm of 800 in the first pass followed by 600 rpm in the second pass, at a constant feed rate of 100 mm/min. The shoulder diameter of H13 steel FSP tool was 12 mm. After FSP, iron impurity concentration as determined from WDXRF was 0.036 wt%. This contamination resulted from the use of H13 steel tool for FSP.
Chemical composition of QE22 alloy before FSP.
| Elements (wt%) | Ag | Nd | Zr | Al | Zn | Mn | Fe | Si | S | Cl | K | Na | Mg |
|---|---|---|---|---|---|---|---|---|---|---|---|---|---|
| Base material | 3.234 | 2.073 | 0.684 | 0.034 | 0.044 | 0.017 | 0.00 | 0.074 | 0.01 | 0.089 | 0.039 | 0.039 | 93.663 |
Microstructures were examined using Leica DMI5000 M optical microscope, JEOL 3200FS transmission electron microscope (TEM), and FEI-Quanta 200 scanning electron microscope (SEM) equipped with electron backscatter diffraction (EBSD) facility. For optical microscopy, diamond polishing was done after polishing with different grit size silicon carbide papers. Etching was done using a solution of 10 ml distilled water, 4.2 g picric acid, 10 ml acetic acid, and 70 ml ethanol. Grain size was measured using the linear intercept method according to ASTM E 112-96. For TEM, slow speed diamond cutter was used to obtain thin sheets of FSPed and as-received QE22 alloy that were polished down to 100 μm thickness, followed by dimpling and ion milling. EBSD specimens were sampled from the top surface of the FSPed zone and were polished with colloidal silica. An Omnitech Vickers microhardness tester was used to measure the hardness.
Potentiodynamic polarization, immersion tests, and electrochemical impedance spectroscopy (EIS) were performed in 3.5 wt% NaCl solution at room temperature. The samples for corrosion tests were diamond polished down to 1 µm surface finish. The samples were cleaned and ultra-sonicated with ethanol before testing. Corrosion tests were performed on the top surface of nugget region on FSPed samples. A Gamry Interface 1000 potentiostat was used. Saturated calomel electrode (SCE) and graphite were used as reference and counter electrode, respectively. Open circuit potential (OCP) tests were performed up to 48 h for stabilization at a sampling rate of 0.5 s−1 followed by potentiodynamic polarization tests. For potentiodynamic polarization tests, the scanning range of potential was −250 to 250 mV vs OCP with a scan rate of 0.5 mV/s. To confirm the repeatability, tests were repeated at least three times. EIS was performed using a 10 mV AC signal in the frequency range of 10 kHz to 10 mHz. EIS was done on samples with three different exposure conditions: unexposed, after 6 h, and 24 h of immersion in 3.5 wt% NaCl solution.
Weight loss was measured after different exposure durations of 1 h, 24 h, and 72 h in immersion tests. Before immersion testing, the samples were polished using up to 600 grit size emery paper, cleaned with ethanol and then weighed. A PHI 5000 VersaProbe III X-ray photoelectron spectroscope (XPS) was used to determine the chemistry of the surface film after 24 h of immersion test.
After immersion tests, a Rigaku SmartLab® X-ray diffractometer (XRD) was used in order to identify the phases present in the corrosion products. Exposed surfaces were directly analysed without removal of corrosion products. Later, corrosion products were removed by using the chromic acid solution (10 g Cr2O3, 1 g AgNO3 in 400 ml distilled water). This was followed by washing with distilled water and drying after which the mass loss was measured. A Zeiss EVO18 SEM was used to study the corroded surface morphology.
3 Results
3.1 Microstructural evolution
Figures 1A and 1B show the optical and SEM microstructures respectively of as-received QE22 alloy whose average grain size is 42 ± 13 µm. Figure 1B also shows the composition obtained from EDS of Mg12Nd precipitates present along the grain boundaries and triple junctions in α-Mg matrix. The average size of Mg12Nd precipitates before (Figure 1B) and after FSP (Figure 1C) measured using ImageJ software is 8 ± 3.2 µm and 0.6 ± 0.02 µm respectively. Thus, the size of Mg12Nd phase decreased significantly after FSP. Figure 1C shows that the morphology of Mg12Nd precipitates changed from elongated to globular after FSP. Figure 1D shows the inverse pole figure map of FSPed sample that shows the average grain size of 0.8 ± 0.46 µm. Figure 1E shows a TEM micrograph of the as-received sample. It has a uniform net-like distribution of Mg12Nd2Ag precipitate. TEM micrograph of the FSPed sample in Figure 1F shows that Mg12Nd2Ag precipitate has dissolved after the FSP process.

(A) Optical micrograph of as received QE22 alloy showing equiaxed microstructure. SEM micrographs of (B) as received alloy with EDS spectrum of the precipitate, (C) FSPed QE22 alloy, (D) EBSD image of two pass FSPed nugget region, TEM micrographs of (E) as-received, and (F) FSPed alloy of QE22 magnesium alloy.
3.2 Mechanical properties
Figure 2A shows the variation in microhardness across the FSPed zone. Microhardness of the as-received sample is 76 VHN, whereas in the FSPed zone it increased up to 90 VHN. The nugget region showed greater hardness due to the increasing number of grain boundaries resulting from grain refinement that is responsible for restricting the movement of dislocations. A uniform distribution of finer precipitates (Mg12Nd) is also responsible for an increase in the hardness of the nugget region. Figure 2B shows XRD patterns of both as received and FSPed samples. All the peaks correspond to α-Mg matrix phase and precipitates are not detected. Inset highlights the shifting of the peaks to higher angles after FSP. This is likely to be due to the presence of macroscopic residual stress.
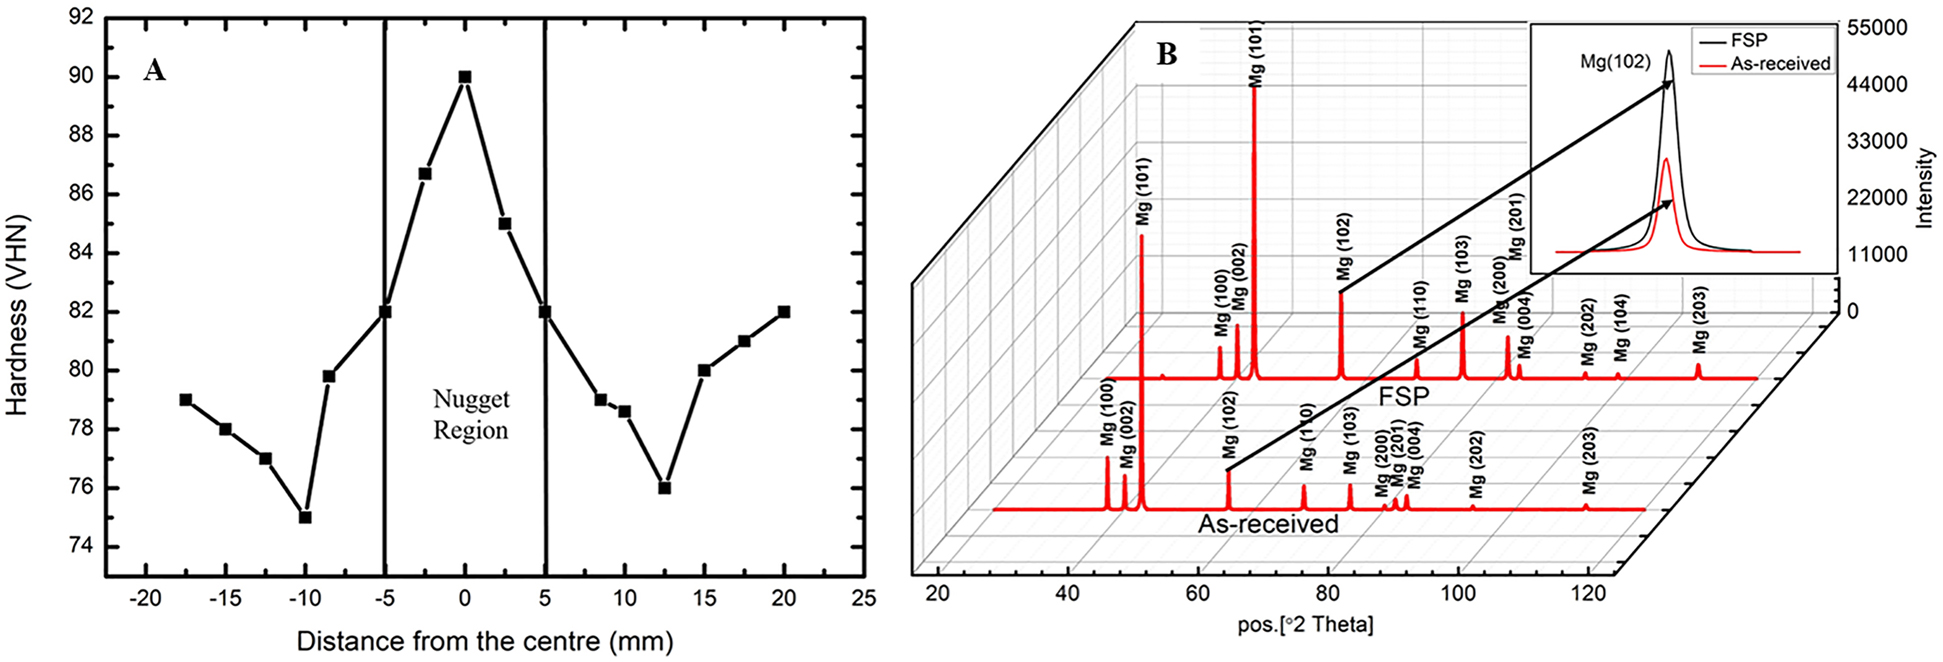
(A) Variation of microhardness across the nugget zone, (B) XRD pattern of as-received and FSPed QE22 alloy.
3.3 Polarization measurements
Potentiodynamic polarization tests measure the instantaneous corrosion rate with non-steady-state condition, whereas immersion tests measure it considering the overall exposure (Shi et al. 2010). Therefore, in the present work, the specimens were immersed in 3.5 wt% NaCl solution up to 48 h in order to reach the steady-state condition followed by potentiodynamic polarization tests. Figure 3 shows the potentiodynamic polarization curves of both as received and FSPed QE22 alloy samples. The results from potentiodynamic polarization tests show that the corrosion potential of FSPed sample is −1604 ± 27 mV vs SCE which is active than that of the as-received sample (−1552 ± 21 mV vs SCE). In Figure 3, βc is greater than βa implying that cathodic reactions limit the corrosion rate in both the samples. The corrosion current density, icorr, is 33 ± 0.03 μA/cm2 (0.75 mm/year) for the FSPed sample which is more as compared to 10 ± 0.05 μA/cm2 (0.23 mm/year) for the as-received sample. Thus, the SPD processing increased the corrosion rate of this alloy.
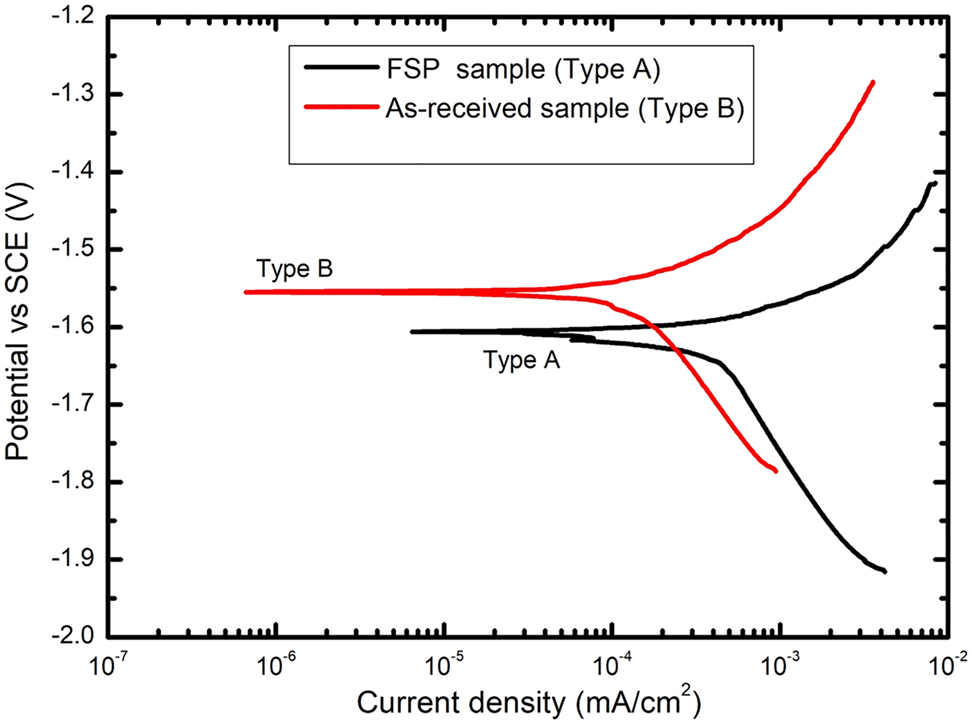
Potentiodynamic polarization curves of QE22 alloy in 3.5 wt% NaCl solution.
3.4 Immersion test
The normalized weight loss obtained after immersion tests is shown in Figure 4A. During 1 h, 24 and 72 h immersion tests, the as-received QE22 sample exhibited weight loss that is 0.022 g/cm2 (1133 mm/y), 0.011 g/cm2 (25 mm/y), and 0.039 g/cm2 (28 mm/y) lower than the respective FSPed samples. The XRD analysis of Figure 4B shows that the corrosion product mainly consists of Mg(OH)2. Exactly similar XRD pattern was obtained for the corrosion products present on the as-received alloy. After 72 h of immersion testing, pH of the solution increased from 7 to 9.2 from the dissolution of Mg(OH)2, although the solubility of Mg(OH)2 decreases with increase in the value of pH (Bahmani et al. 2021; Song et al. 2004). Figures 4C–H show the SEM images of cleaned alloy samples after immersion tests that highlight significant differences in their surface morphology. It is interesting to note that as-received QE22 alloy samples for any given exposure reveal a relatively smoother surface as compared to respective FSPed samples that show a rougher surface. Fewer macroscopic pits could be observed on the exposed surface of as-received sample after 1 h immersion test, which shows that it corroded less. After 24 and 72 h immersion tests, the pits appear to have merged and converted into uniform corrosion. There was a large amount of corrosion product formed on the surfaces after 24 and 72 h immersion tests.

SEM micrographs of QE22 alloy: (A) as-received sample after immersion for 1 h, (B) FSPed sample after immersion for 1 h, (C) as-received sample after immersion of 24 h, (D) FSPed sample after immersion of 24 h, (E) as-received alloy after immersion of 72 h and (F) FSPed alloy after immersion of 72 h (G) weight loss of 1 h, 24 h, and 72 h immersion tests, for as-received and FSPed QE22 alloy samples (H) XRD patterns of corrosion products on the surface of FSPed QE22 alloy sample after 72 h immersion test.
3.5 Surface characterization
XPS was performed in order to determine the chemical state of elements on the corroded surface of as received and FSPed QE22 alloy samples. Figure 5 shows the XPS spectra obtained from the specimens after immersion for 24 h in 3.5 wt% NaCl. The survey curve in Figure 5A shows a small peak of iron (circled) on the surface of the stirred zone in the FSPed specimen. It also shows a peak for Ag at about 390 eV. Intensity of peaks of oxidized species in FSPed QE22 sample is more as compared to that in the as-received sample. Magnesium exists in Mg2+ state, and along with oxygen in the form of Mg(OH)2 with a very strong signal of the later. Element silver exists as Ag2O and zirconium is in the form of ZrO2. Neodymium is present in the form of Nd2O3. Carbon is present in the form of CO32− and C–C/C–H state. C1s peaks indicate a small amount of carbonate present on the specimen surface. It exists due to the surface contamination during the cleaning of the XPS specimen (Liu et al. 2017). Although in Figure 5F the peak exists in a specific energy band, a clear peak is not observed due to nobler behaviour of silver metal as compared to other alloying elements that possibly resulted in less concentration of silver oxide.

High resolution XPS spectra of corrosion products on the surfaces of as-received and FSPed QE22 alloy samples after exposure to 3.5 wt% NaCl solution for 24 h: (A) survey scan, (B) Mg2s, (C) O1, (D) Zr3d, (E) Nd3d5, and (F) Ag3d spectra.
3.6 EIS measurements
Figure 6 shows the Nyquist plots of as-received and FSPed samples after immersion in 3.5 wt% NaCl solution for different time intervals in order to detect the change in electrochemical characteristics. The Nyquist plots reveal high and medium frequency capacitive loops and a low-frequency inductive loop. The diameter of high-frequency capacitive loop indicates that the charge transfer resistance of FSPed QE22 alloy sample is smaller than that of the corresponding as-received sample (Cao 1990a,b; Morlidge et al. 1999). The diameter of capacitive arc decreased continuously with immersion time in both the specimens indicating a gradual weakening of corrosion resistance with exposure time. This is also observed in the immersion tests. Medium frequency loop is associated with the mass transfer i.e. diffusion of ions through oxide and hydroxide film (Mohamed et al. 2020). Polarization resistance is a combination of diameter of both the capacitive loops (Zhao et al. 2017). Whereas, inductive loop is related to the broken area of the partially protective surface film for anodically polarised QE22 alloy. It also indicates the pitting susceptibility of the sample surfaces (Jayaraj et al. 2016).

Nyquist plots of (A) as-received, and (B) FSPed QE22 alloy samples immersed in 3.5 wt% NaCl solution for various durations.
4 Discussion
It has been observed that corrosion resistance is associated with grain size (Peral et al. 2020). Copper, titanium, pure aluminium, and some magnesium alloys show improved corrosion resistance after grain refinement (Kim and Kim 2013; Vaughan et al. 2020). However, in the present work, FSPed QE22 alloy showed inferior corrosion resistance in aqueous solution with its icorr value being higher as compared to the as-received sample. Immersion tests also revealed higher weight loss in FSPed QE22 alloy samples as compared to as-received QE22 alloy samples as shown in Figure 4A.
EIS tests confirmed the decrease in corrosion resistance of FSPed samples from their lower charge transfer resistance. Figure 6B inset shows the electrical equivalent circuit after fitting experimental impedance data of as-received and FSPed QE22 samples. Table 2 summarizes the values of elements of equivalent circuit. R1 is the electrolyte resistance, R2 is the resistance of the partially protective film of Mg(OH)2 which is also detected in the XPS scan. Value of R2 is smaller for FSPed sample as compared to as-received sample and it decreases continuously with immersion time indicating a gradual decrease in protective ability of Mg(OH)2. The value of R3, which represents the polarization resistance, is higher for as-received QE22 sample as compared to FSPed QE22 sample for all immersion periods, which implies that the as-received QE22 sample has better corrosion resistance. C1 represents capacitance of the corrosion product. R4 and L indicate the resistance and inductance resulting from absorbed species in the partially protective film. The value of inductance increased with immersion time indicating that the number of pits increased leading to higher surface roughness that is observed in the SEM images of Figure 4. The constant phase element (CPE) is associated with the non-uniform current distribution or inhomogeneous reaction occurring in the corrosion reaction area (Gravian et al. 2017). The CPE can be calculated with the help of the following formula.
where, Q is the CPE, and n can vary from 0 to one depending on the rotation angle of the capacitive loop in the Nyquist plots. If n = 1, the CPE behaves like an ideal capacitor and for n = 0 it behaves like a resistor. From the fitted equivalent electrical circuit shown in Figure 6, the value of n lies between 0.8 and 0.9, which indicates the dominant capacitive behaviour of CPE.
Results of EIS showing equivalent circuit fitting elements for QE22 alloy for different immersion conditions.
| QE22 alloy condition | Equivalent circuit element | Immersion time (h) | ||||
|---|---|---|---|---|---|---|
| 0 | 6 | 24 | 48 | ±Error | ||
| As-received | R 1 (Ohm cm2) | 24.53 | 22.33 | 22.65 | 26.24 | 0.2 |
| R 2 (Ohm cm2) | 81.11 | 32.52 | 30.42 | 25.23 | 6.4 × 10⁻⁶ | |
| R 3 (Ohm cm2) | 173.3 | 59.21 | 52.82 | 32.63 | 2.8 | |
| R 4 (Ohm cm2) | 17.50 | 7.230 | 3.215 | 1.57 | 0.12 | |
| L (H) | 1.06 × 10³ | 3.312 × 10³ | 4.58 × 10³ | 4.58 × 10³ | 8.96 | |
| C 1 (F cm−2) | 14.66 × 10⁻³ | 10.20 × 10⁻³ | 23.90 × 10⁻³ | 26.90 × 10⁻³ | 6 × 10⁻⁹ | |
| Q 1 (Ω−1 cm−2 s−n) | 387.5 × 10⁻⁶ | 211.3 × 10⁻⁶ | 194.6 × 10⁻⁶ | 160.6 × 10⁻⁶ | 16 × 10−6 | |
| FSPed | R 1 (Ohm cm2) | 24.76 | 21.46 | 22.26 | 22.37 | 0.2 |
| R 2 (Ohm cm2) | 51.08 | 34.72 | 26.69 | 12.22 | 2.16 | |
| R 3 (Ohm cm2) | 74.30 | 60.99 | 40.93 | 15.40 | 1.2 | |
| R 4 (Ohm cm2) | 2.230 | 1.99 | 1.33 | 1.13 | 0.13 | |
| L (H) | 120.7 | 214.6 | 355 | 423.5 | 26.1 | |
| C 1 (F cm−2) | 11.26 × 10⁻³ | 17.78 × 10⁻³ | 24.72 × 10⁻³ | 29.23 × 10⁻³ | 0.02 | |
| Q 1 (Ω−1 cm−2 s−n) | 360.2 × 10⁻⁶ | 185.4 × 10⁻⁶ | 219.4 × 10⁻⁶ | 47.9 × 10⁻⁶ | 8 × 10⁻⁶ | |
Comparison of corrosion rates obtained from the potentiodynamic polarization tests, immersion tests, and EIS tests reveal similar corrosion rate trends. Corrosion behaviour of QE22 alloy can be explained by considering the relevant reactions. The anodic reaction occurring during the corrosion is Mg → Mg2+ + 2e−. The cathodic reaction is 2H2O + 2e− → H2 + 2OH− and magnesium hydroxide is formed as per the reaction, Mg2+ + 2OH− → Mg(OH)2.
In a study on the corrosion of ECAP-processed pure magnesium, it was observed that the characteristics of Mg(OH)2 product determine the initial OCP and Ecorr values in aqueous solutions (Zhu et al. 2021). Mg(OH)2 layer is porous and does not offer an effective barrier to the chloride ions and water molecules (Tie et al. 2014). In the RE containing magnesium alloys, the second phase particles have been reported to exhibit a more noble potential than the matrix and are therefore cathodic to the matrix (Hughes et al. 2015; Vinogradov et al. 2008). These precipitates are preferential sites for hydrogen evolution. Because the second phase precipitate size reduced after FSP, the cathodic area increased and therefore a large amount of hydrogen gas would be produced due to enhanced reduction reaction kinetics. This causes severe disruption of the hydroxide layer in FSPed sample than in the as-received QE22 sample, thereby increasing the corrosion rate.
The corrosion resistance of alloy matrix in a precipitation-hardened magnesium alloy depends on the detailed microstructural features such as the area fraction of second phase particles that form micro galvanic cells, the dislocation density, and the grain size (Atrens et al. 2018). Dissolution of metal and the nucleation of oxide film are preferred at the surface crystal defects. Because the FSPed QE22 alloy matrix has larger grain boundary area (Figure 1D), and a higher dislocation density (Figure 1F), it dissolved faster than the un-deformed as-received sample. Similar observation is reported in the case of pure magnesium after ECAP (Song et al. 2010). Additionally, the presence of macro stress (Figure 2B) made the matrix more active leading to accelerated anodic dissolution.
More importantly, it is reported that the type, amount, and distribution of second phase particles and impurities determine the corrosion performance of magnesium alloys (Eliezer et al. 1998; Liu et al. 2018; Song and Xu 2012). In the QE22 alloy studied in this work, there are two types of second phase precipitates-Mg12Nd and net-like distribution of Mg12Nd2Ag in the as-received specimen. The net-like distribution of Mg12Nd2Ag precipitates in magnesium matrix could affect the corrosion behaviour of as-received specimen. In the Mg–Al alloys, it is reported that the continuous distribution of finer β phase in magnesium matrix has opposite effect in that instead of micro galvanic corrosion it works as a barrier for corrosion propagation (Zeng et al. 2006). Similarly, other workers reported that fine and homogenous distribution of β phase in magnesium matrix produces aluminium rich dense and inert barrier layer at the Mg/corrosion product interface (Taheri et al. 2012). The inert aluminium rich denser layer mainly consists of abundant amount of β phase. Similarly, in the present study, the superior corrosion behaviour of as-received specimen could be due to silver and Nd-rich inert denser layer at the interface of Mg/corrosion product. This would be absent in FSPed sample due to dissolution of Mg12Nd2Ag precipitates.
Additionally, is has been reported that FSP performed using steel tools introduce Fe as a major impurity in magnesium alloys (Liu et al. 2018). From the WDXRF, it is found that the iron pick-up in the QE22 alloy after FSP is 0.036 wt%. It is of significance that the survey curve of XPS in Figure 5A shows a small additional peak of iron in FSPed specimen. Thus, it is evident that FSP introduced Fe in the surface which served as an impurity. Fe is cathodic to magnesium and therefore, it is apparent that FSP has produced a large number of micro-galvanic couples with cathodic iron impurity particles and refined Mg12Nd precipitates that accelerated the corrosion after FSP.
Based on the distribution of second phase particles as seen in the TEM and SEM micrographs, the WDXRF analysis, and the XPS analysis of corrosion product, the corrosion behaviour of QE22 alloy can be modelled as shown in Figure 7. Figure 7A shows a coarse-grained magnesium matrix that has low dislocation density and uniform distribution of noble Mg12Nd2Ag precipitates in the as received alloy. A small fraction of Mg12Nd precipitates also exists along the grain boundaries. After FSP (Figure 7B), the average grain size of α-Mg matrix decreased from 42 to 0.8 μm i.e. there is a large increase in the active grain boundary area. Furthermore, it can be seen from the TEM micrographs of Figure 1F that the dislocation concentration increased after FSP. Thus, increased stored energy in the severely deformed material made it more active. Accompanied with this, FSP refined the nobler Mg12Nd precipitates and Mg12Nd2Ag are dissolved, which can be observed in the microstructure. Due to the refinement of Mg12Nd precipitates, the number of Mg12Nd/Mg micro-galvanic cells again increased. Additionally, contamination of the alloy surface by Fe particles as evident in Figure 5A also contributed to micro galvanic corrosion. Thus, increased rate of corrosion in FSPed sample can be explained based on the dominating effect of increased micro galvanic corrosion from refined precipitates and the introduction of Fe impurity during FSP. Increased grain boundary area as compared to the as-received sample, evident from the grain size estimation from EBSD micrographs, increased number of dislocations from FSP, and presence of macro stress as demonstrated from the XRD study have aided the dissolution after FSP.
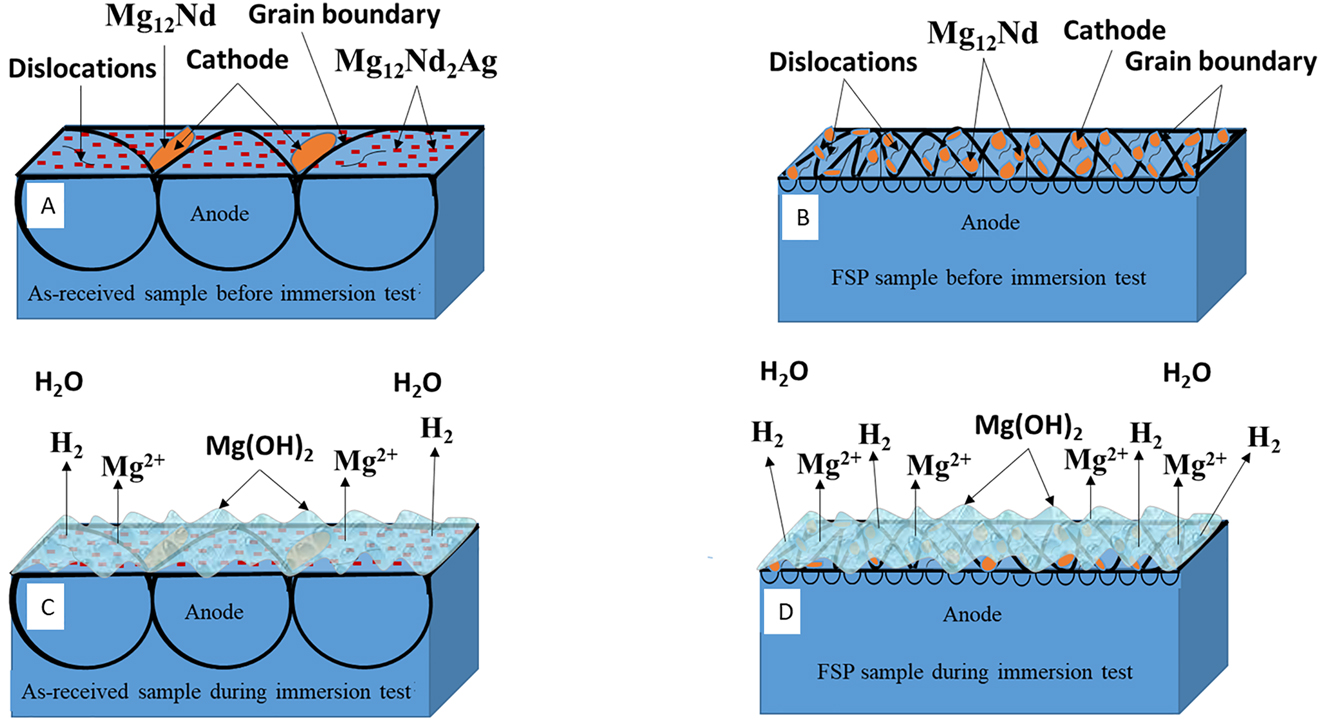
Schematic diagram of corrosion mechanism: (A) distribution of precipitates in as-received QE22 alloy before immersion test, (B) distribution of precipitates in FSPed alloy before immersion test, (C) as-received alloy exposed to 3.5 wt% NaCl solution, and (D) FSPed alloy exposed to 3.5 wt% NaCl solution.
5 Conclusions
The effect of microstructural features arising after friction stir processing of QE22 magnesium alloy on its corrosion behaviour is studied. Important results are summarized below.
After FSP, the corrosion rate of QE22 alloy significantly increased by almost three times. The increase is mainly attributed to enhanced micro galvanic corrosion occurring from the refinement of cathodic Mg12Nd precipitates and introduction of 0.036 wt% of cathodic Fe impurity into the surface during friction stir processing.
The grain size of QE22 alloy decreased by over an order of magnitude. Although there is about 20% increase in hardness of FSPed material, its uniform corrosion rate is adversely affected. This is evident from higher weight loss after immersion tests, smaller capacitive loop of Nyquist plot observed in EIS tests, and larger icorr values in potentiodynamic polarization tests.
The porous layer of Mg(OH)2 formed on the surface of QE22 alloy is less protective in the beginning. The amount of oxidised species is higher in FSPed QE22 sample as evident from enhanced intensities of oxides and hydroxides observed in the XPS results. A large amount of hydrogen gas would be produced due to faster reaction kinetics, therefore, severe breakdown of the oxide layer happened in FSPed sample than in as received QE22 alloy.
-
Author contribution: All the authors have accepted responsibility for the entire content of this submitted manuscript and approved submission.
-
Research funding: None declared.
-
Conflicts of interest: The authors declare that they have no conflicts of interest regarding this article.
References
Agnew, S.R. (2012). Advances in wrought magnesium alloys. Cambridge: Woodhead Publishing Limited.Suche in Google Scholar
Atrens, A., Johnston, S., Shi, Z., and Dargusch, M.S. (2018). Viewpoint - understanding Mg corrosion in the body for biodegradable medical implants. Scripta Mater. 154: 92–100, https://doi.org/10.1016/j.scriptamat.2018.05.021.Suche in Google Scholar
Bahmani, A., Arthanari, S., and Shin, K.S. (2021). Achieving a high corrosion resistant and high strength magnesium alloy using multi directional forging. J. Alloys Compd. 856: 158077, https://doi.org/10.1016/j.jallcom.2020.158077.Suche in Google Scholar
Cao, C. (1990a). On the impedance plane displays for irreversible electrode based on the stability conditions of the steady-state: I. One state variable besides electrode potential. Electrochim. Acta 35: 831–836. https://doi.org/10.1016/0013-4686(90)90077-d.Suche in Google Scholar
Cao, C. (1990b). On the impedance plane displays for irreversible electrode reactions based on the stability conditions of the steady-state: II. Two state variables besides electrode potential. Electrochim. Acta 35: 837–844. https://doi.org/10.1016/0013-4686(90)90078-e.Suche in Google Scholar
Chen, W.M., Cheng, F.T., Leung, L.K., Horylev, R.J., and Yue, T.M. (1998). Corrosion behaviour of magnesium alloy AZ91 and its MMC in NaCl solution. Corrosion Rev. 16: 43–52.10.1515/CORRREV.1998.16.1-2.43Suche in Google Scholar
Chen, K., Dai, J., and Zhang, X. (2015). Improvement of corrosion resistance of magnesium alloys for biomedical applications. Corrosion Rev. 33: 101–117, https://doi.org/10.1515/corrrev-2015-0007.Suche in Google Scholar
Eliezer, A., Gutman, E.M., Abramov, E., and Aghion, E. (1998). Corrosion fatigue and mechanochemical behavior of magnesium alloy. Corrosion Rev. 16: 1–26, https://doi.org/10.1515/corrrev.1998.16.1-2.1.Suche in Google Scholar
Fakhar, N. and Sabbaghian, M. (2021). A good combination of ductility, strength, and corrosion resistance of fine-grained ZK60 magnesium alloy produced by repeated upsetting process for biodegradable applications. J. Alloys Compd. 862: 158334, https://doi.org/10.1016/j.jallcom.2020.158334.Suche in Google Scholar
Gravian, R., Peberea, N., Laurino, A., and Blanc, C. (2017). Corrosion behaviour of an assembly between an AA1370 cable and a pure copper connector for car manufacturing applications. Corrosion Sci. 119: 79–90.10.1016/j.corsci.2017.02.022Suche in Google Scholar
Hoog, C., Birbilis, N., and Estrin, Y. (2008). Corrosion of pure Mg as a function of grain size and processing route. Adv. Eng. Mater. 10: 579–582.10.1002/adem.200800046Suche in Google Scholar
Hughes, A.E., Parvizi, R., and Forsyth, M. (2015). Microstructure and corrosion of AA2024. Corrosion Rev. 33: 1–30, https://doi.org/10.1515/corrrev-2014-0039.Suche in Google Scholar
Jayaraj, J., Amruth, S., Srinivasan, A., Ananthakumar, S., Pillai, U.T.S., Dhaipule, N.G.K., and Mudali, U.K. (2016). Composite magnesium phosphate coatings for improved corrosion resistance of magnesium AZ31 alloy. Corrosion Sci. 113: 104–115https://doi.org/10.1016/j.corsci.2016.10.010.Suche in Google Scholar
Khan, F. and Karthik, G.M. (2019). Friction stir process of QE22 magnesium alloy to achieve ultrafined grained microstructure with enhanced room temperature ductility and texture weakening. Mater. Char. 147: 365–378.10.1016/j.matchar.2018.11.020Suche in Google Scholar
Khan, F. and Panigrahi, S.K. (2015). Age hardening, fracture behaviour and mechanical properties of QE22 Mg alloy. J. Magnesium Alloys 3: 210–217.10.1016/j.jma.2015.08.002Suche in Google Scholar
Khan, F. and Panigrahi, S.K. (2016). Achieving excellent thermal stability and very high activation energy in an ultrafine-grained Magnesium silver rare earth alloy prepared by friction stir processing. Mater. Sci. Eng. 33: 338–344.10.1016/j.msea.2016.08.077Suche in Google Scholar
Kim, H.S. and Kim, W.J. (2013). Enhanced corrosion resistance of ultrafined grained AZ61 alloy containing very fine particles of Mg17 Al12 phase. Corrosion Sci. 75: 228–238, https://doi.org/10.1016/j.corsci.2013.05.032.Suche in Google Scholar
Klein, M., Frieling, G., and Walther, F. (2017). Corrosion fatigue assistance of creep-resistant magnesium alloy Die Mg 422 and AE42. Eng. Fract. Mech. 185: 33–45, https://doi.org/10.1016/j.engfracmech.2017.02.024.Suche in Google Scholar
Krauskape, K.B. and Bird, D.K. (1995). Introduction to geochemistry. New York: McGraw-Hill.Suche in Google Scholar
Liu, F., Ji, Y., Sun, Z., Liu, J., Bai, Y., and Shen, Z. (2020). Enhancing corrosion resistance and mechanical properties of AZ31 magnesium alloy by friction stir processing with the same speed ratio. J. Alloys Compd. 829: 154452, https://doi.org/10.1016/j.jallcom.2020.154452.Suche in Google Scholar
Liu, Q., Chen, G.Q., Zeng, S.B., Zhang, S., Long, F., and Shi, Q.Y. (2021). The corrosion behaviour of Mg-9Al-xRE magnesium alloys modified by friction stir processing. J. Alloys Compd. 851: 156835, https://doi.org/10.1016/j.jallcom.2020.156835.Suche in Google Scholar
Liu, Q., Ma, Q.X., and Chen, G.Q. (2018). Enhanced corrosion resistance of AZ91 magnesium alloy through refinement and homogenization of surface microstructure by friction stir processing. Corrosion Sci. 138: 284–296, https://doi.org/10.1016/j.corsci.2018.04.028.Suche in Google Scholar
Liu, Z., Zhu, Y., Liu, X., Yeung, K.W., and Wu, S. (2017). Construction of poly(vinylalcohol)/poly(lactide-glycolide acid)/vancomy in nanoparticles on titanium for enhancing the surface self-antibacterial activity and cytocompatibility. Colloids Surf. B Biointerfaces 151: 165–177, https://doi.org/10.1016/j.colsurfb.2016.12.016.Suche in Google Scholar PubMed
Mehrian, S.S.M., Rahsepar, M., Khodabakhshi, F., and Gerlich, A.P. (2021). Effects of friction stir processing on the microstructure, mechanical and corrosion behaviours of an aluminium-magnesium alloy. Surf. Coating. Technol. 405: 126647, https://doi.org/10.1016/j.surfcoat.2020.126647.Suche in Google Scholar
Mohamed, A., Breitinger, H.G., and El-Aziz, A.M. (2020). Effect of pH on the degradation kinetics of a Mg–0.8 Ca alloy for orthopaedic implants. Corrosion Rev. 38: 489–495, https://doi.org/10.1515/corrrev-2020-0008.Suche in Google Scholar
Morlidge, J.R., Skeldon, P., Thompson, G.E., Habazaki, H., Shimizu, K., and Wood, G.C. (1999). Gel formation and the efficiency of anodic film growth on aluminium. Electrochim. Acta 44: 2423–2435, https://doi.org/10.1016/s0013-4686(98)00363-6.Suche in Google Scholar
Panigrahi, S.K., Yuan, W., Mishra, R.S., Delorme, R., Davis, B., Howell, R.A., and Cho, K. (2012). Transition of deformation behaviour in an ultrafine grained magnesium alloy. Mater. Sci. Eng. 549: 123, https://doi.org/10.1016/j.msea.2012.04.017.Suche in Google Scholar
Peral, L.B., Zafra, A., Bagherifard, S., Guagliano, M., and Pariente, I.F. (2020). Effect of warm shot peening treatments on surface properties and corrosion behaviour of AZ31 magnesium alloy. Surf. Coating. Technol. 401: 126285, https://doi.org/10.1016/j.surfcoat.2020.126285.Suche in Google Scholar
Pu, Z., Yang, S., Song, G.L., and Dillan, O.W. (2011). Ultrafine grain surface layer of Mg-Al-Zn alloy produced by cryogenic burnishing for enhanced corrosion resistance. Scripta Mater. 65: 520–523, https://doi.org/10.1016/j.scriptamat.2011.06.013.Suche in Google Scholar
Ralston, K.D. and Birbilis, N. (2010). Effect of grain size on corrosion: a Review. Corrosion 66: 5–13, https://doi.org/10.5006/1.3462912.Suche in Google Scholar
Sahoo, B.N. and Panigrahi, S.K. (2018). A study on the combined effect of in-situ (TiC-TiB) reinforcement and aging treatment on the yield asymmetry of magnesium matrix composite. J. Alloys Compd. 773: 575–589, https://doi.org/10.1016/j.jallcom.2017.12.027.Suche in Google Scholar
Seifiyan, H., Sohi, M.H., Ansari, M., Ahmadkhaniha, D., and Saremi, M. (2019). Influence of friction stir processing conditions on corrosion behavior of AZ31B magnesium alloy. J. Magnesium Alloys 7: 605–616, https://doi.org/10.1016/j.jma.2019.11.004.Suche in Google Scholar
Seong, J.W. and Kim, W.J. (2015). Development of biodegradable Mg-Ca alloy sheet with enhanced strength and corrosion properties through the refinement and uniform dispersion of Mg2Ca phase by HRDR. Acta Biomater. 11: 531–542, https://doi.org/10.1016/j.actbio.2014.09.029.Suche in Google Scholar PubMed
Shi, Z., Liu, M., and Atrens, A. (2010). Measurement of the corrosion rate of magnesium alloys using Tafel extrapolation. Corrosion Sci. 52: 579–588, https://doi.org/10.1016/j.corsci.2009.10.016.Suche in Google Scholar
Song, G.L. and Atrens, A. (1999). Corrosion mechanism of magnesium alloys. Adv. Eng. Mater. 1: 11–33. https://doi.org/10.1002/(sici)1527-2648(199909)1:1<11::aid-adem11>3.0.co;2-n.10.1002/(SICI)1527-2648(199909)1:1<11::AID-ADEM11>3.3.CO;2-ESuche in Google Scholar
Song, D., Ma, A.B., Jiang, J.H., Lin, P.H., Yang, D.H., and Fan, J.F. (2010). Corrosion behaviour of equal-channel-angular-pressed pure magnesium in NaCl aqueous solution. Corrosion Sci. 52: 481–490, https://doi.org/10.1016/j.corsci.2009.10.004.Suche in Google Scholar
Song, G.L. and Xu, Z. (2012). Effect of microstructure evolution on corrosion of different crystal surfaces of AZ31 Mg alloy in a chloride containing solution. Corrosion Sci. 54: 97–105, https://doi.org/10.1016/j.corsci.2011.09.005.Suche in Google Scholar
Song, G.L., Bowles, A.L., and Stjohn, H. (2004). Corrosion resistance of aged die cast magnesium alloy AZ91D. Mater. Sci. Eng. 366: 74–86, https://doi.org/10.1016/j.msea.2003.08.060.Suche in Google Scholar
Stanford, N. (2010). Micro-alloying Mg with Y, Ce, Gd and La for texture modification - a comparative study. Mater. Sci. Eng. 527: 2669–2677, https://doi.org/10.1016/j.msea.2009.12.036.Suche in Google Scholar
Taheri, M., Phillips, R.C., Kish, J.R., and Botton, G.A. (2012). Analysis of the surface film formed on Mg by exposure to water using a FIB cross-section and STEM–. Corrosion Sci. 59: 222–228, https://doi.org/10.1016/j.corsci.2012.03.001.Suche in Google Scholar
Tekumalla, S., Seetharaman, S., Almajid, A., and Gupta, M. (2015). Mechanical properties of magnesium-rare earth alloy systems: a review. Metals 1: 1–39.10.3390/met5010001Suche in Google Scholar
Tie, D., Feyerabend, F., Hort, N., and Hoeche, D. (2014). In vitro mechanical and corrosion properties of biodegradable Mg-Ag alloys. Mater. Corros. 65: 569–576, https://doi.org/10.1002/maco.201206903.Suche in Google Scholar
Vaughan, M.W., Karayan, A.I., Srivastava, A., Mansoor, B., Seitz, J.M., Eifler, R., Karaman, I., Castaneda, H., and Maier, H.J. (2020). The effects of severe plastic deformation on the mechanical and corrosion characteristics of a bioresorbable Mg-ZKQX6000 alloy. Mater. Sci. Eng. C 115: 111130, https://doi.org/10.1016/j.msec.2020.111130.Suche in Google Scholar PubMed
Vinogradov, A., Mimaki, T., Hashimoto, S., and Valiev, R. (2008). Corrosion of ultrafine grained copper fabricated by ECAP. Corrosion Sci. 50: 1215–1220.10.1016/j.corsci.2008.01.024Suche in Google Scholar
Witte, F. (2010). The history of biodegradable magnesium implants: a review. Acta Biomater. 6: 1680–1692, https://doi.org/10.1016/j.actbio.2010.02.028.Suche in Google Scholar PubMed
Yuan, W., Panigrahi, S.K., Su, J.Q., and Mishra, R.S. (2011). Influence of grain size and texture on Hall–Petch relationship for a magnesium alloy. Scripta Mater. 650: 994–997, https://doi.org/10.1016/j.scriptamat.2011.08.028.Suche in Google Scholar
Zeng, R., Zhang, J., Huang, W., Dietzel, W., Kainer, K.U., Blawert, C., and Ke, W. (2006). Review of studies on corrosion of magnesium alloys. Trans. Nonferrous Metals Soc. China 16: 763–771, https://doi.org/10.1016/s1003-6326(06)60297-5.Suche in Google Scholar
Zhao, J., Xie, X., and Zhang, C. (2017). Effect of the graphene oxide additive on the corrosion resistance of the plasma electrolytic oxidation coating of the AZ31 magnesium alloy. Corrosion Sci. 114: 146–155, https://doi.org/10.1016/j.corsci.2016.11.007.Suche in Google Scholar
Zhimin, Z., Hong-yan, X.U., and Baocheng, L.I. (2010). Corrosion property of plastically deformed AZ80 magnesium alloy. Trans. Nonferrous Met. Soc. China 20: 697.10.1016/S1003-6326(10)60565-1Suche in Google Scholar
Zhu, Y., Song, G.L., Wu, P.P., Zheng, D.J., and Wang, Z.M. (2021). A burnished and Al-alloyed magnesium surface with improved mechanical and corrosion properties. Corrosion Sci. 184: 109395, https://doi.org/10.1016/j.corsci.2021.109395.Suche in Google Scholar
© 2021 Walter de Gruyter GmbH, Berlin/Boston
Artikel in diesem Heft
- Frontmatter
- In this issue
- Reviews
- Ferrous materials degradation: characterisation of rust by colour – an overview
- Recent progress on the corrosion behavior of metallic materials in HF solution
- Original articles
- Study on the corrosion resistance of sulfonated graphene/aluminum phosphate composites in waterborne polyurethane coatings
- Microstructural evolution and corrosion behaviour of friction stir-processed QE22 magnesium alloy
- Preparation and characterization of Nd-doped double-layer silane anticorrosion coating on AZ91D magnesium alloy surface
- Electrolytic accelerated corrosion morphology for structural steel based on an improved solution