Comprehensive performance test and analysis of graphene-enhanced chromium-free Dacromet coating
-
Jiabin Cai
 ,
Xiaojie Shi
,
Xiaojie Shi
 ,
Jian Song
,
Jian Song

Abstract
The proposed work aims to improve the comprehensive properties of the composite coating by adding different content of graphene into the coating solution. Firstly, the formulation of the coating solution was determined by the L16(45) orthogonal test. Secondly, the conventional properties of the coating were tested using the optical microscope and micro-vickers hardness tester. Thirdly, the corrosion resistance of the coating was tested by the rapid ammonium nitrate corrosion test, immersion test, and neutral salt spray test. The changes of the microstructure and composition of the coating before and after corrosion were observed and analyzed using the scanning electron microscope, energy dispersive spectrometer, X-ray diffractometer, and Raman spectrometer, and the Tafel polarization curves and electrochemical impedance spectroscopy of the composite coatings with different graphene contents were tested by electrochemical experiments. The results show that the hardness of the coating increases with the increase in the content of graphene. Graphene intercalates between zinc and aluminum powders in a flaky structure, which reduces the appearance of voids and enhances the protection of chromium-free Dacromet coatings, slows down the penetration of electrolyte solutions and effectively slows down the penetration of corrosive media. The addition of a small amount of graphene can increase the corrosion potential and decrease the corrosion current density of the chromium-free Dacromet coating, the Nyquist low frequency of the coating is higher in the same period and the salt spray resistance of the coating is the best.
1 Introduction
Dacromet coating is a metal surface coating with high corrosion resistance. It has more outstanding advantages than traditional electrogalvanizing and hot-dip galvanizing, such as high corrosion resistance, no hydrogen embrittlement, simple process, etc., but it contains carcinogenic Cr6+, which seriously endangers human health (Xu et al. 2006). To solve this problem, many domestic and foreign scientists have removed the chromium in the Dacromet coating. The chrome-free Dacromet coating uses a passivating agent and no chromic anhydride, which avoids the hazard of Cr6+, but its corrosion resistance is slightly inferior to the traditional Dacromet coating. On this basis, the literature (Fu et al. 2017; Tong et al. 2014) studied the effects of nanoparticles such as zinc oxide and titanium dioxide on the corrosion resistance of chrome-free Dacromet coatings; it can be seen that the addition of some nanoparticles can improve chrome-free Dacromet’s corrosion resistance. As a special two-dimensional nanosheet, graphene has many advantages such as high strength, good thermal stability, excellent barrier properties, and low gas-liquid permeability (Fu et al. 2017; Gergely et al. 2018). Graphene not only is hydrophobic but also has low reactivity, high mechanical strength, and excellent thermal stability. Huh et al. (2014) point out that the passivation mechanism of monolayer graphene coatings follows characteristics of large cathodic reduction barriers against dissolved oxygen and chloride diffusion into underlying Cu in a seawater environment. Jiang et al. (2014) note graphene platelet/nickel (Ni) composite coatings exhibit better corrosion resistance and higher microhardness than the pure Ni coating and note the inherent high mechanical strength of graphene sheets is one of the reasons for the increase in microhardness. Walt et al. (2007) note graphene exhibits exceptional thermal and chemical stability and under an inert environment, it is stable at extremely high temperatures greater than 1500 °C. Chen et al. (2011) note graphene has several other benefits which include high optical transparency (∼2.3% absorption per layer) in the visible region and high electrical and thermal conductivity and it adds only 0.34 nm per layer to the total dimension of the coated metal. Pramoda et al. (2013) point out that the chemical inertness of graphene to oxidizing gas and liquid solutions allows for its use in a wide variety of environments. In recent years, researchers have attempted to add it as an enhanced phase to a conventional protective coating to form a composite coating to enhance the performance of the coating. Liu et al. (2016) added the modified graphene to the epoxy resin, and compared with pure epoxy resin; the tribological and anticorrosive properties of the epoxy with the addition of graphene were significantly improved and epoxy/graphene composite (EGC) membranes at 1 wt% graphene loading shows about 60% reduction in O2 permeability. Chang et al. (2014) prepared the EGC as a hydrophobic coating (HEGC) by nanocasting technology; the results show that the contact angle of water droplets on the sample surface increases from 82 (epoxy surface) to 127 (composite coating), which improves the hydrophobicity of the coating. Ramezanzadeh et al. (2016) synthesized an aminated graphene oxide (FGO) and used epoxy resin composites on a low-carbon steel matrix; its barrier and corrosion protection properties were characterized by the salt spray test and electrochemical impedance spectroscopy (EIS); the results show that adding 0.1 wt.% FGO nanosheet into the epoxy coating can improve the barrier property and the corrosion resistance of the coating, and the results show that adding 0.1 wt.% FGO nanosheets into the epoxy coating can improve the corrosion resistance of the coating by improving the barrier property of the coating, but if the metal sample used in the experiment has uneven surface, the anticorrosion effect is worse than that of the metal sample with a flat surface. Christopher et al. (2015), Mo et al. (2015), and Li et al. (2014) can effectively improve the tribological properties and corrosion resistance of the polyurethane (PU) composite coating by adding functionalized graphene (FG), Christopher et al. (2015) point out that the mechanism of the waterborne PU composite coating with graphene oxide is based on increase in the surface-to-volume ratio of the nanoparticles tending to reduce the porosity of the coating matrix by its spatial arrangements to restrict the diffusion path, leading to enhanced barrier performance of the coating; Mo et al. (2015) fabricated a series of PU composite coatings reinforced with FG and functionalized graphene oxide (FGO). As effective building blocks, FG and FGO enhanced the tribological and anticorrosion comprehensive properties of the PU composite coatings owing to lubrication and barrier properties provided by them, but the addition of FG and FGO above the optimum amount increases the number of cracks in the composite coating, which leads to the decrease in the tribological properties of the composite coating; Li et al. (2014) compared the PU composite coating with 0.4 wt.% graphene content with the pure PU coating and found that the graphene layers were self-aligned parallel to the substrate surfaces, which fully utilized the high surface area of graphene to interact with the electrolyte and prevent the electrolyte from penetration. Zhang Song et al. (2017) studied the effect of the addition of graphene materials such as graphene oxide (Hummers), graphene nanosheets, and graphene dry powder on the properties of waterborne epoxy zinc-rich coatings; the results show that the anticorrosion effect of the coating is obviously improved, and they point out that different amounts of graphene nanoparticles are added to the chromate-free Dacromet solution to enhance the corrosion resistance of the coating, resulting in an graphene-reinforced chromate-free Dacromet coating (called the graphene-reinforced coating below); the L16(45)orthogonal test was designed to determine the initial formulation of the coating and the optimum amount of graphene.
2 Materials and methods
2.1 Pretreatment of the test piece
The metal used in the experiment was 40Cr steel supplied by China Zhongxin Metal Materials Co., Ltd., and its chemical composition is shown in Table 1. It was cut into a plurality of the 40Cr steel of a size of 10 × 10 × 4 mm using a wire cutter.
Chemical composition (mass fraction, %) of 40Cr steel.
| cC | 0.37 ∼ 0.44% |
| Si | 0.17 ∼ 0.37% |
| Mn | 0.5 ∼ 0.8% |
| Cr | 0.8 ∼ 1.1% |
| Ni | ≤0.3% |
| P | ≤0.03% |
| S | ≤0.03% |
| Cu | ≤0.3% |
| Mo | ≤0.10% |
Before coating the chrome-free Dacromet coating, the substrate 40Cr steel must be treated to remove the oil film and rust on the metal surface, ensuring that the surface of the substrate is smooth and flat, having a metallic luster and enhancing the adhesion between the liquid and substrate. The pretreatment of the matrix is as follows:
First, in order to remove the rust, the workpiece is immersed in an industrial rust remover for 30 min, and then the workpiece is cleaned with running water; After grinding and derusting with 100-mesh, 320-mesh, 800-mesh, 2000-mesh and 5000-mesh alumina sandpaper, the workpiece is polished and rinsed with deionized water. Then, the workpiece was immersed in petroleum either, and the oil and small impurities on the surface of the workpiece were removed using a ultrasonic cell grinder; the power of the ultrasonic cell grinder was set at 60%, work for 15 s and paused for 5 s and lasted for 30 min. Finally, after the substrate 40Cr steels are washed with deionized water and washed with anhydrous ethanol, they are dried in cold air and stored in anhydrous ethanol solution for later use.
2.2 Coating solution preparation
The dispensing process is divided into three groups. Because the binder, the protecting agent and the deionized water were stirred on a magnetic stirrer for 5 h at a normal temperature, the silane as a binder was sufficiently hydrolyzed into a transparent liquid which was recorded as group A. The dispersant, the protector, the corrosion inhibitor and the deionized water were stirred on the magnetic stirrer at room temperature until the corrosion inhibitor was completely dissolved; then, the flake zinc powder and aluminum powder are added into the liquid and continued to stir until the powder slurry is completely dispersed evenly; the resulting composite liquid was recorded as group B. After the graphene powder, the dispersing agent and the deionized water were mixed and stirred uniformly, its impurities were removed using a centrifuge, and then, it was ultrasonically dispersed by an ultrasonic cell pulverizer. The resulting composite liquid was recorded as group C. The A, B, and C components are mixed and stirred, and the thickener and defoamer are added into the mixed solution in turn and stirred for 5 h after being fully mixed and homogenized (about 1 h).
The composition of the graphene-reinforced chrome-free Dacromet coating is shown in Table 2, and the surface of the pretreated 40Cr steels is coated with chrome-free Dacromet paint by brushing. Then, the steels are baked at 90 °C for 10 min and next sintered at 280 °C for 25 min; these steels need to be brushed and cured twice in total.
The basic composition and approximate dosage of the coating liquid.
| Component | Ingredient name | Mass percentage (wt. %) |
|---|---|---|
| A | Binder | 6 ∼ 12 |
| Protective agent | 5 ∼ 8 | |
| Deionized water | 14 ∼ 20 | |
| B | Flaky zinc aluminum power | 15 ∼ 25 |
| Dispersant | 5 ∼ 10 | |
| Protective agent | 5 ∼ 8 | |
| Corrosion inhibitor | 1.2 ∼ 1.5 | |
| Deionized water | 14 ∼ 20 | |
| C | Graphene | 0 ∼ 0.36 |
| Dispersant | 0 ∼ 0.36 | |
| Deionized water | 14 ∼ 20 | |
| Remainder | Thickener, defoamer | 1 ∼ 2 |
2.3 Test methods
2.3.1 General performance test method for coatings
The routine performance test of the coating will comply with the GB/T 9286–1998 “cross-cut test of paint and varnish paint film”; the adhesion of the coating was tested using the hundred-grid knife. The hardness of the coating was measured using a DHV-1000z microscopic Vickers hardness tester. The surface and cross-sectional morphology of the coating were observed by scanning electron microscopy (SEM, S-3400N), and the distribution and content of the elements in the coating were observed by energy-dispersive spectrometer (EDS, Apollo). The graphene in the coating is detected using a laser microscopic confocal Raman spectrometer. The composition change of the coating before and after corrosion was detected using an X-ray diffractometer (XRD, X’PertPowder).
2.3.2 Test method for corrosion resistance of coatings
The neutral salt spray test (NSS) was carried out in 3.5% NaCl solution (pH 7) at 35 °C. The corrosion resistance of the chrome-free Dacromet coating was evaluated in accordance with the artificial atmosphere corrosion test—salt spray test GB/T 10125-2012 “Artificial Atmosphere Corrosion Test Salt Spray Test”. In order to eliminate the interference of other factors as much as possible and to ensure a single variable, AB glue was used to seal all but the coating side of the coated 40Cr steel to ensure that the brine can only immerse from the upper surface of the coated 40Cr steel.
2.3.2.1 Rapid ammonium nitrate corrosion test
Because the experimental period of the salt spray test is too long, the coated 40Cr steel is placed in a 20% ammonium nitrate solution at 70 ± 2 °C for rapid testing.
2.3.2.2 Electrochemical test
The DH7001 electrochemical workstation and a three-electrode system consisting of a platinum electrode, a saturated calomel electrode and a self-made working electrode were used for the test. The working electrode area was 10 × 10 mm, and the nonworking surface was sealed with epoxy resin. The test was carried out under an open circuit potential, its potential scanning range was −0.25 to 0.25 V, and its scanning rate was 5 mV/s. Next, the EIS measurement frequency ranges from 0.01 Hz to 10 kHz; its scanning direction is from high frequency to low frequency, and its disturbance signal is a sinusoidal alternating potential with an amplitude of 6 mV. Two coated 40Cr steels for each experiment.
Basic composition and type of paint.
| Metal powder | Dispersant | Binder | Corrosion inhibitor | Defoamer | Thickener |
|---|---|---|---|---|---|
| Flaky zinc aluminum powder | Tween-20 | Acrylic resin, KH560 | Sodium molybdate | Isooctanol | Hydroxyethyl cellulose ether |
3 Results and discussion
3.1 Orthogonal experimental results (determination of coating formulation)
A large number of experiments were carried out by the orthogonal test in the early stage of the experiment. The ratio of zinc-aluminum powder, graphene, dispersant, binder, and corrosion inhibitor is the main factor in the experiment, and in order to determine the initial formulation of the coating liquid and the optimal range of addition of graphene, the L16 (45) orthogonal experiment was designed. The type of coating composition as shown in Table 3. The results of the orthogonal experiment are as follows: zinc powder, 7 g; aluminum powder, 3 g (zinc-aluminum ratio: 7:3); dispersant, 1.2 g; adhesive, 4 g; corrosion inhibitor, 1.5 g; graphene, <0.2 g.
In the course of the orthogonal test, it was found that the content of graphene had certain effect on the corrosion resistance of chromium-free Dacromet. With the increase in the content of graphene, the corrosion resistance of the coating increases at first and then decreases. The most obvious enhancement effect of graphene is in the range of 0–0.2 g. Therefore, the range of graphene content will be reduced, while the content of other components remains constant, and the coating solution will be configured with a certain concentration gradient difference. The orthogonal test factor levels are shown in Table 4. There are 16 groups in the orthogonal experiment. Because there are many experimental factors, in order to ensure that the experiment is not disturbed by other factors, the coating liquid configuration is strictly performed in accordance with the requirements of coating preparation. The ideal formula of the coating liquid obtained by the experiment is shown in Table 5.
Factors of orthogonal test level.
| Factor | Zinc-aluminum ratio | Graphene (g) | Dispersant (g) | Binder (g) | Corrosion inhibitor (g) |
|---|---|---|---|---|---|
| Level | A | B | C | D | E |
| 1 | 9:1 | 0 | 0.6 | 4 | 0.5 |
| 2 | 8:2 | 0.1 | 0.9 | 6 | 1 |
| 3 | 7:3 | 0.2 | 1.2 | 8 | 1.5 |
| 4 | 6:4 | 0.3 | 1.5 | 10 | 2 |
Ideal formulations.
| Component | Content | Quality ratio |
|---|---|---|
| Zinc powder | 7 g | 14% |
| Aluminum powder | 3 g | 6% |
| Dispersant | 1.2 g | 2.4% |
| Binder | 4 g | 8% |
| Corrosion inhibitor | 1.5 g | 3% |
| Graphene | 0 g ∼ 0.18 g | 0 ∼ 0.36% |
| Protective agent | 4 g | 8% |
| Thickener | <1 g | ∼ |
| Defoamer | <10 drops | ∼ |
| Deionized water | Remaining margin | About 50% |
3.2 General performance test analysis of coatings
3.2.1 Coating appearance
Figure 1 shows the appearance of different content of the graphene-reinforced coating on 40Cr steel. The size of 40Cr steel was 20 × 20 mm, and the coating was silver white. It was found that the surface of the coated 40Cr steel was smooth, flat, and dense and had no pitting, no wrinkling, no peeling, and no blistering. As the graphene content increases, although the coating color is slightly darker, it meets the technical standard of Dacromet coating appearance.

Appearance of different content of graphene-reinforced coating.
3.3 Testing and analysis of thickness
Figure 2 is a cross-sectional view of graphene content in the graphene-reinforced coating at 0, 0.12, 0.24, and 0.36%. The cross section of the coating was finely ground using fine sandpaper. It can be seen from the figure that there is no significant difference in the cross section of the graphene-reinforced coatings with different contents; the coatings are well bonded to the substrate, and the thickness of the coating is between about 30 and 40 µm.
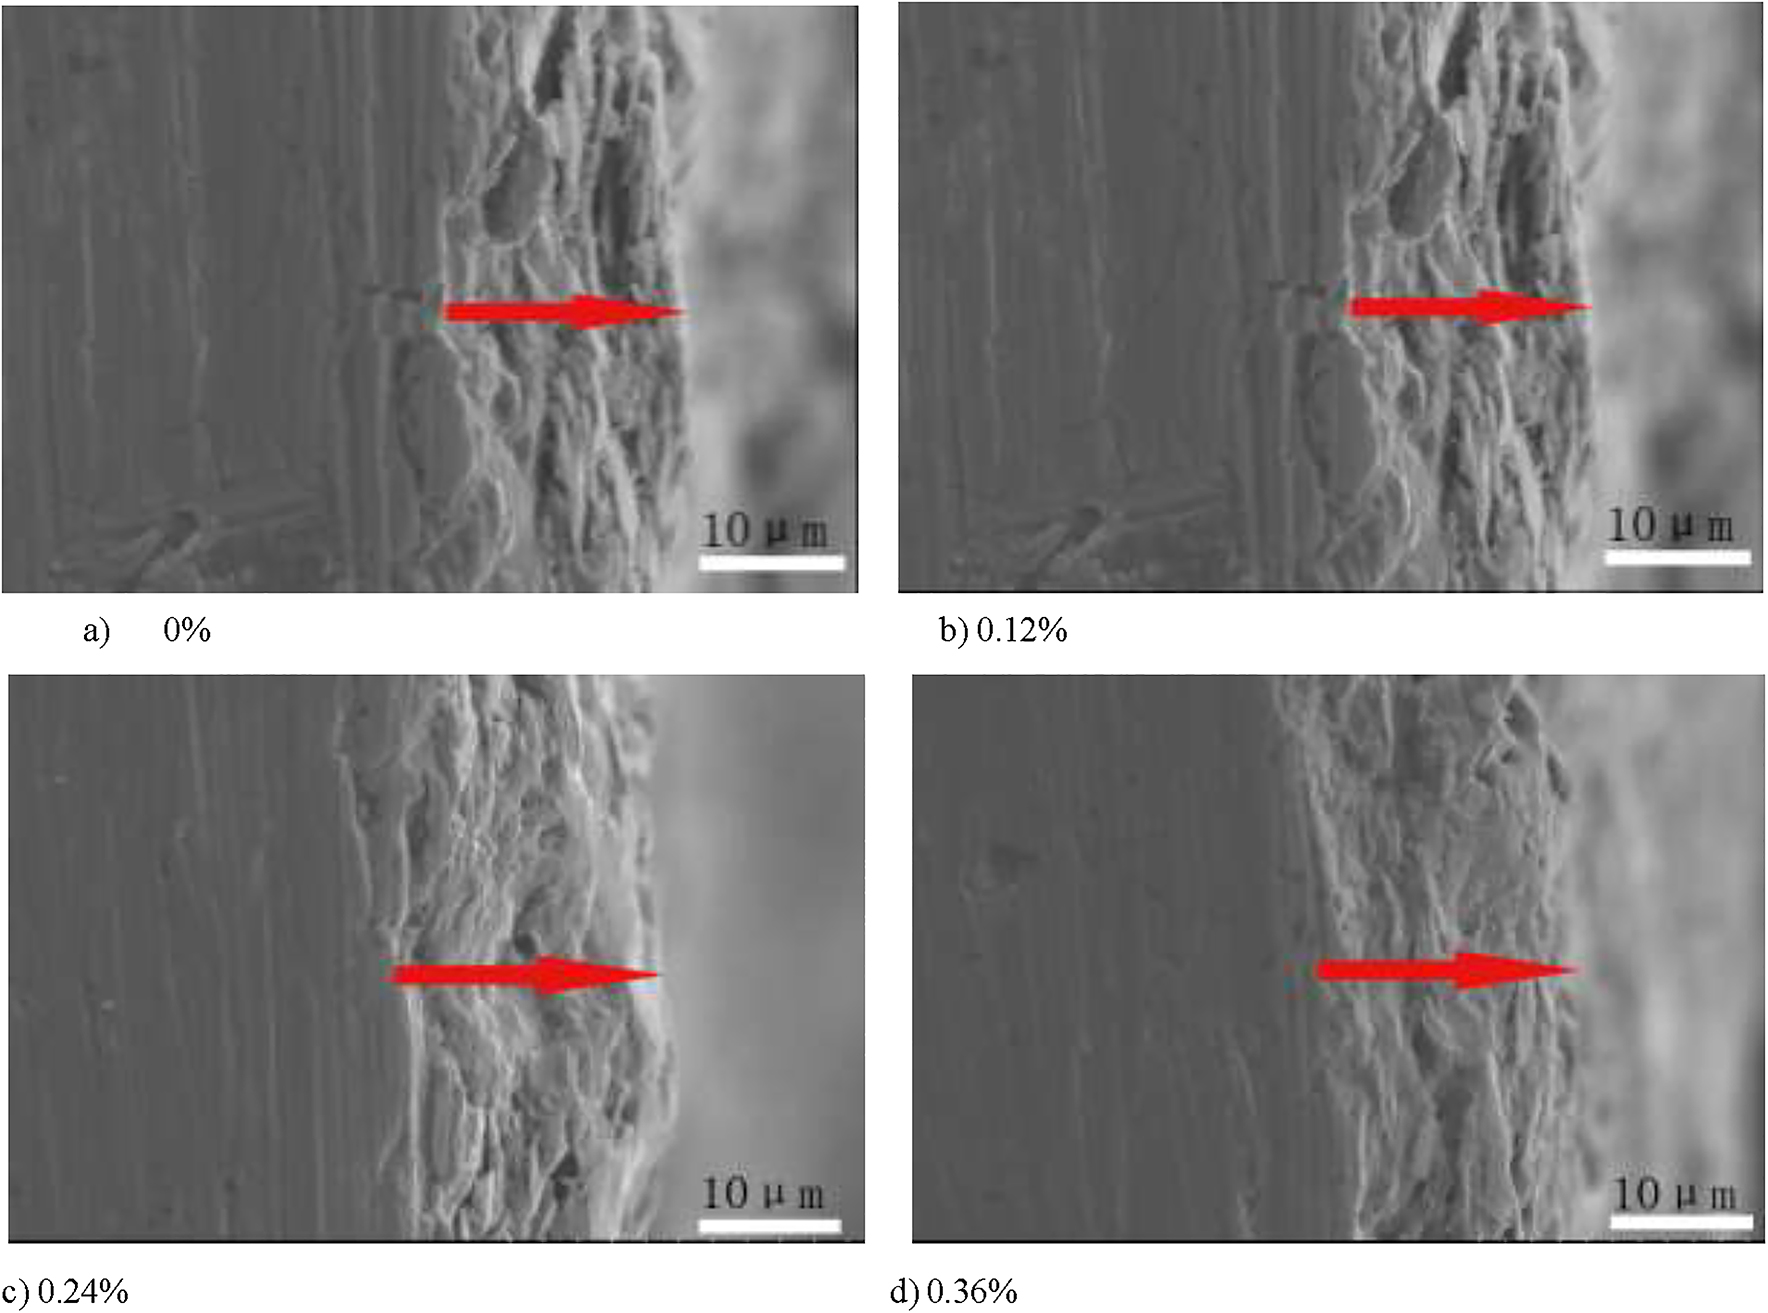
Scanning electron microscopy section topography of each coating.
The adhesion of the coating was tested according to the relevant operation of the marking method in the conventional testing method of the coating performance. The test results are shown in Figure 3. According to the evaluation table of adhesion grade in Table 11, the adhesion of the coating is grade 0 and the adhesion is excellent.

Results of the adhesion of the coating by the cross-hatch method.
3.3.1 Testing and analysis of coating hardness
The test was carried out under the action of 25 g, and the resulting data are shown in Figure 4. The graphene-reinforced coating has a hardness of about 126.75HV 0.025, and it having a graphene content of 0.12, 0.24, and 0.36% has a hardness of 175.82HV0.025, 191.222HV0.025, and 212.45HV0.025. The results show that the microhardness of the coating increases with the content of graphene.

Comparison of hardness of graphene-reinforced coatings with different contents of graphene.
3.3.2 Testing and analysis of the microstructure of the coating
Figure 5 shows the SEM results of a chromium-free Dacromet coating with different graphene contents. It can be seen from Figure 1 that the surface of each coating is relatively flat and has no obvious holes and cracks. The flaky zinc powder and aluminum powder in the coating are evenly distributed, and its diameter is about 5 ∼ 25 μm; it provides a preliminary barrier function in the entire anticorrosion process. In the figure, some of the flake metal powders appear bright white, and the substances in the bright white areas detected by EDS are aluminum and aluminum oxides. The reason for this phenomenon is that the Gibbs free energy ΔG of Al after oxidation is lower than Zn after oxidation, which makes aluminum more susceptible to oxidation. The oxide after oxidation of aluminum is bright white under scanning electron microscopy (Ji and Yao 2011). It can also be seen from the figure that there is no significant change in the surface of the coating before and after the addition of graphene particles, indicating that the addition of graphene particles does not affect the morphology of the coating. Figure 6 is a cross-sectional view and an EDS spectrum of graphene-reinforced coatings having a graphene content of 0 and 0.12%. It can be seen from the figure that the coating is well bonded to the substrate, and the thickness of the coating is between about 30 and 40 µm. It can be clearly seen from Figure 2b that the flake aluminum powder is almost parallel to the substrate. Combined with the EDS analysis results, the net strength of the C element in the graphene-reinforced coating containing 0.12% graphene is much higher than the graphene-reinforced coating containing 0% graphene, indicating that the C element in the former is highly likely to come from graphene.

Scanning electron microscopy (SEM) of chromium-free Dacromet coatings with different graphene additions.

SEM micrograph and the EDAX analysis of the coating: (a) 0% graphene composite coating; (b) 0.12% graphene composite coating. SEM, scanning electron microscopy.
In order to better observe the morphology and existence state of graphene in the coating, 5% dilute hydrochloric acid was added to different chromium-free Dacromet coatings added with graphene, and diluted hydrochloric acid was reacted on the surface of the coating to react with zinc powder and aluminum powder, then observe the graphene of the coating. Take a 0.12% graphene-reinforced coating as an example. Figure 7b is a Raman spectrum of a 0.12% graphene-enhanced coating under laser excitation at 532 nm, and it is known from the figure that there are significant peaks around 1350 cm−1 and 1580 cm−1. The typical Raman characteristics of graphene are G peak near 1582 cm−1 and G’ peak near 2700 cm−1. For the coated 40Cr steels containing defects or at the edge of the coated 40Cr steel, a defect D peak of around 1350 cm−1 may occur (Juan and Hua 2014). Combined with the EDS results in Figures 6 and 7, it can be determined that the C element with high net strength in the coating is graphene.

0.12% graphene-reinforced coating with 5% HCL: (a) SEM, (b) Raman spectroscopy, (c) energy dispersive spectrometer (EDS). SEM, scanning electron microscopy.
Figure 7a is an SEM view of 0.12% graphene after removal of surface zinc-aluminum powder. From the surface topography of Figure 7a, it can be clearly observed that graphene is embedded in the zinc-aluminum powder in a sheet-like structure, and the graphene is covered with a gap between the layers, which is kept parallel with the flaky zinc-aluminum powder. The distribution increases the density of the coating and can slow the immersion of the corrosive medium into the metal matrix.
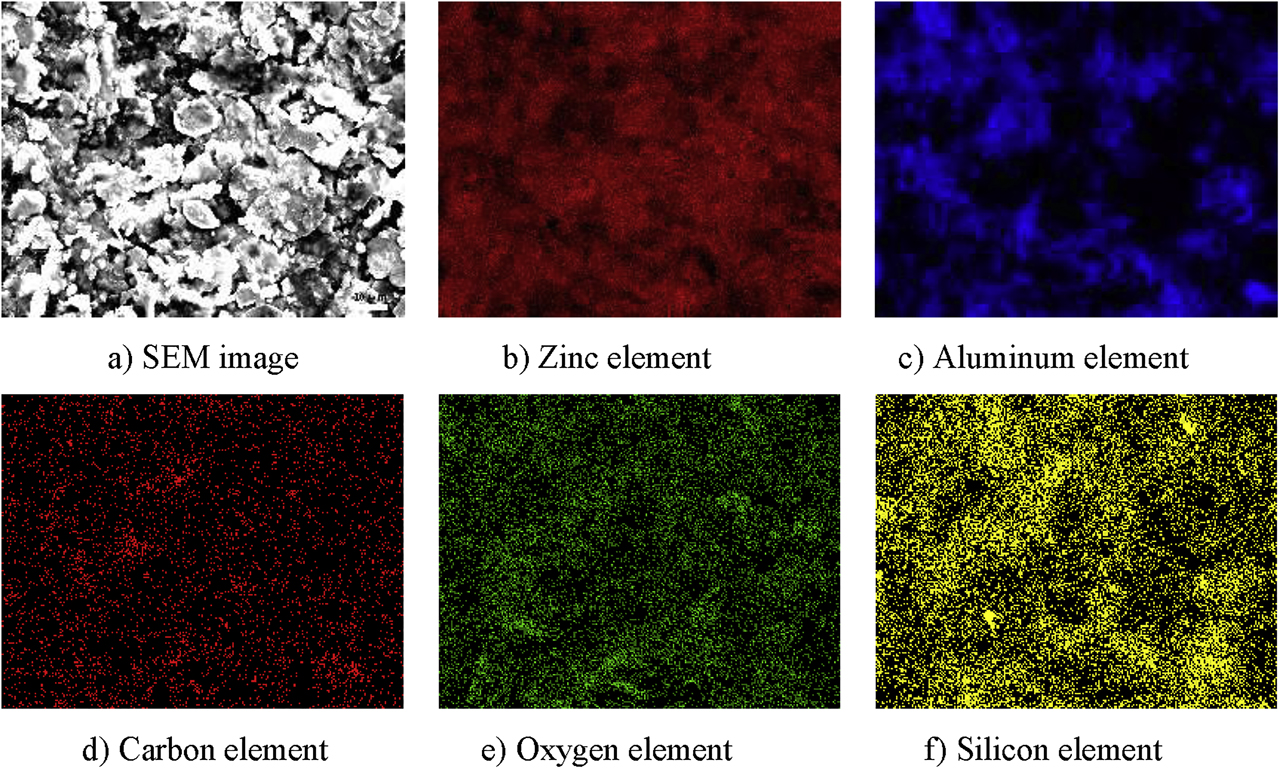
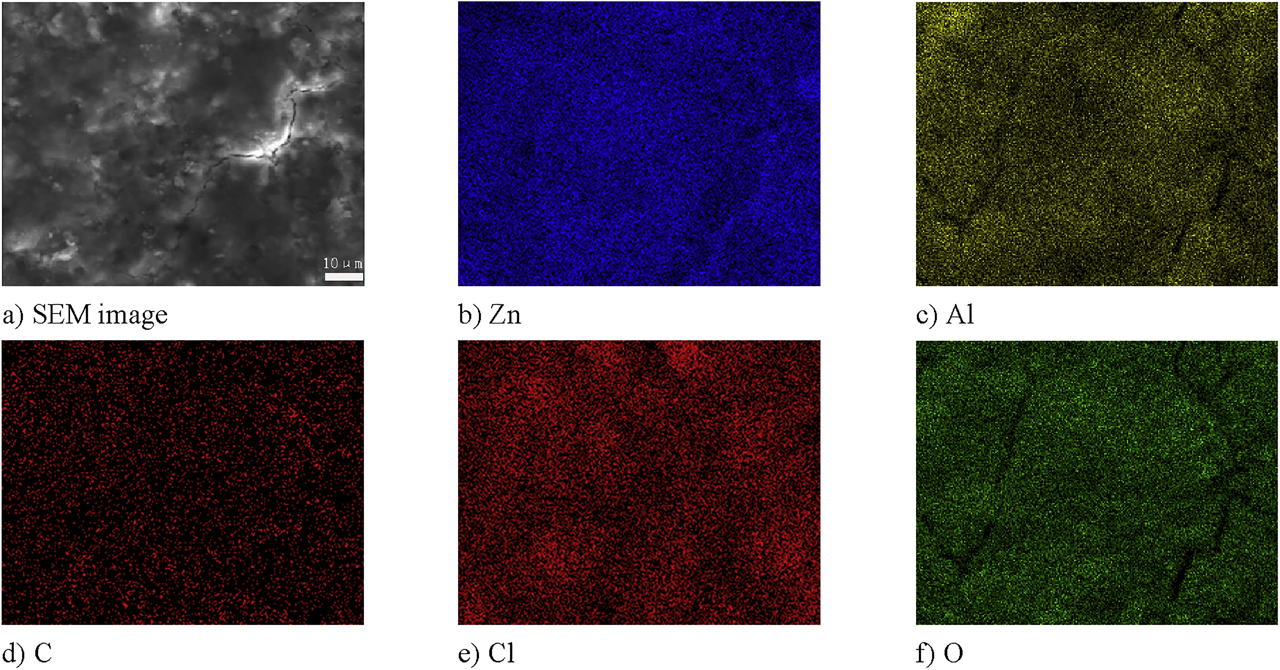
Figures 8 and 9 show the results of surface composition sweep of 0% graphene-reinforced coating and 0.12% graphene-reinforced coating. Figures 8 and 9 show that Zn element distribution is relatively uniform, and there is no obvious agglomeration phenomenon; because the specific gravity difference between the zinc-aluminum powder is large, the two are easy to stratify after mixing, and the aluminum element with small mass is easy to polymerize, it causes local agglomeration. As can be seen from these figures, the distribution of trace carbon and silicon is uniform, which shows that the dispersion effect of the coating and silane coupling agent in solution is good.

Scanning results of surface composition of 0% graphene-reinforced coating.
Scanning results of the surface composition of 0.12% graphene-reinforced coating.
3.4 Analysis of corrosion resistance of coatings
3.4.1 Corrosion test
Figure 10 is a diagram showing the appearance of each coating after the 5-h ammonium nitrate rapid corrosion test. The surface of each coating was slightly yellowed after the rapid corrosion test.

Surface morphology of coatings after the 5-h rapid corrosion test with ammonium nitrate.
It can be seen from the comparison of Figure 11 that the surface of the 0% graphene-reinforced coating has severe corrosion signs, and the corrosion spreads to the inside of the coating. The phenomenon can be preliminarily presumed that the adhesion between the coating and the substrate is weak; the surface of the 0.12% graphene-reinforced coating was intact, and the surface was slightly pitting; the 0.24 and 0.36% graphene-reinforced coatings were significantly corroded.

Surface morphology of coatings after the 800-h neutral salt spray test.
The weight loss method is used to represent the mass loss of the coated 40Cr steel before and after corrosion. The weight loss method is that after the metal material is corroded for a period of time, the weight difference between the metal material before and after the corrosion is calculated by a formula to convert the weight difference into the corrosion rate expressed by weight or the corrosion rate expressed by the depth of corrosion.Formula: V = (W−W0)/(A × t) (V:corrosion rate (g/(m2 × h))
where W is the sample weight before corrosion (g), W0 is the sample weight after corrosion (g), A is the surface area of the sample (m2), and t is the corrosion time (h).
The average mass loss of the samples is shown in Tables 6 and 7.
0% Graphene before and after corrosion mass loss.
| t (h) | V (g/(m2 × h)) |
|---|---|
| 5 | 0.05 |
| 800 | 0.17 |
0.12% Graphene before and after corrosion mass loss.
| t (h) | V (g/(m2 × h)) |
|---|---|
| 5 | 0.05 |
| 800 | 0.17 |
3.4.2 Analysis of microscopic features and elements
Looking at Figures 12 and 13 and comparing with Figure 5, it can be seen that the surface of the coating after corrosion by ammonium nitrate and salt spray is flatter than before corrosion, and the passivation effect is obvious. In the horizontal comparison, the surface of the 0% graphene-reinforced coating in Figures 12 and 13 is relatively rough and has a distinct layering, and the surface of the 0.12% graphene-reinforced coating is relatively smoother and denser. In Figure 13, a large number of holes appear on the surface of the 0% graphene-reinforced coating after 800-h salt spray corrosion. There is no obvious porosity in the 0.12% graphene-reinforced coating. The difference between Figures 13 and 5 indicates that the addition of a small amount of graphene can effectively prevent the vertical penetration of the corrosive medium and reduce the occurrence of voids (see Figure 14).

SEM of coatings after the 5-h rapid corrosion test with ammonium nitrate. SEM, scanning electron microscopy.

SEM of coatings after the 800-h neutral salt spray test. SEM, scanning electron microscopy.

EDS diagram of 0% graphene chromium-free Dacromet coating under the 800-h salt spray test. EDS, energy-dispersive spectrometer.
Figure 14 and Table 8 show the EDS chart and composition analysis of the 0% graphene-reinforced coating under the 800-h salt spray test. The content of Zn and Al decreased to some extent compared with that before corrosion. The Al element decreased from 29.8 to 15.23%, and the Zn element decreased from the previous 48.47 to 37.93%. The decrease in Zn content in the coating was due to Zn having a low corrosion potential, which is more active than Fe in metal chemical reactions, and a part of the zinc powder is corroded as an anode during the etching process. The content of O element increased significantly from 6.75 to 27.07%. Combined with the decrease in the proportion of Zn and Al elements, it can be inferred that the zinc powder and the aluminum powder in the coating react with the oxygen in the air and the passivating agent in the coating liquid to form insoluble zinc aluminum oxide; these oxides constitute a dense passivation film that prevents further corrosion of the coating.

Results of scanning the surface composition of the coating of the 0% graphene-reinforced coating after the 800-h salt spray test.
Component analysis table of the 0% graphene chromium-free Dacromet coating after the 800-h salt spray test.
| Element | CK | OK | AlK | SiK | MoL | ClK | FeK | ZnK | Matrix |
|---|---|---|---|---|---|---|---|---|---|
| Wt. % | 7.66 | 27.07 | 15.23 | 3.45 | 0.43 | 2.73 | 1.71 | 37.93 | Correction |
| At % | 17.57 | 42.04 | 14.03 | 3.06 | 0.11 | 1.92 | 0.76 | 14.42 | ZAF |
Figure 15 shows the surface composition scan results of the 0% graphene chromium-free Dacromet coating after the 800-h salt spray test. It can be seen from the figure that the distribution of Zn and Al is very uniform, especially the Al element, which has changed from an island-like distribution to a uniform distribution. It can be seen from the figure that the content of oxygen element is significantly increased, and its distribution is almost identical to the distribution of Al element. It is further presumed that the increase in oxygen element is due to the reaction of oxygen in the air with the aluminum powder to form a passivation film. Because 3.5% NaCl solution was used in the salt spray experiment, some of the chlorine in the solution was found in the coating composition. The results of scanning the surface of the coating after the salt spray experiment revealed a relatively obvious Fe element, and the Fe element was scattered throughout the coating. And the results of the scanning experiment showed that the color of part of the surface of the coated 40Cr steel changed from the original light color to the dark color; this phenomenon indicates that a small amount of the corrosive medium has contacted the substrate of 40Cr steel.
Figure 16 and Table 9 show the EDS and compositional analysis of the 0.12% graphene-reinforced coating under the 800-h salt spray test. Like the 0% graphene-reinforced coating, the proportion of C, Si, and Mo elements in the 0.12% graphene-reinforced coating did not change significantly after the salt spray test, the content of O element increased significantly, and the proportion of Zn and Al decreased, indicating that the corrosion process was almost the same as that of the 0% graphene-reinforced coating. The 0.12% graphene-reinforced coating has more residual content of Zn and less Fe. It shows that graphene can delay the corrosion rate of Zn in the coating.

EDS diagram of the 0.12% graphene-reinforced coating after the 800-h salt spray test. EDS, energy-dispersive spectrometer.
Analysis of the composition of the 0.12% graphene-reinforced coating after the 800-h salt spray test.
| Element | C | O | Al | Si | Mo | Cl | Fe | Zn | Matrix |
|---|---|---|---|---|---|---|---|---|---|
| Wt. % | 10.11 | 26.06 | 15.99 | 2.56 | 0.52 | 2.24 | 1.09 | 41.42 | Correction |
| At % | 21.72 | 42.01 | 15.29 | 2.35 | 0.14 | 1.63 | 0.5 | 16.34 | ZAF |
Figure 17 shows the results of scanning the surface composition of a 0.12% graphene-reinforced coating. It can be seen from Figure 17 that the Zn and Al elements are uniformly distributed, and the distribution of the O element is consistent with the Al element. The results of scanning the surface of the coating were generally the same as for the 0% graphene-reinforced coating, indicating that the addition of graphene did not affect other compositional changes.
Scanning results of the composition of the surface of the 0.12% graphene-reinforced coating after the 800-h salt spray test.
3.4.3 Electrochemical test
As the thickness of the coating increases, the pores become smaller and the effect of the pores on the resistance value decreases; the graphene coating is thin enough to have no such problem, so the 40Cr steel has no effect on the test. Figure 18 shows Tafel polarization curves for graphene-reinforced coatings with different graphene contents. Curves 2, 3, 4, and 5 are polarization curves of coated 40Cr steels. The first curve in Figure 18 is 40Cr steel without the coating, and the remaining four curves are 0.12, 0.24, 0, 0.36% from top to bottom. The main fillers of the coating are zinc powder and aluminum powder, and the corrosion potential is lower than that of bare steel 40Cr (curve 1), so the polarization curves of the coated 40Cr steels are all below the curve of bare steel 40Cr.
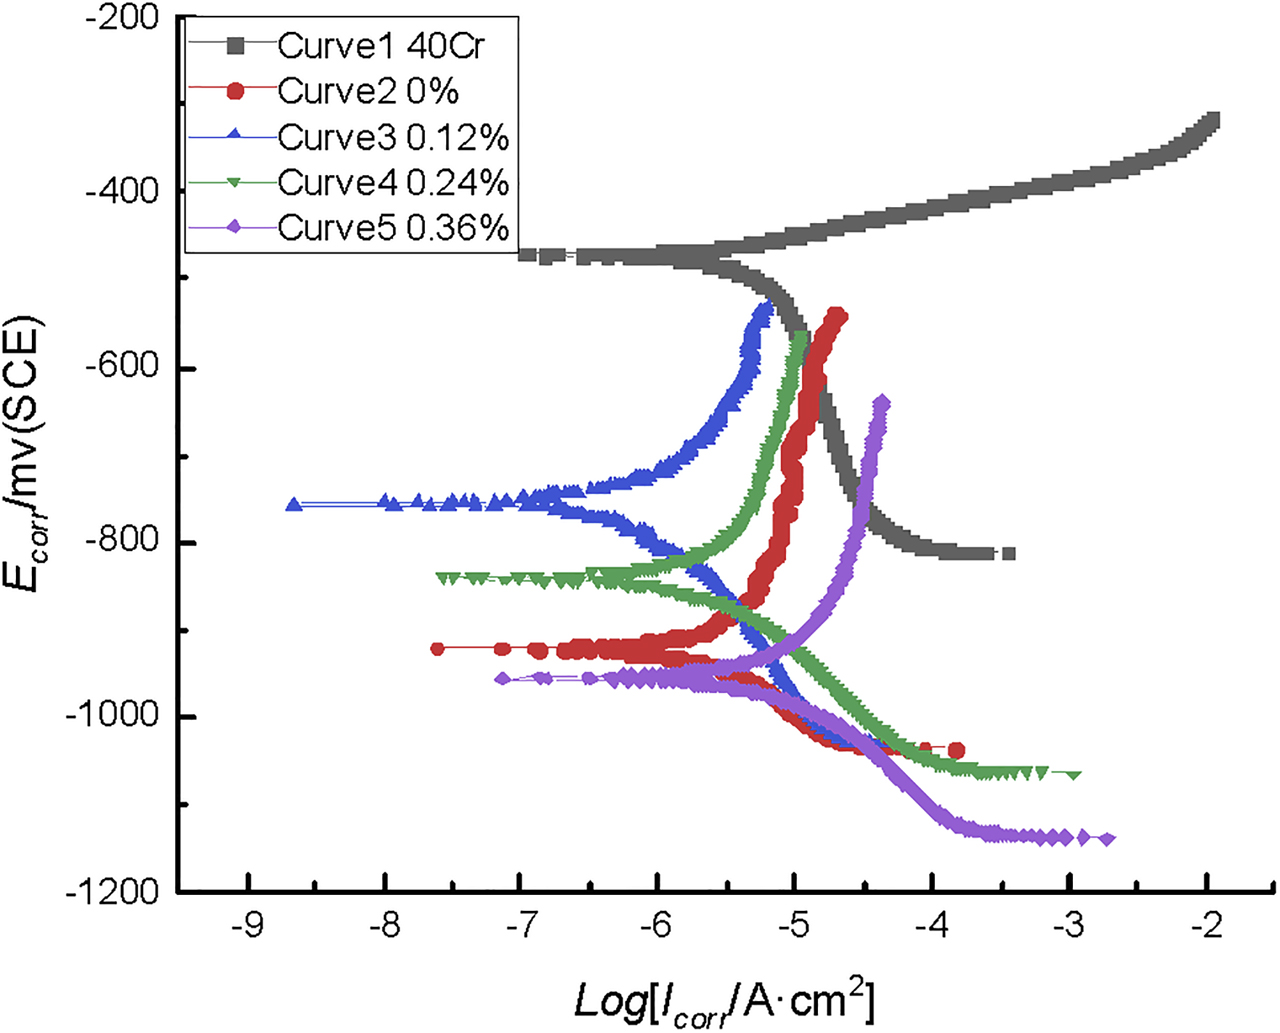
Tafel polarization curves of reinforced coatings with different contents of graphene additives in 3.5% NaCl solution.
Comparing the Tafel curves of the coated 40Cr steels (0, 0.12, 0.24, 0.36%), the corrosion potential of the 0.12% graphene-reinforced coating (0.12%) is −756 mV; it is 164 mv greater than the corrosion potential of the 0% graphene-reinforced coating (0%). The 0.36% graphene-reinforced coating (0.36%) has the lowest corrosion potential, and the potential is −956 mV, which is 36 mV smaller than the 0% graphene-reinforced coating. The corrosion potential of the 0.24% graphene-reinforced coating (0.24%) has a potential of −841 mV. The corrosion potential can reflect the corrosion tendency to a certain extent. The higher the corrosion potential, the lower the corrosion tendency.
The corrosion current density reflects the corrosion rate of the coating. The low corrosion current density indicates the low rate of corrosion reaction and the long anticorrosion time. In Figure 18, the curves of the corrosion current density of the 40Cr steels from low to high are 0.12, 0.24, 0, and 0.36% graphene-reinforced coatings. As can be seen from Table 10, the corrosion current density of the 0% graphene-reinforced coating is 1.58 e-5A × (cm−2); the corrosion current density of the 0.24% graphene-reinforced coating is much lower than that of the 0% graphene coating; the corrosion current density of the 0.24% graphene-reinforced coating is 0.96e-5A × (cm−2). The corrosion current density of the 0.12% graphene-reinforced coating is the lowest, about 0.41e-5A × (cm−2). The current density of the 0.36% graphene-reinforced coating is similar to that of the 0% graphene-reinforced coating. It can be seen that the corrosion reaction rate of the 0.12% graphene-reinforced coating was the slowest, and the corrosion resistance of the 0 and 0.36% graphene-reinforced coating was the worst. It shows that adding a small amount of graphene nanosheets in the coating can reduce the corrosion current density, which can effectively improve the corrosion resistance of the coating.
Corrosion current density of graphene-reinforced coatings.
| Icorr/(A cm−2) | Ecorr/mV | |
|---|---|---|
| 0% Graphene-reinforced coating | 1.58e-5 | −920 mV |
| 0.12% Graphene-reinforced coating | 0.41e-5 | −756 mV |
| 0.24% Graphene-reinforced coating | 0.96e-5 | −841 mV |
| 0.36% Graphene-reinforced coating | 3.16e-5 | −956 mV |
Evaluation of coating adhesion.
| Order of evaluation | Explanation | Diagram form |
|---|---|---|
| 0 | The cut line profile is completely smooth and free of coating spalling. |

|
| 1 | There is a little debris peeling off at the intersection, but less than 5% of the square’s area. |

|
| 2 | There is a little spalling of coating on the intersection or the outermost cutting line, and the spalling area is about 5 ∼ 15% of the grid area. |

|
| 3 | There is partial or strip peeling or whole or partial peeling in some places along the cutting line, and the peeling area is about 35% of the square area. |

|
| 4 | The coating strips along the scale line or a square is peeled off in whole or in part, and the peeling area is about 65% of the square area. |

|
| 5 | The spalling area of the coating is larger than 65% of the square area. |

|
As the graphene content increases, the corrosion current density of the coating increases. This is because graphene itself is the material with excellent electrical conductivity; graphene has a special two-dimensional lamellar structure and an ultrathin thickness that allows graphene to fill in gaps in the coating to increase its compactness and density; the principle of protection envisaged is shown in Figure 19. The green part is epoxy; the black lines represent graphene; the blue arrows represent the erosion path; the upper layer is the corrosion medium; the lower layer is the metal matrix, as shown in Figure 19; the presence of graphene lengthens the path of the corrosive medium. As the graphene content increases, graphene and graphene may be directly connected between the coatings, which increases the conductivity of the coating and increases the corrosion current density.

Protective mechanism of graphene added to coatings as an enhanced protector.
Another significant feature of Figure 18 is that the behavior of adding graphene nanosheets does not result in a large change in the shape of the polarization curve of the coating, indicating that the addition of graphene nanosheets to the chromium-free Dacromet coating has no effect on the electrode reaction of the coated 40Cr steels.
In the Nyquist diagram, the state variables of the electrode process are estimated by observing the number of time constants and the magnitude of the values of the respective frequency segments. Usually, the corrosion reaction of the coating in the middle- and low-frequency regions is complicated; the corrosion variation is high, and the frequency region may be related to the physical resistance of the coating (Cao and Zhang 2002; Hu 2008).
Figure 20 shows the Nyquist diagram of the graphene-reinforced coating applied to 40Cr steel immersed in 3.5% NaCl solution for different periods.
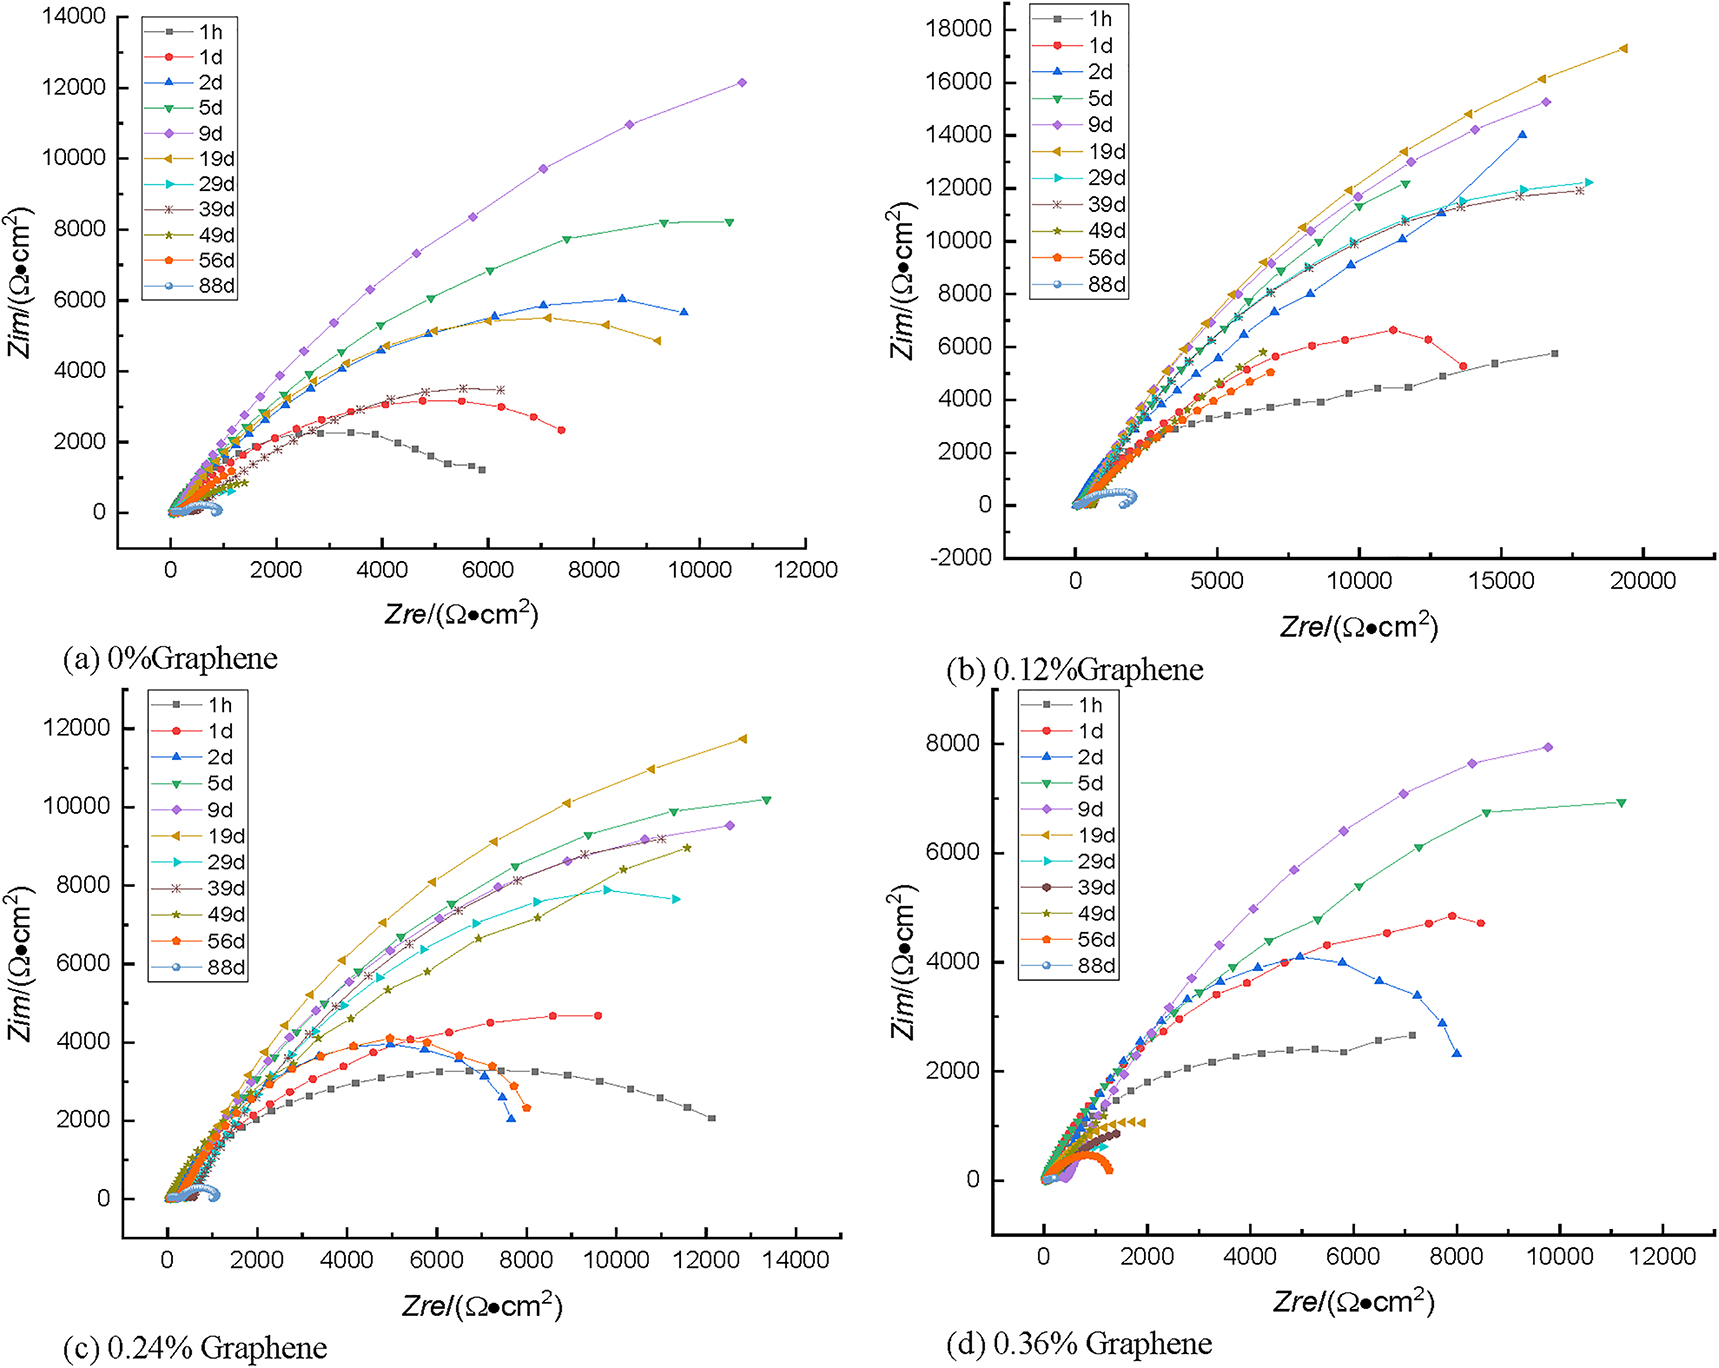
Nyquist diagram of coatings with different graphene additions immersed in 3.5% NaCl solution.
It can be observed from Figure 20 that the electrochemical impedance of the Dacromet coating with different graphene content is greatly different when immersed, and the low-frequency region is more obvious, because the low-frequency semicircle exhibits information about the associated corrosion reaction of the metal powder in the Dacromet layer. According to the change of the time constant in the EIS spectrum and the small-large-small evolution of the arc radius in the low-frequency region, the whole soaking process is roughly divided into the presoaking period, the middle soaking stage, and the late soaking stage. The three immersion periods are judged by the time when the time constant, defined as a high-frequency impedance arc, appears as an arc in Figure 20; the time of presoaking is the period of time from the beginning to the appearance of the second time constant in the impedance spectrum, which contains only the first high-frequency impedance arc; the late period of immersion is from the time when the amplitude of capacitance resistance in the low-frequency region drops sharply to the end of the experiment; the middle stage of immersion is from the appearance of the second time constant to the beginning of the late stage of immersion.
In the presoaking period, the Nyquist curves of the four coatings were approximately the same. The four coatings showed a slightly flat semicircle after one day of soaking. It can be seen that there is only one time constant in the impedance spectrum, indicating that the entire coating is equivalent to the shielding layer, completely isolating the corrosive medium from the substrate. The 0.12% graphene-reinforced coating has the largest resistance radius, indicating that the film is very dense, so the corrosive medium is difficult to reach the surface of the substrate, but as the graphene content increases, the radius of the capacitive antiarc decreases, indicating that adding too much graphene to the coating will reduce the corrosion resistance of the coating.
With the time of immersion prolonged, on the fifth day, the high-frequency impedance arc began to appear in each coating, which indicates that the middle soaking stage was started. Although the impedance arc in the high-frequency region is not obvious, a second time constant appears, indicating that the corrosive medium has contacted the substrate 40Cr steel, and a corrosion microcell is formed between the substrate and the coating. The amplitude of the low-frequency capacitive antiarc in the Nyquist spectrum is unstable during the middle soaking stage, and the magnitude of the amplitude frequently changes, but the magnitude of the amplitude generally increases. And the 0.12% graphene-reinforced coating has a higher value of the amplitude of the low-frequency capacitive arc than other graphene-reinforced coatings.
The state of the coating in the late soaking period was similar to that in the mid-soaking period, but the length of time from the middle of the soaking to the late stage of the soaking were different. Graphene-reinforced coatings at a concentration of 0, 0.12, 0.24, 0.36% changed from the middle of immersion to the late immersion at 49, 88, 56, and 19 d, respectively, indicating that graphene can delay corrosion; at this stage, two time constants appear in the impedance spectrum, except that the value of the capacitive reactance amplitude in the low-frequency region decreases sharply; the reason why this impedance spectrum is formed is because the gradient of the concentration present in the organic coating disappears as the macroscopic pores are formed and the area of the substrate exposed to the corrosive environment gradually increases.
Analysis of the XRD test Figure 21 shows the XRD pattern before and after corrosion of the 0.12% graphene-modified chromium-free Dacromet coating. It can be seen from Figure 21a that the main elements of the coating before corrosion are Zn, Al, C (including several allotropic forms), and some oxides of aluminum and silicon. Figure 21b shows the XRD pattern of the coating after the 1030-h soaking test, compared with Figure 21a, the strength of the zinc-rich phase is significantly reduced, the peak intensity of 43° is reduced from 4500 to less than 100, and the peaks of 36 and 54° have disappeared. It indicates that Zn powder is consumed in a large amount during the etching process; Zn powder is consumed because Zn is more active than Fe; its corrosion potential is lower than Fe, and it acts as an anode preferentially corroded during corrosion. At the same time, the strength of the aluminum-rich phase also decreased significantly, accompanied by the appearance of Al oxides (Al2O3, AlOOH, and AlOCl). Al2O3 is unstable in water and usually reacts with water to form colloidal AlOOH and Al(OH)3 films. AlO usually reacts with water and CO2 to form more stable Al(OH)3, which reacts with chloride ions in the solution to form basic aluminum chloride Al5Cl3(OH)12 4H2O (Geng et al. 2016) that is hardly soluble in water and can resist corrosion of corrosive media and effectively reduce corrosion rates.

X-ray diffractometer (XRD) of 0.12% graphene-reinforced coatings (a) before and (b) after corrosion.
4 Conclusion
The addition of graphene to the chrome-free Dacromet coating enhances the compactness of the chrome-free Dacromet coating. Graphene exists in the form of a lamellar structure in the chrome-free Dacromet coating; it is embedded between the gap between the zinc powder and the aluminum powder, is kept parallel with the flaky Zn–Al powder, and is arranged in a staggered arrangement. In the process of corrosion, Zn is first consumed, and Al reacts with other substances to form dense corrosion products that are insoluble in water, which can reduce further erosion of corrosive media.
The addition of the right amount of graphene to the chrome-free Dacromet coating contributes to the corrosion resistance of the chrome-free Dacromet coating. With the increase in graphene, the corrosion potential of the coating increases first and then decreases, and the density of corrosion current decreases first and then increases. The corrosion potential of the 12% graphene-reinforced coating is 164 mV higher than the corrosion potential of the 0% graphene-reinforced coating, and the density of the corrosion current of the 12% graphene-reinforced coating is much lower than the density of the corrosion current of the 0% graphene-reinforced coating. During each time period in which the coated 40Cr steel was immersed in a 3.5% NaCl solution, the 0.12% graphene-reinforced coating always had the largest low-frequency capacitive impedance arc and reached its maximum on the 19th day.
The corrosion resistance of the 0.12% graphene-reinforced coating is best compared to other graphene-reinforced coatings. The reason why the addition of a small amount of graphene in the chromium-free Dacromet can effectively improve the corrosion resistance of the coating is that the flaky graphene is embedded between the coatings to increase the density of the coating, increase the coating resistance, and reduce the appearance of the pores on the surface and acts as a barrier to delay the infiltration of the electrolyte solution in the vertical direction.
Funding source: Scientific Research Project of Guizhou Province
Award Identifier / Grant number: [2017]7245
Funding source: Guizhou University
-
Author contribution: All the authors have accepted responsibility for the entire content of this submitted manuscript and approved submission.
-
Research funding: The study was funded by the Scientific Research Project of Guizhou Province ([2017]7245). We are very grateful to Guizhou University for its support.
-
Conflicts of interest: The authors declare no conflicts of interest regarding this article.
References
Cao, C.N. and Zhang, J.Q. (2002). Introduction to electrochemical impedance spectroscopy. Beijing: Beijing Science Press. (In Chinese).Suche in Google Scholar
Chang, K.C., Hsu, M.H., Lu, H.I., Lai, M.C., Liu, P.G., and Hsu, C.H. (2014). Corrigendum to “Room-temperature cured hydrophobic epoxy/graphene composites as corrosion inhibitor for cold-rolled steel”. Carbon 66: 144–153, https://doi.org/10.1016/j.carbon.2013.08.052.Suche in Google Scholar
Chen, S., Lola, B., Levendorf, M., Cai, W., Ju, S.Y., Edgeworth, J., Li, X., Magnuson, C.W., Velamakanni, A., Piner, R.D., et al. (2011). Oxidation resistance of graphene-coated Cu and Cu/Ni alloy. ACS Nano 5: 1321–1327, https://doi.org/10.1021/nn103028d.Suche in Google Scholar PubMed
Christopher, G., Kulandainathan, M.A., and Harichandran, G. (2015). Comparative study of effect of corrosion on mild steel with waterborne polyurethane dispersion containing graphene oxide versus carbon black nanocomposites. Prog. Org. Coating 89: 199–211, (In Chinese), https://doi.org/10.1016/j.porgcoat.2015.09.022.Suche in Google Scholar
Fu, H., Zhao, J., Fang, L., and Hu, J. (2017). Application of graphene in corrosion protection of metals and its prospect. Surf. Technol. 46: 202–208, https://doi.org/10.15199/40.2017.11.5.Suche in Google Scholar
Geng, J.F. (2016). Study on preparation and properties of crfree znal alloy coating with new acrylic resin binder. Nanjing: Nanjing University of Aeronautics and Astronautics. (In Chinese).Suche in Google Scholar
Gergely, A. (2018). A review on corrosion protection with single-layer, multilayer, and composites of graphene. Corrosion Rev. 2: 155–226, https://doi.org/10.1515/corrrev-2017-0016.Suche in Google Scholar
Hu, H.L. (2008). Development and corrosion resistance mechanism of chrome-free zinc-aluminum sintering coating. Harbin: Harbin Institute of Technology. (In Chinese).Suche in Google Scholar
Huh, J., Kim, S.H., Chu, J.H., Kim, S.Y., Kim, J.H., and Kwon, S.Y. (2014). Enhancement of seawater corrosion resistance in copper using acetone-derived graphene coating. Nanoscale 6: 4379–4386, https://doi.org/10.1039/c3nr05997a.Suche in Google Scholar PubMed
Ji, L.Y. and Yao, Z.J. (2011). Study on technology of chromate-free Dacromet coating. Electroplat. Pollut. Control 31: 3. https://doi.org/10.3969/j.issn.1000-4742.2011.03.008.Suche in Google Scholar
Jiang, K., Li, J., and Liu, J. (2014). Electrochemical codeposition of graphene platelets and nickel for improved corrosion resistant properties. RSC Adv. 4: 36245–36252, https://doi.org/10.1039/c4ra06043a.Suche in Google Scholar
Juan, X.W. and Hua, X. (2014). Application of Raman spectroscopy in structure characterization of graphene. Hua Hsueh Hsueh Pao 72: 301. https://doi.org/10.6023/A13090936.Suche in Google Scholar
Li, Y., Yang, Z., Qiu, H., Dai, Y., Zheng, Q., and Li, J. (2014). Self-aligned graphene as anticorrosive barrier in waterborne polyurethane composite coatings. J. Mater. Chem. 2: 14139–14145, https://doi.org/10.1039/c4ta02262a.Suche in Google Scholar
Liu, D., Zhao, W., Liu, S., Cen, Q., and Xue, Q. (2016). Comparative tribological and corrosion resistance properties of epoxy composite coatings reinforced with functionalized fullerene C60 and graphene. Surf. Coating. Technol. 286: 354–364, https://doi.org/10.1016/j.surfcoat.2015.12.056.Suche in Google Scholar
Mo, M., Zhao, W., Chen, Z., Chen, Z., Yu, Q., and Zeng, Z. (2015). Excellent tribological and anticorrosion performance of polyurethane composite coatings reinforced with functionalized graphene and graphene oxide nanosheets. RSC Adv. 5: 56486–56497, https://doi.org/10.1039/c5ra10494g.Suche in Google Scholar
Pramoda, K.N., Chan, J.H., Wang, S.C., Sung, J.C., and Huang, J.L. (2013). Graphene coated Ni films: a protective coating. Thin Solid Films 529: 312–316, https://doi.org/10.1016/j.tsf.2012.03.067.Suche in Google Scholar
Ramezanzadeh, B., Niroumandrad, S., Ahmadi, A., Mahdavian, M., and Mohamadzadeh, M.H. (2016). Enhancement of barrier and corrosion protection performance of an epoxy coating through wet transfer of amino functionalized graphene oxide. Corrosion Sci. 103: 283–304, https://doi.org/10.1016/j.corsci.2015.11.033.Suche in Google Scholar
Tong, F. (2014). Study on chromium-free zinc-aluminum coatings enhanced by nano materials. Nanjing: Nanjing University of Aeronautics and Astronautics. (In Chinese).Suche in Google Scholar
Walt, A., de Heera, Berger, C., Wu, X., Lia, X., and Li, T. (2007). Epitaxial graphene. Solid State Commun. 143: 92–100. https://doi.org/10.1016/j.ssc.2007.04.023.Suche in Google Scholar
Xu, G. and Meng, Z. (2006). Study on non-chromate Dacromet technology for magnesium alloy. Surface Technology 35: 51.Suche in Google Scholar
Zhang, S. (2017). Preparation and properties studying of graphene/waterborne epoxy zinc rich coating. Harbin: Harbin Institute of Technology. (In Chinese).Suche in Google Scholar
© 2020 Walter de Gruyter GmbH, Berlin/Boston
Artikel in diesem Heft
- Frontmatter
- Reviews
- Biocompatibility and corrosion resistance of metallic biomaterials
- The roles of biomolecules in corrosion induction and inhibition of corrosion: a possible insight
- Principle and application of atomic force microscopy (AFM) for nanoscale investigation of metal corrosion
- Original articles
- A numerical external pitting damage prediction method of buried pipelines
- Comprehensive performance test and analysis of graphene-enhanced chromium-free Dacromet coating