Semiconducting behavior and kinetics of passive film growth on AISI 321 stainless steel in sulfuric acid
-
Yassine Koumya
 ,
Rachid Idouhli
,
Rachid Idouhli

Abstract
In the present study, the effects of aging and formation potential on the semiconducting behavior of AISI 321 stainless steel as well as the kinetics of the early stages of pitting are discussed. The donor and acceptor densities decrease with increasing formation potential. The steady-state passive film thickness and the coefficient of oxygen vacancies are estimated. The electrode polarization at higher anodic potentials causes the increase in the rate of pit initiation and slows down the growth rate of passive film. Also, the openness of the pits and their coalescence are highly promoted with the increase in the applied potential.
1 Introduction
Due to its passivity, austenitic stainless steel (SS) seems to be an adequate candidate to withstand the aggressiveness of acidic media (Fattah-alhosseini et al., 2011b; Koumya et al., 2019). The high corrosion resistance of SS is primarily due to the formation of passive film oxides that are usually described as a mixture of iron and chromium oxide film with semiconducting properties (Castle & Clayton, 1977; Marcus & Grimal, 1992; Hakiki et al., 1995; Hakiki, 1998; Elsa, 2014; Peng, 2015). It is generally believed that the passive film consists of an oxide layer that hinders the flow of current across the metal-solution interface (Macdonald, 2012). Several studies have explained that passive film oxide is made up essentially of a rich chromium oxide/hydroxide inner layer and an iron-oxide rich outer layer (Castle & Clayton, 1977; Marcus & Grimal, 1992; Hakiki et al., 1995; Hakiki, 1998). Maurice et al. (Fattah-alhosseini & Imantalab, 2013) have worked on the passive film formed on the Fe-18Cr-13Ni (100) alloy. The film formed by anodic polarization at +500 mV/ESH in 0.5 m sulfuric acid (H2SO4) has been described as a duplex layer consisting mainly of an inner layer in the form of a mixture chromium (Cr3+) and iron oxides (Fe3+) containing OH− ligands and an outer layer consisting of chromium hydroxide (Maurice, 1996). The duplex composition of the SS film has been investigated in many studies (Castle & Clayton, 1977; Marcus & Grimal, 1992; Hakiki et al., 1995; Hakiki, 1998).
The study of the passivity phenomenon is expected to be a valuable key for the better understanding of the SS corrosion behavior in H2SO4. Many studies have reported the relationship between the corrosion behavior of SS and the composition, structure, and thickness of the passive film (Cahan & Chen, 1982; Macdonald & Urquidi-Macdonald, 1990; Ahn & Kwon, 2006). Although many models fail to microscopically explain passive film growth, the point defect model (PDM) provides a satisfactorily description of passive film growth and breakdown under steady-state and transient conditions (Cahan & Chen, 1982; Krishnamurthy et al., 2002; Sikora & Macdonald, 2002). The kinetics of passive film growth can be described by focusing on the diffusion of point defects (i.e. oxygen vacancies and metal cation vacancies) within the oxide barrier layer. Mott-Schottky analysis and PDM have been widely used for the kinetic description of the passive film properties (Hakiki et al., 1995; Cheng et al., 2008; Feng et al., 2010, 2018; MacDonald, 2011; Kim & Young, 2013; Fattah-alhosseini et al., 2014; Peng, 2015; Fattah-alhosseini & Vafaeian, 2016; Yue et al., 2018). Fattah et al. (Fattah-alhosseini & Imantalab, 2013) have studied the electrochemical behavior of AISI 321 SS in alkaline media (0.1 m NaOH + 0.1 m KOH) at different immersion times. Mott-Schottky analysis has shown that the accepted densities are in the range of 1.0×10²¹–3.0×1021 cm−3 and decreased with immersion time. They have also investigated the semiconductor behavior of AISI 430 ferritic SS in concentrated alkaline solutions. Mott-Schottky analysis showed that the passive film formed on AISI 430 SS behaves as an n-type semiconductor and the donor density increased with pH (Fattah-alhosseini & Vafaeian, 2016).
The pitting corrosion evolution on SS in chlorinated medium takes place in three distinct stages: initiation, metastable growth, and stable growth (Pistorius & Burstein, 1992; Klapper et al., 2013; Zakeri & Moayed, 2014; Paulraj & Garg, 2015). It is very necessary to realize that, despite the huge achievements in understanding the corrosion behavior of SS in acidic media, more investigations are still needed to address the challenges related to various phenomena associated with passivity breakdown and the pitting corrosion. Generally, most challenges area arise from the dynamic nature of the pit initiation in the metallic surface that occurs on nanometer scale (Soltis, 2015). The kinetic aspect of the early stages of the pit initiation can be studied using kinetic measurements as well as kinetically developed theoretical models.
Albrimi et al. studied the effect of applied voltage on the early stages of pitting corrosion of 316 SS as well as the rate of passive film growth. They supported the decrease in the growth rate of passive film and the increase of pit nucleation rate with the shift of the applied potential to the positive direction (Albrimi et al., 2011).
The aim of the present investigation is to study the semiconducting properties of the SS passive film formed in H2SO4 (1 m) at different potentials. Also, the kinetics of passive film growth and the nucleation/growth of pits are studied. Toward this end, the effects of formation potential, aging, and applied potential are thoroughly assessed using chronoamperometry, Mott-Schottky analysis, electrochemical impedance spectroscopy (EIS), potentiodynamic polarization, and scanning electron microscopy. To describe the semiconducting properties of the highly doped film formed on SS, PDM is used. To assess the effect of anodic voltage on the kinetic properties of passive film growth and the early stages of SS pitting, current transients are recorded at different applied potentials.
2 Materials and methods
Electrochemical experiments were carried out with a three-electrode conventional cell consisting of the SS working electrode, platinum as counter electrode, and a saturated calomel electrode (SCE) as reference electrode. The SS specimen was cut from AISI 321 SS sheet. The chemical composition (wt.%) provided by the manufacturer is given in Table 1. The samples were cut into a rectangular shape with dimensions of 1.2×0.8 cm. H2SO4 solution (1 m) was prepared by dilution of analytical 97% H2SO4 with distilled water. The electrochemical measurements were carried out using Voltalab potentiostat (PGZ 301) piloted by Voltalab Master 4. To perform the EIS experiments at steady state, the stirrer rotational speed was set at 180 rpm and at a controlled temperature of 293 K using a bath thermostat.
Chemical composition of AISI 321 SS.
| Fe | Cr | Ni | Ti | Si | Mn | P | S | N |
|---|---|---|---|---|---|---|---|---|
| Balance | 17–19 | 9–12 | 0.3–0.7 | 0.75 | 2.00 | 0.045 | 0.03 | 0.10 |
Polarization curves were recorded at a constant sweep rate of 1 mV/s and the scanning range was from −600 to 1800 mV. Before the experiment, the open circuit potential of SS was studied versus time until steady state was attained. Impedance measurements were performed from 100 kHz to 0.01 Hz with a sinusoidal perturbation of 10 mV using AC signals at open circuit potential.
For Mott-Schottky analysis, samples were passivated at 0, 0.2, 0.4, and 0.6 V for 1 h and the imaginary part of the impedance was measured at a frequency of 1 kHz. The capacitance was recorded as a function of the potential. The effect of aging was studied by forming the passive film thermodynamically at different immersion times from 1 to 12 h.
3 Results and discussion
3.1 Corrosion behavior of SS and chronoamperometric curves at different potentials
The potentiodynamic polarization curves of SS in 1 m H2SO4 are shown in Figure 1. Different regions including passivation were obtained during the wide range of potential scan from −0.6 to 1.8 V. A further inspection illustrated the active-passive transition before the critical pitting potential (Ep=1000 mV vs. SCE). For the study of passive film properties, the current time potentiostatic transients for the oxide growth were recorded at different potentials selected from the passivation range (−0.29 to 1 V). The chronoamperometric measurements were conducted at each formation potential for 1 h to ensure the formation of the oxide film. Figure 2 illustrates the potentiostatic current transients for the passive film obtained at different constant anodic potentials. Transient current decreased rapidly with time before reaching the steady-state passive current density (iss) in which the steady state was established. The steady-state passive current density obtained at different anodic formation potentials is presented in Table 2.
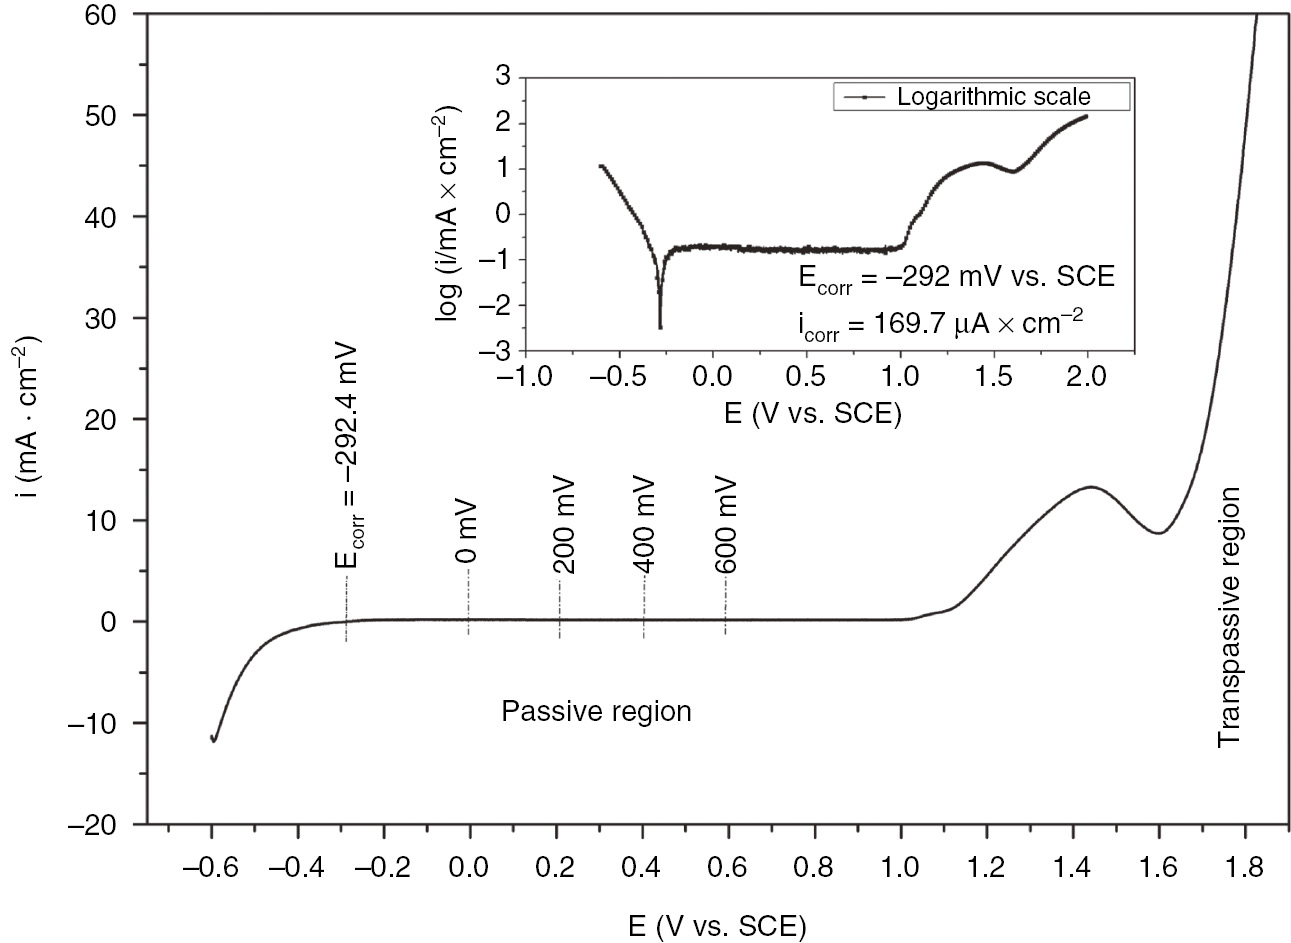
Potentiodynamic polarization curve for AISI 321 SS in 1 m H2SO4.
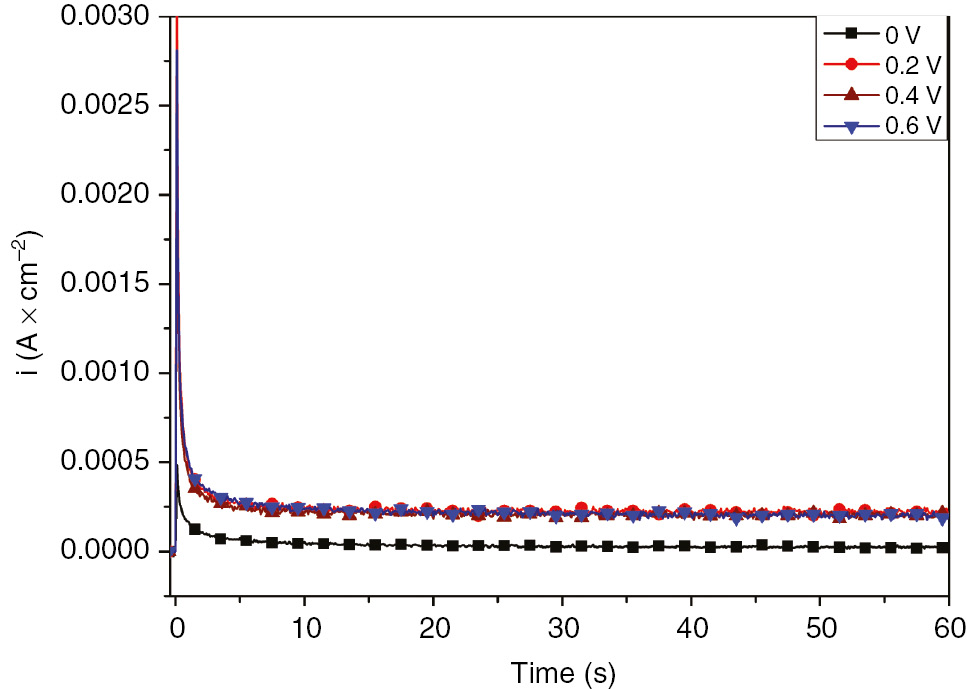
Potentiostatic current time transients for SS in 1 m H2SO4 at different anodic potentials.
Steady-state passive current density obtained from current time transient at different formation potentials for 1 h and the corresponding parameters deduced from impedance diagrams of AISI 321 SS in 1 m H2SO4.
| E (mV vs. SCE) | i ss (μA/cm2) | R s (Ω×cm2) | R ct (kΩ×cm2) | Y 0 (F×Sn−1) | n | C dl (μF×cm−2) |
|---|---|---|---|---|---|---|
| 0 | 20.10 | 1.82 | 29.33 | 95.1 | 0.886 | 272.20 |
| 200 | 206.12 | 1.71 | 35.88 | 73.05 | 0.910 | 315.07 |
| 400 | 197.67 | 1.14 | 81.47 | 32.66 | 0.940 | 83.96 |
| 600 | 200.22 | 1.06 | 185.6 | 4.28 | 0.874 | 30.34 |
3.2 EIS
The impedance spectra of SS-grown passive film in 1 m H2SO4 at different formation potentials are depicted in Figures 3 and 4. The impedance plots showed the same features for all selected formation potentials. The corresponding electrochemical parameters are summarized in Table 2. The impedance data were obtained from the experimental results fit using the equivalent circuit illustrated in Figure 3 (inset).
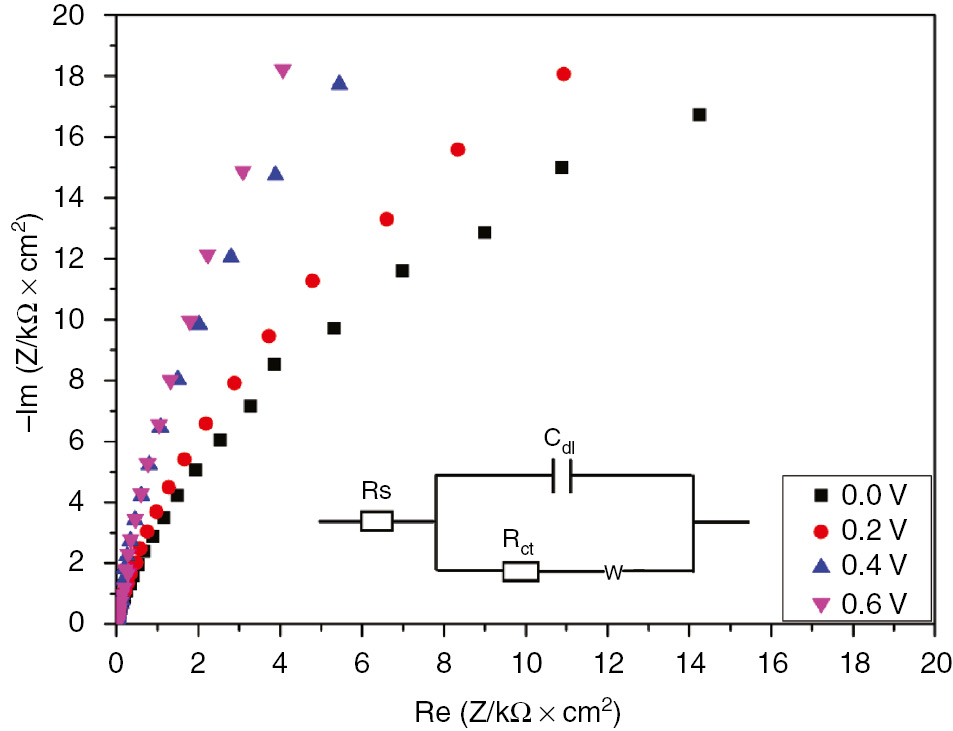
Nyquist plots for passive film growth of SS in 1 m H2SO4 at different formation potentials.
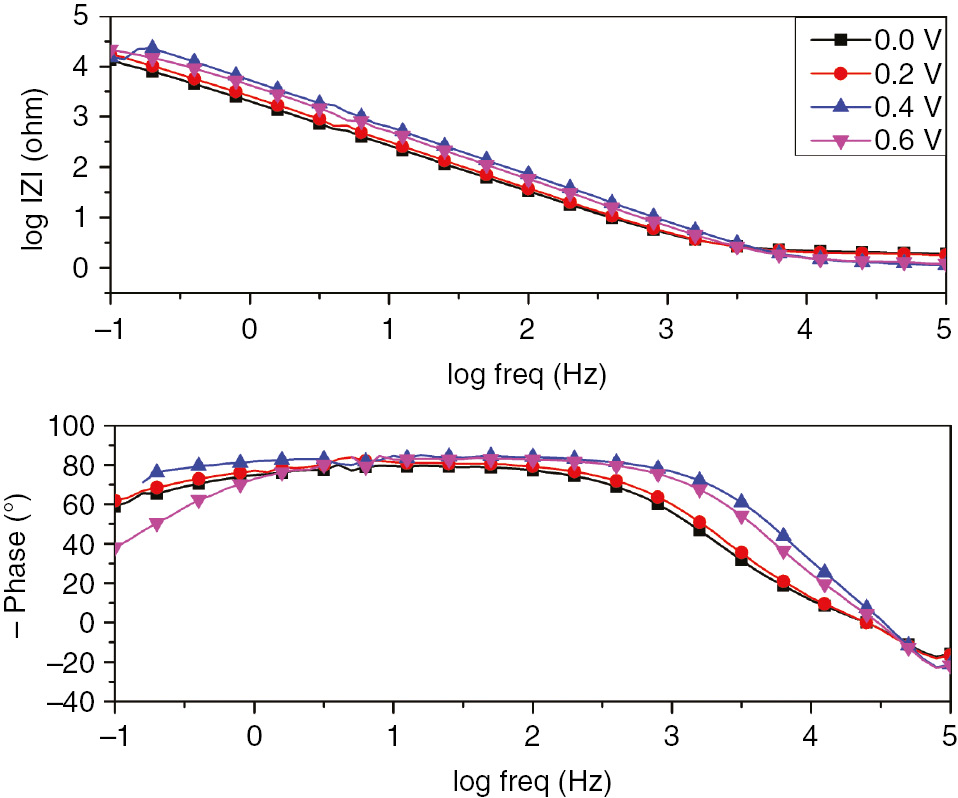
Bode plots for passive film growth of SS in 1 m H2SO4 at different formation potentials.
The double-layer capacitance can be calculated using the following formula (Popova et al., 2015):
where Y0 is the CPE constant and n is the CPE exponent related to the surface roughness and zero imperfections (Brug et al., 1984; Popova et al., 2015).
The data demonstrated the increase in charge transfer resistance with the anodic potential shift from 0 to 0.6 V. The decrease in double-layer capacitance with the anodic potential indicated the continuous growth of the passive film resulting in the decrease in the local dielectric constant of the interface (Li et al., 2014). To visualize the regions dominated by the resistive elements such as solution resistance, Bode plots of impedance data were collected for the SS passive film formed at different anodic potentials. The analysis of these data gave excellent insights on the different mechanisms or governing phenomena. This representation made it possible to identify the small impedances in the presence of large impedances. Bode plots depicted in Figure 4 exhibits about two time constants that appear to be overlapped (bell-shaped phase maximums). As a further analysis, the phase angle at middle frequencies increased with the formation potential. Generally, the time constant located at higher frequencies was related to the charge transfer process. Meanwhile, the one in the low-frequency range might be linked to the diffusion-controlled process (Li et al., 2014). As described earlier by Macdonald et al., the constant phase of impedance at lower frequencies was a result of the defect transport in the passive film due to the migration under the influence of the electric field (Sikora & Macdonald, 2002).
3.3 Effects of aging and formation potential on the semiconducting behavior of SS
The semiconductor behavior of the passive film grown on SS was studied at high-frequency domain based on the Mott-Schottky theory. The main focus was put on the effect of the formation potential and the aging on the semiconductor properties of the passive film. Mott-Schottky plots were obtained by plotting the space charge capacitances of n- and p-type semiconductor versus the electrode potential E as given by the following Mott-Schottky relationships (Fattah-alhosseini & Imantalab, 2013; Fattah-alhosseini & Vafaeian, 2016):
where e is the electron charge, ND and NA are the donor and acceptor densities (cm−3), ε is the assumed dielectric constant of the passive film (ε=12), ε0 is the vacuum permittivity (8.854×10¹⁴ F/cm), KB is the Boltzmann constant (1.38×10⁻²³ J/K), T is the absolute temperature, and EFB is the flat band potential. The interfacial capacitance of the passive film (CI) is considered to be the combination of two series capacitances: the space charge capacitance (CSC) at the barrier layer-environment interface and the double-layer capacitance (Cdl; Ahn & Kwon, 2006):
According to the Mott-Schottky theory, the double-layer capacitance could be neglected when the space charge capacitance is at least one to two orders lower than the specific double-layer capacitance (Fattah-alhosseini, 2016). Therefore, the interfacial capacitance is assumed to be equal to the space charge capacitance. This assumption is only valid with a selected frequency on the order of kHz (Fattah-alhosseini & Imantalab, 2013). The semiconductor properties of the passive film could be linked to the donor and acceptor densities determined from the slopes of the linear plots of capacitance as function of potential. These data could highlight the charge distribution in the passive layers grown at different conditions of formation. Figure 5 illustrates the semiconductor behavior of the passive film grown on SS in H2SO4 at different immersion times. These plots have almost the similar semiconducting behavior with two linear regions characteristic of different types of passive oxide layers. According to the Mott-Schottky theory, the donor density could be determined from the linear segment with the positive slope, whereas the acceptor density is obtained from the linear plot characterized by the negative slope (Fattah-alhosseini & Vafaeian, 2016). At the potential domain between 0.3 and 0.7 V, the formed passive film performs n-type semiconductor for all studied immersion times, whereas the linear plot obtained between 0.8 and 1 V is indicative of p-type semiconductor. Figure 6 shows the semiconductor behavior of the passive film at different selected formation potentials. These plots clearly display two linear regions corresponding to the n- and p-type semiconducting behaviors. Generally, the cation vacancies are the defects performing the p-type semiconductor as acceptors. However, the n-type semiconducting behavior is almost performed by oxygen vacancies and cation interstitials (Macdonald, 2012). Moreover, numerous studies have correlated the semiconducting properties of the passive film with the composition of mixed oxide films Fe2O3-Cr2O3-NiO and (Fe,Cr)2O3 as well as the predominant defect (Sugimota et al., 1993; Schmuki, 1998). It has been reported that the barrier layer on SS is commonly treated as a defective Cr2O3 layer resulting in n-type doping (Fattah-alhosseini et al., 2011a). The observed dual semiconducting behavior of the SS passive film can probably be explained by the formation n-type oxide films Fe2O3 and Fe(OH)3 in the potential range of 0.3−0.7 V, whereas p-type oxide films Fe3O4 and NiO are formed in the range between 0.8 and 1 V (Jinlong & Hongyun, 2013; BenSalah et al., 2014).
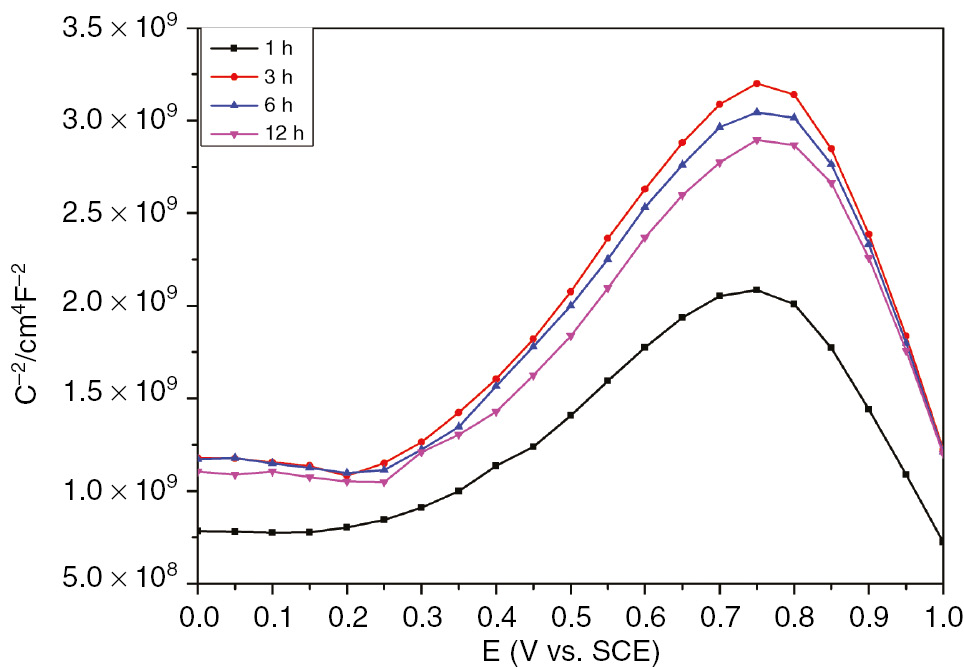
Mott-Schottky plots of passive film grown on SS in H2SO4 at different immersion times.
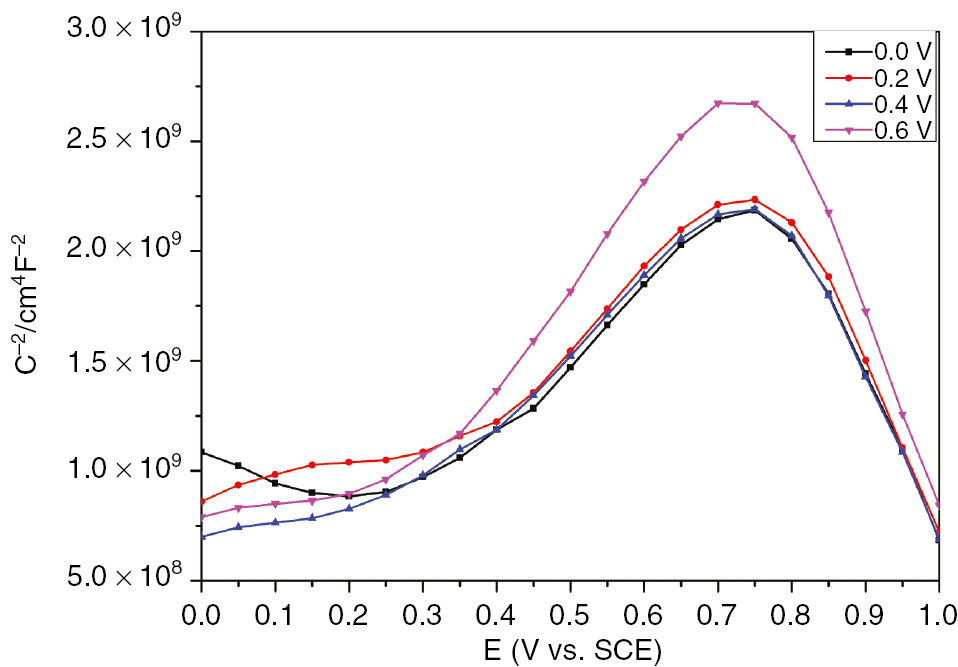
Mott-Schottky plots of passive film grown on SS in H2SO4 at different formation potentials.
Table 3 reveals that both donor and acceptor densities decrease as immersion time increases. Table 3 shows the decrease in donor and acceptor densities of the passive film with the formation potential. The obtained ND values are in the order of 3×1021 cm−3, which is in accordance with the range of donor densities determined elsewhere (Jinlong & Hongyun, 2013). The density of donor charge carriers appears to decrease exponentially with the increase in formation potential (Table 3). These results are in good agreement with the theory of the PDM described earlier by Macdonald et al. (Sikora et al., 1996). The relationship between donor density and formation potential can be studied theoretically based on the PDM, assuming that the diffusing donor defects are the oxygen vacancies (Sikora et al., 1996). The theoretical expression of ND versus E yields a good fit to the experimental results [Equation (5)].
Donor and acceptor densities for passive film formed on SS at different potentials in the passive region.
| E (V vs. SCE) | N D/1021 (cm−3) | N a/1021 (cm−3) |
|---|---|---|
| 0 | 3.35271 | 1.46804 |
| 0.2 | 3.55250 | 1.43305 |
| 0.4 | 3.24466 | 1.45735 |
| 0.6 | 2.42357 | 1.17997 |
It is well recognized that the passive film grown on SS may be described as a highly doped film exhibiting various semiconductor properties. The PDM theory is used to calculate the diffusion coefficient and the steady-state passive film thickness over the range of the anodic potential of passive film formation.
This model microscopically describes passive film growth as well as the breakdown mechanism based on the diffusion of the charge carriers (i.e. oxygen and metal vacancies imparting n- and p-type behaviors, respectively) within the passive film (Sikora et al., 1996). According to the PDM, the flux of oxygen vacancy and/or cation interstitials (Cr3+, Fe2+, and Ni2+) through the passive film is important for its growth (Fattah-alhosseini & Vafaeian, 2016). Also, the passive film is a bilayer structure made of a defective barrier layer and the outer layer is formed by the hydrolysis of cations transmitted within the barrier layer (Mao et al., 2015).
Importantly, Macdonald et al. have reported that the growth of the barrier layer into the metal is essentially related to the oxygen vacancies generated at the interface metal-barrier layer and by their annihilation at the film-solution interface (Liu & Macdonald, 2001). This latter is typically caused by injection of oxide into the barrier layer from solution. Thus, this theory has focused on the distribution and the transport mechanism of oxygen vacancies as a key parameter in describing the growth the passive films onto the metal surface. Therefore, the kinetics of the barrier layer growth could be described in terms of vacancy diffusivity (D). The kinetics of passive film growth has been described elsewhere in terms of five electrochemical reactions occurring in the barrier layer interfaces (Sikora et al., 1996).
The PDM predicts the existence of a steady state when the rates of passive film growth and breakdown are equal in which the thickness of the barrier layer is predicted to vary linearly with the formation potential (Sikora et al., 1996). The steady-state passive film thickness is calculated from capacitance measurements at frequencies above 1 kHz using the capacitance expression (Equation 4), assuming that the impedance is largely capacitive in nature (Fattah-alhosseini, 2016):
Figure 7 displays the linear relationship between the steady-state passive film thickness of the obtained experimental results and the formation potential. Table 4 shows that Lss values increase with increasing formation voltage. The passive film thickness varies from 0.350 nm at 0 mV to 0.534 nm at 600 mV. These results are highly realistic and in good agreement with the EIS data. The donor and acceptor densities for passive film formed on SS at different immersion times are listed in Table 5.
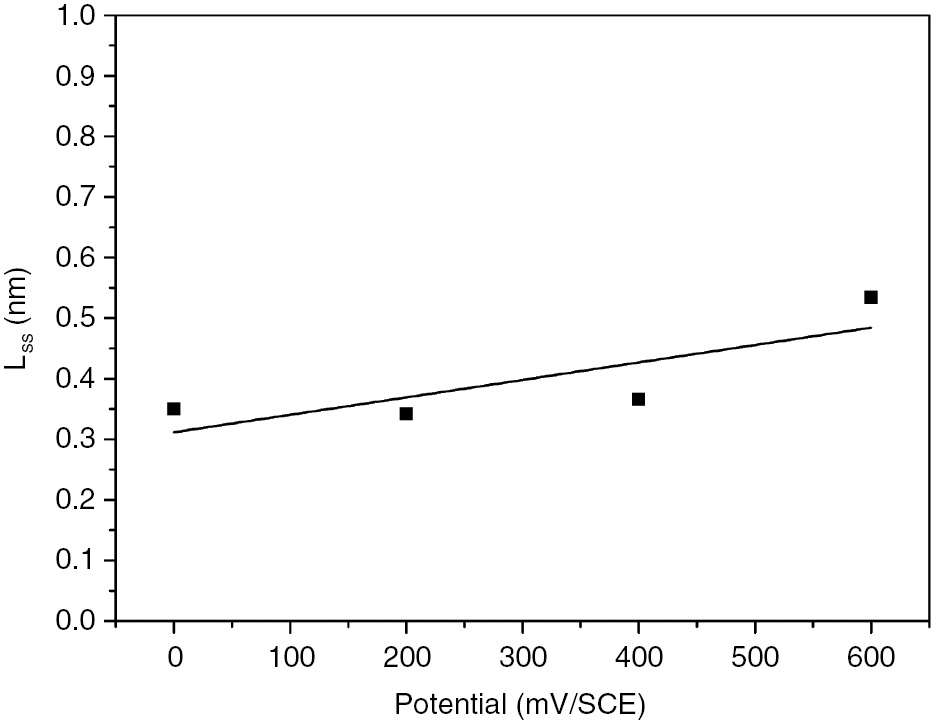
Linear relationship between the steady-state passive film thickness and the formation potential.
Steady-state passive film thickness obtained for the selected formation potentials.
| Formation potential (mV vs. SCE) | 0 | 200 | 400 | 600 |
|---|---|---|---|---|
| L ss (nm) | 0.350 | 0.342 | 0.366 | 0.534 |
Donor and acceptor densities for passive film formed on SS at different immersion times.
| Aging (h) | N D/1021 (cm−3) | N a/1021 (cm−3) |
|---|---|---|
| 1 | 3.0028 | 1.38562 |
| 3 | 1.89813 | 1.35002 |
| 6 | 1.91328 | 0.98639 |
| 12 | 1.82292 | 0.92343 |
The dependency of the donor density on the formation potential is described as given in Equation (5), where a1, b, and a2 are determined from the exponential fit of the experimental data (Sikora et al., 1996; Fattah-alhosseini, 2016):
From the exponential fit of the experimental data, the exponential relationship of ND versus E is derived as
The exponential fit of the obtained data is presented in Figure 8, and the corresponding parameters are determined as a1=−4.93×1018 cm−3 and a2=3.45×1021 cm−3.
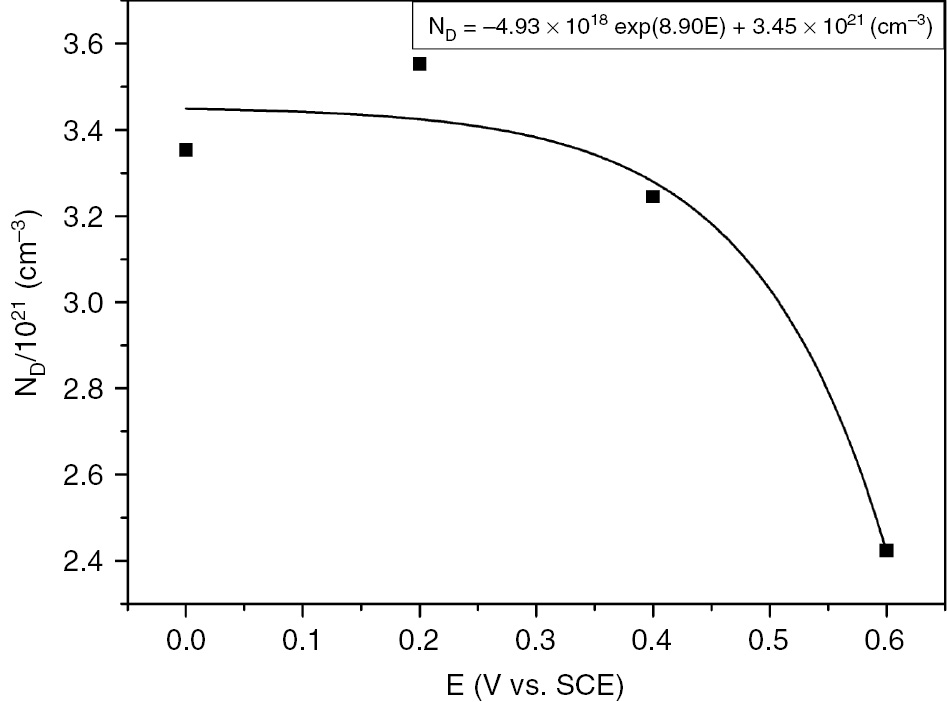
Donor density versus formation potential for the growth of passive film grown on SS in H2SO4.
The diffusion coefficient (D) is determined from the following equation:
The flux of double-charged oxygen vacancies J can be calculated as
where k is the electric field strength of the passive film, e=−1.602×10⁻¹⁹ C, R=8.314 J/mol K, F=96500C mol/e, and the iss value is given in Table 6. According to Fattah-alhosseini, k is assumed be approximately 106 V/cm for the passive film on AISI 321 in 0.5 m H2SO4. The electric field strength k could be determined from the linear relationship between steady-state thickness Lss and formation potential as described elsewhere. The substitution of all calculated parameters summarized in Table 6 in Equations (7) and (8) yields D=1.78×10⁻¹⁵ cm2/s. The calculated diffusion coefficient of oxygen vacancies through the barrier layer is in the order of that reported for the defect diffusion in the passive film of carbon steel (Bojinov et al., 2001) and that of SS in 0.5 m H2SO4 (Fattah-alhosseini, 2016).
PDM data obtained for SS passive film growth at various formation potentials.
| J 0 (vacancies/cm2×s) | K (V/cm) | a 2 (cm−3) | i ss (A×cm−2) | D (cm2/s) |
|---|---|---|---|---|
| 4.87×10¹⁴ | 106 | 3.45×10²¹ | 156×10−6 | 1.78×10⁻¹⁵ |
3.4 Kinetic study of passive film growth and the early stages of pitting process
The current time transients are obtained by polarizing the SS electrode at different anodic potentials Ea selected from the polarization curve. The potentiodynamic polarization (Figure 1) shows the existence of a critical potential Ep shown to be 1 V in which the nucleation of the first pits starts. To describe the kinetic behavior of passive film growth and pitting process in the vicinity of the pitting potential, chronoamperometric curves were recorded for 5 min at each selected anodic potential ranging from 1 to 1.9 V. To account for the early stages of passive film growth, the current time transients of passive film growth and pitting were given within the first 20 s of i/t transient measurement. Figure 9 reveals that, for potentials Ea<1300 mV, the overall transient current decreases rapidly to reach a steady current density value. The decrease could be attributed to the growth of the passive film. For the polarization at constant anodic potential Ea>1200 mV, the current transient decreases to a minimum value Im corresponding to the induction time ti before rising steadily with elapse of time. This continuous rise is due to the growth of the pits already initiated. The experimental results of passive film growth are fitted to the Macdonald model [Equation (10)] (Chen et al., 2009; Albrimi et al., 2011).
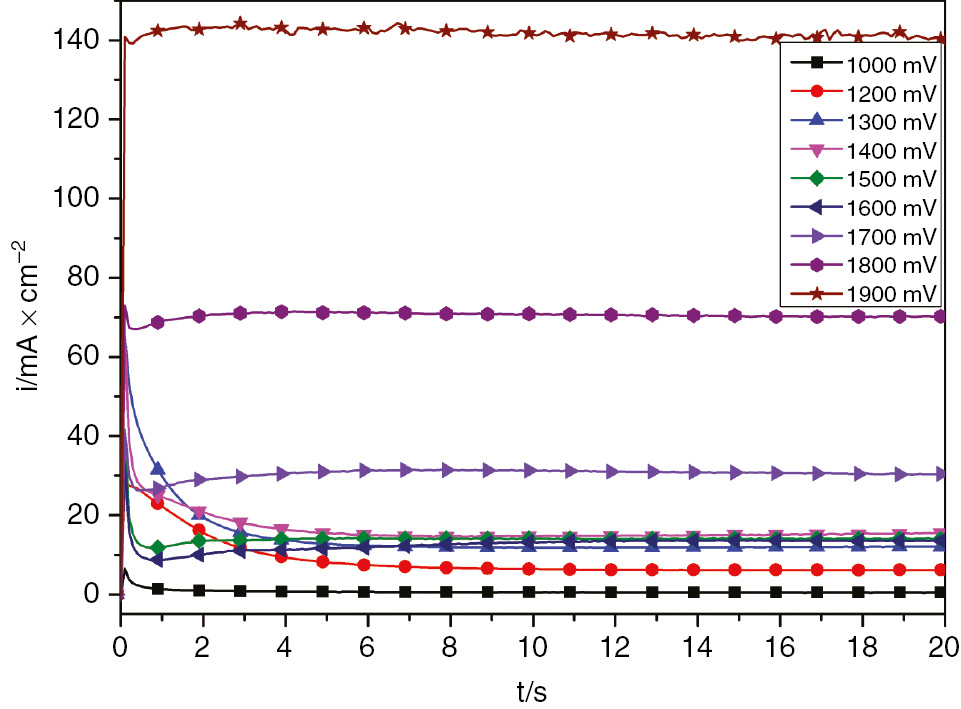
Linear scale of chronoamperometric plots for SS in H2SO4 obtained at different anodic potentials.
This model is based on the existence and migration of defects in the film-solution interface under the effect of a local electric field. This migration depends on the applied potential and pH of the solutions and is only applicable for thin layers (Chao et al., 1981):
where i represents the current density of SS in 1 m H2SO4. A and n are constants depending on the constant anodic potential and the electrolyte concentration, respectively. n constant yields the rate of passive film growth and is given by the first slope of the descending transient current as depicted in Figure 10. The derived parameters listed in Table 7 demonstrate that passive film growth is slowed down with the increase in anodic potential. Also, the minimum attained steady-state transient current increases with potential shift in the positive direction. The continuous increase in transient current after reaching the induction time could be described by Engell Stolica equation [Equation (10)] (Chen et al., 2009; Albrimi et al., 2011):
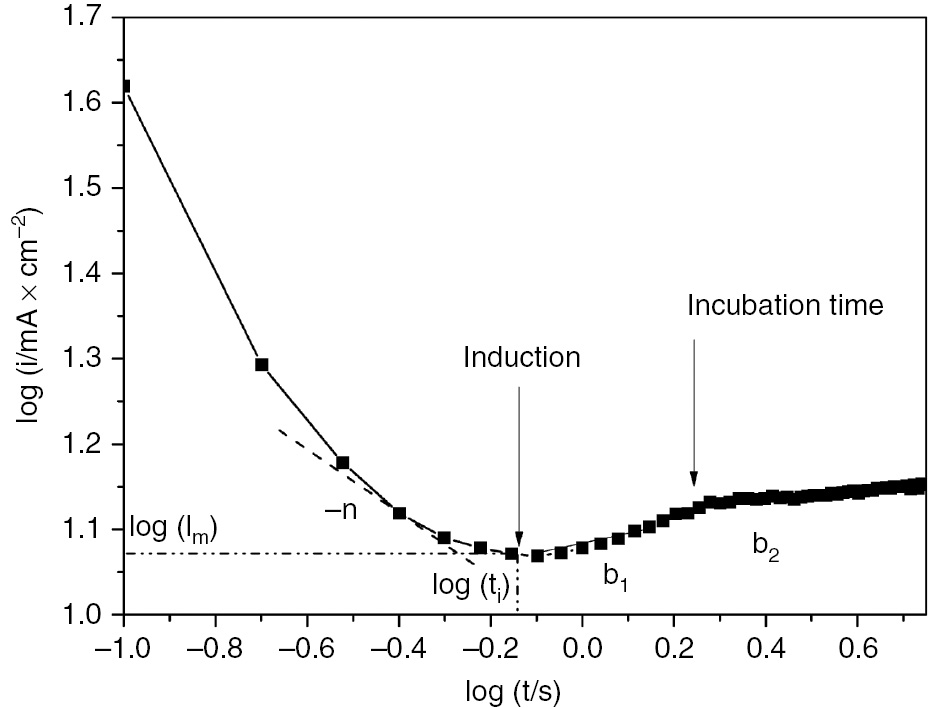
Kinetic parameter determination from logarithmic scale of current transients.
Kinetic parameters for polarized SS in H2SO4 at different potentials.
| E (mV vs. SCE) | n | b 1 | b 2 | ti − 1 (s−1) | Im (mA×cm−2) |
|---|---|---|---|---|---|
| 1000 | 0.45 | – | – | 0.0064 | 0.28 |
| 1200 | 0.72 | – | – | 0.08 | 6.32 |
| 1300 | 0.56 | – | – | 0.10 | 11.47 |
| 1400 | 0.33 | 0.05 | – | 0.11 | 14.50 |
| 1500 | 0.51 | 0.179 | 0.044 | 1.25 | 11.53 |
| 1600 | 0.39 | 0.137 | 0.117 | 1.53 | 7.82 |
| 1700 | 0.25 | 0.118 | 0.068 | 2.40 | 26.18 |
| 1800 | 0.008 | 0.038 | 0.025 | 2.50 | 66.85 |
| 1900 | – | 0.025 | 0.015 | 3.33 | 139.20 |
where B and b are constants depending on the anodic potential of polarization and the electrolyte concentration.
Figure 10 illustrates the graphical determination of the kinetic parameters for passive film growth and pitting stages. The slopes b1 and b2 of the straight lines located after the induction time correspond to the pit initiation and pit propagation, respectively. The reciprocal incubation time (ti−1) corresponds to the rate of pit initiation. As displayed in Figure 11, the overall current density is given by three contributions, e.g. passive film growth, pit initiation, and growth of metastable pits. Figure 11 illustrates the chronoamperometric plots in logarithmic scale for SS in H2SO4 recorded at different anodic potentials and the derived kinetic parameters are summarized in Table 7. It is worth noting that the different regions corresponding to the early stages of passive growth and pit propagation are clearly distinguished in logarithmic scale. It is clearly seen from Table 7 that the rate of pit initiation increases when the formation potential shifts in the positive direction. This indicates that higher anodic potential stimulates the initiation of pitting corrosion of SS in H2SO4. The induction time is shortened with the polarization at more positive anodic potentials.
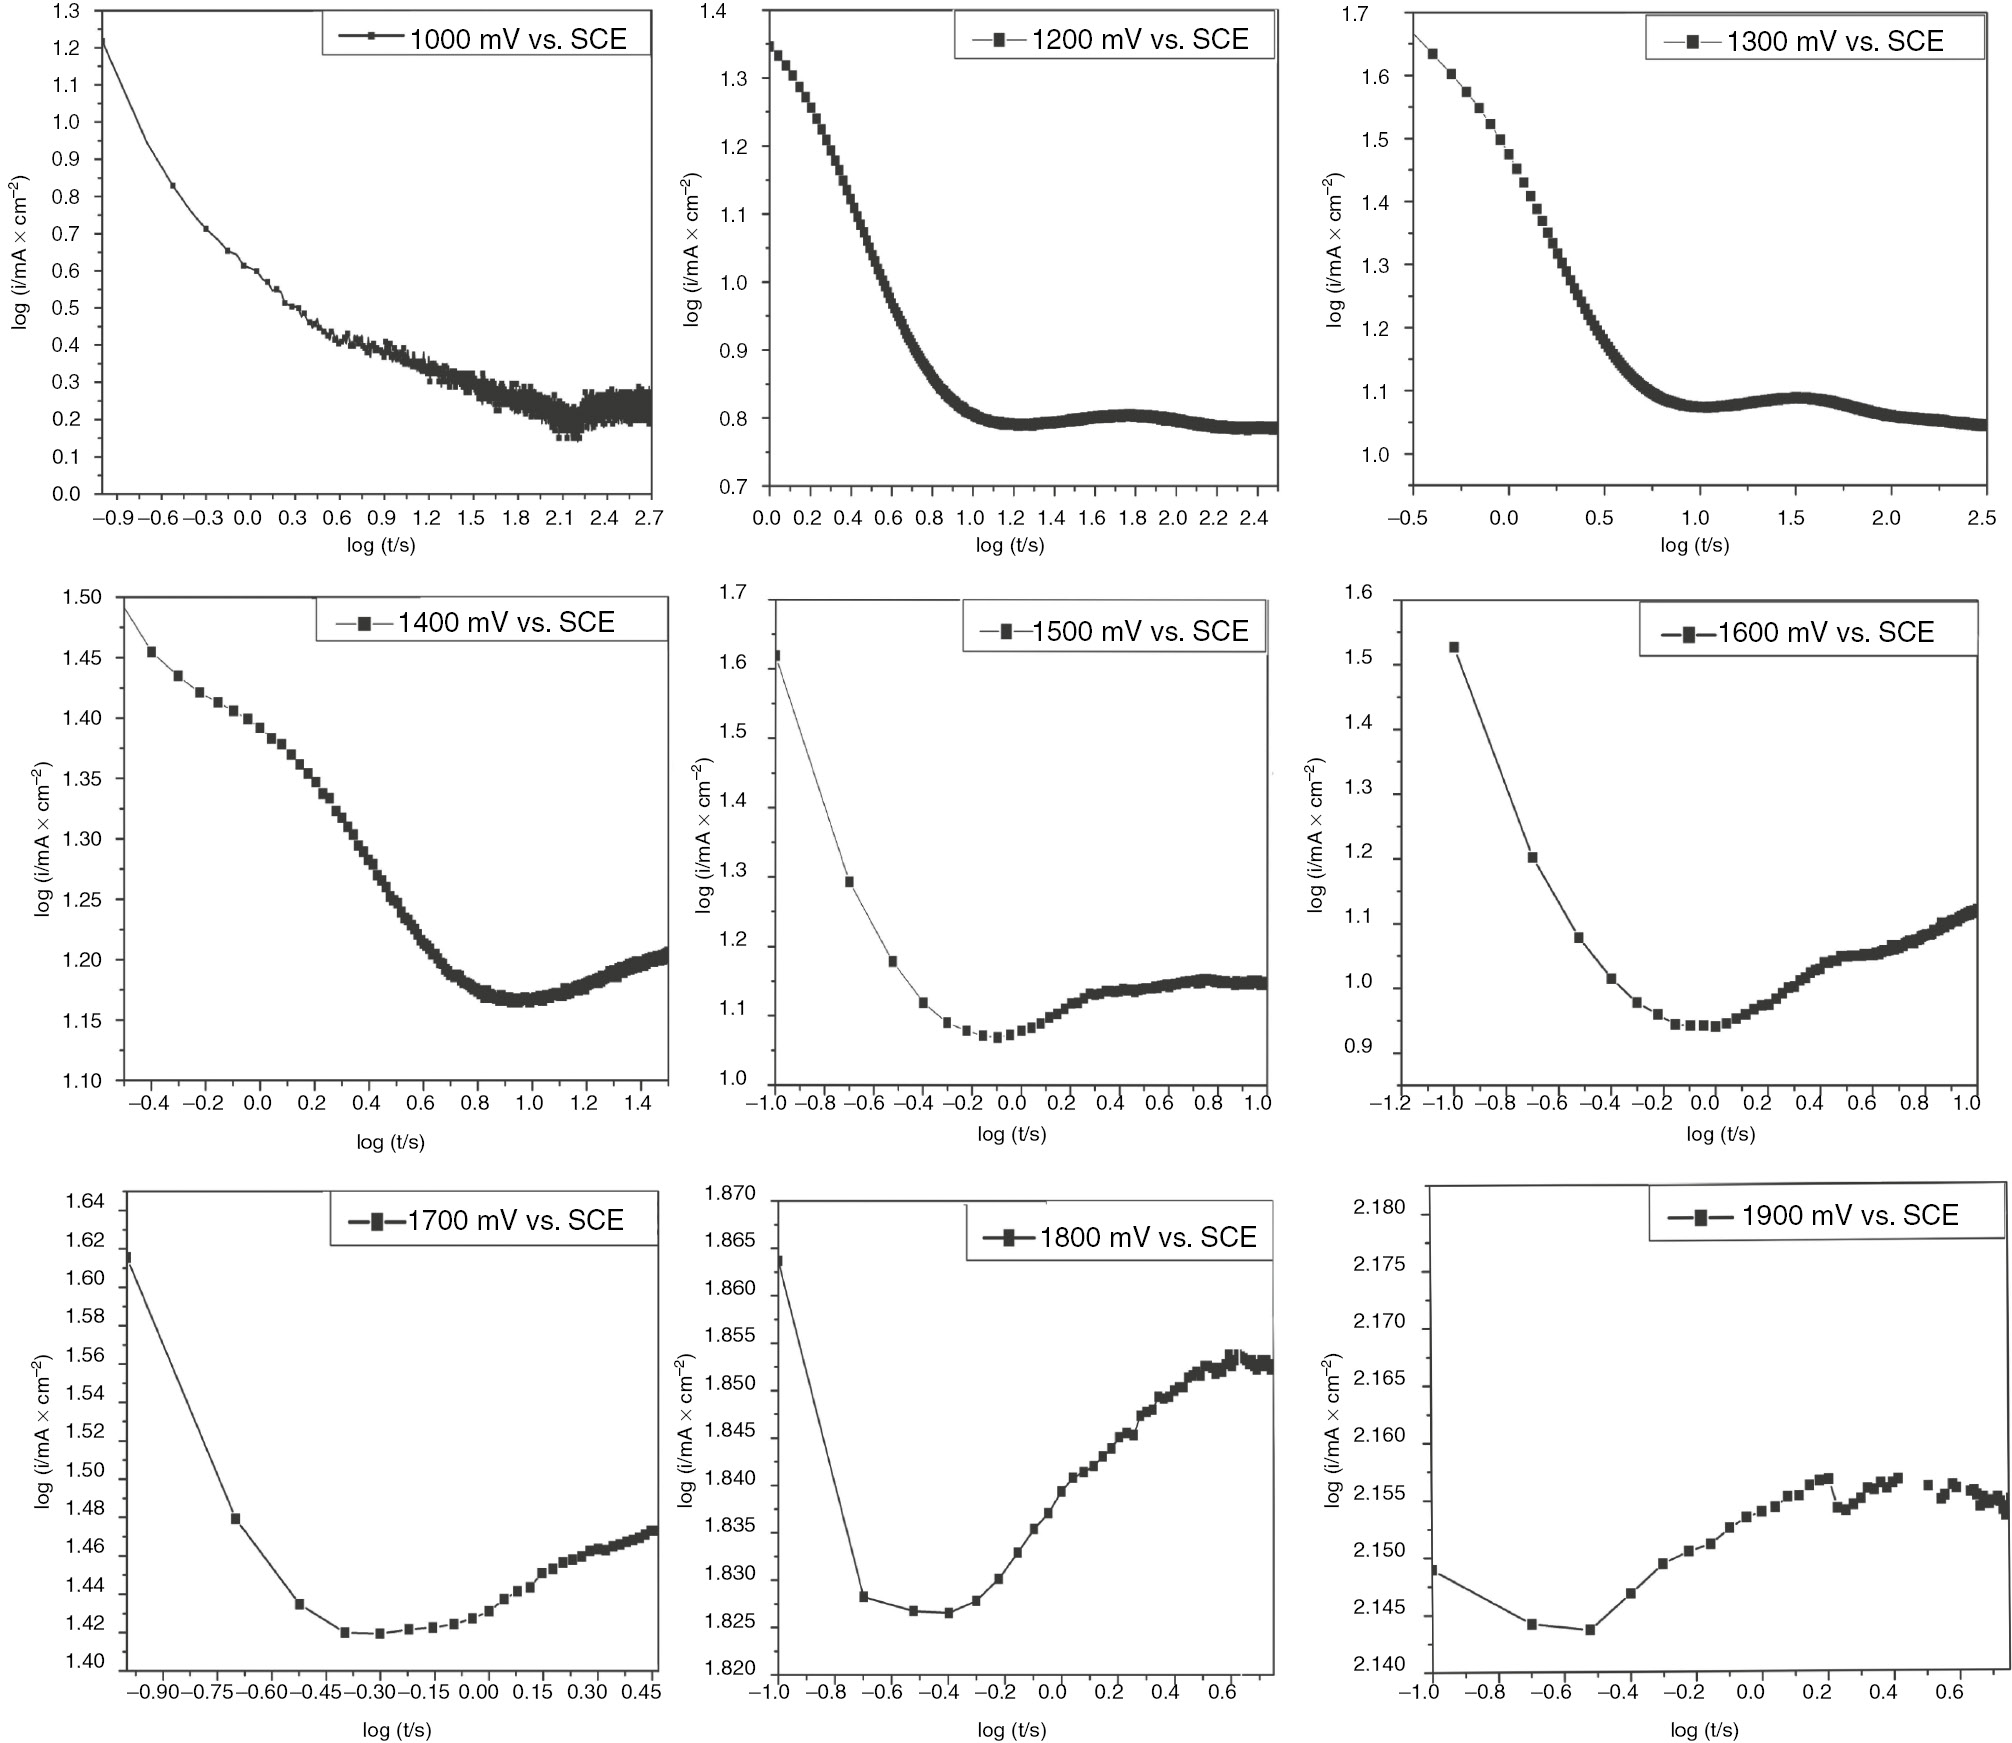
Logarithmic scale of current transients for polarized SS in H2SO4 at different potentials.
3.5 Morphological analysis
The surface morphology of SS polarized at different anodic potentials has been scanned using scanning electron microscopy (SEM) as depicted in Figure 12. For 1900 mV, the SS surface seems to be highly pitted. For lower potentials ranging from 1200 to 1700 mV, the pitting corrosion is initiated at multiple sites on the metal surface, but only few stable pits are able to propagate. For 1800 and 1900 mV, the lateral growth of some broad pits produced by coalescence of the neighboring pits is clearly observed. However, it is clearly seen that, at 1500 mV, the surface appears to have some covered pits with the corrosion products indicating the first stage of transition from metastable pits to the stable phase. The stable growth of the pits is necessary stimulated by the formation of the corrosion product on the pit. The propagation of pits is kinetically promoted with the formation of corrosion products that prevent the oxygen diffusion inside the pit and hinder the subsequent repassivation. Also, for higher potentials, the pits are grown in depth by increasing the applied voltage and have attained the incubation period that makes them visible. Furthermore, the pitting frequency yielding the number of pits per surface area has been increased with the increase in the applied voltage. It could be concluded that the stability of the created pits is likely to be induced by the higher applied voltage. Generally, the growth of stable pits is diffusion controlled, with the diffusion barrier provided by the pit depth (Burstein et al., 1993). Also, Figure 12 shows that the corrosion products in the vicinity of the pits are likely to be removed at more anodic potentials. The openness of the pits is highly promoted with the increase in the applied potential. These statements are in good agreement with the results of Tian et al. (2015).
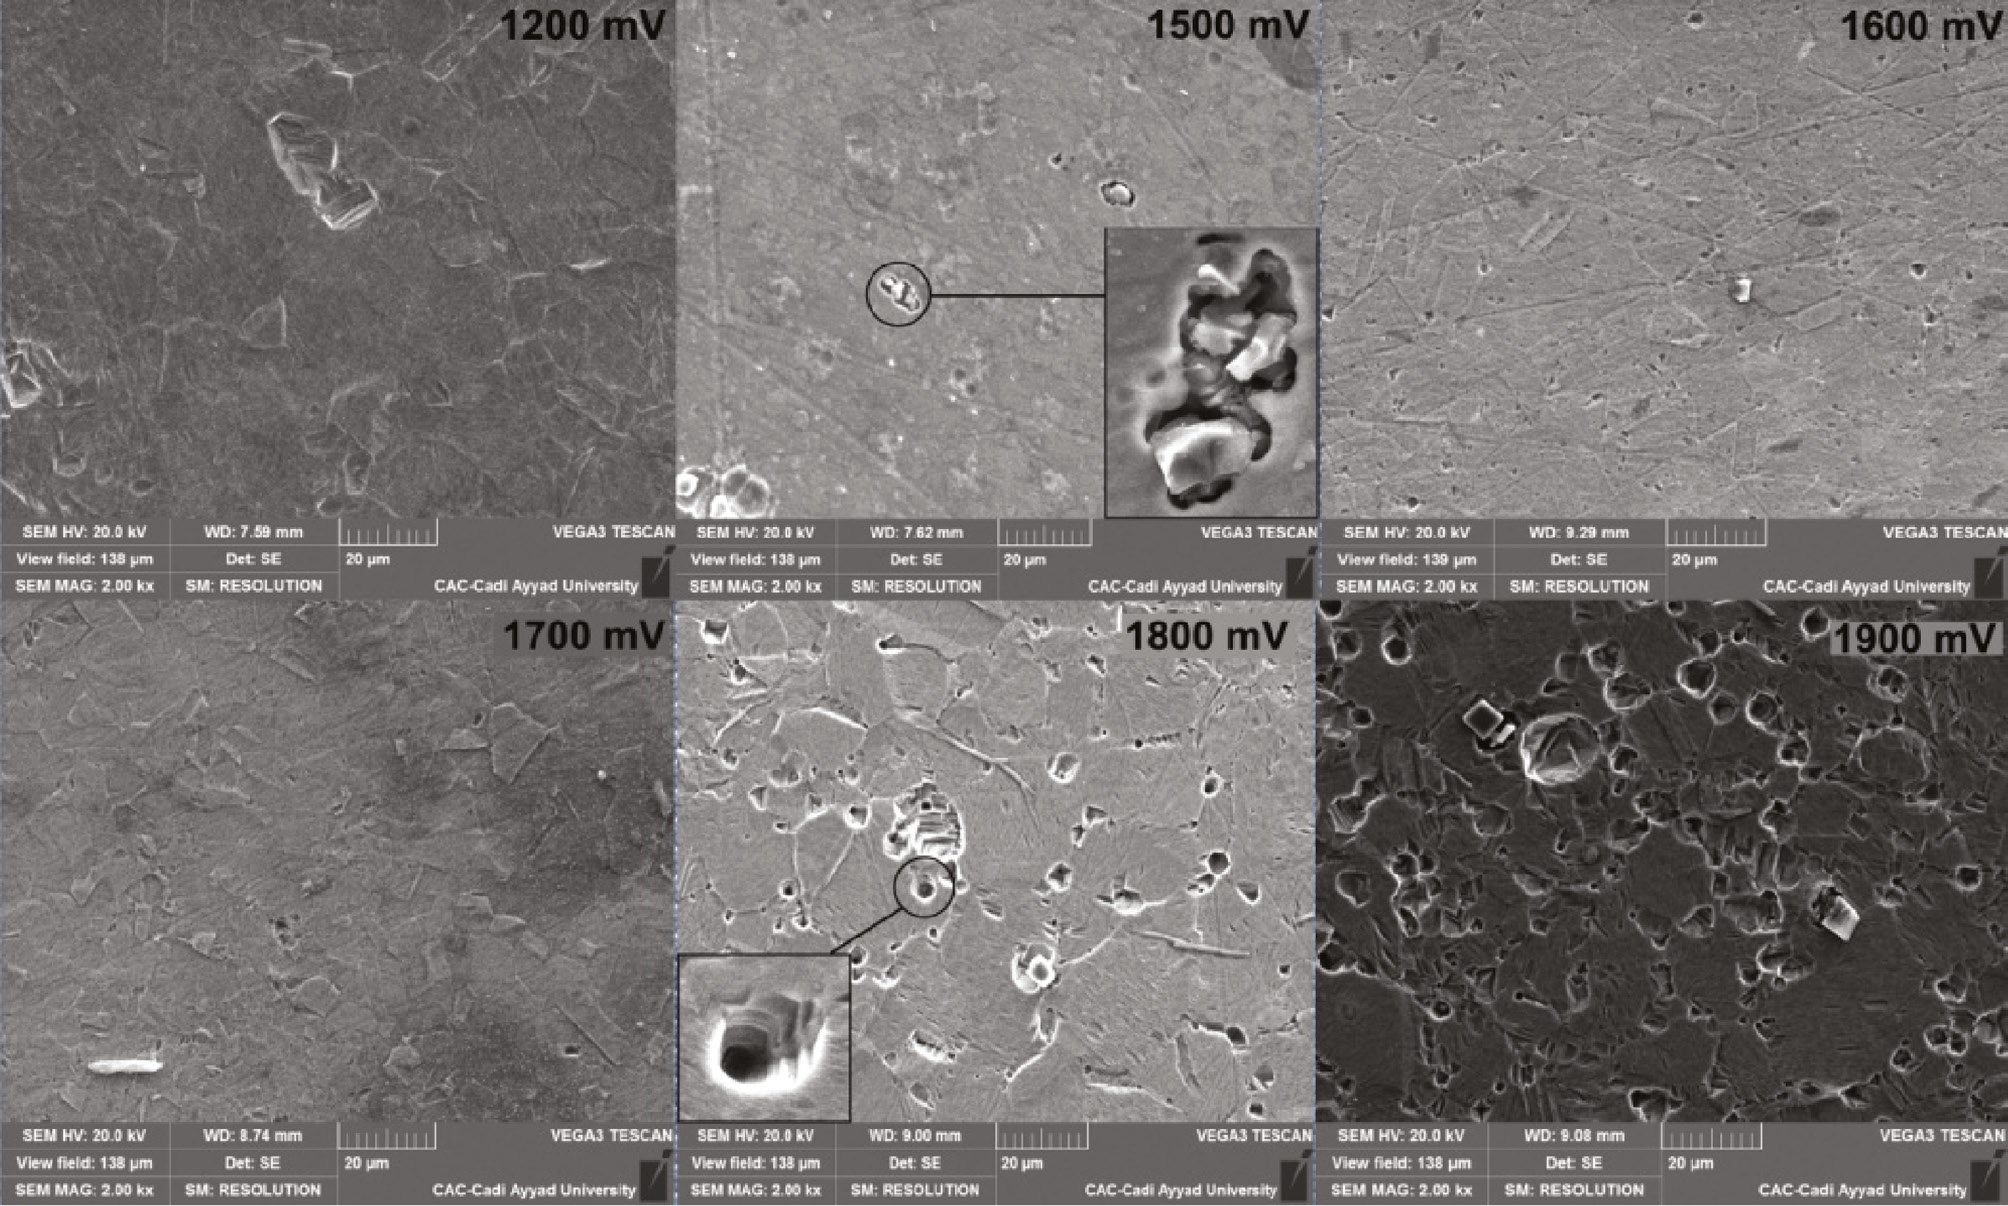
Morphological analysis for polarized SS at different anodic potentials.
4 Conclusions
The effects of aging and formation potential on the semiconducting properties of the formed passive film were investigated. Also, the kinetics of passive film growth and the early stages of pitting corrosion of SS were thoroughly assessed at different applied potentials. The following conclusions could be drawn:
The potentiodynamic polarization curve of SS shows a wide passive range in 1 m H2SO4 at 293 K.
Nyquist plots of the SS passive film in H2SO4 reveal the increase of the charge transfer resistance with the increase in the formation potential.
From the impedance data, the steady-state passive film thickness increases linearly with the increase in the formation potential. The passive film thickness varies from 0.350 nm at 0 mV to 0.534 nm at 600 mV. These findings are in good agreement with charge transfer resistance values.
Mott-Schottky analysis showed a dual semiconducting behavior of SS passive film that could be due to the formation of n-type oxide films such as Fe2O3 and Fe(OH)3 in the potential range of 0.3–0.7 V and p-type oxide films such as Fe3O4 and NiO formed in the range between 0.8 and 1 V.
Both donor and acceptor densities decrease with increasing immersion time. Donor density in the passive film decreases exponentially with increasing formation potential.
The kinetics of barrier layer growth has been described in terms of the PDM and the vacancy diffusivity has been determined. The calculated diffusion coefficient of oxygen vacancies through the barrier layer is in the range of 1.86×10⁻⁹ cm2/s.
The kinetic parameters determined from current transients indicate the decrease in the rate of passive film growth and the increase in the rate of pit initiation as the applied voltage tends toward more positive values.
SEM analysis shows that the polarization at higher anodic potentials promote the coalescence of the neighboring pits and the increase in the pitting frequency.
Acknowledgments
The authors gratefully acknowledge the help provided by the Center of Analysis and Characterization at Cady Ayyad University, Marrakech, Morocco.
-
Data availability statement: The authors confirm that the data supporting the findings of this study are available within the manuscript.
References
Ahn S, Kwon H. Diffusivity of point defects in the passive film on Fe. In: Passivation of metals and semiconductors, and properties of thin oxide layers. Elsevier, 2006: 311–316.10.1016/B978-044452224-5/50050-0Suche in Google Scholar
Albrimi YA, Souto RM, Eddib A, Douch J, Berghoute Y, Hamdani M. Electrochemical behaviour of AISI 316 austenitic stainless steel in acidic media containing chloride ions. Int J Electrochem Sci 2011; 6: 4614–4627.10.1016/S1452-3981(23)18352-0Suche in Google Scholar
BenSalah M, Sabot R, Triki E, Dhouibi L, Refait Ph, Jeannin M. Passivity of Sanicro28 (UNS N-08028) stainless steel in polluted phosphoric acid at different temperatures studied by electrochemical impedance spectroscopy and Mott-Schottky analysis. Corros Sci 2014; 86: 61–70.10.1016/j.corsci.2014.04.056Suche in Google Scholar
Bojinov M, Laitinen T, Mäkelä K, Saario T. Conduction mechanism of the passive film on iron based on contact electric impedance and resistance measurements. J Electrochem Soc 2001; 148: B243.10.1149/1.1371976Suche in Google Scholar
Brug GJ, van den Eeden ALG, Sluyters-Rehbach M, Sluyters JH. The analysis of electrode impedances complicated by the presence of a constant phase element. J Electroanal Chem Interfacial Electrochem 1984; 176: 275–295.10.1016/S0022-0728(84)80324-1Suche in Google Scholar
Burstein GT, Pistorius PC, Mattin SP. The nucleation and growth of corrosion pits of stainless steel. Corros Sci 1993; 35: 57–62.10.1016/0010-938X(93)90133-2Suche in Google Scholar
Chao CY, Lin LF, Macdonald DD. A point defect model for anodic passive films. J Electrochem Soc 1981; 128: 1187.10.1149/1.2127591Suche in Google Scholar
Castle JE, Clayton CR. The use of in the x-ray photo-electron spectroscopy analyses of passive layers on stainless steel. Corros Sci 1977; 17: 7–26.10.1016/0010-938X(77)90036-1Suche in Google Scholar
Cahan BD, Chen C-T. The nature of the passive film on iron. J Electrochem Soc 1982; 129: 921.10.1149/1.2124053Suche in Google Scholar
Chen Y, Lobo RFM, Santos DMF, Sequeira CAC. Kinetic measurements during transient film growth on zinc. Quím Nova 2009; 32: 387–390.10.1590/S0100-40422009000200022Suche in Google Scholar
Cheng X, Li X, Yang L, Du C. Corrosion resistance of 316L stainless steel in acetic acid by EIS and Mott-Schottky. J Wuhan Univ Technol Mater Sci Ed 2008; 23: 574–578.10.1007/s11595-006-4574-0Suche in Google Scholar
Elsa LG. Passivité et rupture de passivité de l’acier 304L en milieu acide nitrique concentré et chaud. Thesis, Université Pierre et Marie Curie Ecole, 2014.Suche in Google Scholar
Fattah-alhosseini A. Passivity of AISI 321 stainless steel in 0.5M H2SO4 solution studied by Mott-Schottky analysis in conjunction with the point defect model. Arab J Chem 2016; 9: S1342–S1348.10.1016/j.arabjc.2012.02.015Suche in Google Scholar
Fattah-alhosseini A, Vafaeian S. Influence of grain refinement on the electrochemical behavior of AISI 430 ferritic stainless steel in an alkaline solution. Appl Surf Sci 2016; 360: 921–928.10.1016/j.apsusc.2015.11.085Suche in Google Scholar
Fattah-alhosseini A, Imantalab O. The electrochemical behavior of AISI 321 stainless steel in alkaline media. Int J ISSI 2013; 10: 7–13.Suche in Google Scholar
Fattah-alhosseini A, Soltani F, Shirsalimi F, Ezadi B, Attarzadeh N. The semiconducting properties of passive films formed on AISI 316 L and AISI 321 stainless steels: a test of the point defect model (PDM). Corros Sci 2011a; 53: 3186–3192.10.1016/j.corsci.2011.05.063Suche in Google Scholar
Fattah-alhosseini A, Taheri Shoja S, Heydari Zebardast B, Mohamadian Samim P. An electrochemical impedance spectroscopic study of the passive state on AISI 304 stainless steel. Int J Electrochem 2011b; 2011: 1–8.10.4061/2011/152143Suche in Google Scholar
Fattah-alhosseini A, Sonamia MA, Loghmani A, Zerafati Shoja F. Passivity of AISI 316L stainless steel as a function of nitric concentration. J Adv Mater Process 2014; 2: 21–30.Suche in Google Scholar
Feng X, Shi R, Zhang L, Xu Y, Zhang X, Zhang J, Ding Y, Chen D, Ju N, Zhang X. Degradation of passive film on low-nickel stainless steel in groundwater with different concentration of chloride ions. Int J Electrochem Sci 2018; 13: 2745–2757.10.20964/2018.03.41Suche in Google Scholar
Feng Z, Cheng X, Dong C, Xu L, Li X. Passivity of 316L stainless steel in borate buffer solution studied by Mott-Schottky analysis, atomic absorption spectrometry and X-ray photoelectron spectroscopy. Corros Sci 2010; 52: 3646–3653.10.1016/j.corsci.2010.07.013Suche in Google Scholar
Hakiki NE. Semiconducting properties of passive films formed on stainless steels. J Electrochem Soc 1998; 145: 3821.10.1149/1.1838880Suche in Google Scholar
Hakiki NB, Boudin S, Rondot B, Da Cunha Belo M. The electronic structure of passive films formed on stainless steels. Corros Sci 1995; 37: 1809–1822.10.1016/0010-938X(95)00084-WSuche in Google Scholar
Jinlong L, Hongyun L. Comparison of corrosion properties of passive films formed on phase reversion induced nano/ultrafine-grained 321 stainless steel. Appl Surf Sci 2013; 280: 124–131.10.1016/j.apsusc.2013.04.108Suche in Google Scholar
Kim JJ, Young YM. Study on the passive film of type 316 stainless steel. Int J Electrochem Sci 2013; 8: 11847–11859.10.1016/S1452-3981(23)13227-5Suche in Google Scholar
Klapper HS, Goellner J, Burkert A, Heyn A. Environmental factors affecting pitting corrosion of type 304 stainless steel investigated by electrochemical noise measurements under potentiostatic control. Corros Sci 2013; 75: 239–247.10.1016/j.corsci.2013.06.005Suche in Google Scholar
Koumya Y, Idouhli R, Sayout A, Abouelfida A, Benyaich A, Romane A. Experimental and theoretical approach on the enhanced inhibitory effect of tetracyclic triterpenes for stainless steel corrosion in sulfuric acid. Metallurg Mater Trans A 2019; 50: 3002–3012.10.1007/s11661-019-05191-3Suche in Google Scholar
Krishnamurthy B, White RE, Ploehn HJ. Simplified point defect model for growth of anodic passive films on iron. Electrochim Acta 2002; 47: 3375–3381.10.1016/S0013-4686(02)00274-8Suche in Google Scholar
Li DG, Wang JD, Chen DR, Liang P. Influences of pH value, temperature, chloride ions and sulfide ions on the corrosion behaviors of 316L stainless steel in the simulated cathodic environment of proton exchange membrane fuel cell. J Power Sources 2014; 272: 448–456.10.1016/j.jpowsour.2014.06.121Suche in Google Scholar
Liu J, Macdonald DD. The passivity of iron in the presence of ethylenediaminetetraacetic acid. II. The defect and electronic structures of the barrier layer. J Electrochem Soc 2001; 148: B425–B430.10.1149/1.1404967Suche in Google Scholar
Macdonald DD. The history of the point defect model for the passive state: a brief review of film growth aspects. Electrochim Acta 2011; 56: 1761–1772.10.1016/j.electacta.2010.11.005Suche in Google Scholar
Macdonald DD. Some personal adventures in passivity—a review of the point defect model for film growth. Russ J Electrochem 2012; 48: 235–258.10.1134/S1023193512030068Suche in Google Scholar
Macdonald DD, Urquidi-Macdonald M. Theory of steady-state passive films. J Electrochem Soc 1990; 137: 2395–2402.10.1149/1.2086949Suche in Google Scholar
Mao F, Dong C, Macdonald DD. Effect of octadecylamine on the corrosion behavior of type 316SS in acetate buffer. Corros Sci 2015; 98: 192–200.10.1016/j.corsci.2015.05.022Suche in Google Scholar
Marcus P, Grimal JM. The anodic dissolution and passivation of NiCrFe alloys studied by ESCA. Corros Sci 1992; 33: 805–814.10.1016/0010-938X(92)90113-HSuche in Google Scholar
Maurice V. XPS and STM study of passive films formed on Fe-22Cr(110) single-crystal surfaces. J Electrochem Soc 1996; 143: 1182.10.1149/1.1836616Suche in Google Scholar
Paulraj P, Garg R. Effect of intermetallic phases on corrosion behavior and mechanical properties of duplex stainless steel and super-duplex stainless steel. Adv Sci Technol Res J 2015; 9: 87–105.10.12913/22998624/59090Suche in Google Scholar
Peng H. Composition chimique et nanostructure des films passifs formés sur acier inoxydable austénitique – Effet du molybdène. Thése, Université Pierre et Marie Curie, 2015.Suche in Google Scholar
Pistorius PC, Burstein GT. Metastable pitting corrosion of stainless steel and the transition to stability. Philos Trans R Soc A Math Phys Eng Sci 1992; 341: 531–559.10.1098/rsta.1992.0114Suche in Google Scholar
Popova A, Christov M, Vasilev A. Mono- and dicationic benzothiazolic quaternary ammonium bromides as mild steel corrosion inhibitors. Part III: Influence of the temperature on the inhibition process. Corros Sci 2015; 94: 70–78.10.1016/j.corsci.2015.01.039Suche in Google Scholar
Schmuki P. Electrochemical behavior of Cr2O3/Fe2O3 artificial passive films studied by in situ XANES. J Electrochem Soc 1998; 145: 791.10.1149/1.1838347Suche in Google Scholar
Sikora E, Macdonald DD. Nature of the passive film on nickel. Electrochim Acta 2002; 48: 69–77.10.1016/S0013-4686(02)00552-2Suche in Google Scholar
Sikora E, Sikora J, Macdonald DD. A new method for estimating the diffusivities of vacancies in passive films. Electrochim Acta 1996; 41: 783–789.10.1016/0013-4686(95)00312-6Suche in Google Scholar
Soltis J. Passivity breakdown, pit initiation and propagation of pits in metallic materials — review. Corros Sci 2015; 90: 5–22.10.1016/j.corsci.2014.10.006Suche in Google Scholar
Sugimota K, et al. Corrosion resistance of artificial passivation films of Fe2O3-Cr2O3-NiO formed by metalorganic chemical vapor deposition. J Electrochem Soc 1993; 140: 1586–1592.10.1149/1.2221606Suche in Google Scholar
Tian W, Li S, Du N, Chen S, Wu Q. Effects of applied potential on stable pitting of 304 stainless steel. Corros Sci 2015; 93: 242–255.10.1016/j.corsci.2015.01.034Suche in Google Scholar
Yue Y, Liu C, Asselin E, Shi P, Jiang M. Kinetics of passive film growth on 304 stainless steel in H2SO4 pickling solution under chemical oxidation. Corrosion 2018; 74: 705–714.10.5006/2680Suche in Google Scholar
Zakeri M, Moayed MH. Investigation on the effect of nitrate ion on the critical pitting temperature of 2205 duplex stainless steel along a mechanistic approach using pencil electrode. Corros Sci 2014; 85: 222–231.10.1016/j.corsci.2014.04.021Suche in Google Scholar
©2020 Walter de Gruyter GmbH, Berlin/Boston
Artikel in diesem Heft
- Frontmatter
- Reviews
- Localized corrosion and stress corrosion cracking of stainless steels in halides other than chlorides solutions: a review
- Corrosion behavior of titanium alloys in acidic and saline media: role of alloy design, passivation integrity, and electrolyte modification
- Environment-assisted corrosion damage of steel bridges: a conceptual framework for structural integrity
- Applications of nanomaterials in corrosion protection coatings and inhibitors
- Original article
- Semiconducting behavior and kinetics of passive film growth on AISI 321 stainless steel in sulfuric acid
- Corrigendum
- Corrigendum to: Hydrogen effects on mechanical performance of nodular cast iron