
A Theoretical Analysis of Collusion Involving Technology Licensing Under Diseconomies of Scale
-
Ted Lindblom
 und
Stefan Sjögren
und
Stefan Sjögren

Abstract
This study focuses on firms with cost-efficient technology that use licensing to influence product market behaviour, market prices and outputs and the resulting welfare effects. We show how licensing fees can be constructed that lead to identical collective industry outputs as under collusion while industry output is equal to or higher than that achieved under competition and sustained in equilibrium. Hence, consumers are either indifferent to firms’ collusion or better off when they do collude, whereas firms (producers) are always better off due to the improved cost efficiency of integrating the new production technology. This provides a theoretical foundation that explains why technology licensing is observed in highly concentrated industries characterised by significant diseconomies of scale relative to demand. We contribute to the literature by demonstrating how technology licensing involving collusion can reduce the dissipation effect and improve social welfare in oligopolistic industries. An important policy implication is that collusion involving technology licensing should not always be challenged by antitrust authorities, particularly when it does not transfer welfare from consumers to producers.
1 Introduction
We examine the potential role of technology licensing as a tool to facilitate cartelisation among competing firms and how this affects product market behaviour, market prices, outputs and welfare in a highly concentrated industry characterised by diseconomies of scale.[1]
Why do large established firms licence proprietary technology to potential competitors?[2] These incumbents should have the ability to exploit internally developed technologies and not allow rival firms to do so. Previous literature suggests that existing firms may use technology licensing to prevent imitation (Gallini and Wright 1990), select competition (Rockett 1990), prevent new firms’ entry (Eswaran 1994) and achieve other strategic aims.[3] For example, small technology-based firms may licence intellectual property when they lack manufacturing, distribution and/or marketing capabilities. There are various reasons why technology licensing is desirable. Arora and Fosfuri (2003) demonstrate the trade-off between profit dissipation and revenue effects, which guides firms’ licensing decisions. The revenue effect refers to the licensor’s increased revenue from the fees paid by the licensee(s) to use the patented technology. The dissipation effect refers to the licensor’s reduced profit when licensee(s) compete in the same market. In a state of horizontal market competition, the strength of each effect is determined by the degree of technology-specific product differentiation (cost asymmetry), the effect of efficiency gains due to technology sharing and elasticity of demand (e.g. Farrell and Shapiro 1990; Fosfuri 2006; Gans and Stern 2010; Storey and Tether 1998).
We analyse the dissipation effect of different licensing agreements on the product market of horizontal technology transfers. Introducing increasing production costs, we show that cooperation or collusion involving technology transfer actually reduces the dissipation effect and can also improve social welfare in oligopolistic industries characterised by firms with cost asymmetries. For example, if an incumbent firm faces a potential entrant or an existing competitor with a newly developed technology, the optimal response may be to pursue technology sharing and negotiate a licensing fee. This also implies that technology licensing can be a means to prevent competition because competing firms transfer technology to one another, generally at favourable prices, rather than competing in the technology market. Collusion usually leads to higher total industry profit than can be achieved through competitive behaviour to the detriment of consumers (e.g. Belleflamme and Peitz 2015). When technology licensing is used as a collusive device it can thus create concerns for competition policy (Eswaran 1994).[4] However, if the efficiency gains from technology sharing are sufficiently large and passed on to consumers, such gains may offset the negative impact of collusion (see Davis and Garces 2010). We suggest that the anticompetitive effects of collusion may be socially desirable if sufficiently large cost differences are evident across colluding firms in a highly concentrated industry characterised by significant diseconomies of scale relative to demand (see Dewey 1979; Williamson 1979).
Previous research demonstrates that in certain oligopolistic industries, the output produced falls between the competitive Nash–Cournot level and the collusive output level. For example, Nash–Cournot pricing behaviour is observed and documented in empirical studies regarding the American airline industry (Brander and Zhang 1993), the German market for banana imports (Deodhar and Sheldon 1999), the international shipbuilding industry (Shin and Lim 2014) and the banking industry (Bos 2004; Heffernan 1994). Iwata (1974) analyses price determination in the Japanese flat glass industry with three market-leading producers, demonstrating that prices and market shares are above the competitive level and close to the collusive level. We argue that competing firms prefer such cooperative behaviour due to the improved cost efficiency arising from new production technologies, whereas the cooperative outcome may be preferable to society provided that no welfare transfer from consumers to producers occurs. Specifically, we identify licensing agreements that lead to the same industry collusive output as under Cournot competition (Cournot 1838), which renders consumers indifferent to firms’ collusion while social welfare remains unchanged or rises (cf. Fershtman and Kamien 1992).
In our initial setup, we consider a market in which a homogenous good is produced at different unit production costs by an incumbent firm and a recent entrant. If the two firms simultaneously compete on quantity, the resulting Nash–Cournot equilibrium of the game is a duopoly profit. Each firm’s unit production cost will determine the individual market share. In this case, the total industry profit is lower than the monopoly profit (because of the efficiency effect; see Aoki and Hu 2003; Gilbert and Newbery 1982), which will prevail if the technological gap between the firms is drastic and entry does not occur (see Arrow 1962).[5] The transfer of a sufficiently (but not too) large technological innovation from the low-cost firm to the high-cost firm either through a fixed fee or royalty increases production efficiency and the total profit of the industry (Levy 2012; Miyagiwa 2009; Wang 1998). Again, the total profit of the industry is lower than the monopoly profit.
However, if the firms have a choice regarding whether to cooperate (collude), they may increase profits even more. In general, cartels increase prices and decrease output, which reduces total welfare at the expense of consumers. With no diseconomies of scale, the joint (collusive) industry profit will also be lower than the monopoly profit unless both firms produce using the new or superior technology. We assume that collusion involves technology sharing, which equalises the firms’ unit production costs. Provided constant marginal production costs, the joint industry profit will then be equal to the monopoly profit.
When introducing increasing marginal production costs, the firms’ total collusive profit will be higher than the monopoly profit. Hence, for society the collusive outcome is preferable to the monopoly outcome under diseconomies of scale. It may also be preferable to the incumbent firm if it is costly to prevent market entry through increased output. In certain cases, the decision of a new firm to enter the market is conditioned on the prospect of realising the collusive outcome. When considering fixed entry costs, entry may not occur unless the firms are allowed to cooperate. Then, an increase in social welfare may be foregone if the prospective entrant is the firm with superior technology and would make a profit only under collusion. From a social welfare perspective technology transfer through collusion to an incumbent that would otherwise produce with an outdated and inferior technology is preferable if this leads to an increase in producer surplus exceeding the decrease (if any) in consumer surplus. In this case, a collusive agreement ought to be allowed without being prevented by antitrust authorities.[6]
We demonstrate that collusion involving technology licensing leads to increased producer surplus (total industry profit) by improving production efficiency under decreasing economies of scale (cf. San Martin and Saracho 2010), and that it may also result in a consumer surplus equal to or higher than that achieved under competition.[7] We also show how cooperative outcomes can be achieved and sustained in equilibrium through licensing fee schemes based on a per-unit royalty being partially paid in advance for a minimum required quantity (without an explicit contractual agreement). Specifically, the required minimum quantity paid for in advance by the licensee as an upfront fee is equal to the firm’s individual collusive output. This cooperative outcome can be sustained in equilibrium for a sufficiently (but not too) large innovation if the licensor produces the expected collusive output. This also renders such an agreement collusive but is more difficult to detect and challenge by antitrust authorities.
The licensee will be unlikely to deviate from this agreement, while the licensor will have incentives to deviate if the industry-specific diseconomies of scale are very low in relation to the slope of the demand curve. Thus, larger diseconomies of scale will render the licensing agreement more stable (cf. Lin 1996; Miklos-Thal 2011). In general, collusion involving technology licensing will be increasingly sustainable in a Nash equilibrium with larger diseconomies of scale because technology transfer may enhance the licensee’s ability to punish the licensor’s defection, which causes the licensor to act accordingly, particularly when there are large cost differences between firms. Lin (1996) demonstrates that collusion is sustainable when technology licensing sufficiently enhances the former high-cost firm’s ability to punish the licensor, wherein the low-cost firm has no incentive to deviate from the agreement. We show that collusion reduces the dissipation effect of licence contracting between firms, actually improving social welfare.
We contribute to the literature on competition and licensing in several ways. First, we show that technology licensing, particularly that for a large but non-drastic innovation, facilitates collusion, which is consistent with previous literature (e.g. Lin 1996).[8] Second, introducing diseconomies of scale, we determine that competing firms can reach sustainable collusive outputs through a licensing fee scheme based on a per-unit royalty, which is partially paid upfront. This collusive agreement can be sustained in equilibrium; however, it enhances the punishing ability of the licensee at a lower rate than collusion achieved under technology transfer with or without a fixed fee; hence, it is more fragile (cf. Lin 1996). Finally, we contribute to the literature by demonstrating how technology licensing involving collusion can reduce the dissipation effect and improve social welfare in oligopolistic industries characterised by two firms, homogenous products, different technological levels and diseconomies of scale.
In conclusion, we argue that cooperative behaviour that increases industry efficiency should not always be challenged by antitrust authorities. This is particularly true when such behaviour does not redistribute surplus from consumers to producers. If the positive effects of efficiency gains exceed the negative social welfare effects of collusion, then such collusive behaviour may actually improve welfare (Bian et al. 2018). In this case, increased regulatory investigation and intervention from antitrust authorities may harm consumers rather than protect them. We demonstrate that efficient technologies are not shared when firms are restricted from reaching a collusive outcome using licensing agreements resulting in an unrealised increase in consumer surplus (see Hall and Harhoff 2012; Von Graevenitz et al. 2007). We establish a theoretical foundation which explains why large, market-leading firms, particularly those in highly concentrated industries such as the information and communications technology (ICT) sector, engage heavily in contractual agreements to buy and sell technology.
The remainder of this paper proceeds as follows. In Section 2, we illustrate how cooperative behaviour using technology transfers may increase firms’ profits in a highly concentrated industry including two firms. In this basic duopoly game, the firms’ marginal production costs are assumed to differ but remain constant with respect to production volume. In Section 3, we develop a duopoly model of collusion involving technology transfer in the presence of diseconomies of scale. We also consider collusive behaviour in a repeated game, revealing a self-enforcing collusive outcome. Section 4 examines how technology transfer through a licensing fee scheme with a per-unit royalty which is partially paid in advance can lead to identical firm and total industry outputs as under collusion. In this case, it is difficult for antitrust authorities to detect whether firms impose competitive or collusive constraints. However, observing various licensing fee schemes and payment levels in an industry could reveal such practices. In Section 5, we analyse the effects of technology licensing on social welfare, demonstrating that antitrust authorities should sometimes allow technology licensing that results in a collusive industry output when consumers are indifferent to whether social gains are due to collusion or competition. In this case, collusive behaviour may be an equilibrium choice when it decreases social costs and increases production efficiency. Section 6 concludes our findings. All proofs are presented in the Appendix.
2 Illustration of Collusion Involving Technology Transfer
Economists have been investigating firms’ interactions in imperfectly competitive markets for many years (Abreu 1988; Arrow 1962; Awaya and Krishna 2016; Daughety 1990; Dixit 1979; Fershtman and Judd 1987; Palmer 1984; Reinganum 1983). In general, competition models predict that firms’ decisions affect market structure and subsequent market prices (see Davis and Garces 2010). The standard view is that firms in particular industries collude to earn higher profits, which undermines the competitiveness of the industry and decreases social welfare. This view asserts that collusion impedes the efficient production and distribution of goods; however, it does not cover collusion involving technology transfer. Such collusion contributes to more efficient production and may also enhance social welfare.
To illustrate this point, consider an industry with an incumbent (Firm 1) and a prospective entrant (Firm 2). The two, otherwise identical firms, have differing technological levels or stock. Firm 2 decides whether or not to enter the market, which is costly and will initiate strategic interaction between the firms. Therefore, entry will only occur if it is projected to be profitable. Upon entry, each firm decides whether to compete or collude. Collusion may arise with an irreversible transfer of the superior technology from the low-cost firm to the high-cost firm, which will only occur if it is profitable for both firms to enter into such an agreement. In this case, both firms may have an incentive to deviate from a collusive outcome because the profit gained in the period of deviation is higher than a one-period collusive profit. However, we demonstrate that an effective punishment mechanism exists, which may deter firms from deviation (Friedman 1971; Tirole 1990). In the case of technology sharing, such punishment is even stronger since the former high-cost firm’s punishing ability increases because of the superior (irreversible) technology (Lin 1996). The sequence of actions described below is illustrated in Figure 1.
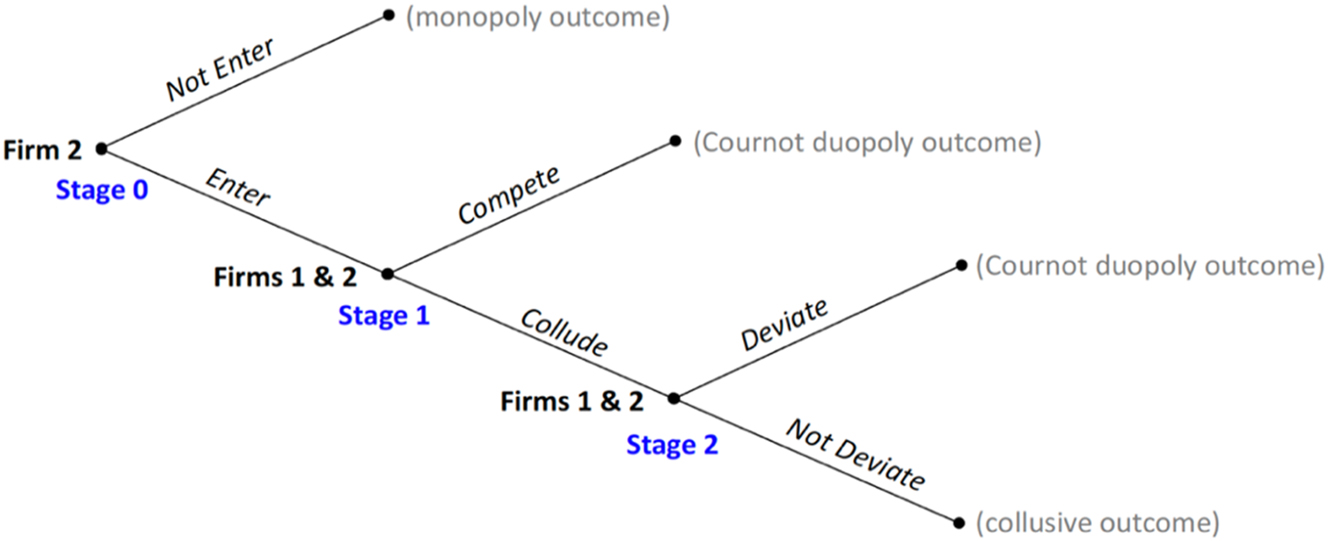
Illustration of the decision tree of the basic duopoly game.
In Stage 0, Firm 2 decides whether or not to enter the market. If Firm 2 decides to enter the market, it incurs a positive fixed cost (f 2), which is the investment cost for increased production capacity.[9] If entry does not occur, Firm 1 earns the monopoly (gross) payoff (π M ) and Firm 2 earns zero. Assume that the prospective entrant’s technology is less efficient than the incumbent’s technology. Entry depends on the cost difference or technological gap between the firms and the fixed investment cost, i.e. a high entry cost or technological gap may make Firm 2’s profit zero or even negative, subsequently preventing entry.[10] Moreover, if the competition in the industry is very intensive, the prospective entrant’s incentive to enter the market is weakened and entry may never occur (e.g. Sutton 1991). However, knowing that a cooperative agreement is possible may increase Firm 2’s incentive to enter.
In Stage 1, once the decision to enter is made, the fixed costs become sunk costs and are irrelevant to firms’ subsequent decision-making. Two cases must be considered. If the firms choose to compete, the market becomes a duopoly wherein Firm 1 earns a higher (gross) profit than Firm 2, i.e.
In the final stage of the game (Stage 2), the two firms decide whether to deviate. If any firm decides to deviate, the market becomes a duopoly characterised by Cournot competition. Specifically, the firm that deviates gains higher profit than the collusive profit in the period of deviation, but it only gains the Cournot profit in subsequent periods because of the other firm’s retaliation or punishment. In general, this practice ensures that firms do not deviate from the collusive outcome and is an essential condition for collusion to be sustained over time. Firms’ payoffs in Stages 0 and 1 described above are summarised in Table 1.[11]
Illustration of firms’ payoffs.
| No entry | Entry | |
|---|---|---|
| Compete | π M , 0 |
|
| Collude | π M , 0 | π C , π C − f 2 |
In Table 1, each row presents firms’ profits for a particular decision in the form of ordered pairs of entries. The first entry in each pair corresponds to Firm 1’s profits and the second entry to Firm 2’s profits. The findings suggest that collusion is preferable to competition from both firms’ perspectives when entry occurs because
Table 1 demonstrates that the decision to enter the market is also conditional on the collusive outcome, which affects the market structure. If firms are allowed to collude by increasing industry efficiency, and no firm is willing to deviate from the agreement, Firm 2 is more likely to enter the market at Stage 0 than if competition and deviation are likely outcomes in Stages 1 and 2. We will further show that such collusive behaviour may be sustained in equilibrium and improve social welfare. Moreover, in the absence of legal possibilities to cooperate, entry may not occur for sufficiently large but non-drastic innovations and additional surplus will not be generated. In the presence of diseconomies of scale, cooperation through technology sharing between otherwise competing firms increases firms’ profits and may also enhance social welfare if the gains from improved production efficiency offset the reduction in consumer surplus due to collusion.
3 A Model of Collusion
We examine firms’ cooperation or collusive behaviour, which maximises joint industry profit as opposed to individual profits. We determine the collusive outcome by analysing a duopolistic competition setting under diseconomies of scale where Firm 1 is an incumbent and Firm 2 is a recent entrant, deriving the competitive and collusive outcomes in an infinitely repeated game.
3.1 Collusion Involving Technology Transfer
Consider the basic duopoly exercise described in Section 2 and let the quantities of an identical good with price P produced by Firms 1 and 2 be q 1 and q 2, respectively.[13] To first establish a demand function of good Q, we use the following representative consumer’s utility function:
where Q is the industry’s total output, q 0 is a standard numeraire or composite good and a and b are positive parameters that characterise the product’s demand function. The standard inverse demand function that arises from the quadratic utility in Eq. (1) is as follows:[14]
thus, Firm i’s profits are as follows:
where C i is Firm i’s total cost. Assume that the total cost function is as follows:[15]
where c i (c i < a) is a firm-specific per-unit production cost. Parameter (a > d > 0) represents an industry-specific production cost, modelling firms’ increasing production costs when production grows; hence, parameter d represents the degree of diseconomies of scale within the industry. Colombo and Filippini (2016) use the same total production cost function, defining d as the nature of the technology adopted by the firms.[16] Note that parameter d can also be negative, i.e. d < 0, representing a production technology characterised by economies of scale; however, in this case, cooperation (collusion) to maximise joint industry profit through technology transfer will not increase social welfare. From a social welfare perspective, only the firm with the superior technology (the low-cost firm) should produce the good; hence, we focus on technologies characterised by diseconomies of scale in this study.
Let competition take a Cournot form with identical products produced by two firms using different production technologies, i.e. c
i
and c
j
for i ≠ j, i, j = 1, 2. Furthermore, we assume a non-drastic technological gap between the firms, i.e.
Let the two firms agree to coordinate their behaviour, i.e. collusion involving the transfer of superior technology from the low-cost firm to the high-cost firm.[17] In this case, the two firms will have the same unit production cost (c i ) and generate identical profit and neither firm will have a cost advantage over the other. The two firms collectively maximise the total profits of the industry Π C .[18] From the first-order conditions, each firm’s collusive output and profit and the collusive price are, respectively, as follows:
Collusion usually increases price and restricts industry output; however because of diseconomies of scale, the industry’s output achieved through engaging in collusive behaviour involving technology transfer (Q
C
= 2q
C
) is higher than the industry’s competitive (Nash–Cournot) output (
Diseconomies of scale induce firms to share production because of decreased total industry production cost when a certain total volume is reached.[20] If the increased total industry profit (producer surplus) is sufficiently large, this can also lead to increased social welfare in terms of the sum of consumer and producer surplus. The same analysis applies when the production technology is characterised by economies of scale (d < 0). However, the collusive industry output will then be lower than the monopoly output, implying that firms cannot make higher profits by cooperating to maximise joint industry profit.
3.2 Collusion in a Repeated Game
Collusion is fragile because cartel members have an incentive to deviate from the agreed terms when higher collusive prices prevail in the product market, particularly in one-period static games similar to the one described above. Firms may have stronger incentive to cheat to earn a higher share of the increased collusive profits than to collude. However, collusion can be sustained in a homogenous product market over time (e.g. Davis 2006). For example, it will be sustained over time if the net present value of a firm’s profit from collusion is greater than the net present value of a firm’s profit from deviating, considering any form of punishment imposed by rival firms (see Friedman 1971).
A collusive agreement is only attractive to both firms if
The first-order condition obtains the following:
which yields the following profit in the period of deviation for Firm i:
It is evident that
We next determine the optimal punishment choice for each firm, i.e.
We next determine each firm’s optimal incentive compatibility constraint to sustain collusion in a repeated game (e.g. Friedman 1971; Ivaldi et al. 2003). It is common knowledge that Firm i for i = 1, 2 has no incentive to deviate from a collusive agreement if the following condition holds:[24]
where
The incentive compatibility constraint defined by Eq. (14) should hold for both firms for collusion to be sustained over time. The minimum collusion threshold is lower when the high-cost firm cheats on the collusive agreement, i.e. Firm j for c i < c j .[26] This implies that any δ larger than the minimum collusion threshold of the low-cost firm cheating on the agreement is sufficient for collusion to be stable. Specifically, the collusive outcome can be sustained in equilibrium for c i < c j , if δ is larger than the following:
Equation (15) suggests that, whether collusion will be sustained in equilibrium depends on the d/b-ratio, which is the ratio between the scale parameter d (i.e. the degree of diseconomies of scale) and the demand parameter b (i.e. the slope of the product’s demand curve). As the d/b-ratio becomes sufficiently high,
The high-cost firm will logically be unlikely to deviate as opposed to the low-cost firm, which always has a greater incentive to cheat on the collusive agreement. In general, a larger technological gap or cost difference between firms generates greater incentive for the low-cost firm to cheat. If the high-cost firm must then revert to its high-cost production technology, i.e. the technology transfer is reversible and its punishing ability may not be sufficiently strong to deter the low-cost firm from cheating. This makes a collusive agreement more fragile and it will be less likely that the firms will enter into an agreement. However, as previously noted, a technology transfer that is irreversible will enhance the high-cost firm’s punishing ability, weakening the low-cost firm’s incentive to cheat. This indicates that when technology sharing is irreversible, the likelihood that the firms enter into a sustainable collusive agreement is greater, increasing the range of values that support collusion (cf. Lin 1996). For example, technology transfers in the ICT sector seem irreversible considering the digitalisation of production processes (e.g. ECLAC 2021). We can now present the following proposition:
Proposition 1
If collusion involves an irreversible transfer of technology from a low-cost firm to a high-cost firm at no cost and the two firms’ production technologies are characterised by diseconomies of scale (d > 0), collusion can be sustained in equilibrium and this stability increases in the d/b-ratio and cost difference between the firms (Δ).
This analysis also implicitly suggests that increased producer surplus from collusion induces the firm with superior technology to share technology by negotiating a price in terms of a licensing fee with its rival. In the next section, we demonstrate how increased surplus can be distributed among firms using different licensing fee schemes.
4 A Licensing Fee Scheme for Collusion Stability
Assume that transferring the cost-efficient technology occurs by means of a per-unit royalty (r > 0). This type of licensing agreement may enable both firms to produce with the superior technology (i.e. c i ) but it gives the licensor a cost advantage over the licensee because of the royalty paid for each unit of output produced with the licensed technology. Specifically, the per-unit royalty increases the marginal production cost of the licensee and is negatively related to the licensee’s chosen output. We also assume that the high-cost firm (licensee) has full information on the technology before the transfer.[28] Solving each firm’s maximisation problem, given licensing through a per-unit royalty, yields the following outputs:
Technology licensing will only occur if it increases each firm’s profits; thus, the maximum per-unit royalty that the licensor can charge is the innovation size or cost difference between the two firms, Δ ≡ c
j
− c
i
for c
i
< c
j
.[29] This also indicates that a licensing agreement will not occur if the innovation is drastic, which occurs when
4.1 Royalty Licensing Leading to Collusive Outcomes
Technology licensing by means of a per-unit royalty may result in an anticompetitive outcome because it allows the licensor to determine the marginal cost of the licensee by choosing the per-unit royalty (e.g. Shapiro 1985). Specifically, for any innovation that is non-drastic but still sufficiently large, a per-unit royalty of r C > 0 exists resulting in total industry output under a Cournot licensing agreement (Q L ) equal to the collusive industry output (Q C ) as derived in Section 3.[32] For such an innovation, r C would be equal to:
Note that r C is determined from the outputs produced under a collusive agreement and is equal to the threshold defining a sufficiently large cost difference between the firms derived in Section 3. The following can determine firms’ Cournot profits under licensing at a per-unit royalty r C :[33]
The market price is still obtained using Eq. (18) and the total industry output (Q
CL
) is equal to the Nash–Cournot output produced when a technology transfer does not occur (Q
NC
) and is higher than the monopoly output (
In general, neither the licensor nor the licensee will have an incentive to enter into a collusive agreement in which r
C
is charged on a per-unit basis for the licensee’s production using the superior technology.[35] The licensee will generally be better off under (Cournot) competition. It is also evident from Eq. (9) that the total industry profit will be higher under collusion than under competition if the licensee produces with the superior technology without paying any per-unit royalty.[36] This suggests that the licensor and the licensee can increase profits by negotiating the licensing terms. For example, such negotiations may result in the licensee paying a fixed licensing fee equal to r
C
q
C
, and both firms agreeing to produce the same individual collusive output (q
C
) defined by Eq. (8) after that. However, this type of agreement is exposed to the risk of being rejected by either firm, although this is unlikely since the threshold
This makes it interesting, particularly for the licensor, to suggest another licensing fee scheme in which the per-unit royalty (r
C
) is partially paid in advance. If properly designed, the licensor can leverage this licensing fee scheme to induce the licensee to produce the collusive output in accordance with Eq. (8) without entering into an explicit contractual agreement to do so. Specifically, by offering the licensee options to pay the per-unit royalty on any quantity chosen or pay it upfront for a minimum required quantity equal to the firm’s individual collusive output (q
C
) according to Eq. (8), the licensor will achieve the same collusive profit as when entering into a collusive agreement with the licensee at a fixed fee.[38] For any quantity up to the minimum quantity
4.2 Collusion and Deviation in a Repeated Game
In the context of our analysis, licensing is a legal contract between two firms wherein the licensee is permitted to use the superior technology owned by the licensor in return for a licensing fee. Typically, the parties entering a licensing agreement must also agree on certain conditions, and any potential violation of these conditions can be resolved in a court of law.[40] We argue that under a licensing fee scheme with a licence fee equal to r
C
q
C
which is paid upfront and a per-unit royalty (r
C
) paid for producing additional units, the licensee’s profit is maximised when producing in accordance with the firms’ individual output under a collusive agreement (q
C
). If both firms comply with such a collusive agreement, the licensor will then earn
We next determine each firm’s incentive compatibility constraint to sustain collusion in a repeated game framework. The same analysis as applied in Section 3 can be used to derive the output of Firm i, for c
i
< c
j
, in the deviating period. Simple calculations show that the output in the period of deviation, as expected, equals
To solve for the minimum threshold that supports collusion, we must determine each firm’s optimal reaction when cheating on the collusive agreement is detected, i.e.
It follows that Firm i will have no incentive to deviate from a collusive agreement if the following holds:
where
Note that, once again, the defection threshold depends on the slope (b) of the demand curve and the degree of diseconomies of scale (d). Evaluating the limit of Eq.(25) regarding d obtains
Proposition 2
If collusion involves an irreversible transfer of technology through a licensing scheme with an upfront fee equal to r
C
q
C
and a per-unit royalty (r
C
) for each additional unit, and the two firms’ production technologies are characterised by diseconomies of scale (d > 0), collusion can be sustained in equilibrium within a smaller support interval of hurdle rates than collusion involving technology licensing at no cost and no output restriction since
The large interval of values for the hurdle rate (k) suggests that achieving equilibrium depends on the magnitude of the d/b-ratio. When the hurdle rate is sufficiently low in relation to the d/b-ratio, collusion involving technology licensing is stable and can subsequently be sustained over time. Detecting industries characterised by technology transfer through licensing fees similar to those derived here may help antitrust authorities reveal collusive behaviour, which is otherwise hard to detect. Equation (25) suggests that such behaviour is more likely to occur in industries characterised by medium to high diseconomies of scale.
5 Welfare Effects
In this section, we examine the welfare effects of sufficiently large but non-drastic technology innovations, emphasising how collusion affects social welfare. Collusion among firms with constant marginal costs leads to a surplus transfer from consumers to producers, which generally results in a decrease in social welfare unless monopoly is the alternative. However, when the firms’ production is subject to diseconomies of scales, collusive behaviour involving technology licensing may improve social welfare because of decreased total production costs to supply the volume demanded by the market. The licensor increases the licensee’s production cost due to a positive licensing fee; however, if the firms can cooperate and negotiate regarding the licensing fee, the licensee may be better off. In Section 4, we demonstrate how licensing agreements can be used to achieve collusive outputs that lead to the same consumer surplus as that under Cournot competition, but how such collusive behaviour affects social welfare must also be analysed.
We examine the social welfare effects of a sufficiently large but non-drastic technology innovation under different duopoly regimes.[45] We demonstrate that subtracting the total production costs from Eq. (1) increases social welfare. First, consider the social welfare of the competitive (Cournot) industry with no technology transfer, as follows:
Second, the welfare level achieved under collusion with technology transfer using a fixed fee that is equal to:
which can be further simplified as follows:
Finally, consider the welfare achieved under Cournot competition when technology transfer occurs through a per-unit royalty equal to r C as follows:
which can be simplified to:
By comparing the social welfare obtained under Cournot competition without technology transfer and under collusion with technology transfer through an upfront fee and a per-unit royalty, we establish the following proposition:
Proposition 3
If collusion involves an irreversible transfer of technology through a licensing scheme with a fixed upfront fee equal to r C q C and a per-unit royalty (r C ) for each additional unit, and the two firms’ production technologies are characterised by diseconomies of scale (d > 0), collusion improves social welfare when technology innovations are sufficiently large but non-drastic,
It is evident that W CL > W NC when technology innovations are sufficiently large but non-drastic and W C > W CL when there are diseconomies of scale (d > 0).[46] When technology transfer occurs through a per-unit royalty r C , consumer surplus will be at least as high as that under Cournot competition with no technology transfer; however, producer surplus will always be higher since both firms employ the superior technology. This result implies that technology licensing leading to collusive output could benefit firms and society. We demonstrate that a threshold (τ) of the technology gap between the firms, which depends on demand (b) and scale (d) parameters exists, beyond, which collusion increases welfare.[47]
As it is difficult to construct a reasonably simple equation to analytically determine τ, we determine it numerically. Figure 2 illustrates thresholds for the different values of the d/b-ratio given c
j
> c
i
= 0 and no fixed transition costs. As shown in Figure 2, τ becomes increasingly lower when the d/b-ratio rises. Considering constant returns to scale (d/b = 0) and superior technology with no firm-specific per-unit costs (c
i
= 0), collusion through technology sharing will be welfare-increasing if
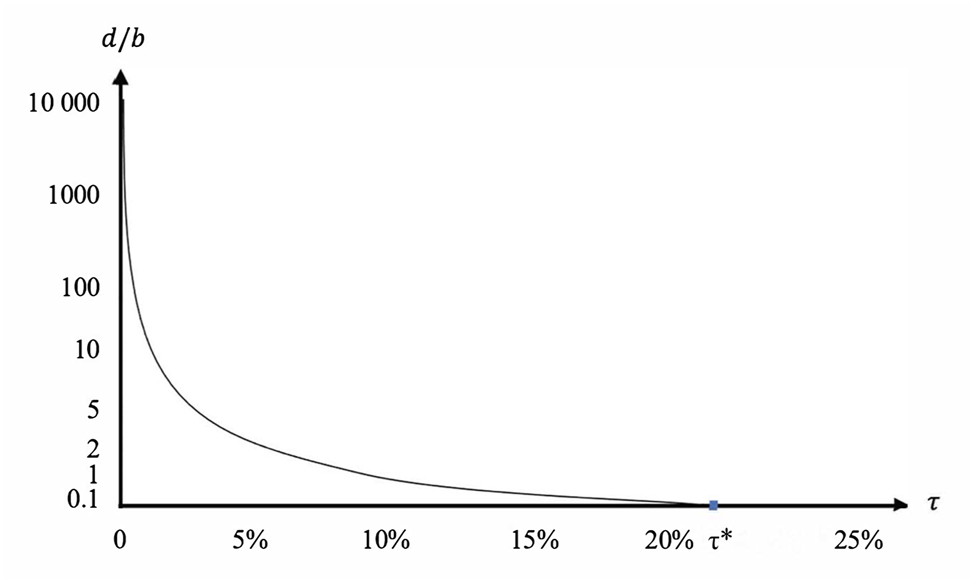
Numerical determination of collusive welfare increasing innovation thresholds.
It is unrealistic to assume that the superior technology reduces the firm-specific per-unit cost to zero. Therefore, considering a firm-specific per-unit cost (c i ) for c j > c i > 0, for any given d/b-ratio, the required innovation size (Δ) for collusive behaviour to be welfare-increasing can be determined as follows:
6 Conclusions
The detection and prevention of collusive behaviour and the formation of cartels is a matter of perpetual interest for antitrust authorities. Collusion is not socially desirable when it transfers surplus from consumers to producers by restricting market competition, which may also hamper innovation within industries. Consistent with previous research, we demonstrate that this is generally the case for collusion through transfer of marginal technological improvements which do not sufficiently reduce production costs (see Miklos-Thal 2011; Scherer 1980). Our analysis suggests that the decision to enter the market is conditional on the collusive outcome, i.e. when competing firms are allowed to collude by increasing the production efficiency in the industry, it is more likely that entry will occur than when competition and deviation are equilibrium outcomes. However, more interestingly, we demonstrate that collusion involving technology transfer may lead to increased producer surplus (total profit) because of improved production efficiency as well as a consumer surplus equal to or higher than that achieved under Cournot competition.
In our hypothetical duopolistic setting with industry-specific diseconomies of scale, an increase in social welfare can be achieved under a technology transfer through a licence fee composed by a per-unit royalty (r C ), which is paid upfront for a minimum quantity output (q C ) and a per-unit royalty (r C ) for additional units. We show that such a licensing fee scheme may result in improved social welfare and collusion to be sustained over time only for sufficiently large but non-drastic technology innovations (e.g. Dewey 1979).[48] The licensee will have no incentive to deviate from this agreement, while the licensor may have deviation incentive when the diseconomies of scale (d) are very low in relation to the slope of the demand curve (b). Technology licensing enhances the licensee’s punishing ability in the case of deviation, which then causes the licensor to act in accordance with the agreement (cf. Lin 1996). Higher diseconomies of scale, ceteris paribus, indicate a more stable licensing agreement. Furthermore, collusion also reduces the dissipation effect of licence contracting among firms (e.g. Chen 2011; Roma and Perrone 2016; Young 1991),[49] which may explain why collusive behaviour is often observed in highly concentrated industries such as aviation, banking and ICT sectors.
Our results demonstrate that technology licensing facilitates collusion and competing firms can reach sustainable collusive outputs through a licensing fee scheme with a per-unit royalty partially paid upfront in the presence of diseconomies of scale. We also show that technology licensing involving collusion could reduce the dissipation effect while improving social welfare in a duopolistic setting with asymmetric and increasing production costs. These results imply that collusion involving technology licensing should not always be challenged by antitrust authorities, particularly when it increases production efficiency and does not transfer welfare from consumers to producers (e.g. Baumol 1992; Rey and Tirole 2013). This is a notable finding, which should be considered before decision makers draw policy conclusions. We suggest that in addition to the commonly observed factors affecting licensing fees such as exclusivity, available alternatives on the market, risk measures, market demand and technology advancement, antitrust authorities should also consider negotiations that occur between licensors and licensees regarding surplus under collusive regimes compared to those under (Cournot) competition, which can be observed empirically.
Future theoretical and empirical research is essential to enrich the model and provide constructive information for advancing competition policy and social welfare since collusive practices are effectively preserved and particularly persistent in oligopolistic industries. Novel empirical directions are essential for determining why some industries are the usual suspects for collusive behaviour and how licensing fee schemes that make collusion observable can be predicted. Therefore, it would be valuable to further examine how antitrust authorities can detect collusive behaviour in licensing agreements to assess the impact on social welfare prior to initiating intervention.
This section discusses the impact of fixed transition costs on the threshold for when collusion becomes welfare increasing and when firms collude without technology sharing. It also provides the optimal outputs and prices under various competition forms, as well as the proofs for key equations derived in this study.
Appendix A: The Case when Technology Transfer Incurs Fixed Transition Costs
Assume that a technology transfer incurs a fixed transition cost, i.e. the licensor needs to make an investment and/or other production adjustments. Considering such fixed costs (f
i
> 0 for i = 1, 2) will lend further support to the positive welfare effects of collusive behavior if W
C
− f
i
> W
NC
. Provided that fixed transition costs are not too high, such behaviour may be welfare increasing even when technology innovation is not sufficiently large. When technology transfer from one firm to another is associated with fixed transition costs, collusion can be the only option to achieve a positive effect.[50] This follows from that
Equation (31) shows the required technological gap (Δ) for collusion to be welfare increasing when there are no fixed transition costs. Let now τ
f
be a threshold for the technological gap between firms at which f
i
= W
C
− W
NC
. Evidently, the threshold for when collusion improves welfare will increase with higher fixed transition costs. Accordingly, the required magnitude of Δ increases when also considering fixed transition costs, f
i
≥ 0 for i = 1, 2. The higher the fixed costs are, the greater the superiority of the new technology should be to motivate collusion from a social welfare perspective. Clearly, the technological gap where the technology innovation becomes drastic, i.e.
It should be noted that consumer surplus will be negatively affected when the technological gap between firms is not sufficiently large, i.e.
Appendix B: Equilibrium Outcomes Under Various Competition Forms
From the first-order condition of each firm’s profit maximisation, we can derive optimal outputs and prices under various competition forms (see Levin 1988). These equilibria are common knowledge, and we solve for each competition form presented in Dixit (1979), considering that the technological gap between the firms Δ is non-drastic. We adjust the equilibrium results because of the quadratic cost function defined by Eq. (4). In our setting, the monopoly outputs and price are, respectively:
The Nash–Cournot outputs and price are
whereas the Stackelberg (1934) outputs and price, respectively, with Firm 1 acting as a leader are:[51]
We can also derive the competitive output quantities as follows:[52]
Appendix C: The Case of Collusion Without Technology Transfer
When firms collude without sharing technology, the collusive outputs, profits, and price are, respectively,
Appendix D: Proofs of Key Equations
D.1 Equations (8)–(10)
To derive the equilibrium outputs under collusion, we maximise firms’ joint profits, as follows:
Note that collusion implies symmetric costs; thus, the industry output should be distributed equally between both firms. The first-order conditions give firms’ best reply functions as follows:
Solving Eq. (41) for q i and q j yields the output produced under collusion as follows:
We can now substitute the collusive quantities in Eqs. (2) and (3) to derive the results shown in Eqs. (10) and (9), respectively.
D.2 Equations (16)–(18)
First, we define the profit functions under a per-unit royalty licensing agreement as follows:
Now, we can apply the same basic analysis, i.e. maximising the profits of Firm i with respect to q i and the profits of Firm j with respect to q j , and derive the outputs under a licensing agreement. The first-order conditions and simple calculations give Eqs. (16) and (17). Assuming a competitive per-unit royalty r and substituting Eqs. (16) and (17) into Eq. (2) give the market price defined by Eq. (18).
D.3 Equations (22)–(24)
First, we can show that the output of Firm i when it deviates from the collusive agreement but still receives the per-unit royalty is equal to
which gives
The minimum threshold that supports collusion when the licensor defects and the licensee retaliates by switching to a per-unit royalty (r C ) scheme can be derived as follows:
References
Abreu, D. 1986. “Extremal Equilibria of Oligopolistic Supergames.” Journal of Economic Theory 39 (1): 191–225. https://doi.org/10.1016/0022-0531(86)90025-6.Suche in Google Scholar
Abreu, D. 1988. “On the Theory of Infinitely Repeated Games with Discounting.” Econometrica 56 (2): 383–96. https://doi.org/10.2307/1911077.Suche in Google Scholar
Aoki, R., and J. Hu. 2003. “Time Factors of Patent Litigation and Licensing.” Journal of Institutional and Theoretical Economics 159 (2): 280–301. https://doi.org/10.1628/0932456032974808.Suche in Google Scholar
Arora, A., and A. Fosfuri. 2003. “Licensing the Market for Technology.” Journal of Economic Behavior & Organization 52 (2): 277–95. https://doi.org/10.1016/s0167-2681(03)00002-7.Suche in Google Scholar
Arrow, K. 1962. “Economic Welfare and the Allocation of Resources for Invention.” In The Rate and Direction of Inventive Activity: Economic and Social Factors, 609–26. Princeton, New Jersey: Princeton University Press.10.1515/9781400879762-024Suche in Google Scholar
Awaya, Y., and V. Krishna. 2016. “On Communication and Collusion.” The American Economic Review 106 (2): 285–315. https://doi.org/10.1257/aer.20141469.Suche in Google Scholar
Baumol, W. 1992. “Horizontal Collusion and Innovation.” The Economic Journal 102 (410): 129–37. https://doi.org/10.2307/2234858.Suche in Google Scholar
Belleflamme, P., and M. Peitz. 2015. Industrial Organization. Cambridge, UK: Cambridge University Press.10.1017/CBO9781107707139Suche in Google Scholar
Bian, J., K. Lai, Z. Hua, X. Zhao, and G. Zhou. 2018. “Bertrand vs. Cournot Competition in Distribution Channels with Upstream Collusion.” International Journal of Production Economics 204: 278–89. https://doi.org/10.1016/j.ijpe.2018.08.007.Suche in Google Scholar
Bos, J. 2004. “Does Market Power Affect Performance in the Dutch Banking Market? Comparison of Reduced Form Market Structure Models.” De Economist 152 (4): 491–512. https://doi.org/10.1007/s10645-004-2476-0.Suche in Google Scholar
Brander, J., and A. Zhang. 1993. “Dynamic Oligopoly Behavior in the Airline Industry.” International Journal of Industrial Organization 11 (3): 407–35. https://doi.org/10.1016/0167-7187(93)90017-7.Suche in Google Scholar
Chen, J. 2011. “Strategic Sourcing for Entry Deterrence and Tacit Collusion.” Journal of Economics 102 (2): 137–56. https://doi.org/10.1007/s00712-010-0165-9.Suche in Google Scholar
Chen, J., L. Liang, and D. Yao. 2017. “An Analysis of Intellectual Property Licensing Strategy Under Duopoly Competition: Component or Product-Based?” International Journal of Production Economics 193: 502–13. https://doi.org/10.1016/j.ijpe.2017.08.016.Suche in Google Scholar
Choi, J., and H. Gerlach. 2015. “Patent Pools, Litigation, and Innovation.” The RAND Journal of Economics 46 (3): 499–523. https://doi.org/10.1111/1756-2171.12095.Suche in Google Scholar
Colombo, S., and L. Filippini. 2016. “Revenue Royalties.” Journal of Economics 118 (1): 47–76. https://doi.org/10.1007/s00712-015-0459-z.Suche in Google Scholar
Cournot, A. 1838. Recherches sur les principes mathématiques de la théorie des richesses. Paris: L. Hachette.Suche in Google Scholar
Daughety, A. 1990. “Beneficial Concentration.” The American Economic Review 80 (5): 1231–7.Suche in Google Scholar
Davis, P. 2006. Coordinated Effects Merger Simulation with Linear Demands. Mimeo: Competition Commission.Suche in Google Scholar
Davis, P., and E. Garces. 2010. Quantitative Techniques for Competition and Antitrust Analysis. Princeton, New Jersey: Princeton University Press.Suche in Google Scholar
Denicolo, V. 1996. “Patent Races and Optimal Patent Breadth and Length.” The Journal of Industrial Economics 44 (3): 249–65. https://doi.org/10.2307/2950496.Suche in Google Scholar
Denicolo, V., and L. Franzoni. 2003. “The Contract Theory of Patents.” International Review of Law and Economics 23 (4): 365–80. https://doi.org/10.1016/j.irle.2003.07.002.Suche in Google Scholar
Denicolo, V., and L. Franzoni. 2004. “Patents, Secrets, and the First-Inventor Defense.” Journal of Economics and Management Strategy 13 (3): 517–38. https://doi.org/10.1111/j.1430-9134.2004.00021.x.Suche in Google Scholar
Deodhar, S., and I. Sheldon. 1999. “Is Foreign Trade (Im)Perfectly Competitive? An Analysis of the German Market for Banana Imports.” Journal of Agricultural Economics 46 (3): 336–48. https://doi.org/10.1111/j.1477-9552.1995.tb00780.x.Suche in Google Scholar
Dewey, D. 1979. “Information, Entry, and Welfare: The Case for Collusion.” The American Economic Review 69 (4): 587–94.Suche in Google Scholar
Dixit, A. 1979. “A Model of Duopoly Suggesting a Theory of Entry Barriers.” The Bell Journal of Economics 10 (1): 20–32. https://doi.org/10.2307/3003317.Suche in Google Scholar
Economic Commission for Latin America and the Caribbean (ECLAC). 2021. “Digital Technologies for a New Future.” LC/TS.2021/43. Santiago.Suche in Google Scholar
Eswaran, M. 1994. “Licensees as Entry Barriers.” Canadian Journal of Economics 27 (3): 673–88. https://doi.org/10.2307/135790.Suche in Google Scholar
Farrell, J., and C. Shapiro. 1990. “Horizontal Mergers: An Equilibrium Analysis.” The American Economic Review 80 (1): 107–26.Suche in Google Scholar
Fershtman, C., and K. Judd. 1987. “Equilibrium Incentives in Oligopoly.” The American Economic Review 77 (5): 927–40.Suche in Google Scholar
Fershtman, C., and M. Kamien. 1992. “Cross Licensing of Complementary Technologies.” International Journal of Industrial Organization 10 (3): 329–48. https://doi.org/10.1016/0167-7187(92)90001-f.Suche in Google Scholar
Fosfuri, A. 2006. “The Licensing Dilemma: Understanding the Determinants of the Rate of Technology Licensing.” Strategic Management Journal 27 (12): 1141–58. https://doi.org/10.1002/smj.562.Suche in Google Scholar
Friedman, J. 1971. “A Non-Cooperative Equilibrium for Supergames.” The Review of Economic Studies 38 (1): 1–12. https://doi.org/10.2307/2296617.Suche in Google Scholar
Gallini, N., and S. Scotchmer. 2002. “Intellectual Property: When is it the Best Incentive System?” Innovation Policy and the Economy 2 (1): 51–78. https://doi.org/10.1086/653754.Suche in Google Scholar
Gallini, N., and B. Wright. 1990. “Technology Transfer Under Asymmetric Information.” The RAND Journal of Economics 21 (1): 147–60. https://doi.org/10.2307/2555500.Suche in Google Scholar
Gans, J., and S. Stern. 2010. “Is There a Market for Ideas?” Industrial and Corporate Change 19 (3): 805–37. https://doi.org/10.1093/icc/dtq023.Suche in Google Scholar
Gilbert, R., and D. Newbery. 1982. “Preemptive Patenting and the Persistence of Monopoly.” The American Economic Review 72 (3): 514–26.Suche in Google Scholar
Greenfield, D., and J. Sandford. 2021. “Upward Pricing Pressure in Mergers of Capacity-Constrained Firms.” Economic Inquiry 59 (4): 1723–47. https://doi.org/10.1111/ecin.12999.Suche in Google Scholar
Hall, B., and D. Harhoff. 2012. “Recent Research on the Economics of Patents.” Annual Review of Economics 4 (1): 541–65. https://doi.org/10.1146/annurev-economics-080511-111008.Suche in Google Scholar
Heffernan, S. 1994. “Competition in the Canadian Personal Finance Sector.” International Journal of the Economics of Business 1 (3): 323–42. https://doi.org/10.1080/758536225.Suche in Google Scholar
Ivaldi, M., B. Jullien, P. Rey, P. Seabright, and J. Tirole. 2003. “The Economics of Tacit Collusion.” Final Report for DG Competition. European Commission.Suche in Google Scholar
Iwata, G. 1974. “Measurement of Conjectural Variations in Oligopoly.” Econometrica 42 (5): 947–66. https://doi.org/10.2307/1913800.Suche in Google Scholar
Jaffe, A., and J. Lerner. 2007. Innovation and its Discontents. Princeton, New Jersey: Princeton University Press.Suche in Google Scholar
Kamien, M. 1992. “Patent Licensing.” In Handbook of Game Theory, Vol. 1, 331–54. Amsterdam: North-Holland.10.1016/S1574-0005(05)80014-1Suche in Google Scholar
Kamien, M., and Y. Tauman. 1986. “Fees versus Royalties and the Private Value of a Patent.” Quarterly Journal of Economics 101 (3): 471–91. https://doi.org/10.2307/1885693.Suche in Google Scholar
Katz, M., and C. Shapiro. 1985. “On the Licensing of Innovations.” The RAND Journal of Economics 16 (4): 504–20. https://doi.org/10.2307/2555509.Suche in Google Scholar
Katz, M., and C. Shapiro. 1986. “How to License Intangible Property.” Quarterly Journal of Economics 101 (3): 567–89. https://doi.org/10.2307/1885697.Suche in Google Scholar
Lemley, M., and C. Shapiro. 2013. “A Simple Approach to Setting Reasonable Royalties for Reasonable Royalties for Standard-Essential Patents.” Berkeley Technology Law Journal 28 (2): 1135–66.10.2139/ssrn.2243026Suche in Google Scholar
Lerner, J., and J. Tirole. 2004. “Efficient Patent Pools.” The American Economic Review 94 (3): 691–711. https://doi.org/10.1257/0002828041464641.Suche in Google Scholar
Lerner, J., and J. Tirole. 2015. “Standard-Essential Patents.” Journal of Political Economy 123 (3): 547–86. https://doi.org/10.1086/680995.Suche in Google Scholar
Levin, D. 1988. “Stackelberg, Cournot and Collusive Monopoly: Performance and Welfare Comparisons.” Economic Inquiry 26 (2): 317–30. https://doi.org/10.1111/j.1465-7295.1988.tb01496.x.Suche in Google Scholar
Levy, N. 2012. “Technology Sharing and Tacit Collusion.” International Journal of Industrial Organization 30 (2): 204–16. https://doi.org/10.1016/j.ijindorg.2011.09.002.Suche in Google Scholar
Li, C., and J. Wang. 2010. “Licensing a Vertical Product Innovation.” The Economic Record 86 (275): 517–27. https://doi.org/10.1111/j.1475-4932.2010.00630.x.Suche in Google Scholar
Lin, P. 1996. “Fixed-Fee Licensing of Innovations and Collusion.” The Journal of Industrial Economics 44 (4): 443–9. https://doi.org/10.2307/2950525.Suche in Google Scholar
Miklos-Thal, J. 2011. “Optimal Collusion Under Cost Asymmetry.” Economic Theory 46 (1): 99–125. https://doi.org/10.1007/s00199-009-0502-9.Suche in Google Scholar
Miyagiwa, K. 2009. “Collusion and Research Joint Ventures.” The Journal of Industrial Economics 57 (4): 768–84. https://doi.org/10.1111/j.1467-6451.2009.00399.x.Suche in Google Scholar
Mukherjee, A. 2014. “Licensing Under Convex Costs.” Journal of Economics 111 (3): 289–99. https://doi.org/10.1007/s00712-013-0333-9.Suche in Google Scholar
Nash, J. 1950. “The Bargaining Problem.” Econometrica 18 (2): 155–62. https://doi.org/10.2307/1907266.Suche in Google Scholar
Palmer, J. 1984. “Patents, Licensing and Restrictions on Competition.” Economic Inquiry 22 (4): 676–83. https://doi.org/10.1111/j.1465-7295.1984.tb00715.x.Suche in Google Scholar
Priest, G. 1977. “Cartels and Patent License Arrangements.” The Journal of Law and Economics 20 (2): 309–77. https://doi.org/10.1086/466905.Suche in Google Scholar
Reinganum, J. 1983. “Uncertain Innovation and the Persistence of Monopoly.” The American Economic Review 73 (4): 741–8.Suche in Google Scholar
Rey, P., and D. Salant. 2012. “Abuse of Dominance and Licensing of Intellectual Property.” International Journal of Industrial Organization 30 (6): 518–27. https://doi.org/10.1016/j.ijindorg.2012.05.003.Suche in Google Scholar
Rey, P., and J. Tirole. 2013. “Cooperation vs. Collusion: How Essentiality Shapes Co-Opetition.” Discussion Paper, IDEI, WP 801.Suche in Google Scholar
Rockett, K. 1990. “Choosing the Competition and Patent Licensing.” The RAND Journal of Economics 21 (1): 161–71. https://doi.org/10.2307/2555501.Suche in Google Scholar
Roma, P., and G. Perrone. 2016. “Cooperation Among Competitors: A Comparison of Cost-Sharing Mechanisms.” International Journal of Production Economics 180: 172–82. https://doi.org/10.1016/j.ijpe.2016.08.002.Suche in Google Scholar
San Martin, M., and I. Saracho. 2010. “Royalty Licensing.” Economics Letters 107 (2): 284–7. https://doi.org/10.1016/j.econlet.2010.02.010.Suche in Google Scholar
Scherer, F. 1980. Industrial Market Structure and Economic Performance. Boston, Massachusetts: Houghton Mifflin Company.Suche in Google Scholar
Schmalensee, R. 1987. “Competitive Advantage and Collusive Optima.” International Journal of Industrial Organization 5 (4): 351–67. https://doi.org/10.1016/s0167-7187(87)80001-2.Suche in Google Scholar
Sen, N., and S. Bhattacharya. 2017. “Technology Licensing between Rival Firms in Presence of Asymmetric Information.” The B.E. Journal of Theoretical Economics 17 (1): 20150097. https://doi.org/10.1515/bejte-2015-0097.Suche in Google Scholar
Sen, D., and G. Stamatopoulos. 2009. “Technology Transfer Under Returns to Scale.” The Manchester School 77 (3): 337–65. https://doi.org/10.1111/j.1467-9957.2009.02100.x.Suche in Google Scholar
Sen, D., and G. Stamatopoulos. 2019. “Decreasing Returns, Patent Licensing and Price-Reducing Taxes.” Journal of Institutional and Theoretical Economics 175 (2): 291–307. https://doi.org/10.1628/jite-2019-0022.Suche in Google Scholar
Sen, N., P. Minocha, and A. Dutta. 2022. “Technology Licensing and Collusion.” MPRA Paper No. 111639.Suche in Google Scholar
Shapiro, C. 1985. “Patent Licensing and R&D Rivalry.” The American Economic Review 75 (2): 25–30.Suche in Google Scholar
Shin, J., and Y. Lim. 2014. “An Empirical Model of Changing Global Competition in the Shipbuilding Industry.” Maritime Policy & Management 41 (6): 515–27. https://doi.org/10.1080/03088839.2013.856522.Suche in Google Scholar
Stackelberg, H. von. 1934. Marktform und gleichgewicht. Berlin: Springer.Suche in Google Scholar
Storey, J., and S. Tether. 1998. “New Technological Based Firms in the European Union: An Introduction.” Research Policy 26 (9): 933–46. https://doi.org/10.1016/s0048-7333(97)00052-8.Suche in Google Scholar
Strojwas, M., J. Tirole, and J. Lerner. 2003. “Cooperative Marketing Agreements Between Competitors: Evidence from Patent Pools.” NBER Working Paper, 9680.Suche in Google Scholar
Sutton, J. 1991. Sunk Costs and Market Structure: Price Competition, Advertising, and the Evolution of Concentration. Cambridge, Massachusetts: MIT press.Suche in Google Scholar
Tarantino, E. 2015. “Licensing Policy and Technology Adoption in Standard Setting Organizations.” Economic Inquiry 53 (1): 604–23. https://doi.org/10.1111/ecin.12112.Suche in Google Scholar
Tirole, J. 1990. The Theory of Industrial Organization. Cambridge, Massachusetts: MIT Press.Suche in Google Scholar
Von Graevenitz, G., S. Wagner, D. Harhoff, B. Hall, K. Hoisl, P. Giuri, and A. Gambardella. 2007. “The Strategic Use of Patents and its Implications for Enterprise and Competition Policies.” Report ENTR/05/82 for DG Enterprise. European Commission.Suche in Google Scholar
Wang, H. 1998. “Fee versus Royalty Licensing in a Cournot Duopoly Model.” Economics Letters 60 (1): 55–62. https://doi.org/10.1016/s0165-1765(98)00092-5.Suche in Google Scholar
Williamson, O. 1979. “Transaction Cost Economics: The Governance of Contractual Relations.” The Journal of Law and Economics 22 (2): 3–61. https://doi.org/10.1086/466942.Suche in Google Scholar
Young, A. 1991. “Transaction Cost, Two-Part Tariffs, and Collusion.” Economic Inquiry 29 (3): 581–90. https://doi.org/10.1111/j.1465-7295.1991.tb00848.x.Suche in Google Scholar
© 2023 the author(s), published by De Gruyter, Berlin/Boston
This work is licensed under the Creative Commons Attribution 4.0 International License.
Artikel in diesem Heft
- Frontmatter
- Research Articles
- Screening with Privacy on (Im)persistency
- Quality, Shelf Life, and Demand Uncertainty
- Transfers and Resilience in Economic Networks
- Technology Adoption under Negative External Effects
- Management Centrality in Sequential Bargaining: Implications for Strategic Delegation, Welfare, and Stakeholder Conflict
- Financial and Operational Creditors in Bankruptcy Resolution: A General Equilibrium Approach Under Three Game-Theoretic Division Rules with an Application to India
- Product Differentiation and Trade
- A Theoretical Analysis of Collusion Involving Technology Licensing Under Diseconomies of Scale
- Product Quality and Product Compatibility in Network Industries
- How the Future Shapes Consumption with Time-Inconsistent Preferences
- Notes
- The Strategic Adoption of Environmental Corporate Social Responsibility with Network Externalities
- Strategic Environmental Corporate Social Responsibility (ECSR) Certification and Endogenous Market Structure
- A Note on a Moment Inequality