Investigation of the Tribological Behaviors of Upholstery Woven Fabrics after Abrasion

Abstract
Fabric surface tribology is an important area of study in upholstery fabrics, which is exposed to high friction and abrasion effects. In the studies on the tribology of upholstery fabrics, it is ensured that criteria such as better performance, less degradation, increased usage time, and user comfort are determined and taken into consideration in the woven fabric design. Surface roughness and friction coefficients are important parameters used in determining abrasion, deformation, and wear behaviors of fabrics. In this study, the surface abrasion behaviors of upholstery fabrics woven with basic and jacquard weave patterns and also different structural parameters were investigated in terms of the changes in surface roughness parameters (amplitude parameters: Ra, Rpm, and Rvm and hybrid parameters: Δa) and the changes in surface friction coefficients. These results were also related to the state of the visual changes in the fabrics. Rpm, Rvm, and Δa being roughness parameters were found to be important in the evaluation of the surface deformation of the fabrics after abrasion besides the Ra parameter. Results showed that the Δa roughness parameter could be suitable for evaluating the deformation of the textile structures to be used, particularly in sensitive applications.
1 Introduction
Furnishings are exposed to high abrasive forces during their use. Therefore, upholstery fabrics should be produced from durable constructional components against abrasion. The aims of the studies on the woven fabric tribology are to investigate the causes of friction and abrasion deformations due to friction of the surfaces and to determine the design and production parameters required to minimize these deformations. Particularly with the studies on the tribology of upholstery fabrics exposed to high friction and abrasion, it is ensured that the criteria such as better performance, less degradation, and increased usage time and user comfort are determined and taken into consideration in the woven fabric design. Research on fabric surface tribology will allow for a variety of engineering studies to estimate and improve both appearance and physical performance of fabrics.
Tribology is the science of friction. Tribology is defined as the science, technology, and engineering of interacting surfaces (materials) in relative motion. It deals with the relations between friction, wear, and lubrication events [1,2,3].
Abrasion is the mechanical deformation of fabric components by rubbing against another surface, and it first changes the surface and then affects the internal structure of the fabric [4,5]. Abrasion resistance is influenced by many factors such as the mechanical properties of the fibers, yarn properties, fabric constructional properties, fabric geometry, and weave pattern [6,7,8,9,10,11]. Abrasion ultimately results in not only the loss of performance characteristics, such as strength, fabric thickness, and fabric bulk density, but also affects the appearance of the fabric [4,12].
In studies, it was observed that the increase in yarn twist and the increase in weft density increased the abrasion resistance [6]. In another study, it has been reported that the weave structure of woven fabric has an impact on the strength of fabric abrasion. It was observed that the long yarn floats and the fewer yarn crossings in the fabric reduced the abrasion resistance [13].
Textile structures show some horizontal and vertical repetitive unities as periodic surfaces; therefore, different length scales have to be taken into account for a suitable assessment of the topographic data measured [14]. Surface roughness is conventionally measured by the stylus profiling method for determining the surface profile. This profile characterizes the thickness variation in the selected direction of the surface [15,16]. Surface roughness parameters are categorized as amplitude, spacing, and hybrid parameters. These parameters are considered to characterize the surface topography. The amplitude parameters are used to measure the vertical characteristics of the surface deviations, while the spacing parameters are used to measure the horizontal characteristics of the surface deviations. The hybrid properties are a combination of amplitude and spacing properties. Any changes, which occur in either amplitude or spacing, may have effect on the hybrid properties [17].
The frictional parameters of fabrics are affected by fiber type, yarn properties, yarn crimp, surface smoothness, fabric morphology, etc. [18,19,20,21]. Friction of a fabric on its own fabric or on another fabric has an important effect on the performance characteristics of fabrics such as abrasion, wear, and tactile comfort [22]. Frictional force is the force that acts between two surfaces moving relatively opposed to each other. The ratio of friction force (F) to normal force (N) between two surfaces is defined as the friction coefficient (µ), which is a dimensionless value, µ = F/N [23].
Surface roughness and friction coefficients are important parameters used in determining abrasion, deformation, and wear behaviors of fabrics. In this study, tribological behaviors of upholstery woven fabrics after abrasion were investigated. Deformation of fabric surfaces after abrasion was evaluated as follows: evaluation of the changes in various surface roughness parameters (Ra, Rpm, Rvm, and Δa) and evaluation of changes in surface friction coefficients. Also, these results were evaluated by the visual changes in the fabrics after abrasion.
2 Experimental
2.1 Materials
The structural parameters of upholstery fabrics woven with different constructional parameters are given in Table 1. In this study, for the evaluation of the abrasion characterization of the basic weave structures, plain, twill, satin, rib, and jacquard weaves were selected. F5 fabric was 100% cotton, and all other fabrics were made from 100% polyester yarns.
Structural properties of upholstery woven fabrics
| Fabric No | Weave | Yarn Count (Nm) | Yarn Density (thread/cm) | Yarn Crimp (%) | Fabric Thickness (mm) | Fabric Unit Weight (g/m2) | |||
|---|---|---|---|---|---|---|---|---|---|
| Warp | Weft | Warp | Weft | Warp | Weft | ||||
| F1 | 1st layer; plain | 7 | 7 | 10 | 10 | 10 | 5 | 0.79 | 395.8 |
| 2nd layer; 2/1/1/1 rib | 28 | 28 | 27 | 10 | 6 | 5 | |||
| F2 | Plain | 14 | 14 | 17 | 10 | 11 | 4 | 0.66 | 221 |
| F3 | 4/4 twill | 24 | 24 | 24 | 32 | 5 | 5 | 0.62 | 241.2 |
| F4 | 4/1 satin | 52 | 28 | 30 | 28 | 5 | 3.5 | 0.44 | 242.9 |
| F5 | 2/2 weft rib | 28 | 11 | 32 | 13 | 7 | 9 | 0.69 | 341.1 |
| F6 | Jacquard (double layered) | 56 | 14 | 69 | 40 | 12 | 5 | 0.85 | 437 |
| F7 | Jacquard | 55 | 28 | 71 | 40 | 5 | 4.5 | 0.80 | 291.54 |
2.2 Methods
2.2.1 Surface Roughness Measurement
In this study, for the characterization of the change in the fabric surface roughness properties after abrasion, amplitude (Ra, Rpm, and Rvm) and hybrid (Δa) parameters were selected.
Arithmetic average height (Ra) parameter gives a general definition of height variation of surfaces. For the complete characterization of a surface, this parameter discussed earlier in literature is not sufficient. It does not provide any information about the slopes, shapes, and sizes of the asperities, and it is not sensitive to small changes in the surface. It is possible, for surfaces of widely differing profiles with different shapes, to give the same Ra value. This single numerical parameter is useful mainly for classifying surfaces of the same type that is produced by the same method [1,17].
Arithmetic average height (Ra) is defined as the average absolute deviation of the roughness irregularities from the mean line over one sampling length [17].
where yi is the surface height and n is the number of samples along the evaluation length of the profile.
Mean height of peaks (Rpm) is defined as the mean of the maximum height of peaks obtained for each sampling length of the evaluation length [17].
where Rp is the maximum height of the profile above the mean line within the evaluation length and n is the number of samples along the evaluation length of the profile.
Mean depth of valleys (Rvm) is defined as the mean of the maximum depth of valleys obtained for each sampling length of the evaluation length [17].
where Rv is the maximum depth of the profile below the mean line within the evaluation length and n is the number of samples along the evaluation length of the profile.
Mean slope of the profile (Δa) is defined as the mean absolute profile slope over the evaluation length. This parameter is determined by calculating all the slopes between each two successive points of profile and then calculating the average of these slopes. Many mechanical properties such as friction, elastic contact, and reflectance are associated with this parameter [17].
where δ is the individual slopes between each two successive points of the profile and n is the total number of intersections of the profile with the mean line along the evaluation length.
Surface roughness parameters (Ra, Rpm, Rvm, and Δa) of samples were measured by a roughness tester (Accretech Surfcom 130A), and roughness values were recorded according to ISO 4287-1997 (2005). The measurement was performed on a steady state without causing any further tension on the sample. Ten roughness measurements were made on each direction (warp and weft) with the selected measurement parameters of 50 mm evaluation length (0.8 mm cutoff value) and 1.5 mm/s measurement speed.
2.2.2 Surface Friction Measurement
Static and kinetic coefficients of friction (µs and µk, respectively) of fabric samples were measured by a coefficient of friction tester (Labthink Param MXD-02), and coefficients were recorded according to ASTM D 1894 (2014).
2.2.3 Abrasion Test
The abrasion tests were performed on Nu-Martindale Abrasion Tester according to ASTM D 4966 (2012). A total of 20000 abrasion cycles were performed below the 12 kPa abrasion weight. However, in order to obtain at least a measurement length of 50 mm for roughness and friction measurements, the places of standard wool fabric and fabric sample were changed. Standard wool fabric was used on the upper face of the motion plate, while upholstery fabric under test was mounted on the stable plate. Surface roughness parameters and friction coefficients were measured before (non-abraded or original) and after 20000 abrasion cycles.
2.2.4 Microscopic Analysis
Microscopic views of original (non-abraded) and abraded (20000 times abraded) samples, which were taken under a microscope (Mshot Digital Microscope Camera MS60) coupled to a digital camera, were presented (15 times magnified).
3 Results and discussion
3.1 Evaluation of the changes in the surface roughness parameters
After the abrasion process, the effect of the structural properties of the fabric on the arithmetic average height (Ra), mean height of peaks (Rpm), mean depth of valleys (Rvm), and mean slope of the profile (Δa) values of fabric surfaces was evaluated.
Since the change in values of the surface roughness parameters is also indicative of the degree of influence from the applied abrasion process on the surface, the effect of the change in surface texture in this study was evaluated taking into account the ratios of changes in surface roughness parameters. The % values shown on the graph are the % change in the roughness values before and after abrasion.
In Figs. 1 and 3–5, the average roughness, average peak height, average valley depth, and average profile slope values of all fabrics after abrasion are observed to decrease.

Changes in the values of the arithmetic average height (Ra)
In Figure 1, when the changes in Ra values of the fabrics were examined, it was seen that the highest change in the Ra value ≈20.77%) in the warp direction after the abrasion process occurred in the F3 fabric.
When the surface appearance of this fabric was examined (Figure 2), it was observed that the fabric surface has high yarn floating lengths in the warp and weft directions. The open surfaces of the floating yarns on the fabric surface were more affected by the abrasion process, as shown in Figure 1. As a result, the changes in Ra values in warp and weft directions after abrasion were high. At the same time, it was observed that the changes in the Rpm and Rvm values after abrasion in this fabric and especially the changes in the Δa values in the warp direction were quite high (Figures 3–5).
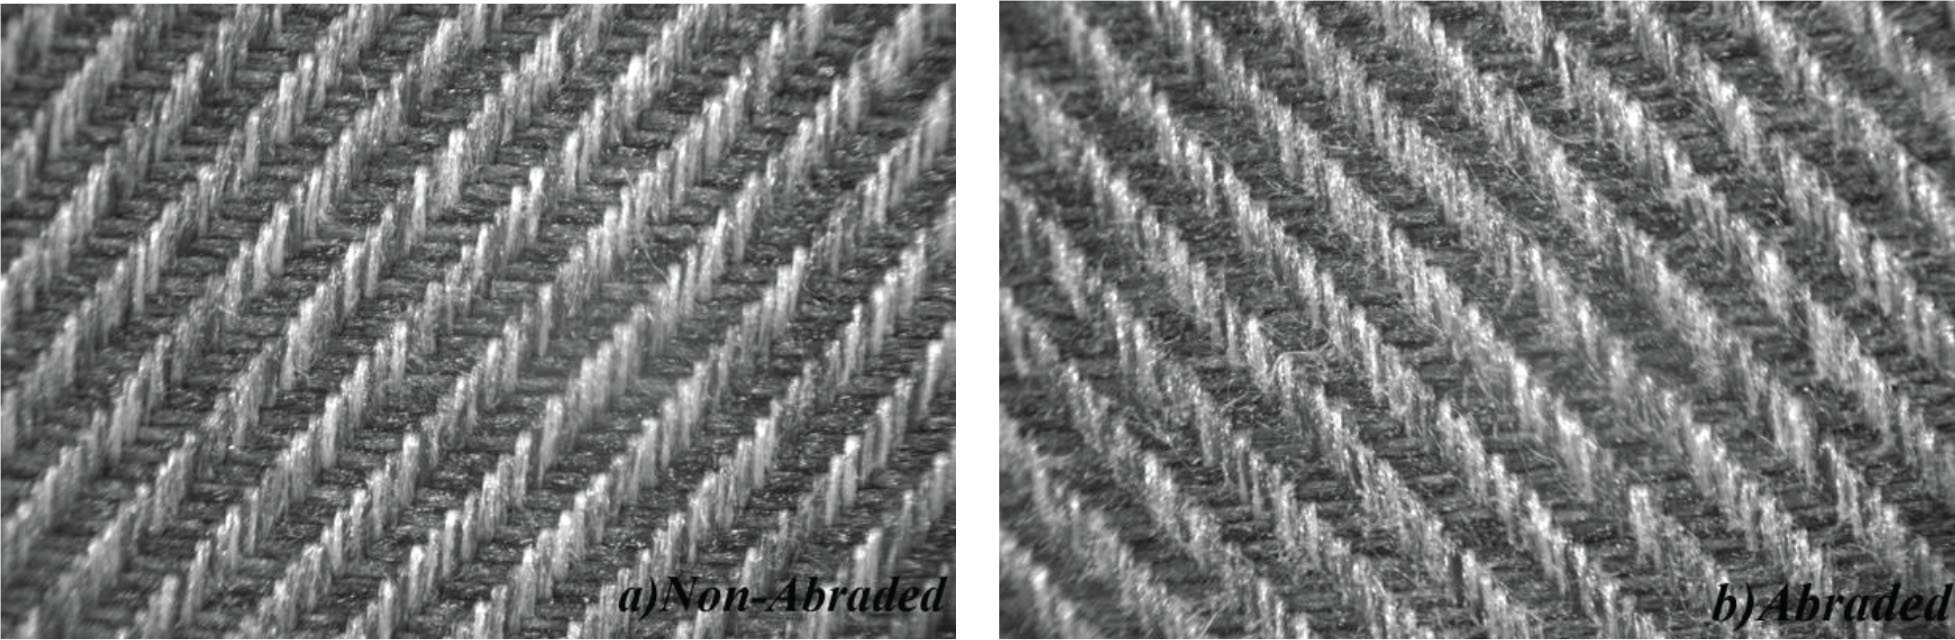
A microscopic view of F3 fabric a) before and b) after 20000 cycles of abrasion

Changes in the values of the mean height of peaks (Rpm)
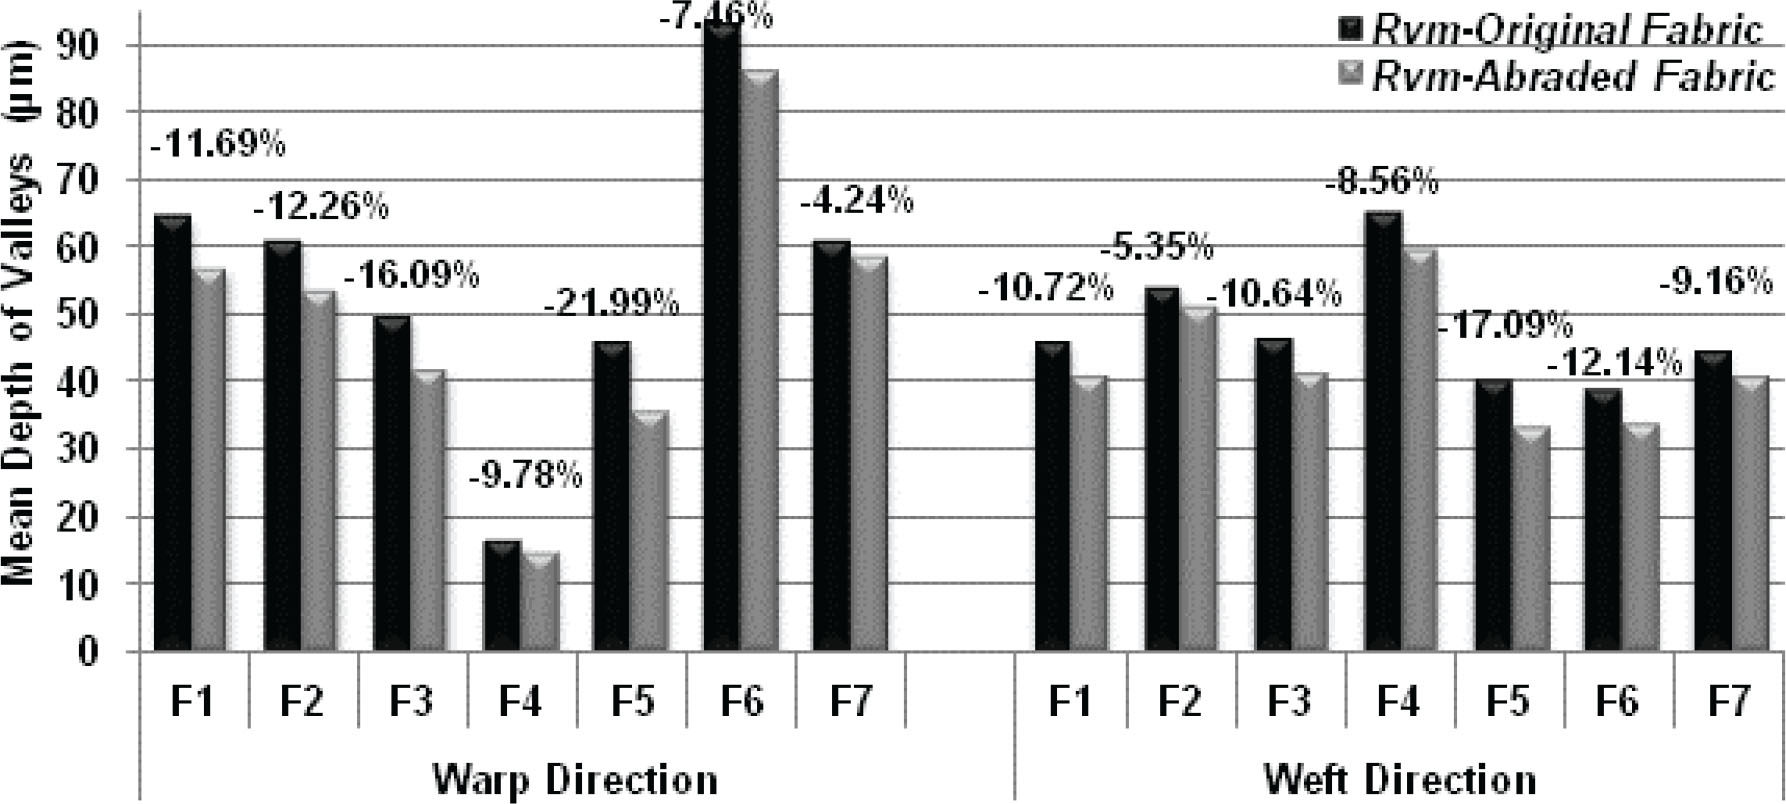
Changes in the values of the mean depth of valleys (Rvm)

Changes in the values of the mean slope of the profile (Δa)
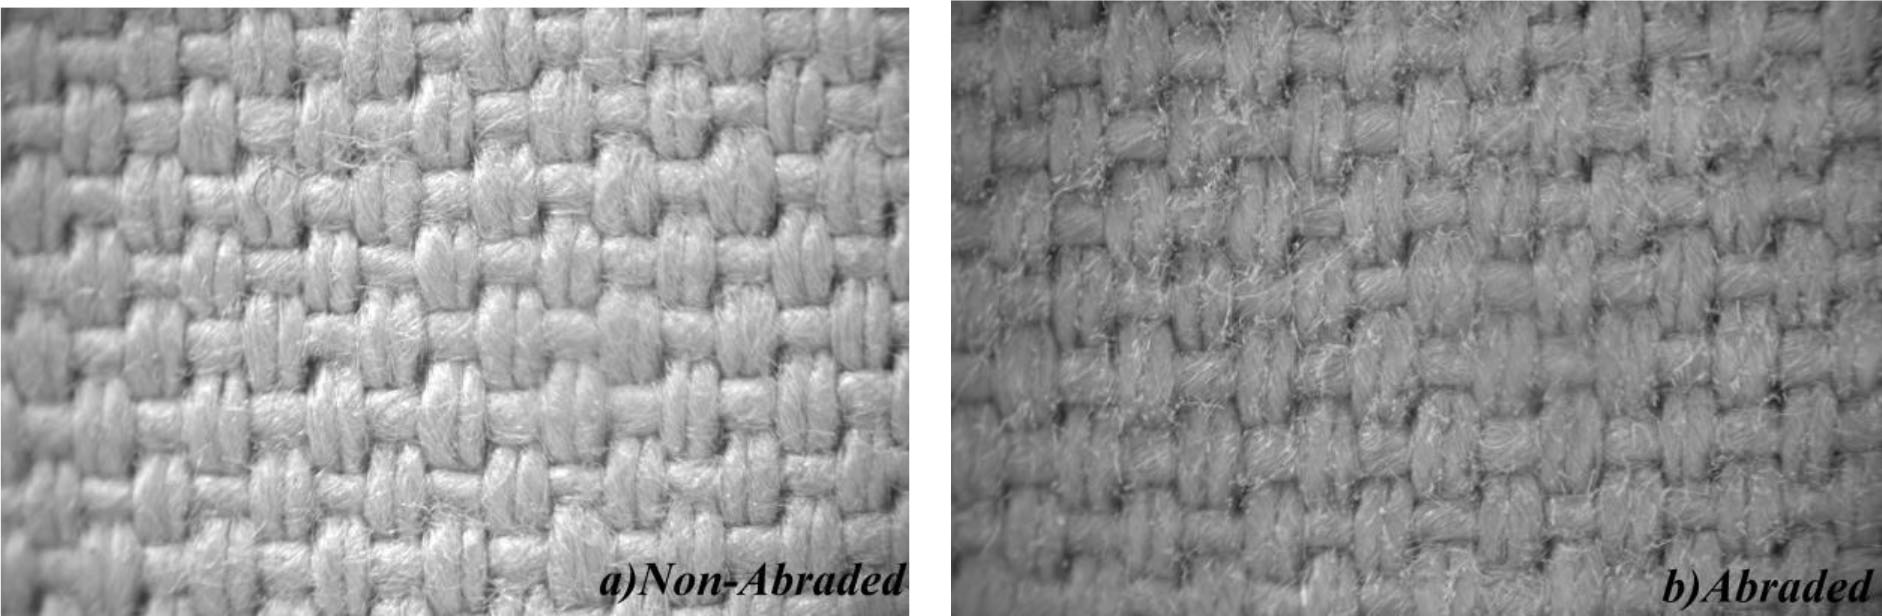
Following the F3 fabric, it was observed that the highest change in the Ra value (≈7.88%) in the warp direction occurred in the F2 fabric (Figure 1). Also, it was observed that the change in the Ra value in the weft direction of this fabric was high (≈10.18%). In Figure 6, when the non-abraded and abraded surface images of F2 fabric were examined, it was observed that there were a great number of broken fiber ends coming out on the fabric surface after abrasion. When the structural parameters of F2 fabric were examined (Table 1), it was seen that this fabric’s structure woven with single-layered plain weave has thick warp and weft yarns, and low warp and weft yarn density values. Despite the fact that each of the yarns was individually crossed to each other in plain weave construction, this fabric structure woven with coarse yarns and low yarn densities was highly influenced by the abrasion process. As a result of this, the fibers in the yarn easily came out to the fabric surface.

A microscopic view of F2 fabric a) before and b) after 20000 cycles of abrasion
When the changes in the Rpm and Rvm values of F2 fabric after abrasion were examined, it was seen that the Rpm and Rvm values in the warp direction were higher than those in the weft direction (Figures 3–4). This was because when the fabric properties were examined in Table 1, the warp crimp value of the F2 fabric was significantly higher than the weft crimp value, although the warp and weft yarn counts were the same. Consequently, the crown heights of the warp yarns with a high crimp value in the fabric surface were more influenced by the abrasion process.
In Figure 1, when the change in the Ra value of F1 fabric after abrasion was examined, it was seen that the changes in the Ra values were quite low in warp and weft directions (≈3.66% and 2.61%, respectively). When the changes in the Rpm and Rvm values of F1 fabric after abrasion were examined, it was observed that this fabric has a low change in the Rpm value (Figure 3), while it has a high change in the Rvm value (Figure 4).
When the structural parameters of F1 fabric were examined (Table 1), it was observed that F1 fabric woven with plain weave structure was similar to F2 fabric. However, F1 fabric has double-layered woven fabric structure. In this fabric structure, the top layer woven with plain weave structure and the bottom layer was supported with rib weave. When F1 fabric construction was examined, it was seen that the upper layer fabric was woven with thick yarn and low yarn densities, while the bottom layer fabric was woven with fine yarns and high yarn densities. As a result, it was observed that the double-layered plain woven fabric structure (F1) had a higher resistance to the abrasion process than the single-layered plain woven fabric (F2). As could be seen from surface appearance in Figure 7, the fiber ends of the F1 fabric after the abrading process were very lower than those of the F2 fabric (Figure 6).

A microscopic view of F1 fabric a) before and b) after 20000 cycles of abrasion
In Figure 1, after the abrasion effect, it was observed that the change in the Ra value in the warp direction was low and the change in the Ra value in the weft direction was high. This could be due to the fact that the change in the Δa value of F4 fabric in the warp direction was very high (≈41.76%). In Figure 5, when the effects of abrasion on fabrics and the changes in the Δa values were examined, it was seen that the highest change was in the warp direction of F4 fabric. As a result, this could lead to a high change in weft directional surface properties. During roughness measurement in the weft direction, the stylus probe performs its movement in the direction perpendicular to the warp direction as the probe moves in the weft direction. For this reason, the fact that the change in the Δa value in the warp direction was quite high caused the change in the Ra value in the weft direction to be high.
When microscopic images of the F4 fabric were examined (Figure 8), a minimal visual deformation was observed on the surface. It had also been found that when satin fabrics with long yarn floats were used as upholstery, the surface roughness values after abrasion showed a slight change when the fabrics were woven with very high yarn density values of suitable yarn fineness.

A microscopic view of F4 fabric a) before and b) after 20000 cycles of abrasion
When the changes in Ra, Rpm, Rvm, and Δa values of the F5 fabric woven with a 2/2 weft rib structure were examined, it was observed that the change in the Rvm value was the highest. This was due to the significant amount of deformation of the surface of this fabric, which was woven from 100% cotton yarns, as shown in Figure 9. It was observed that the non-abraded fabric surface was in a hairy appearance due to the fact that the fabric surface was woven with cotton yarns. After the abrasion process, it was seen that the fiber ends on the surface break off and causes significant deformation on the fabric surface. When the change in the Ra value of F5 fabric was examined, it was seen that the change in warp and weft direction Ra values was almost close to F2 fabric woven with plain weave. When the warp and weft direction Rpm values were examined, it was seen that the change in warp direction Rpm values was low, but the weft direction change was high. This was due to the amount of crimp of warp and weft yarns on the fabric surface. In Table 1, when the warp and weft crimp values of F5 fabric were examined, it was seen that the warp threads have lower crimp values.
A microscopic view of F5 fabric a) before and b) after 20000 cycles of abrasion
In Figure 5, when the change in the Δa value after the abrasion of F5 fabric was examined, it was observed that the change in Δa value was high. This fabric showed the highest Δa variation after the F3 fabric woven with 4/4 twill weave structure in the warp direction, while it gave the highest Δa variation value from all of fabrics in the weft direction.
In this study, where the change in the surface of the fabric after the abrasion was evaluated by the surface roughness parameters, it was seen that only the Ra roughness parameter could not give meaningful results alone in evaluating changes in surface properties after abrasion. As with the F5 fabric, no significant changes were observed in Ra values after abrasion, while other roughness parameters such as Rpm and Δa of the fabrics showed very high changes.
When the non-abraded surface roughness parameters of the jacquard weave fabrics (F6 and F7) were examined (Figs. 1 and 3–5), it was seen that the values of Ra, Rpm, Rvm and Δa in the non-abraded state were higher than those of all fabrics, especially in the warp direction. This was thought to be due to the fact that the spaces between the yarns on the fabric surface due to the large unit jacquard pattern structure were irregularly positioning. The images of jacquard fabrics given in microscopic images in Figures 10 and 11 consist only of the section entering the enlargement area in the microscope. A larger view of the pattern forming the surface of these fabrics is presented in Figure 12. It has been observed that the values of the surface roughness parameters of the jacquard patterned fabric surfaces have been increased due to the varying of the yarn positions constituting the jacquard pattern and accordingly the varying distance between the yarns constituting the fabric.

A microscopic view of F6 fabric a) before and b) after 20000 cycles of abrasion

A microscopic view of F7 fabric a) before and b) after 20000 cycles of abrasion

Digital photographs of the F6 and F7 fabric samples
When the changes in Rpm and Rvm values of jacquard weave fabrics after the abrasion process were examined, it was observed that the change in Rpm and Rvm values was lower than that of most fabrics woven with the basic weave pattern. This was thought to be due to the fact that there was more open surface area exposed to abrasion due to the regular positioning of the yarn surfaces on the fabric woven with the basic weave pattern. When the changes in Ra values after the abrasion process were examined, it was observed that the change in the Ra value of the F6 fabric, which has long weft yarn floats on the fabric surface, was higher.
It was also seen in Figure 10b that the crowns of the fine warp yarns intersecting with thick weft yarns were deformed considerably after abrasion. After the abrasion process, it was seen that the ends of the broken fibers were formed in the regions where the warp yarns were crimped. It was observed that where fine and thick yarns intersect on the fabric surface, in the regions where the fine yarns have more crimps around the thick yarns, high abrasion occurs. Because of this, the use of warp and weft yarns in close yarn counts to provide more resistance to abrasion might cause the fabric surface to be more homogeneously affected by the abrasion effect.
However, since F6 jacquard fabric also has a double-layered construction, this fabric provides a better resistance to wear except for deformation of crown of fine warp yarns at the yarn intersection points.
In Figures 1 and 3–4, it was observed that the change in Ra, Rpm, and Rvm values of F7 fabric after abrasion was low. As can be seen from Table 1, the crimp values of warp and weft yarns were very close to each other. Since the change in Rpm and Rvm values was low, the amount of change in the Ra value of the fabric was also low. However, it was seen that the change in the value of Δa after abrasion of F7 fabric was high.
From the results obtained, it has been shown that the evaluation of the change in the Δa roughness parameter in evaluating the effect of deformation on the surface of the fabric after abrasion may be appropriate for a sensitive evaluation.
Correlation coefficient analysis was conducted to determine the relationships between the values of surface roughness parameters of non-abraded fabrics and abraded fabrics. The correlation coefficient analysis between the values of surface roughness parameters of non-abraded fabrics and the values of % change in the fabric roughness values before and after abrasion is presented in Table 2.
Correlation coefficient analysis (R-value) between the values of surface roughness parameters of non-abraded fabrics and the values of % change in the fabric roughness values before and after abrasion
| Surface Roughness Parameters | Warp Direction | Weft Direction |
|---|---|---|
| Ra | 0.28 | 0.41 |
| Rpm | 0.028 | 0.38 |
| Rvm | −0.31 | −0.64 |
| Δa | −0.48 | 0.50 |
In Table 2, the correlation coefficients between the Ra values of the non-abraded fabrics and the values of % change in Ra values after the abrasion process were examined; it was observed that there was a positive relationship between them. This relationship in the weft direction was stronger than that in the warp direction. The positive relationship between them indicates that the fabric structures with high arithmetic average height (Ra) values were more affected by the abrasion process, and as a result, the amount of % change in Ra values increases. This result shows that the fabrics having high initial roughness values in the non-abraded state were more affected by the abrasion process. In Table 2, the correlation coefficients between the Rpm values of the non-abraded fabrics and the values of % change in Rpm values after the abrasion process were examined; it was observed that the relationship in the weft direction was stronger than that in the warp direction. This indicates that the fabrics with high initial Rpm values in the non-abraded state were more affected by the abrasion process. In contrast to the change in correlation coefficients of Ra and Rpm values, Rvm values showed a negative correlation. The negative relationship indicates that the amount of % change in Rvm values after abrasion of fabrics with high initial Rvm values was low. This result was due to the fact that the surface abrasion had a more pronounced effect on the height of peaks variation of the fabric surface; so negative correlation in Rvm values was expected.
In Table 2, the correlation values between the Δa values of the non-abraded fabrics and the values of % change in Δa values after the abrasion process were examined; a negative relationship was observed in the warp direction and a positive relation was found in the weft direction.
In Table 2, it was observed that the correlation coefficient values in the weft direction were higher than those in the warp direction.
These results could stem from the relationship between fabric structural parameters and measurement direction of surface roughness. During the measurement of roughness in the weft direction, the stylus probe of the instrument moves in the direction of the weft and carries out its movements in the cross-direction on the warp surface. In Table 1, when the structural properties of fabrics were examined, it was generally seen that the yarn count (in Nm), yarn density, and crimp values of warp yarns were higher than those of weft yarns. Because of the domination of warp yarns on the analyzed fabric surface in this study, the deformation of warp yarns’ surfaces could be increased. For this reason, the change in the surface roughness parameter values after abrasion in a warp yarn-dominant surface was quite high, and it caused the correlation coefficient value in the weft direction to be high.
3.2 Evaluation of the change in the friction coefficient values
The friction coefficients (static and kinetic) of the fabrics were presented in Figures 13 and 14. The friction coefficient values of all fabrics after abrasion were observed to increase. It was observed that the F3 fabric in which the original state (non-abraded) has the highest friction coefficient value, especially in the warp direction, and this fabric structure showed the highest change in the Ra value in the warp direction (Figure 1) and also high changes in the roughness parameters after the abrasion process. It was observed that the twill weave structure with long floating of yarns has a high friction coefficient.

Changes in the values of the static friction coefficient

Changes in the values of the kinetic friction coefficient
Similarly, it was observed that the original state of the F2 fabric has a high friction coefficient value, especially in the weft direction, and this fabric structure showed a high change in the roughness parameters after the abrasion process.
It was observed that the friction coefficient of the satin fabric (F4) in the warp direction has the lowest value, while it has a high value in the weft direction. This could be due to the mean slope of the profile (Δa) value of the fabrics. In Figure 5, when the Δa values of the fabrics were examined, it was seen that the warp direction means slope of the profile value of F4 fabric in which the original state was quite low, whereas the weft direction means slope of the profile value was considerably high.
The changes in static friction coefficient values changed from the lowest value to the highest one in the queue of F3<F4<F1<F2<F6<F7<F5 in the warp direction and F4<F3<F5<F6<F2<F1<F7 in the weft direction. Kinetic friction coefficient values changed from the lowest value to the highest one in the queue of F4<F3<F6<F2<F7<F5<F1 in the warp direction and F6<F3<F4<F5<F7<F2<F1 in the weft direction.
When the changes in the static and kinetic friction coefficient values of fabrics after abrasion were examined, generally it was observed that a high change was found to be in weave structures such as plain weave (F1 and F2), 100% cotton rib weave (F5), and jacquard weave (woven with tightly) (F7). A low change was found to be in weave structures such as satin weave, 4/4 twill weave, and jacquard weave (woven with long yarn floats). On the other hand, it was expected that the weave structures such as satin and twill fabric with long yarn floats have a high change in the friction coefficient values because the open surfaces of the floating yarns on the fabric surface were more affected by the abrasion process. However, since the plain fabrics examined in this study were woven with thick yarn and low yarn density values compared to other fabrics, the factors such as the excessive amount of fiber ends coming to the surface of the plain fabric structure after abrasion have caused a high change in the friction coefficients of these fabrics. In fabric with twill weave, the fiber ends formed on the fabric surface after abrasion have been observed to reduce the friction coefficient of the fabric by filling the gaps of the diagonal channels in the weave structure. As a result, no significant change in the friction coefficient values of the twill structure after abrasion was observed.
In the analyzes made by evaluating the changes occurring in the friction coefficients after abrasion, it was observed that the fuzz layer formed on the surface decreased the frictional resistance between the two surfaces by filling the gaps between the peak and valley heights on the surface. For this reason, although the surface roughness parameters showed a high change after the abrasion, the changes in the surface friction coefficients of the fabrics were found to be low.
4 Conclusions
In this study, it was aimed to evaluate the changes in the tribologic properties of upholstery woven fabrics after abrasion by the rate of changes in surface roughness parameters and friction coefficients.
From the results obtained, it was observed that the surface roughness parameters were suitable for sensitively evaluation of the deformation of the fabric surface properties after abrasion. It has been found that in evaluating the changes in surface properties, besides the most commonly used Ra parameter, other surface roughness parameters such as Rpm, Rvm, and Δa were also suitable for a more precise evaluation.
In particular, visually undetectable changes have been perceived to be sensitive to changes in the Δa roughness parameter. It has been observed that in the cases where the mechanical damage caused by the abrasion on the yarns could not be visually perceived, the deformation occurring at the settlement of the yarns due to the mobility of yarns could be perceived sensitively by evaluating the change in Δa values. It has been shown that the Δa roughness parameter might be suitable for evaluating the deformation of the textile structures to be used, especially in more sensitive uses.
It has been observed that the changes in the surface roughness parameters after abrasion in the plain fabrics made by one-to-one yarn intersection were low while the fabrics have the consecutively long yarn floats were high. In addition, it was appropriate to use double-layered structures in upholstery fabrics in order to minimize the effect of abrasion on the upper layer fabric surface, in other words, reducing the mobility of the yarns during the abrasion by lining the bottom layer.
In the analyses made by evaluating the changes occurring in the friction coefficients after abrasion, it was seen that the fuzz layer formed on the surface after abrasion could fill the peak and valley heights on the surface, and this could reduce the friction resistance between the two surfaces. For this reason, it was seen that the changes in the friction coefficients of fabric surfaces after abrasion were low. Therefore, it had been observed that surface deformations of the fabrics after the abrasion process might not be suitable only by evaluating the changes in the friction coefficients of the fabrics. It had been observed that the changes in the friction coefficient values should be used in conjunction with other evaluation parameters to analyze the surface deformation results after abrasion.
References
[1] Bhushan, B. (2001). Modern Tribology Handbook, Volume One Principles of Tribology. Boca Raton, CRC Press.10.1201/9780849377877Search in Google Scholar
[2] Williams, J. (2005). Engineering Tribology. New York, Cambridge University Press.10.1017/CBO9780511805905Search in Google Scholar
[3] Hutchings, I., Shipway, P. (2017). Tribology: Friction and Wear of Engineering Materials, 2nd Edition, Saint Louis, Elsevier.10.1016/B978-0-08-100910-9.00003-9Search in Google Scholar
[4] Collier, B. J., Epps, H. H. (1998). Textile Testing & Analysis. New Jersey, NJ, Prentice-Hall.Search in Google Scholar
[5] Manich, A. M., De Castellar, M. D., Sauri, R. M. (2001). Abrasion kinetics of wool and blended fabrics. Textile Research Journal, 71, 469–474.10.1177/004051750107100601Search in Google Scholar
[6] Sarıduman, S. (2005). A Study on the features of miscellaneous weft wale corduroys in industrial production. M.Sc. Thesis, Department of Textile Engineering, Institute of Natural and Applied Science, University of Cukurova, 169.Search in Google Scholar
[7] Abdullah, I., Blackburn, R. S., Russell, S. J., Taylor, J. (2006). Abrasion phenomena in twill tencel fabric. Journal of Applied Polymer Science, 102, 1391–1398.10.1002/app.24195Search in Google Scholar
[8] Backer, S. (1951). The relationship between the structural geometry of a textile fabric and its physical properties: Part II: The mechanics of fabric abrasion. Textile Research Journal, 21, 453–468.10.1177/004051755102100701Search in Google Scholar
[9] Backer, S., Teanenhaus, S. J. (1951). The relationship between the structural geometry of a textile fabric and its physical properties Part III: Textile geometry and abrasion-resistance. Textile Research Journal, 21, 635–654.10.1177/004051755102100904Search in Google Scholar
[10] Weiner, L. I. (1961). A note on directional effects in the abrasion of cotton sateen. Textile Research Journal, 31, 580–582.10.1177/004051756103100612Search in Google Scholar
[11] Ruppenicker, G. F., Rhodes, P. L., Harper, R. J., Verburg, G. P., Little, H. W. (1971). American Dyestuff Reporter, 60, 31.Search in Google Scholar
[12] Can, Y., İnanç, L. (2017). Change of rubbing fastness with abrasion effect on cotton plain fabrics. Düzce University Journal of Science & Technology, 5, 50–55.Search in Google Scholar
[13] Kaynak, H. K., Topalbekiroğlu, M. (2008). Influence of fabric pattern on the abrasion resistance property of woven fabrics. Fibres & Textiles in Eastern Europe, 16, 54–56.Search in Google Scholar
[14] Saha, R. (2011). Advances in topographic characterization of textile materials. Journal of Innovation & Development Strategy, 5, 67–74.Search in Google Scholar
[15] Vandenberg, S., Osborne, C. F. (1992). Digital image processing techniques, fractal dimensionality and scale-space applied to surface roughness. Wear, 159, 17–30.10.1016/0043-1648(92)90281-CSearch in Google Scholar
[16] Militky, J., Bajzik, V. (2003). Surface roughness of heat protective clothing textiles. International Journal of Clothing Science and Technology, 15, 258–267.10.1108/09556220310478369Search in Google Scholar
[17] Gadelmawla, E. S., Koura, M. M., Maksoud, T. M. A., Elewa, I. M., Soliman, H. H. (2002). Roughness parameters. Journal of Materials Processing Technology, 123, 133–145.10.1016/S0924-0136(02)00060-2Search in Google Scholar
[18] Jeddi, A. A. A., Shams, S., Nosraty, H., Sarsharzadeh, A. (2003). Relations between fabric structure and friction: Part I: Woven fabrics. Journal of the Textile Institute, 94, 223–234.10.1080/00405000308630611Search in Google Scholar
[19] Ohsawa, M., Namiki, S., Kodaka, H. (1979). Relationship between fabric balance and surface friction of plain-woven fabrics. Journal of the Textile Machinery Society of Japan, 32, T40–T46.10.4188/jte1955.15.98Search in Google Scholar
[20] Zurek, W., Jankowiak, D., Frydrych, I. (1985). The surface frictional resistance of fabrics woven from filament yarns. Textile Research Journal, 55, 113–121.10.1177/004051758505500207Search in Google Scholar
[21] Das, A., Kothari, V. K., Nagaraju, V. (2007). Frictional characteristics of woven suiting and shirting fabrics. Indian Journal of Fibre & Textile Research, 32, 337–343.Search in Google Scholar
[22] Das, A., Kothari, V. K., Vandana, N. (2005). A study on frictional characteristics of woven fabrics. Autex Research Journal, 5, 133–140.10.1515/aut-2005-050303Search in Google Scholar
[23] Balcı, G., Sülar, V. (2013). Yarn friction properties: Importance and test methods. The Journal of Textiles and Engineers, 16, 6–15.Search in Google Scholar
© 2020 Mine Akgun, published by Sciendo
This work is licensed under the Creative Commons Attribution 4.0 International License.
Articles in the same Issue
- Compressive Property of an Auxetic-Knitted Composite Tube Under Quasi-Static Loading
- Investigation of the Tribological Behaviors of Upholstery Woven Fabrics after Abrasion
- Microstructural Damage Characteristic of a Layer-to-Layer Three-Dimensional Angle-Interlock Woven Composite Under Quasi-Static Tensile Loading
- Initial Investigation Into Real 3D Body Scanning Versus Avatars for the Virtual Fitting of Garments
- Mathematical Model Predicting the Heat and Power Dissipated in an Electro-Conductive Contact in a Hybrid Woven Fabric
- A Method of 1D UVC Radiation Dose Measurement using a Novel Tablet Dosimeter
- Introducing a Newly Developed Fabric for Air Filtration
- A New Approach to Evaluate Fabric Hand Based on Three-Dimensional Drape Model
- Study on the use of Aerogel on the Surface of Basalt Fabric
- Analysis of Factors Affecting Thermal Comfort Properties of Woven Compression Bandages
- Country-Specific Determinants of Textile Industry Development in Poland: Comparative Analysis of the Years 2007 and 2017
- Comparative Study of Needle Penetration Forces in Sewing Hems on Toweling Terry Fabrics: Influence of Needle Type and Size
- Numerical and Experimental Comparative Analysis of Ballistic Performance of Packages Made of Biaxial and Triaxial Kevlar 29 Fabrics
- Characterization of Fabric-to-Fabric Friction: Application to Medical Compression Bandages