Analysis of Factors Affecting Thermal Comfort Properties of Woven Compression Bandages
-
Abdelhamid R.R. Aboalasaad
 ,
Z. Skenderi
,
Z. Skenderi

Abstract
Compression bandage (CB) as a porous material should provide both graduated pressure and thermal comfort properties to enable air permeability, heat transfer, and liquid perspiration out of the human body. The main factors affecting thermal comfort properties are the temperature difference between environment and skin, yarns’ structure and material, fabric thickness, porosity, areal density, number of fabric layers, trapped air, and fabric structure. Thermal resistance (Rct) and water vapor resistance (Ret) are evaluated for four types of woven CBs. All bandage types were applied at the range of extension (10–80%) using both two- and three-layer bandaging on thermal foot model (TFM). Rct values are compared with measured results by the Alambeta instrument, whereas Ret test is performed on the Permetest device. Thermal resistance is significantly decreased when increasing the bandage extension from 10 to 40%, then it is slightly increased by increasing the extension from 40 to 60%, after that it is decreased especially at 80% extension due to lower bandage thickness and higher compression.
1 Introduction
Clothing comfort is an important factor in the stage where people make their clothing selections [1]. Human thermal comfort is defined as a condition of mind, which expresses satisfaction with the surrounding environment. High temperatures and humidity provide discomfort sensations and sometimes heat stress (i.e., reducing the body’s ability to cool itself). Moreover, discomfort and heat stress reduce productivity of workers and may lead to more serious health problems, especially for aged persons [2]. The thermal resistance of fabrics is a primary determinant of body heat loss in cold environments. Generally, high thermal resistance values of the clothing are required to maintain the body under thermal equilibrium conditions. In hot environments or at high activity levels, evaporation of sweat becomes an important avenue of body heat loss and fabrics must allow water vapor to escape in time to maintain the relative humidity between the skin and the first layer of clothing about 50% [2,3,4,5]. Perspiration is the process of losing body heat due to the moisture evaporation from the skin to the environment [6]. The warm–cool feeling is another parameter showing the thermal comfort. When the human touches a garment that has a different temperature than the skin, heat exchange occurs between the hand and fabric, so the warm–cool feeling is the first sensation. Which feeling is better depends on the customer; a cooler feeling is demanded for hot summer garments, whereas warmer feeling is preferred in winter [7].
Compression bandages (CBs) are produced with optimum stretch using highly twisted warp yarns such as cotton bandages, or elastomeric filament (elastane or spandex) with cotton or viscose, or using two or more yarns having different melting points as viscose–polyamide (V-PA) or cotton–polyamide–polyurethane (C-PA-PU) in which case bandage stretch and elasticity are given by steaming then heat setting. Medical CB (MCB) is designed to meet both the safety and the comfort of human beings, especially patients. MCB aims to provide graduated compression to the lower limb from the ankle to the knee to improve venous return, accelerate venous flow, reduce venous reflux by realignment of valves, improve venous pump action, and to reduce edema [8, 9].
1.1 Important terms and definitions
The heat energy can be transferred through the textile fabrics by conduction, convection and radiation as well as easily explainable phenomena such as heat exchange in porous media. The basic concepts of heat transfer through CB are explained as follows [10]:
“Thermal conductivity coefficient” (λ): heat transfer by conduction depends on the materials’ heat conductivity, i.e., their capacity for transferring heat from a warmer medium to a cooler one. Conductivity coefficient λ expressed in W/m °C or W m−1 °C−1 conveys the heat flow (Q) which is expressed in Watt, passing in 1 h through an area (A) of 1 m2 of the fabric, having thickness L at a temperature difference (Tm–Ta) in °C, as given in equation (1):
However, the heat transfer coefficient K expressed in W/m2×°C conveys the heat flow passing during 1 hour through 1 m2 of fabric with actual thickness L at the difference of temperatures of two media (air and fabric) 1°C, as shown in equation (2):
“Thermal resistance” (Rct) of textile fabrics is a function of the actual thickness of the material and its thermal conductivity λ. This function is given by equation (3), where L is the actual thickness of the sample expressed in meter.
“CLO value”, the CLO is a unit of insulation, defined as the amount of insulation necessary to maintain comfort and a mean skin temperature of 33°C (92°F) in a room at 21°C (70°F) with air movement not over 3 m/min, relative humidity not over 50%, with a metabolism of 50 calories/m2/hour. The CLO value is based upon human physiological factors as well as upon the engineering measurement of thermal characteristics. Lowest CLO value (0) is that of a nude person, highest practical CLO value (4) is that of Eskimo clothing (such as pants, coat, hood, and gloves). The Tog also describes the thermal resistance of clothing, 1 Tog = 0.645 CLO, and is equivalent in insulation to light summer clothing [11].
1.2 Factors affecting testing of thermal properties
The measurement of clothing insulation with thermal manikin is a dynamic balance adjustment process. It means that continuous adjustment of heat flux makes the manikin skin temperature approach a constant temperature gradually under the heat diffusion. The final state is that the manikin skin temperature is steady in a narrow range and very close to the constant temperature [12].
Through further adjustment and control, the skin temperature change of all parts approaches steadily the narrow range around the set temperature. The set balance range is ±0.2°C around the constant temperature and is on the trend to reduce gradually. At the same time, the central temperature of the thermal manikin is getting closer to the set skin temperature. With all such essential conditions achieved, the system gets into the balance stage. After a while, we can calculate testing results according to all the balance parameters and print them out (Figure 1) [12].
![Figure 1 Skin temperature adjusting and control process of X parts of thermal manikin [12]](/document/doi/10.2478/aut-2019-0028/asset/graphic/j_aut-2019-0028_fig_001.jpg)
Skin temperature adjusting and control process of X parts of thermal manikin [12]
1.3 Effect of trapped air on thermal resistance of multilayer fabrics
When people wear multilayer clothing ensembles under cold weather conditions or in hot environments, air spaces (air layer) are present between the skin and the inner layer or between two adjacent layers. These air spaces play a vital role in determining thermal properties of clothing. The thermal resistance of multilayer fabrics with air layers increased generally as the thickness of the air spaces increased up to a critical point. When the air layer thickness increased further above this point, the rate of increase in thermal resistance was slow owing to disturbance of convection and turbulence. This critical thickness was observed to be variable in different studies. Thus, including air spaces that are close to real life is an effective way to enhance thermal resistance of multilayer fabrics. More insulation per additional layer was obtained, when fabrics were assembled, a thin layer of air was enclosed between the layers, especially for fabrics with rough or irregular surfaces. Moreover, more insulation per additional layer could be ascribed to the fact that air spaces were between two layers, resulting in greater thermal resistance than the sum of single layers [10].
1.4 Effect of pressure on heat transfer through multilayer fabrics
CB is often worn under a pressure load, which is a significant factor in determining heat transfer properties of multilayer fabrics. O’Callaghan and Probert [13] tested the thermal resistance of one to eight layers of woven cotton, polyester, and nylon fabrics under various mechanical loads and indicated that the thermal resistance of fabric assemblies reduced with an increase in applied loading and that these decreases were relatively low as compared with changes resulting from varying the thickness. In addition, n-layers of fabrics provided less thermal resistance than a single layer of fabrics with the same thickness as n-layers of fabrics. Karunamoorthy and Das [14] developed a modified version of the guarded hot plate apparatus and measured the thermal resistance and conductivity of 20 different multilayer needle-punched nonwoven fabric assemblies under three levels of compression load (700, 1400, and 2100 Pa). The test results showed that the thermal conductivity of fabric assemblies was greater at the higher compression load due to a decrease in the volume of entrapped air.
Most of the researches on the thermal comfort properties performed either on knitted fabrics or nonwoven [15,16,17,18,19]. Many researchers have studied the effect of raw materials and knitted fabric construction parameters on the comfort behavior of fabrics. Investigations revealed that the type of fibers, fiber blends, yarn structure and its fineness, fabric structure, and different process parameters affect various comfort properties such as air permeability, moisture management, thermal conductivity, and thermal absorptivity [20,21,22,23,24].
So that it is necessary to test and analyze the thermal comfort properties of woven CBs, dealing with different yarn materials, fabric structures, thickness, porosity, weight per unit area, and number of bandage layers as a function of the applied compression during testing on thermal foot model (TFM), Permetest, and Alambeta testing devices.
2 Experimental work
2.1 Materials
Input materials for the creation of experimental woven CB samples were as follows: 1) 100% bleached cotton, 2) C-PA-PU, 3) V-PA, and 4) viscose–Lycra (V-L) bandages, as illustrated in Figure 2.
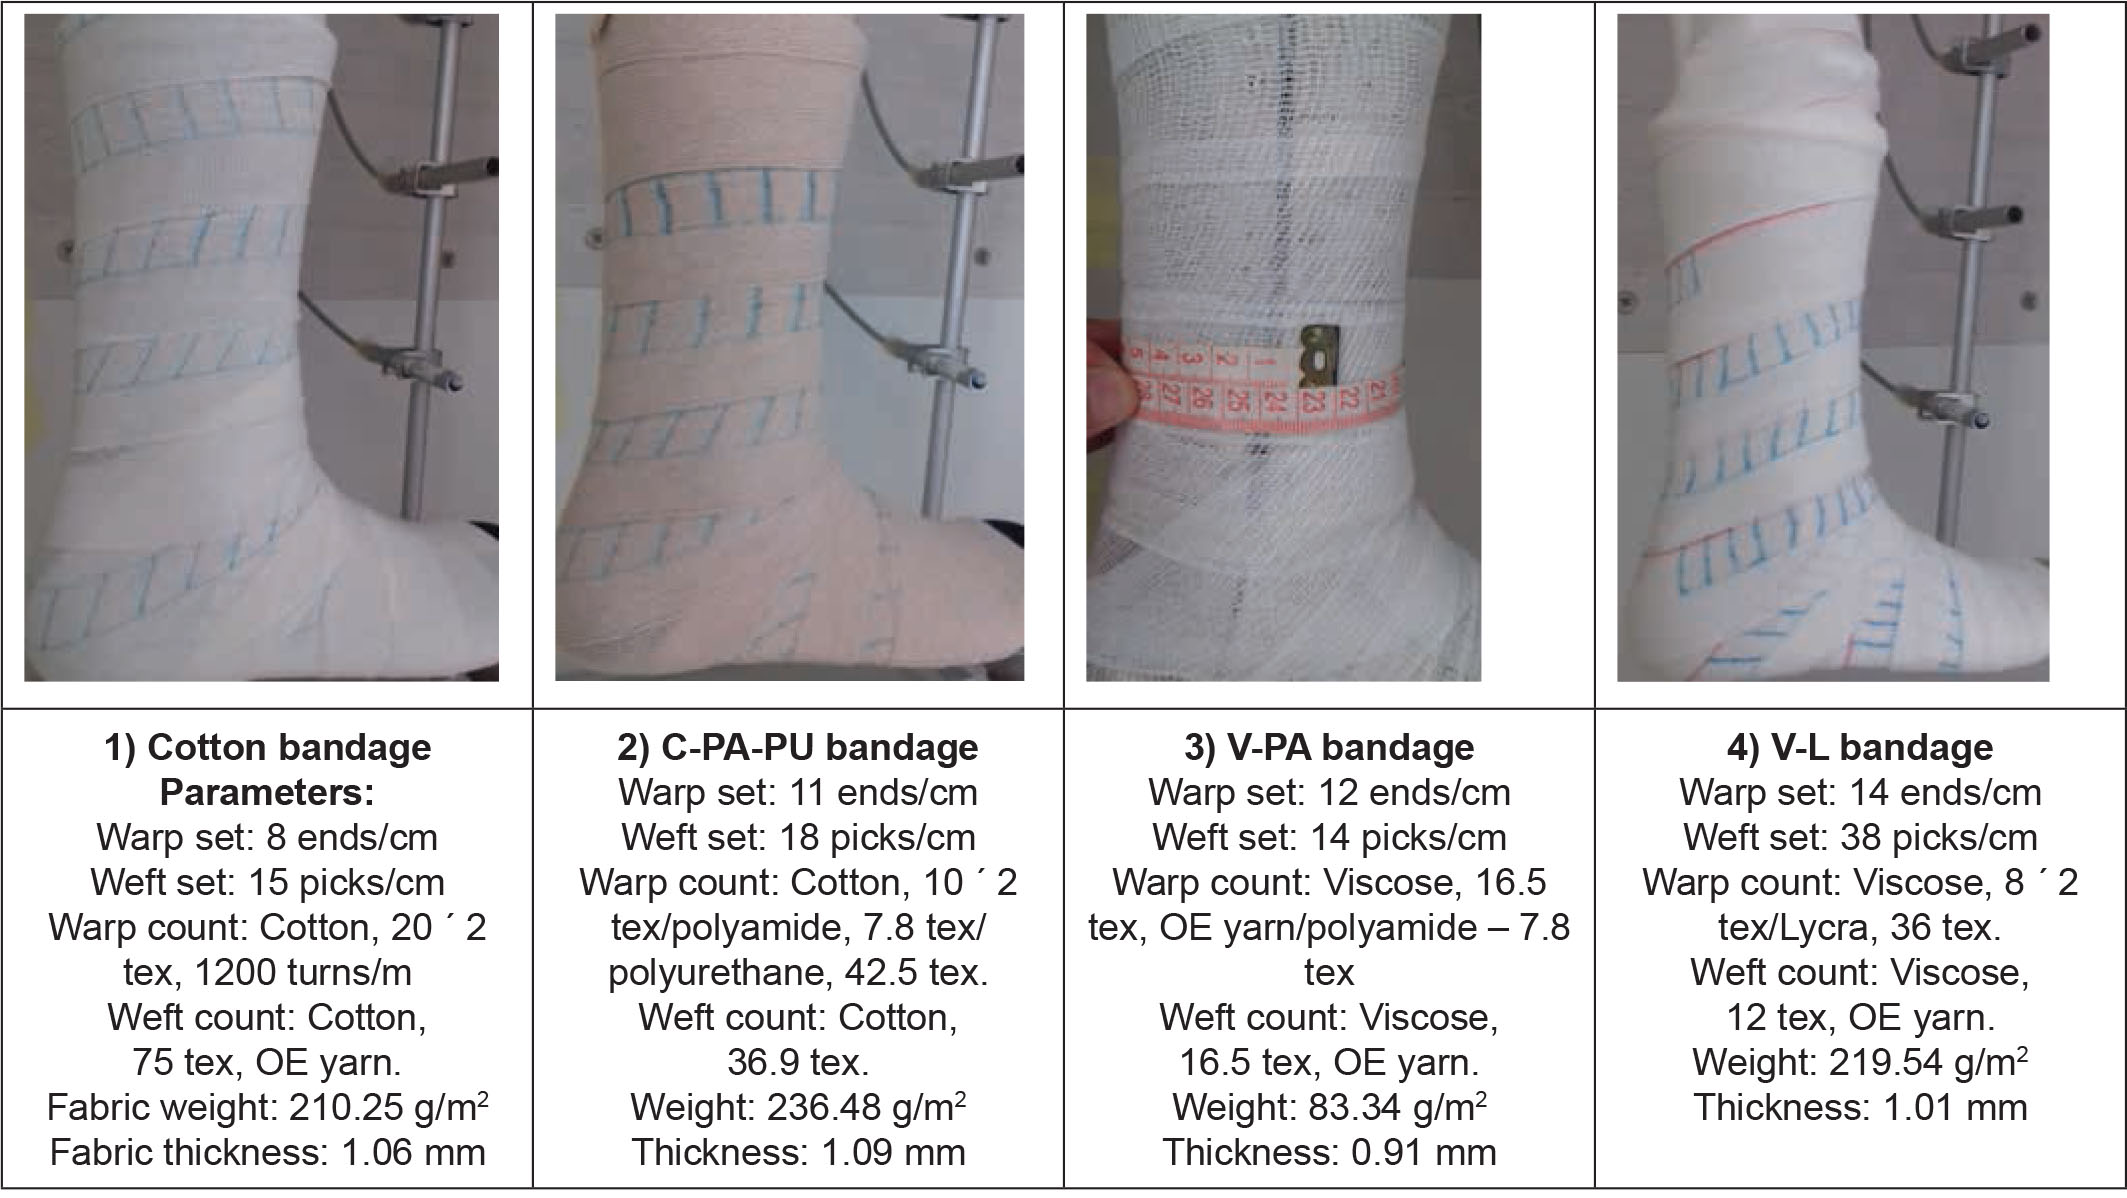
Woven CB samples on TFM and its characteristics
CB, compression bandage; C-PA-PU, cotton–polyamide–polyurethane; TFM, thermal foot model; V-L, viscose–Lycra; V-PA, viscose–polyamide
2.2 Testing procedure
2.2.1 TFM description
The measurement unit (MU) of foot manikin which is a part of original Thermal Sweating Foot Manikin System [25] was used for the measurement of thermal resistance only. The length of MU along x-axis is 265 mm, whereas along z-axis is 270 mm. The unit consists of 13 segments all made of silver. There are 30 heaters on the MU, from 2 to 4 for each segment, depending on the segment area. Each segment can be separately heated, turned off, or individually controlled by special software. The range of controlled temperature was set at ±0.5°C.
The main four types of CBs were wrapped on TFM at the range of extension (10–80%) using both 50 and 66% overlap (i.e., two- and three-layer bandaging, respectively). Thermal resistance (Rct) was measured using TFM for all types of CBs as shown in Figure 2 [26]. Relative water vapor permeability and water vapor resistance (Ret) were measured using the Permetest instrument [27] according to ISO 11092 standard, at laboratory conditions (T: 22±2°C, RH: 50±2%), as shown in Figure 3 [28]. The obtained results of Rct were compared with Alambeta [29] testing device results as shown in Figure 4 [30]. All bandage samples were measured using Alambeta at initial porosity (0% extension) and (20–100%) using special tensioning frame as shown in Figure 5. Air permeability test was carried out using FX3300 air permeability tester according to ASTM D737 at working pressure of 100 Pa and 20 cm2 test area [31, 32].
![Figure 3 Permetest device for testing Ret and Rct [28]](/document/doi/10.2478/aut-2019-0028/asset/graphic/j_aut-2019-0028_fig_003.jpg)
Permetest device for testing Ret and Rct [28]
![Figure 4 Alambeta testing device for thermal comfort properties [30]](/document/doi/10.2478/aut-2019-0028/asset/graphic/j_aut-2019-0028_fig_004.jpg)
Alambeta testing device for thermal comfort properties [30]

Stretching frame at 80% extension: a) cotton, b) C-PA-PU bandages C-PA-PU, cotton–polyamide–polyurethane
2.2.2 Adjusting the factors affecting Rct measurement on TFM
The following steps are practical example to show how to adjust and stabilize the optimum conditions of TFM to test Rct of CB (Figure 6). Segments 1 and 3 are kept off because CB effect usually starts after these segments and device door is opened. There are two types of testing (i.e., nude and clothed manikin) [12]. For clear comparison, mercerized cotton socks are used to cover TFM as underwear for all measured samples to ensure more stabilization and steady conditions as shown in Figure 7.

Optimum testing procedure of measuring Rct on TFM. TFM, thermal foot model

(a) Segments of TFM and (b) reached steady state condition TFM, thermal foot model
The stabilization process continues till the device reads the standard ambient conditions (T: 20±2°C, RH: 50±5%), after that the measurement of the initial thermal resistance (Rct0), then stabilization (waiting for 20 min) while wearing CB sample over socks. Finally, Rct values can be measured using the measured Rct0 as a reference value (Figure 8 and equation 4) [5].
where Rct is the dry resistance of sample only (m2°C/W), Ts is the hot plate surface temperature (°C), Ta is the ambient temperature (°C), H/A is the zone heat flux (W/m2), Rct0 is the clothed TFM dry resistance (m2°C/W). Ret is the evaporative resistance of sample only (m2Pa/W), ps is the saturation vapor pressure at hot plate surface (Pa), and pa is the ambient partial vapor pressure (Pa).

Measuring Rct while wearing CB over socks
CB, compression bandage
3 Results and discussions
3.1 Effect of bandage extension and number of layers on thermal resistance
For comparison, all bandage types were wrapped on TFM at the same extension levels that range from 10 to 80% using both two- and three-layer bandaging. Figures 9 and 10 illustrate that thermal resistance (Rct) is significantly decreased by increasing the bandage extension from 10 to 40% due to the decrease in total thickness of layers. Then, Rct is slightly increased by increasing the extension from 40 to 60% that may be due to the higher porosity of bandages (0.364, 0.306, 0.471, and 0.325 for cotton, C-PA-PU, V-PA, and V-L bandages, respectively) [33, 34]. Moreover, it is illustrated that cotton bandage has the lowest Rct values due to yarns’ material and structure. This may be due to higher moister regain of cotton (8.5%) and viscose (11–12%) compared with polyamide (4–4.5%) and polyurethane (0.3–1.2%), which decreases the thermal resistance of cotton and viscose bandages [35,36,37]. After that, Rct values are decreasing for all samples, especially at 80% extension. The most significant factors for this decrease are the lower bandage thickness and higher compression values.

Effect of bandage extension on thermal resistance of two-layer CB.

Effect of bandage extension on thermal resistance of three-layer CB.
As many factors can affect the thermal resistance measurements, it was necessary to measure Rct0 before each measurement using clothed TFM. There is Rct0 for each Rct measurement to get the precise Rct values of CB and simultaneously to monitor deviations of Rct0 values. The actual values of Rct can be calculated directly by the device software adding measured Rct0 as reference value. Moreover, the obtained Rct values could enable for clear comparison between different bandage samples as illustrated by equation (6).
where Rct(F) is the net thermal resistance of the bandage sample (two or three layers), Rct(all) is the total thermal resistance of the bandage sample + one layer of mercerized socks as clothed TFM, and Rct0 is the initial thermal resistance of the clothed TFM wearing mercerized socks only.
3.2 Relationship between applied tension and thermal resistance
While increasing the applied bandage tension from 0.5 to 10 N, the thermal resistance is decreasing. These results declare the effect of increasing the bandage compression and decreasing fabric thickness at higher values of extension. Moreover, the bandage porosity is increasing based on the increase in bandage tension. The same behavior for three layers, but the additional effect of third layer, is lower than the first and second layers as shown in Figures 11 and 12. This is attributed to the fact that the thermal resistance of the multilayer fabrics decreases under higher load values or due to the compression between layers.

Effect of applied tension on thermal resistance of two-layer CB.

Effect of applied tension on thermal resistance of three-layer CB.
3.3 Effect of total thickness of layers on thermal resistance
However, the bandages are wrapped on TFM at extension level ranged from 10 to 80% using both 50% and 66% overlap. The total thicknesses of bandage layers at 10% extension are 2.04, 2.15, 1.53, and 2.07 mm. These values are decreasing at 80% to be 1.04, 1.11, 0.76, and 1.08 mm for cotton, C-PA-PU, V-PA, and V-L bandages, respectively. So that thermal resistance is decreasing by the decrease in total bandage thicknesses for both two- and three-layer bandaging, as shown in Figures 13 and 14, respectively. The reduction percentage of Rct results due to extension 10–80% are 48.09, 26.63, 26.73, and 36.66% for cotton, C-PA-PU, V-PA, and V-L bandages, respectively, using two layers while the reduction effect was lower for three layers as 29.37, 25.77, 18.52, and 24.08%, respectively.

Effect of layer thickness on thermal resistance of two-layer CB

Effect of layer thickness on thermal resistance of three-layer CB.
3.4 Effect of bandage extension on thermal conductivity and resistivity
Alambeta testing device was used to test thermal conductivity and resistivity for all bandage samples at initial porosity (0% extension) and (20–100% extension) using two layers during testing. Figure 15 concludes the thermal conductivity values for cotton, C-PA-PU, V-PA, and V-L bandages as 0.06815, 0.05337, 0.05648, and 0.05921 (W m−1 K−1), at 0% extension,, whereas the conductivity decreases at 100% to 0.04705, 0.03573, 0.03781, and 0.04424, respectively. This decrease may be due to the decrease in bandage thickness and higher porosity values when increasing the bandage extension to 100%. As for the thermal resistance, Figure 16 illustrates that Rct is proportionally increasing with bandage extension. The Rct values at 0% extension are 0.02078, 0.03215, 0.03149, and 0.02966 (K×m2×W−1), whereas at 100% extension Rct increases to 0.02419, 0.03579, 0.03486, and 0.03144 for cotton, C-PA-PU, V-PA, and V-L bandages, respectively.

Effect of bandage extension on thermal conductivity coefficient

Comparison between Rct values on TFM and Alambeta, two layers. TFM, thermal foot model
There is a bit deviation between Alambeta and TFM testing results of CBs, because the compression effect for both two- and three-layer bandaging is more significant when using the TFM model, as concluded in Figure 16. Moreover, Alambeta testing is performed on planner fabric not simulating the real bandage wrapping. So that according to TFM, the Rct values are decreasing as the bandage extension increases from 10 to 80% due to the significant increase in bandage tension.
3.5 Effect of bandage extension on water vapor resistance
Water vapor permeability is the ability to transmit vapor out of the body, and it can be calculated theoretically by equation (5). If the moisture resistance is too high to transmit heat, by the transport of mass and at the same time the thermal resistance of the textile layers considered by us is high, the stored heat in the body cannot be dissipated and causes an uncomfortable sensation [38].
Water vapor resistance for all bandages was measured using Permetest device at 0% extension, and 10–80% extension for two-layer bandaging. Obtained results confirm that the Ret is decreasing while increasing the bandage extension to 20% then it is improving till 60% then it is significantly decreasing at 80% extension, as indicated in Figure 17. However, the testing on Permetest is fast, easy, and nondestructive, but it is not exactly simulating the required testing method of Ret for CBs as compared with TFM in which case the compression influence and air layer between each two adjacent bandage layers are more significant factors.

Effect of bandage extension on water vapor resistance
3.6 Effect of bandage extension on air permeability
Air permeability test was performed for all bandage samples at initial porosity of 0% extension and 10–100% extension using two layers for testing. The obtained results confirmed that the air permeability values of all CBs are significantly improved when increasing the bandage extension at the range of 0–100%. Figure 18 emphasizes that V-PA bandage has the highest air permeability due to higher porosity and lower areal density (83.34 g/m2) compared with other bandages, as illustrated in Figure 2.

Effect of bandage extension on air permeability, two layers
4 Conclusion
Four main types of woven CBs were used for testing the Rct and Ret of CB on the TFM and Permetest devices, respectively. TFM enabled bandage application under tension and provided a valuable insight into heat distribution across the entire ensemble under simulated wear conditions. The main factors affecting thermal comfort properties were discussed and analyzed. According to TFM, Rct values were significantly decreasing by increasing the bandage extension from 10 to 40% due to the decrease in fabric thickness. Then, it was slightly increasing from 40 to 60% extension that may be due to the higher porosity of bandages (i.e., 0.364, 0.306, 0.471, and 0.325 for cotton, C-PA-PU, V-PA, and V-L bandages, respectively) and optimum bandage thickness and air layer. After that, Rct was decreasing, especially at 80% extension due to lower bandage thickness and higher applied tension. The compression effect was more significant when using the TFM compared with Alambeta in which the testing samples are in planner form and noncompressed. The obtained results by Permetest confirmed that the Ret was decreasing while increasing the extension to 20% then it was slightly increasing at 20–60%, after that it was significantly decreasing at 80% extension due to lower thickness and little amount of trapped air between fabric layers. Results ensured that the air permeability of all CBs was significantly improving when increasing the bandage extension at the range of 0–100%.
Acknowledgments
This work is supported by Student Grant Scheme (SGS 21249), Technical University of Liberec, Czech Republic. I would like to acknowledge the assistance and cooperation of my colleagues (Emilija Zdraveva, Dora Hranilović, and Tariq Mansoor), especially during testing of my samples.
References
[1] Utkun, E. (2015). A research on various comfort properties of interlock knitted fabrics. Industria Textila, 66(1).Search in Google Scholar
[2] Huang, J. (2016). Review of heat and water vapor transfer through multilayer fabrics. Textile Research Journal, 86(3), 325–33610.1177/0040517515588269Search in Google Scholar
[3] Ghosh, A., Mal, P., Majumdar, A., Banerjee, D. (2017). An investigation on air and thermal transmission through knitted fabric structures using the Taguchi method. Autex Research Journal, 17(2), 152–163. DOI: 10.1515/aut-2016-0009.Search in Google Scholar
[4] Qian, X., Fan, J. (2009). A quasi-physical model for predicting the thermal insulation and moisture vapour resistance of clothing. Applied Ergonomics, 40(4), 577–590.10.1016/j.apergo.2008.04.022Search in Google Scholar PubMed
[5] Salopek, C. I., Skenderi, Z. (2010). Approach to the prediction of thermophysiological comfort, Chapter 09 in DAAAM International Scientific Book 2010, pp. 081–088, B. Katalinic (Ed.). DOI: 10.2507/daaam.scibook.2010.09.Search in Google Scholar
[6] Bizjak M., Gorjanc D. (2014). The influence of increased elasticity on resistance of cotton fabrics. XIIIth International Izmir Textile and Apparel, April 2–5Search in Google Scholar
[7] Çolak, S. M., et al. (2016). Thermophysiological comfort properties of the leathers processed with different tanning agents. Journal of Textile and Apparel/Tekstil ve Konfeksiyon, 26(4), 436–443.Search in Google Scholar
[8] Nelson, E. A., Hillman, A., Thomas, K. (2014). Intermittent pneumatic compression for treating venous leg ulcers. Cochrane Database of Systematic Reviews, (5). Art. No.: CD001899. DOI: 10.1002/14651858.CD001899.pub4.Search in Google Scholar PubMed
[9] Agale, S. V. (2013). Chronic leg ulcers: epidemiology, aetiopathogenesis, and management. Ulcers, Hindawi Publishing Corporation, 2013 Ulcers, Article ID 413604. http://dx.doi.org/10.1155/2013/413604.10.1155/2013/413604Search in Google Scholar
[10] Abdel-Rehim, Z. S., Saad, M. M., El-Shakankery, M., Hanafy, I. (2006). Textile fabrics as thermal insulators. AUTEX Research Journal, 6(3), 148–161.10.1515/aut-2006-060305Search in Google Scholar
[11] Bairagi S., et al. (2016). Study on potential application of natural fibre made fabrics as thermal insulation medium, American International Journal of Research in Science, 16–203.Search in Google Scholar
[12] Nilsson, H., Holmér, I. (2000). Proceedings of the Third International Meeting on Thermal Manikin Testing, 3IMM, at the National Institute for Working Life, October 12–13, 1999. www.niwl.se/ah/nr2000:4.Search in Google Scholar
[13] O’Callaghan, P. W., Probert, S. D. (1977). Thermal resistance behaviour of single and multiple layers of clothing fabrics under mechanical load. Applied Energy, 3(1), 3–12.10.1016/0306-2619(77)90003-4Search in Google Scholar
[14] Karunamoorthy S., Das A. (2014). Study on thermal resistance of multilayered fabrics under different compressional loads. The Journal of The Textile Institute, 105(5), 538–546.10.1080/00405000.2013.827388Search in Google Scholar
[15] Srdjak, M., Skenderi, Z., Cubric, I. S. (2009). Water vapor resistance of knitted fabrics under different environmental conditions. Fibres and Textiles in Eastern Europe, 17(2), 72–75.Search in Google Scholar
[16] Kotb, N. A., et al. (2011). Quality of summer knitted fabrics produced from microfiber/cotton yarns. Journal of Basic and Applied Scientific Research, 1(12), 3416–3423.Search in Google Scholar
[17] Ramachandran, T., Manomani, G., Vigneswaran, C., (2010). Thermal behavior of ring – and compact – spun yarn single jersey, rib and interlock knitted fabrics. Indian Journal of Fibre and Textile Research, 35, 250–257.Search in Google Scholar
[18] Oğlakcioğlu, N., Marmarali, A. (2007). Thermal comfort properties of some knitted structures. Fibres and Textiles in Eastern Europe, 15(5–6), 64–65.Search in Google Scholar
[19] Hes, L., (1987). Thermal Properties of Nonwovens. Proceedings of Congress Index 87, Geneva.Search in Google Scholar
[20] Chidambaram, P., Govind, R., Venkataraman, K. C., (2011). The effect of loop length and yarn linear density on the thermal properties of bamboo knitted fabric. AUTEX Research Journal, 11(4), 102–105.10.1515/aut-2011-110402Search in Google Scholar
[21] Ogulata, R. T., Mavruz, S. (2010). Investigation of porosity and air permeability values of plain knitted fabrics. Fibres and Textiles in Eastern Europe, 18, 71–75.Search in Google Scholar
[22] Onofrei, E., Rocha, A. M., Catarino, A. (2011). The influence of knitted fabrics’ structure on the thermal and moisture management properties. Journal of Engineered Fibres and Fabrics, 6(4), 10–22.10.1177/155892501100600403Search in Google Scholar
[23] Ramakrishnan, G., Dhurai, B., Mukhopadhyay, S. (2009). An investigation into the properties of knitted fabrics made from viscose microfibres. Journal of Textile and Apparel, Technology and Management, 6(1), 1–9.Search in Google Scholar
[24] Cubric, I. S., Skenderi, Z., et al. (2012). Experimental study of thermal resistance of knitted fabrics. Experimental Thermal and Fluid Science, 38, 223–228.10.1016/j.expthermflusci.2011.12.010Search in Google Scholar
[25] Foot Manikin Technical Specification for model FM 005-08, Version 1.0, March 2010, UCS d.o.o., Slovenia.Search in Google Scholar
[26] Mekjavic, I. B., et al. (2005). Static and dynamic evaluation of biophysical properties of footwear: the Jozef Stefan institute sweating thermal foot manikin system. In Prevention of Cold Injuries (pp. 6-1 – 6-8). Meeting Proceedings RTO-MP-HFM-126, Paper 6.Search in Google Scholar
[27] SENSORA INSTRUMENTS & CONSULTING, REG. No. 183 306 81, VAT No. CZ440128092 Na Výbezku 312, 460 15 LIBEREC, Czech Republic. http://www.sensora.eu/PermetestManual09.pdf.Search in Google Scholar
[28] Bogusławska-Bączek, M., Hes, L. (2013). Effective water vapour permeability of wet wool fabric and blended fabrics. Fibres and Textiles in Eastern Europe.Search in Google Scholar
[29] Hes L. (2008). Non-destructive determination of comfort parameters during marketing of functional garments and clothing. Indian Journal of Fibre and Textile Research, 33, 239–245.Search in Google Scholar
[30] Hes L. Catalogues of the ALAMBETA and PERMETEST instruments, SENSORA Co. (Czech Republic).Search in Google Scholar
[31] Havlová M. (2014). Model of vertical porosity occurring in woven fabrics and its effect on air permeability. Fibres and Textiles in Eastern Europe, 22, 58–63.Search in Google Scholar
[32] ASTM D737:96. Standard Test Method for Air Permeability of Textile Fabrics.Search in Google Scholar
[33] Bhattacharjee, D., Kothari, V. K. (2008). Prediction of thermal resistance of woven fabrics. Part II: heat transfer in natural and forced convective environments. Journal of the Textile Institute, 99(5), 433–449.10.1080/00405000701582596Search in Google Scholar
[34] Mao, N., Russell, S. J. (2007). The thermal insulation properties of spacer fabrics with a mechanically integrated wool fiber surface. Textile Research Journal, 77(12), 914–922.10.1177/0040517507083524Search in Google Scholar
[35] Gokarneshan, N. (2018). Some significant developments in bandage fabrics. Journal of Nursing and Patient Health Care, 1(1), 105.10.15744/2767-9292.1.104Search in Google Scholar
[36] Kumar, B., Das, A., Alagirusamy, R. (2014). Effect of material and structure of compression bandage on interface pressure variation over time. Phlebology, 29(6), 376–385.10.1177/0268355513481772Search in Google Scholar PubMed
[37] Ding, D., Tang, T., Song, G., McDonald, A. (2011). Characterizing the performance of a single-layer fabric system through a heat and mass transfer model-Part II: thermal and evaporative resistances. Textile Research Journal, 81(9), 945–958.10.1177/0040517510395994Search in Google Scholar
[38] Oğlakcioğlu, N., Marmarali, A. (2007). Thermal comfort properties of some knitted structures. Fibres and Textiles in Eastern Europe, 15(5–6), 64–65.Search in Google Scholar
© 2020 Abdelhamid R.R. Aboalasaad et al., published by Sciendo
This work is licensed under the Creative Commons Attribution 4.0 International License.
Articles in the same Issue
- Compressive Property of an Auxetic-Knitted Composite Tube Under Quasi-Static Loading
- Investigation of the Tribological Behaviors of Upholstery Woven Fabrics after Abrasion
- Microstructural Damage Characteristic of a Layer-to-Layer Three-Dimensional Angle-Interlock Woven Composite Under Quasi-Static Tensile Loading
- Initial Investigation Into Real 3D Body Scanning Versus Avatars for the Virtual Fitting of Garments
- Mathematical Model Predicting the Heat and Power Dissipated in an Electro-Conductive Contact in a Hybrid Woven Fabric
- A Method of 1D UVC Radiation Dose Measurement using a Novel Tablet Dosimeter
- Introducing a Newly Developed Fabric for Air Filtration
- A New Approach to Evaluate Fabric Hand Based on Three-Dimensional Drape Model
- Study on the use of Aerogel on the Surface of Basalt Fabric
- Analysis of Factors Affecting Thermal Comfort Properties of Woven Compression Bandages
- Country-Specific Determinants of Textile Industry Development in Poland: Comparative Analysis of the Years 2007 and 2017
- Comparative Study of Needle Penetration Forces in Sewing Hems on Toweling Terry Fabrics: Influence of Needle Type and Size
- Numerical and Experimental Comparative Analysis of Ballistic Performance of Packages Made of Biaxial and Triaxial Kevlar 29 Fabrics
- Characterization of Fabric-to-Fabric Friction: Application to Medical Compression Bandages