Atomistic insight into the ferroelastic post-stishovite transition by high-pressure single-crystal X-ray diffraction
-
Yanyao Zhang

 ,
Stella Chariton
,
Stella Chariton

Abstract
The post-stishovite transition is a classic pseudo-proper typed ferroelastic transition with a symmetry-breaking spontaneous strain. This transition has been studied using high-pressure spontaneous strains, optic modes, and elastic moduli (Cij) based on the Landau modeling, but its atomistic information and structural distortion remain poorly understood. Here we have conducted synchrotron single-crystal X-ray diffraction measurements on stishovite crystals up to 75.3 GPa in a diamond-anvil cell. Analysis of the data reveals atomic positions, bond lengths, bond angles, and variations of SiO6 octahedra across the transition at high pressure. Our results show that the O coordinates split at ~51.4 GPa, where the apical and equatorial Si-O bond lengths cross over, the SiO6 octahedral distortion vanishes, and the SiO6 octahedra start to rotate about the c axis. Moreover, distortion mode analysis shows that an in-plane stretching distortion (GM1+ mode) occurs in the stishovite structure at high pressure while a rotational distortion (GM2+ mode) becomes dominant in the post-stishovite structure. These results are used to correlate with elastic moduli and Landau parameters (symmetry-breaking strain e1–e2 and order parameter Q) to provide atomistic insight into the ferroelastic transition. When the bond lengths of two Si-O bonds are equal due to the contribution from the GM1+ stretching mode, C11 converges with C12, and the shear wave VS1[110] polarizing along [110] and propagating along [110] vanishes. Values of e1–e2 and Q are proportional to the SiO6 rotation angle from the occurrence of the GM1+ rotational mode in the post-stishovite structure. Our results on the pseudo-proper type transition are also compared with that for the proper type in albite and improper type in CaSiO3 perovskite. The symmetry-breaking strain, in all these types of transitions, arises as the primary effect from the structural angle (such as SiO6 rotation or lattice constant angle) and its relevant distortion mode in the low-symmetry ferroelastic phase.
Introduction
Ferroelastic phase transitions occur in silicate minerals in the Earth’s interior because of temperature and pressure perturbations. These transitions in crystals involve a change in point group with a symmetry-breaking strain (Aizu 1969, 1970). According to the Landau theory, there are different types of the ferroelastic transitions, including proper, pseudo-proper, and improper types, which have different transition mechanisms (Carpenter and Salje 1998; Wadhawan 1982). The proper-type transition is driven by the symmetry-breaking spontaneous strain, whereas the pseudo-proper- and improper-type transitions are driven by other physical properties that are linearly and non-linearly coupled to the symmetry-breaking strain, respectively (Carpenter et al. 1998; Wadhawan 1982). These types of the ferroelastic phase transitions are also well known to be associated with elastic and optic mode anomalies, including sound wave velocity softening, which could occur in some naturally abundant minerals under high pressure-temperature (P-T) conditions in the Earth’s crust and mantle (Carpenter 2006; Salje 1990, 1992). Knowing their transition mechanisms and elastic properties under relevant P-T conditions can help understand the geophysics and geodynamics of the Earth’s interior. For example, the proper-type ferroelastic transition in feldspar, comprising ~41 wt% of the continental crust (Rudnick et al. 2003), has been linked to seismic low-velocity anomaly in the crust (Brown et al. 2006; Liu et al. 2018; Waeselmann et al. 2016; Zhang and Klemperer 2005; Zhao et al. 2001). The stishovite and CaSiO3 perovskite (CaPv) are abundant phases in the subducted mid-ocean ridge basalt (MORB) in the lower mantle (Ishii et al. 2019). Their transition mechanisms and elastic anomalies have been used to explain seismic heterogeneities, infer the presence of the subducting slabs, and constrain mantle convection at depths (Helffrich 2006; Kaneshima 2016; Niu et al. 2003; Sun et al. 2022; Thomson et al. 2019; Wang et al. 2020). As a prototype of sixfold-coordinated silicates, the ferroelastic transition in stishovite is particularly important not only to aid our understanding of physical properties of subducting slabs in the mantle (Lakshtanov et al. 2007; Tsuchiya 2011; Yang and Wu 2014; Zhang et al. 2021) but also to shed light on similar phase transitions in other rock-forming silicate and oxide minerals at depths.
The ferroelastic transition across the stishovite to post-stishovite phases at 50–55 GPa has been relatively well investigated using multiple experimental data sets, including optical Raman modes, unit-cell parameters from powder X-ray diffraction, and elastic moduli (Cij) derived from sound velocities (Andrault et al. 2003; Buchen et al. 2018; Kingma et al. 1995; Lakshtanov et al. 2007; Zhang et al. 2021). These data are further complemented by Landau theory modeling (Carpenter et al. 2000; Hemley et al. 2000) and ab initio calculations (Karki et al. 1997a, 1997b; Yang and Wu 2014). Importantly, experimental optic modes and unit-cell parameters across the transition have been used in the pseudo-proper type Landau modeling to show that the transition is driven by the soft B1g mode and accompanied by a symmetry-breaking spontaneous strain and a significant shear softening (Andrault et al. 2003; Carpenter et al. 2000; Hemley et al. 2000; Kingma et al. 1995). A recent experimental study on Cij of stishovite across the post-stishovite transition has further shown that C11 converges with C12 at the transition pressure, where the shear wave VS1[110] polarizing along [110] and propagating along [110] vanishes (Zhang et al. 2021). These results reveal macroscopic physical phenomena that need to be integrated with microscopic atomic displacements to have a complete understanding of the transition and its physical properties. Along this line, crystal structural parameters, such as O positions, bond lengths, and bond angles, are key to microscopically quantifying elastic anomalies and some Landau parameters, such as the symmetry-breaking spontaneous strain. A previous powder X-ray diffraction (PXRD) study has refined crystal structures of stishovite and post-stishovite phases at high pressure using the Rietveld structural analysis method (Andrault et al. 1998). However, the refined structural parameters showed considerable scattering at high pressure due to difficulties in solving crystal structures from the powder diffraction data (Harris et al. 2001). On the other hand, high-resolution single-crystal X-ray diffraction (SCXRD) studies on the stishovite are limited to 30 GPa, far below the transition pressure (Hill et al. 1983; Ross et al. 1990; Sinclair and Ringwood 1978; Sugiyama et al. 1987; Yamanaka et al. 2002). This limitation was mainly due to the technical difficulty in conducting high-resolution SCXRD experiments at high pressure using a laboratory X-ray source. Recent advance in synchrotron X-ray diffraction technique now enables reliable crystal structure refinements to better understand the transition and elastic anomalies from the microscopic atomic perspective (Boffa Ballaran et al. 2013; Chariton et al. 2020; Clegg 2019; Dera 2010)
In this study, we performed synchrotron SCXRD experiments on stishovite crystals up to 75.3 GPa in a diamond-anvil cell (DAC) with large X-ray opening equipped with Boehler-Almax anvils and seats. The crystal structure of the stishovite or post-stishovite phase has been solved and refined at each experimental pressure. Refined structural parameters show that the O coordinates split at the transition pressure of ~51.4 GPa, where the bond lengths of apical and equatorial Si-O bonds are equal. This atomic information is further used to evaluate the deformation and rotation of the SiO6 octahedron across the transition. Two symmetry modes, GM1+ and GM2+, are analyzed to reveal crystal structure distortion at high pressure. Our results show that a rotational mode with GM2+ symmetry occurs at the transition pressure where the SiO6 octahedron starts to rotate about the c axis. Furthermore, we correlate the microscopic bond length difference of two Si-O bonds with the macroscopic elastic properties in the literature, such as C11, C12, and VS1[110] (Zhang et al. 2021). The symmetry-breaking spontaneous strain e1–e2 and order parameter Q in a pseudo-proper type Landau model are quantified using the SiO6 rotation angle Φ that comes from the GM2+ mode. Together with early studies on other types of the ferroelastic transitions (Kroll et al. 1980; Zhao et al. 1993a, 1993b), we, therefore, conclude that the symmetry-breaking strain changes linearly with a given structural angle in all types of ferroelastic transitions.
Experimental methods and data analysis
Stishovite single crystals were synthesized using a 1000 ton Kawai-type multi-anvil apparatus at the Institute for Planetary Materials, Okayama University (run no. 1K1642). The synthesis and characterization of the crystals have been reported elsewhere (Xu et al. 2017; Zhang et al. 2021). Briefly, reagent-grade silicic acid of 99.9% purity (SiO2 with 13 wt% H2O) was used as the starting sample, which was loaded into a platinum capsule. The sample assemblage was compressed to 12 GPa and then heated to 1873 K. The temperature of the assemblage was slowly cooled down to 1473 K with a rate of 100 K/h (4 h in total) before quenched to ambient temperature and then decompressed to ambient pressure. Stishovite crystals recovered from the sample capsule are transparent and free of twinning domains and inclusions under optical and petrographic microscopes (Zhang et al. 2021). Electron microprobe analyses of several selected crystals show a chemical formula of SiO2 without any other detectable elements. Analysis of unpolarized Fourier-transform infrared spectroscopic spectra shows ~19 ppm wt. water content in the selected crystals (Xu et al. 2017; Zhang et al. 2021). The amount of water in the Al-free stishovite crystals is consistent with previous studies (Litasov et al. 2007; Pawley et al. 1993).
Three stishovite crystals were loaded into a short-symmetric DAC with a pair of Boehler-Almax designed diamond anvils mounted onto WC seats with a large aperture of ~80° (4θ). This allowed us to obtain reflections at a wide two θ range (2θ, Online Materials[1] Fig. S1). The culet size of the diamond anvils is 200 μm in diameter. A rhenium gasket with an initial thickness of 260 μm was pre-indented to ~24 μm thick and subsequently a hole of 120 μm diameter was drilled in the center of the pre-indented area and used as the sample chamber. To obtain more reflections from stishovite, we selected three stishovite crystals with (2.4, 4.7, 1.7) (–0.8, 0.3, 1.6), and (0.8, 2.2, –0.9) orientations, respectively, which were determined by SCXRD measurements. The crystals were double-side polished down to ~7 μm thick using 3M diamond films. They were then cut into ~10–20 μm big platelets before being loaded into the sample chamber (Fig. 1). Au powder (Goodfellow; 99.95% purity) was pressed into 2 μm thick, cut into ~5 μm wide disks, and placed close to the center of the sample chamber as the pressure calibrant (Fei et al. 2007). The three stishovite platelets were loaded at an equal distance to the Au calibrant to minimize possible pressure gradient across the crystals in the chamber (Fig. 1c). Neon gas was loaded into the sample chamber as the pressure medium using a gas loading system at the Mineral Physics Laboratory of the University of Texas at Austin.
High-pressure SCXRD experiments were conducted up to 75.3 GPa at room temperature at 13ID-D beamline of the GSECARS, Advanced Photon Source, Argonne National Laboratory (Figs. 1a and 1b). An incident X-ray beam of 0.2952 Å wavelength (42 keV energy) was focused down to a beam size of ~3 × 3 μm2 at the sample position. Approximately 10% intensity of the incident X-ray was used for the measurements to avoid peak saturations. The sample stage was rotated over ±31° about the vertical axis of the DAC during data collections. The XRD patterns were collected using a CdTe Pilatus 1 M detector with 1 or 2 s exposure time at every 0.5° step of the rotation. A membrane was used to increase and control pressure in the sample chamber. After each pressure increase, we monitored the pressure of the sample chamber until it was stabilized before SCXRD measurements were conducted. Pressure uncertainties were evaluated from analysis of XRD spectra of Au collected right before and after each set of SCXRD measurements (Fei et al. 2007). Additionally, SCXRD measurements at ambient conditions were conducted in the Department of Chemistry at the University of Texas at Austin. A stishovite crystal with dimensions of ~0.94 × 0.44 × 0.17 mm was selected for the experiment. A SuperNova dual source diffractometer equipped with a MoKα radiation source (λ = 0.71073 Å) and collimating mirror monochromators were used to collect XRD data. 2103 frames of data were collected using Omega scan with a scan range of 1° and a counting time of 1 s per frame.
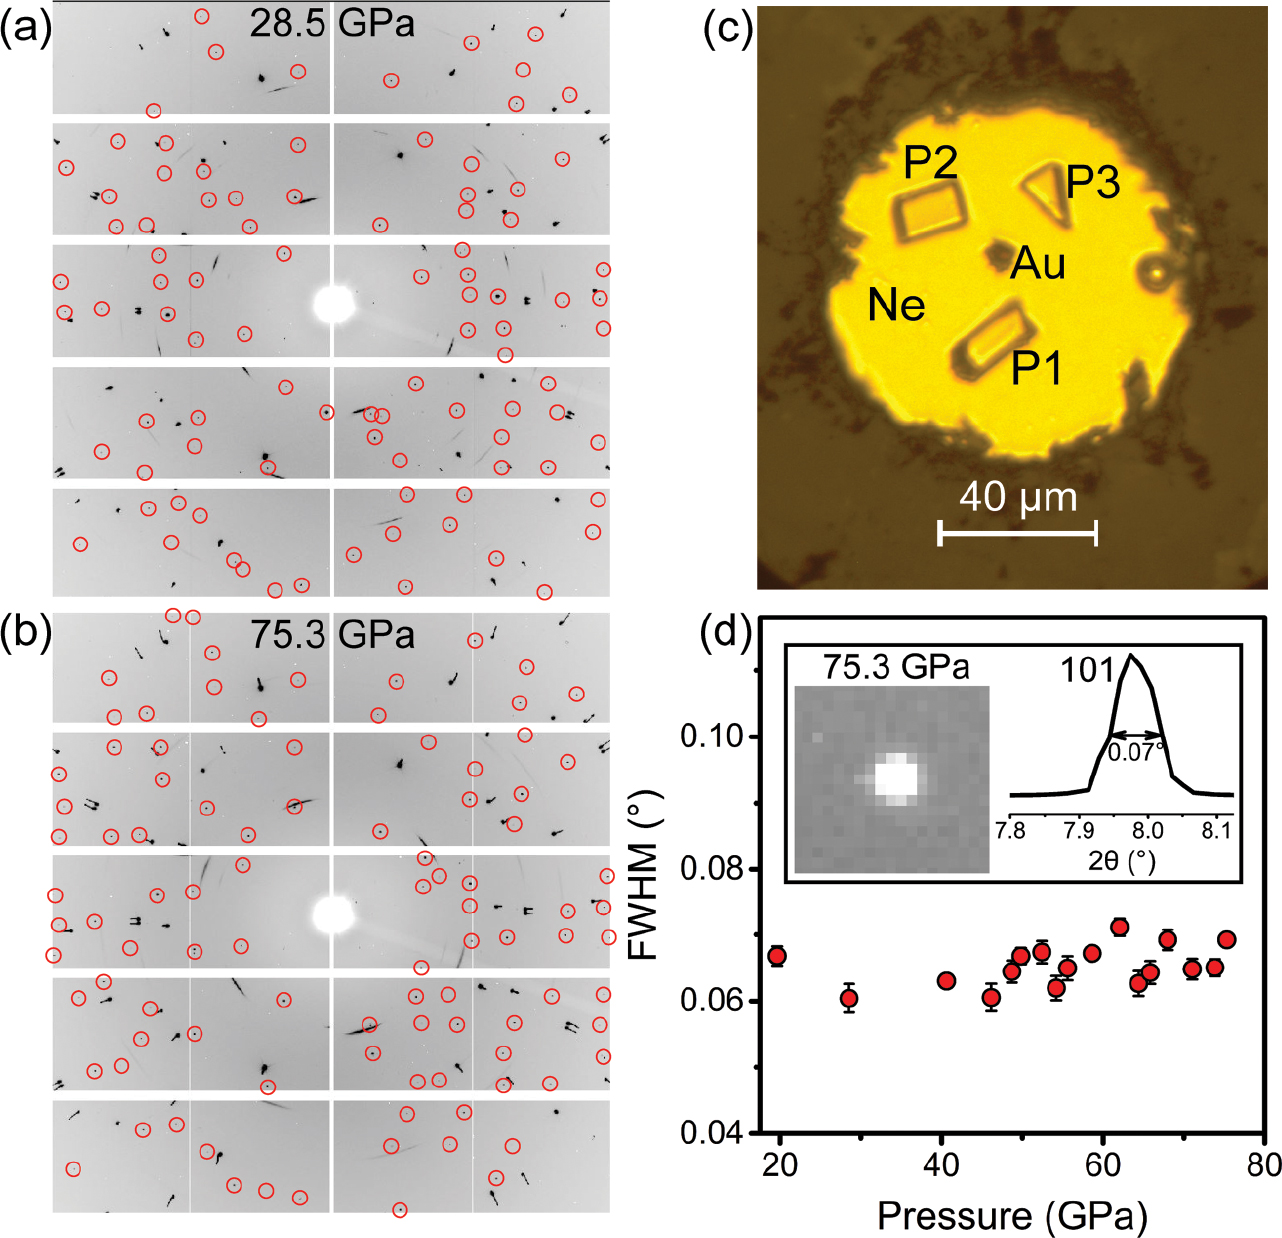
Representative single-crystal X‑ray diffraction data of stishovite and post-stishovite at high pressure. (a and b) These show original diffraction images at 28.5 GPa for stishovite and at 75.3 GPa for post-stishovite, respectively. Sample reflection spots are marked with red open circles. (c) An optical image of the sample chamber showing three crystals (P1, P2, and P3) and gold pressure calibrant (Au) in neon pressure medium (Ne) at 2.8 GPa. (d) Full-width at half maximum (FWHM) of a selected 101 diffraction peak as a function of pressure. FWHM of the peak (red solid circles) remains almost unchanged during compression. The insert panel shows a round 101 reflection spot and its integrated peak with FWHM of 0.07° at 75.3 GPa. These data indicate that the single-crystal quality was preserved in compression up to 75.3 GPa.
The measured SCXRD data were used to solve the crystal structure and refine the atomic positions of the stishovite or post-stishovite phase at high pressure following a previous SCXRD processing method (Bykova 2015). At a given pressure, we initially used CrysAlisPRO software to find the unit cell, determine lattice parameters, extract intensity for each hkl reflection, and perform absorption corrections for each crystal (Rigaku 2015). The reflection data sets from the three stishovite crystals were combined for further analysis. JANA software was then used to determine the space group, solve the structure using a charge-flipping algorithm, and refine atomic coordinates and isotropic/ anisotropic displacement parameters of the crystal (Petříček et al. 2014). On the other hand, the stishovite structure at ambient conditions was solved by direct methods and then refined together with anisotropic displacement parameters of Si and O atoms using SHELXL software (Sheldrick 2015). Structural analysis of the Si and O atomic positions, bond lengths, and bond angles was evaluated using the programs PLATON (Spek 2009) and OLEX2 at ambient conditions (Dolomanov et al. 2009). The quality of the refinements at each pressure was evaluated by residual R-factors such as Rint and R1 (Bykova 2015). The refined parameters of the crystal structure were viewed and graphed using VESTA software (Momma and Izumi 2011).
The refined structural parameters were further used to perform distortion mode analysis across the post-stishovite transition using AMPLIMODES program (Orobengoa et al. 2009). The program is used to evaluate symmetry-adapted structural distortion between high- and low-symmetry phases across a displacive phase transition. Our input high-symmetry structural data are refined lattice parameters and atomic positions of stishovite at ambient conditions, while input low-symmetry data are those of stishovite and post-stishovite phases at high pressure. The AMPLIMODES program is used to calculate the maximum atomic displacement and global structural distortion in the distorted low-symmetry structure relative to the reference high-symmetry structure (Perez-Mato et al. 2010). The program then decomposes the global distortion into different symmetry-adapted distortion modes. The amplitude of the individual mode can reflect its contribution to the global structural distortion (Gawryluk et al. 2019).
Results
Crystallographic analysis
Analysis of the collected SCXRD images shows that reflection spots of the three crystals display a round shape with a full-width at half maximum (FWHM) of <0.1°. The FWHM is almost invariant up to 75.3 GPa, indicating that the single-crystal quality of stishovite was preserved in compression in a neon medium (Yamanaka et al. 2002) (Figs. 1c and 1d). We observed 66 to 239 total reflections from the crystals at high pressure (Figs. 1a and 1b). These reflections were then grouped into 31 to 55 unique reflections, which were used to determine lattice parameters at high pressure (Table 1). Furthermore, 24 to 63 reflections of I > 3σ(I), where I is the intensity and σ is the standard deviation, were used to determine the space group and to refine the atomic positions of the crystal at high pressure. Our analyses show that the crystal is in the tetragonal stishovite structure with P42/mnm (No. 136) space group at pressures up to 49.8 GPa (Online Materials1 Figs. S2 and S3; Online Materials1 Table S1; Table 1). From 52.4 to 75.3 GPa, the crystal is stable in an orthorhombic structure with Pnnm (No. 58) space group, called the CaCl2-type post-stishovite phase (Online Materials1 Figs. S2 and S3; Online Materials1 Table S1; Table 1). These results indicate that the post-stishovite phase transition occurs between 49.8 and 52.4 GPa, consistent with previous studies (Andrault et al. 1998; Hemley et al. 2000; Kingma et al. 1995; Zhang et al. 2021). Values of Rint and R1 are 0.4–14.9% and 1.3–7.8%, respectively, indicating the refined crystal structures are of good quality (Table 1).
Structure refinement results for stishovite and post-stishovite at high pressure
| P (GPa) | Space group | a (Å) | b (Å) | c (Å) | V (Å3) | Unique refl.a | Rint (%) | R1 (%) |
|---|---|---|---|---|---|---|---|---|
| 0 | P42/mnm | 4.1752(1) | 2.6642(1) | 46.443(3) | 2788 | 4.63 | 1.29 | |
| 2.8(1) | P42/mnm | 4.1660(3) | 2.6640(3) | 46.24(1) | 55 | 0.61 | 3.48 | |
| 7.8(1) | P42/mnm | 4.1416(5) | 2.6564(3) | 45.57(1) | 48 | 1.52 | 5.93 | |
| 13.0(2) | P42/mnm | 4.1200(4) | 2.6458(3) | 44.91(1) | 37 | 0.78 | 6.28 | |
| 16.0(1) | P42/mnm | 4.1066(4) | 2.6433(4) | 44.58(1) | 50 | 5.89 | 6.14 | |
| 16.9(3) | P42/mnm | 4.1045(4) | 2.6393(3) | 44.464(8) | 48 | 0.35 | 6.11 | |
| 19.7(1) | P42/mnm | 4.0891(4) | 2.6298(17) | 43.97(3) | 50 | 1.65 | 3.78 | |
| 21.4(1) | P42/mnm | 4.0875(4) | 2.6366(3) | 44.05(1) | 41 | 12.74 | 6.00 | |
| 26.8(2) | P42/mnm | 4.0681(5) | 2.6259(5) | 43.46(1) | 43 | 4.37 | 7.84 | |
| 28.5(2) | P42/mnm | 4.0520(4) | 2.6162(18) | 42.95(3) | 52 | 1.70 | 7.73 | |
| 33.8(2) | P42/mnm | 4.0318(6) | 2.6070(8) | 42.38(2) | 48 | 5.80 | 6.17 | |
| 40.4(2) | P42/mnm | 4.0133(7) | 2.6000(30) | 41.88(5) | 34 | 8.91 | 5.61 | |
| 48.7(2) | P42/mnm | 3.9875(7) | 2.5840(30) | 41.09(5) | 46 | 1.06 | 5.65 | |
| 49.8(2) | P42/mnm | 3.9819(10) | 2.5810(60) | 40.92(10) | 36 | 1.01 | 5.35 | |
| 52.4(2) | Pnnm | 3.9440(30) | 4.0150(19) | 2.5851(13) | 40.93(4) | 47 | 1.25 | 5.66 |
| 54.2(2) | Pnnm | 3.9320(30) | 4.0128(18) | 2.5817(12) | 40.73(4) | 56 | 0.87 | 5.38 |
| 55.6(2) | Pnnm | 3.9300(40) | 4.0097(10) | 2.5750(5) | 40.58(4) | 54 | 4.82 | 6.22 |
| 58.6(3) | Pnnm | 3.9140(50) | 4.0118(12) | 2.5717(6) | 40.38(5) | 31 | 14.89 | 4.97 |
| 62.0(3) | Pnnm | 3.9010(40) | 4.0089(12) | 2.5656(8) | 40.12(4) | 41 | 2.94 | 6.88 |
| 64.4(3) | Pnnm | 3.8880(40) | 4.0080(20) | 2.5681(14) | 40.01(5) | 46 | 4.80 | 6.66 |
| 65.8(3) | Pnnm | 3.8820(40) | 4.0070(10) | 2.5667(8) | 39.93(4) | 41 | 12.90 | 6.62 |
| 68.0(3) | Pnnm | 3.8710(40) | 4.0051(10) | 2.5616(7) | 39.71(4) | 41 | 1.40 | 6.85 |
| 71.0(3) | Pnnm | 3.8580(30) | 4.0040(9) | 2.5580(7) | 39.51(3) | 46 | 1.91 | 4.57 |
| 73.8(3) | Pnnm | 3.8500(30) | 4.0016(8) | 2.5557(6) | 39.37(3) | 45 | 2.60 | 6.05 |
| 75.3(3) | Pnnm | 3.8380(20) | 3.9974(7) | 2.5498(5) | 39.12(2) | 46 | 0.55 | 4.42 |
a Unique refl: number of unique observed reflections.
Atomic coordinates, bond lengths, and bond angles can be derived from the refined crystal structures (Figs. 2 and 3; Table 2). Using Si atom positions in the stishovite structure as the reference, the x (or y) coordinate of oxygen relative to the Si positions changes slightly from 0.306 at ambient conditions to 0.303 at 49.8 GPa (Figs. 2a and 3a). Crossing into the post-stishovite phase, the x coordinate of oxygen drastically decreases from 0.303 at 52.4 GPa to 0.279 at 75.3 GPa, whereas the y coordinate drastically increases from 0.303 to 0.323 (Fig. 3a). This splitting of O coordinates corresponds to a splitting of a- and b-axis in the post-stishovite phase (Online Materials1 Fig. S2a). On the other hand, the Si-O bond lengths decrease continuously with increasing pressure up to 75.3 GPa (Figs. 2 and 3b). The apical Si-O3 bond length is initially much longer than the equatorial Si-O1(2) bond length at ambient conditions, but it decreases with increasing pressure much faster than the equatorial Si-O1(2) bond length. This anisotropic linear incompressibility behavior leads to an equal bond length of 1.703 Å for the two Si-O bonds at ~51.4 GPa where the post-stishovite transition occurs (Fig. 3b). In the post-stishovite structure, the apical Si-O3 bond becomes shorter than the equatorial Si-O1(2) bond (Figs. 2b and 3b). Additionally, the bond angles between Si and O atoms in the stishovite structure are almost unaffected by increasing pressure up to ~51 GPa: ∠O1(2)-Si-O3 = 90°, ∠O1-Si-O2 = ~81.3°, and ∠O1(2)-Si-O1(2) = ~98.7° (Fig. 3c). Crossing into the post-stishovite phase, the bond angles are slightly changed: ∠O1-Si-O2 increases by 0.5°, ∠O1(2)-Si-O1(2) decreases by 0.5°, and ∠O1-Si-O3 or ∠O2-Si-O3 remains almost unchanged within uncertainties (~0.1°) up to 75.3 GPa. Accordingly, the O1-O2 interatomic distance remains unchanged under compression, whereas the O1(2)-O1(2), O1-O3, and O2-O3 distances decrease with increasing pressure, and the difference between O1-O3 and O2-O3 distance is negligible (Online Materials1 Fig. S4).
O positions, bond lengths, and bond angles of stishovite and post-stishovite at high pressure
| P (GPa) | O position | Bond | length (Å) | Bond | angle (°) | |||
|---|---|---|---|---|---|---|---|---|
| x | y | Si-O3 | Si-O1(2) | ∠O1-Si-O3 | ∠O2-Si-O3 | ∠O1(2)-Si-O1(2) | ∠O1-Si-O2 | |
| 0 | 0.3061(1) | 0.3061(1) | 1.8075(6) | 1.7565(4) | 90.00(5) | 90.00(5) | 98.65(5) | 81.35(5) |
| 2.8(1) | 0.3060(3) | 0.3060(3) | 1.803(1) | 1.755(1) | 90.00(7) | 90.00(7) | 98.74(7) | 81.26(7) |
| 7.8(1) | 0.3052(5) | 0.3052(5) | 1.788(3) | 1.751(1) | 90.00(9) | 90.00(9) | 98.67(8) | 81.33(8) |
| 13.0(2) | 0.3046(5) | 0.3046(5) | 1.775(3) | 1.745(1) | 90.00(9) | 90.00(9) | 98.57(8) | 81.43(8) |
| 16.0(1) | 0.3046(5) | 0.3046(5) | 1.769(3) | 1.742(1) | 90.00(9) | 90.00(9) | 98.70(8) | 81.30(8) |
| 16.9(3) | 0.3046(3) | 0.3046(3) | 1.7681(13) | 1.7401(9) | 90.00(9) | 90.00(9) | 98.64(8) | 81.36(8) |
| 19.7(1) | 0.3039(5) | 0.3039(5) | 1.757(3) | 1.736(2) | 90.00(9) | 90.00(9) | 98.45(8) | 81.55(8) |
| 21.4(1) | 0.3044(6) | 0.3044(6) | 1.760(3) | 1.737(2) | 90.00(10) | 90.00(10) | 98.76(9) | 81.24(9) |
| 26.8(2) | 0.3048(6) | 0.3048(6) | 1.754(3) | 1.728(2) | 90.00(10) | 90.00(10) | 98.92(9) | 81.08(9) |
| 28.5(2) | 0.3038(6) | 0.3038(6) | 1.741(3) | 1.725(2) | 90.00(10) | 90.00(10) | 98.64(9) | 81.36(9) |
| 33.8(2) | 0.3036(4) | 0.3036(4) | 1.731(2) | 1.719(1) | 90.00(8) | 90.00(8) | 98.67(8) | 81.33(8) |
| 40.4(2) | 0.3036(4) | 0.3036(4) | 1.7231(17) | 1.7125(16) | 90.00(10) | 90.00(10) | 98.78(9) | 81.22(9) |
| 48.7(2) | 0.3028(5) | 0.3028(5) | 1.708(3) | 1.705(2) | 90.00(9) | 90.00(9) | 98.56(8) | 81.44(8) |
| 49.8(2) | 0.3023(4) | 0.3023(4) | 1.702(2) | 1.704(3) | 90.00(8) | 90.00(8) | 98.43(8) | 81.57(8) |
| 52.4(2) | 0.2943(12) | 0.3106(5) | 1.704(4) | 1.705(3) | 89.87(15) | 90.13(15) | 98.59(14) | 81.41(14) |
| 54.2(2) | 0.2912(12) | 0.3121(5) | 1.697(4) | 1.706(3) | 89.92(15) | 90.08(15) | 98.38(14) | 81.62(14) |
| 55.6(2) | 0.2927(7) | 0.3127(6) | 1.702(3) | 1.6986(18) | 89.91(12) | 90.09(12) | 98.57(11) | 81.43(11) |
| 58.6(3) | 0.2877(12) | 0.3152(6) | 1.693(4) | 1.701(3) | 89.96(14) | 90.04(14) | 98.21(13) | 81.79(13) |
| 62.0(3) | 0.2854(16) | 0.3167(8) | 1.689(5) | 1.699(4) | 89.98(16) | 90.02(16) | 98.06(15) | 81.94(15) |
| 64.4(3) | 0.2850(14) | 0.3175(7) | 1.687(5) | 1.698(4) | 89.91(16) | 90.09(16) | 98.28(15) | 81.72(15) |
| 65.8(3) | 0.2841(14) | 0.3188(7) | 1.688(5) | 1.696(3) | 89.94(15) | 90.06(15) | 98.34(15) | 81.66(15) |
| 68.0(3) | 0.2814(12) | 0.3200(6) | 1.682(4) | 1.696(3) | 89.96(14) | 90.04(14) | 98.09(14) | 81.91(14) |
| 71.0(3) | 0.2807(9) | 0.3211(5) | 1.681(3) | 1.693(2) | 89.90(12) | 90.10(12) | 98.17(12) | 81.83(12) |
| 73.8(3) | 0.2794(12) | 0.3216(6) | 1.677(4) | 1.692(3) | 89.90(14) | 90.10(14) | 98.07(14) | 81.93(14) |
| 75.3(3) | 0.2788(8) | 0.3231(4) | 1.677(3) | 1.687(2) | 89.90(11) | 90.10(11) | 98.17(11) | 81.83(11) |
Note: Please refer to Figure 2 for the meaning of the atom symbols.
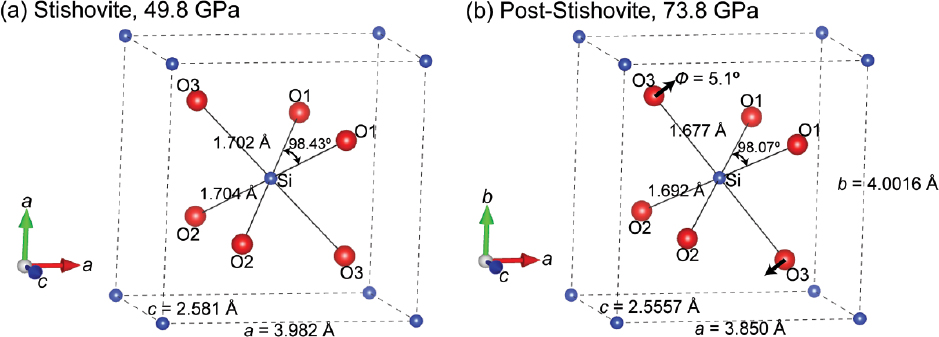
Representative refined crystal structures of stishovite and post-stishovite at high pressure. (a) Stishovite at 49.8 GPa; (b) post-stishovite at 73.8 GPa. Si and O (O1, O2, and O3) atoms are shown as blue and red balls, respectively. Lattice parameters, Si-O bond lengths, and O1-Si-O1 bond angles are labeled in the representative structures, and can also be found in Tables 1 and 2. Black arrows in b show Φ rotation angle of 5.1°, which is the SiO6 octahedron rotation about the c axis with respect to the ideal stishovite structure in a.
The aforementioned structural parameters are used to further analyze the volume, deformation, and rotation of the SiO6 octahedron across the post-stishovite transition (Figs. 2 and 4; Table 3). These analyses show that the SiO6 volume decreases continuously with increasing pressure up to 75.3 GPa, resulting in a continuous decrease of the unit-cell volume (Online Materials1 Figs. S2b and S5). The deformation of SiO6 octahedron can be quantitatively determined by the distortion index and the bond angle variance based on the refined bond lengths and bond angles, respectively. The distortion index is defined as:
Volume (Voct), bond length distortion (D), angle variance (σ2), and rotation angle about c axis (Φ) of the SiO6 octahedron in the stishovite and post-stishovite phases at high pressure
| P (GPa) | Voct (Å3) | D | σ2 (deg2) | Φ (°) |
|---|---|---|---|---|
| 0 | 7.351(2) | 0.01278(3) | 27.186(7) | 0 |
| 2.8(1) | 7.319(4) | 0.01196(7) | 27.75(2) | 0 |
| 7.8(1) | 7.224(8) | 0.00923(10) | 27.35(3) | 0 |
| 13.0(2) | 7.128(8) | 0.00745(8) | 26.70(3) | 0 |
| 16.0(1) | 7.075(8) | 0.00685(8) | 27.52(3) | 0 |
| 16.9(3) | 7.057(9) | 0.00711(11) | 27.16(3) | 0 |
| 19.7(1) | 6.988(8) | 0.00537(6) | 25.96(3) | 0 |
| 21.4(1) | 6.994(9) | 0.00582(7) | 27.92(3) | 0 |
| 26.8(2) | 6.895(8) | 0.00662(8) | 28.91(3) | 0 |
| 28.5(2) | 6.828(9) | 0.00412(5) | 27.16(3) | 0 |
| 33.8(2) | 6.738(5) | 0.00325(3) | 27.32(2) | 0 |
| 40.4(2) | 6.659(5) | 0.00276(2) | 28.01(2) | 0 |
| 48.7(2) | 6.542(8) | 0.00075(1) | 26.66(3) | 0 |
| 49.8(2) | 6.522(10) | 0.00053(1) | 25.85(4) | 0 |
| 52.4(2) | 6.530(13) | 0.00036(4) | 26.85(5) | 2.1(2) |
| 54.2(2) | 6.511(13) | 0.00225(1) | 25.52(5) | 2.6(2) |
| 55.6(2) | 6.473(8) | 0.00076(1) | 26.71(3) | 2.5(1) |
| 58.6(3) | 6.466(13) | 0.00204(4) | 24.52(5) | 3.3(2) |
| 62.0(3) | 6.435(16) | 0.00270(7) | 23.63(6) | 3.8(2) |
| 64.4(3) | 6.418(18) | 0.00274(11) | 24.92(7) | 4.0(2) |
| 65.8(3) | 6.405(14) | 0.00221(5) | 25.31(5) | 4.2(2) |
| 68.0(3) | 6.386(13) | 0.00366(7) | 23.79(5) | 4.6(2) |
| 71.0(3) | 6.356(9) | 0.00304(4) | 24.26(3) | 4.9(1) |
| 73.8(3) | 6.341(13) | 0.00396(8) | 23.68(5) | 5.1(2) |
| 75.3(3) | 6.300(8) | 0.00259(3) | 24.29(3) | 5.4(1) |
where li is the Si-O bond length and lavg is the average Si-O bond length (Renner and Lehmann 1986). The bond angle variance is defined as:
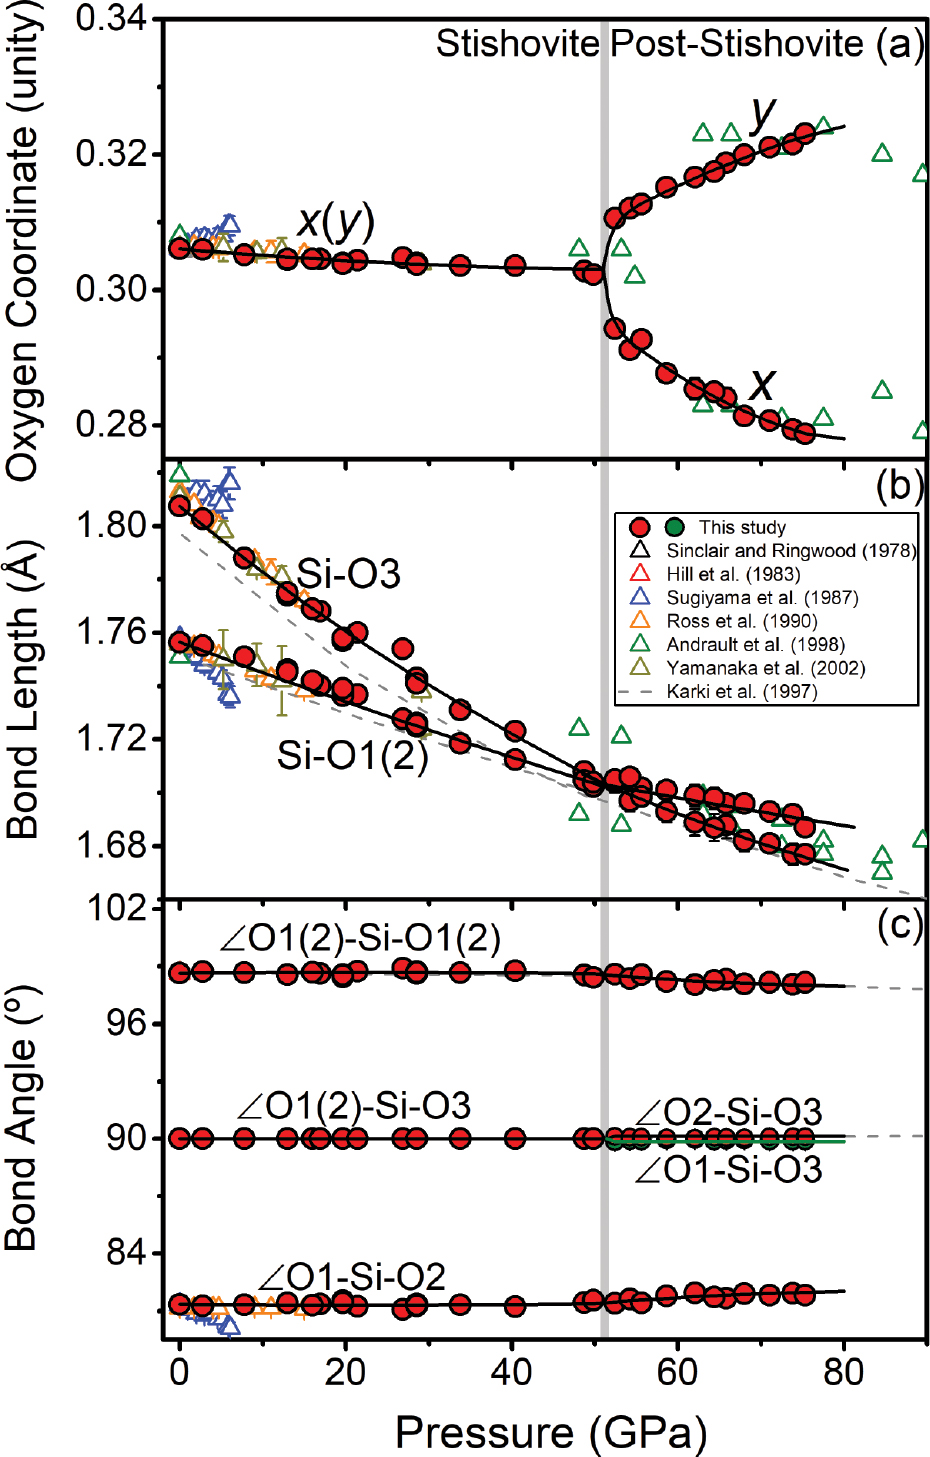
O coordinates, Si-O bond lengths, and O-Si-O bond angles across the post-stishovite transition at high pressure. (a) O coordinates as a function of pressure. The x and y coordinates for oxygen are almost invariant in stishovite; however, x coordinate decreases and y coordinate increases with increasing pressure in the post-stishovite phase. (b) Si-O bond lengths as a function of pressure. The bond length in the apical Si-O3 and in the equatorial Si-O1(2) becomes equivalent to each other within uncertainties at the post-stishovite transition. (c) O-Si-O bond angles as a function of pressure. The angles remain almost constant in the stishovite phase, while ∠O1-Si-O2 increases and ∠O1(2)-Si-O1(2) decreases with increasing pressure in the post-stishovite phase. Please refer to Figure 2 for the meaning of the O atom numbering. Solid lines in b show the best fits using an axial incompressibility equation of state (Birch 1947), while those in a and c are the best polynomial fits to guide the eyes. Note that the data and fit for ∠O1-Si-O3 are drawn in green to distinguish it from ∠O2-Si-O3. The gray vertical band shows the phase transition region at ~51.4 GPa based on the splitting of the O coordinates. Literature single-crystal and powder XRD and ab initio data are plotted for comparison (Andrault et al. 1998; Hill et al. 1983; Karki et al. 1997b; Ross et al. 1990; Sinclair and Ringwood 1978; Sugiyama et al. 1987; Yamanaka et al. 2002).
where αi is the O-Si-O bond angle (Robinson et al. 1971). In the stishovite phase, the distortion index decreases from 1.3% at ambient pressure to zero at ~51.4 GPa, whereas the bond angle variance remains invariant at ~27 deg2 with increasing pressure up to ~51.4 GPa (Figs. 4a and 4b). Crossing into the post-stishovite phase, the distortion index increases to ~0.3%, whereas the bond angle variance decreases to ~24 deg2 at ~75 GPa (Figs. 4a and 4b). On the other hand, the rotation of the SiO6 octahedron about the c axis can be evaluated with respect to the stishovite structure using a formula, Φ(°) = 45°–arctan (axo/byo), where yo and xo are the y- and x-coordinate of O atoms, respectively (Bärnighausen et al. 1984; Range et al. 1987) (Fig. 4c). These analyses show that the SiO6 octahedron does not rotate in the stishovite phase but starts to rotate about the c axis, crossing into the post-stishovite phase. At 75.3 GPa, the SiO6 octahedral rotation is about 5.4°.
Our structural refinement results for stishovite are, for the first order, consistent with previous SCXRD studies up to 30 GPa (Hill et al. 1983; Ross et al. 1990; Sinclair and Ringwood 1978; Sugiyama et al. 1987; Yamanaka et al. 2002) (Figs. 3 and 4). Additionally, our results across the post-stishovite transition are generally consistent with a PXRD study using the Rietveld structural analysis (Andrault et al. 1998), except for the octahedral volume (Online Materials1 Fig. S5). We note that our SCXRD data have much higher resolutions and are denser in the vicinity of the transition pressure such that detailed structural evolutions are clearly revealed across the post-stishovite transition. On the other hand, comparisons between ab initio calculations and experimental results show very large discrepancies in the structural parameters, especially for the post-stishovite phase (Figs. 3 and 4). For example, theoretical calculations show equal equatorial and apical Si-O bond lengths in the post-stishovite structure at high pressure (Karki et al. 1997b), which is contrary to our results. This could be due to difficulties in properly optimizing spontaneous strains in the post-stishovite phase to account for exchange-correlation interactions in the local-density approximation (LDA). This in turn can affect accuracy in theoretically-predicted elastic moduli across the ferroelastic post-stishovite transition, which are quite different from experimentally derived elastic moduli (Karki et al. 1997a; Yang and Wu 2014; Zhang et al. 2021). Our study here not only provides reliable structural models of the stishovite and post-stishovite phases but also serves as benchmarks for future ab initio calculations.
Distortion mode analysis
As shown in the previous section, the stishovite phase has the space group of P42/mnm while the post-stishovite phase has the space group of Pnnm, revealing a group-subgroup relationship between these two space groups across the transition. In other words, the low-symmetry post-stishovite structure can be considered as the high-symmetry stishovite structure undergoing a symmetry-adapted lattice distortion. Therefore, analysis of the symmetry mode is another useful way to describe crystal structures in terms of the displacement of a set of atoms that are related by a given symmetry, as compared to standard crystallographic descriptions in terms of individual bond length and bond angle. Particularly, amplitude of symmetry modes represents the magnitude of lattice distortions with different symmetry representations. This information can thus help better understand symmetry-adapted structure distortions across the ferroelastic post-stishovite transition.
Using the refined structural data from our study, we have calculated maximum atomic displacements and distortion mode amplitudes in a distorted crystal structure at a given pressure with respect to the reference structure at ambient conditions (Fig. 5; Table 4). The displacement of Si atoms remains zero at high pressure because they remain stationary at (0, 0, 0) coordinate in the lattice. The displacement of O atoms increases linearly from zero at ambient conditions to 0.022 Å at ~51.4 GPa. The O atoms then start to move significantly upon further compression with the maximum atomic displacement of 0.1343 Å at 75.3 GPa (Fig. 5a). This atomic displacement results in an occurrence of two symmetry-related distortion modes: GM1+ and GM+2 (Fig. 5b). GM1+ is an in-plane stretching mode acting on the O atoms (Fig. 5c). Its amplitude increases linearly with pressure across the post-stishovite transition up to 0.0609 Å at 75.3 GPa. The GM2+ mode, which is related to O rotations about c axis (Fig. 5d), emerges at ~51.4 GPa. Its amplitude increases significantly with pressure and is much larger than that of GM1+ (e.g., 0.2616 Å at 75.3 GPa). These results, therefore, reveal that the stishovite phase undergoes an in-plane stretching distortion at high pressure while a rotational distortion becomes dominant in the post-stishovite structure.
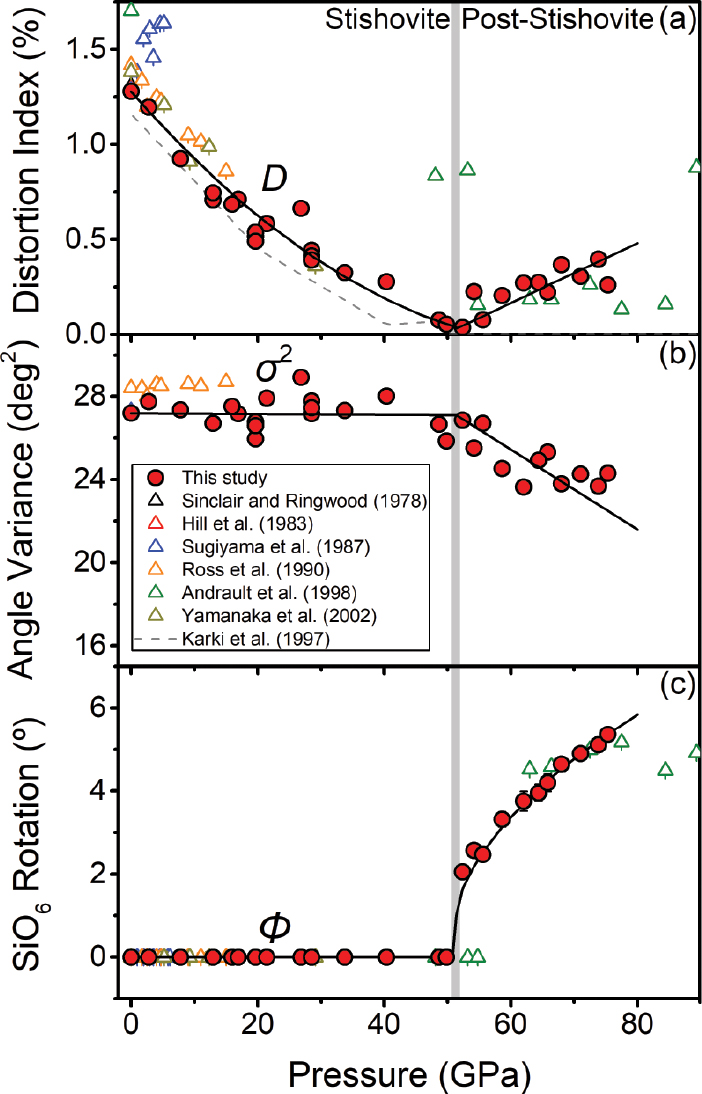
Refined SiO6 octahedron parameters of stishovite and post-stishovite at high pressure. (a) Bond length distortion (D) of the octahedron as a function of pressure. The distortion vanishes at the transition. (b) Angle variance (σ2) of the octahedron as a function of pressure. It remains constant in stishovite but decreases with increasing pressure in the post-stishovite phase. (c) The rotation of the SiO6 octahedron about the c axis (Φ) with pressure only occurs in the post-stishovite phase (also see Fig. 2 for the rotation). Lines show the best polynomial fits to the data. The gray vertical band represents the transition pressure. Previous studies are also shown for comparison (Andrault et al. 1998; Hill et al. 1983; Karki et al. 1997b; Ross et al. 1990; Sinclair and Ringwood 1978; Sugiyama et al. 1987; Yamanaka et al. 2002).
Maximum atomic displacement (Δ) and distortion mode amplitude at high pressure
| P (GPa) | Δ (Å) | GM1+ (Å) | GM2+ (Å) |
|---|---|---|---|
| 0 | 0.0000 | 0.0000 | – |
| 2.8(1) | 0.0006(0) | 0.0013(0) | – |
| 7.8(1) | 0.0054(1) | 0.0107(2) | – |
| 13.0(2) | 0.0089(1) | 0.0178(3) | – |
| 16.0(1) | 0.0089(1) | 0.0178(3) | – |
| 16.9(3) | 0.0089(1) | 0.0178(2) | – |
| 19.7(1) | 0.0125(1) | 0.0249(2) | – |
| 21.4(1) | 0.0101(2) | 0.0202(4) | – |
| 26.8(2) | 0.0077(2) | 0.0155(3) | – |
| 28.5(2) | 0.0125(2) | 0.0249(4) | – |
| 33.8(2) | 0.0148(2) | 0.0296(4) | – |
| 40.4(2) | 0.0148(2) | 0.0296(4) | – |
| 48.7(2) | 0.0195(3) | 0.0391(6) | – |
| 49.8(2) | 0.0225(5) | 0.0450(11) | – |
| 52.4(2) | 0.0528(18) | 0.0432(14) | 0.0962(32) |
| 54.2(2) | 0.0671(20) | 0.0527(16) | 0.1234(37) |
| 55.6(2) | 0.0624(15) | 0.0403(10) | 0.1181(28) |
| 58.6(3) | 0.0857(36) | 0.0550(23) | 0.1624(68) |
| 62.0(3) | 0.0971(54) | 0.0598(34) | 0.1848(104) |
| 64.4(3) | 0.1001(56) | 0.0574(32) | 0.1919(108) |
| 65.8(3) | 0.1061(52) | 0.0550(27) | 0.2049(101) |
| 68.0(3) | 0.1184(50) | 0.0639(27) | 0.2279(97) |
| 71.0(3) | 0.1232(40) | 0.0615(20) | 0.2385(76) |
| 73.8(3) | 0.1289(55) | 0.0663(28) | 0.2492(107) |
| 75.3(3) | 0.1343(39) | 0.0609(17) | 0.2616(75) |
Note: Distortion mode of GM1+ occurs in stishovite below ~50 GPa, while both GM1+ and GM2+ modes are present in post-stishovite above ~52 GPa.
Discussion
Our single-crystal X-ray diffraction refinements on the refined Si and O coordinates, Si-O bond lengths, and O-Si-O bond angles across the post-stishovite transition can be used to correlate with previous elasticity and Landau modeling studies to shed new light on the pseudo-proper type ferroelastic transition (Carpenter et al. 2000; Hemley et al. 2000; Zhang et al. 2021). First, we co-plot Si-O bond length difference and elastic properties at given experimental pressures (Fig. 6). The elastic moduli of stishovite and post-stishovite are taken from a recent study that derived the moduli from measured sound velocities using combined Brillouin and impulsive stimulated light scattering techniques at high pressure (Zhang et al. 2021). The elastic modulus C11 increases with decreasing Si-O bond length difference but flattens when the difference is below 0.01 Å, while C12 increases significantly across the transition (Fig. 6a). As a result, the elastic modulus (C11–C12)/2, which reflects the strain response to the shear stress along the [110] direction in the stishovite structure (Bell and Rupprecht 1963), becomes zero when the apical and equatorial Si-O bond lengths become equal due to the stretching displacement of O atoms in the GM1+ mode (Figs. 5b and 5c). Accordingly, C11–C12, one of the Born criteria of the tetragonal stishovite phase, becomes zero at the phase transition (Zhang et al. 2021). Crossing into the post-stishovite phase, C11 splits into C11 and C22 as the O coordinates split (Figs. 3a and 6a). As the equatorial Si-O1(2) bond length becomes longer than the apical Si-O3 bond length with increasing amplitude of the GM1+ stretching mode, the elastic moduli C11, C22, and C12 of the post-stishovite phase increase (Figs. 3b, 5b, and 6a). The corresponding Born criterion, C11C22–C212, becomes positive in the post-stishovite phase, indicating its stability after the crossover of the equatorial and apical Si-O bond lengths.
The ferroelastic post-stishovite transition is also manifested by vanishing the shear wave VS1[110] (Zhang et al. 2021). VS1[110] decreases from 5.5 km/s to zero as the Si-O bond length difference decreases from 0.05 Å to zero (Fig. 6b). We should note that the strong reduction of VS1[110] starts from ~40 GPa where the Si-O bond length difference becomes lower than ~0.01 Å. This nonlinear pressure dependence of elasticity is one important consequence of the pseudo-proper typed ferroelastic transition in stishovite whose transition mechanism is the softening of the B1g mode (Carpenter and Salje 1998). The Si-O bond lengths represent the bonding strength of the lattice that determines the frequency of the optic mode. Previous Raman shift data and a pseudo-proper typed Landau model have shown that squared Raman shift of the B1g mode (ω2) is proportional to pressure (Carpenter et al. 2000; Hemley et al. 2000; Kingma et al. 1995). That is, ω2 ∝ P or ω ∝ √P. This nonlinear relation in the Raman shift of the soft B1g mode with respect to pressure can thus lead to the nonlinear behavior in the shear velocity reduction close to the post-stishovite transition pressure. Across into the post-stishovite phase, VS1[110] increases as the Si-O bond length difference increases (Fig. 6b).
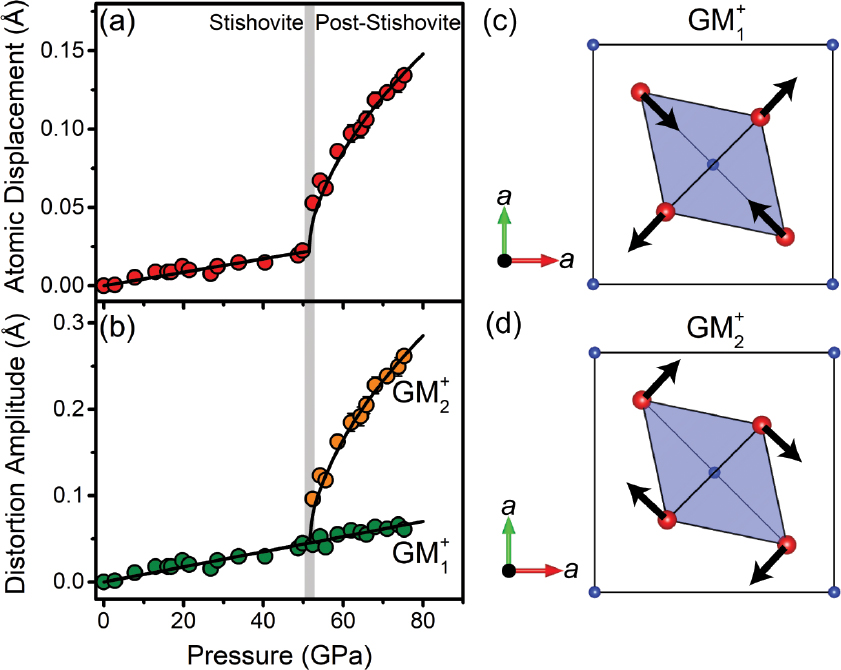
Atomic displacements and distortion mode amplitudes across the post-stishovite transition at high pressure. (a) Maximum displacement of O atoms in the crystal structure; (b) Amplitude of GM1+ and GM2+ distortion modes. Black lines are best linear or polynomial fits to guide the eyes. Atomic displacements for GM1+ and GM2+ are schematically drawn in c and d, respectively. In c and d, blue and red spheres represent Si and O atoms, respectively, shaded area represents a SiO6 octahedron, and black lines with arrows represent atomic displacements upon compression.
We also use the structural parameters to quantify the spontaneous strains (e1 and e2) and order parameter Q in a pseudo-proper type Landau model at high pressure (Fig. 7). The splitting of O coordinates leads to a symmetry reduction from tetragonal to orthorhombic structure and an occurrence of the GM2+ rotational mode. Because yo > xo in the orthorhombic post-stishovite phase (Fig. 3a), the a axis becomes shorter, whereas the b axis becomes longer with respect to the ideal stishovite structure. All these lead to the occurrence of a negative spontaneous strain e1 and a positive spontaneous strain e2 (Fig. 7a). Additionally, as the amplitude of GM2+ significantly increases (Fig. 5b), 2 the SiO6 octahedron rotates about the c axis in the post-stishovite structure (Fig. 7a). Our results further show that the symmetry-breaking strain e1–e2, whose eigenvalue is the aforementioned elastic modulus C11–C12, can be quantified by the SiO6 rotation angle Φ (Fig. 7b). That is, e1–e2 is proportional to Φ. Because the order parameter Q is coupled linearly to the strain e1–e2 (Carpenter et al. 2000), Q also changes linearly with Φ (Fig. 7c). We should note that the value of Q is obtained from a set of Landau parameters that were derived from combined experimental elastic moduli, lattice parameters, and Raman shift data (Zhang et al. 2021).
![Figure 6 Elastic moduli and shear wave velocity of stishovite and post-stishovite as a function of the bond length difference between the apical and equatorial Si-O bonds. (a) Selected elastic moduli, C11, C12, and C22; (b) transverse shear wave VS1[110] polarizing along [110] and propagating along [110] direction. At a given pressure, elastic moduli and sound velocities are taken from Zhang et al. (2021) while bond length data are taken from refined atomic positions in this study and previous reports as shown in the legend (Andrault et al. 1998; Hill et al. 1983; Karki et al. 1997b; Ross et al. 1990; Sinclair and Ringwood 1978; Sugiyama et al. 1987; Yamanaka et al. 2002). Note that bond length data from this study are shown in solid circles with different colors for figure clarity. Black lines show co-plotting of Landau modeling results for the elastic properties in Zhang et al. (2021) and linear incompressibility fitting results for bond lengths in Figure 3b. When the apical bond length is equal to the equatorial bond length, C11 converges with C12 in a and VS1[110] vanishes in b. The gray vertical band shows the post-stishovite phase transition region. Early studies are also plotted for comparison.](/document/doi/10.2138/am-2022-8458/asset/graphic/j_am-2022-8458_eq_008.jpg)
Elastic moduli and shear wave velocity of stishovite and post-stishovite as a function of the bond length difference between the apical and equatorial Si-O bonds. (a) Selected elastic moduli, C11, C12, and C22; (b) transverse shear wave VS1[110] polarizing along [110] and propagating along [110] direction. At a given pressure, elastic moduli and sound velocities are taken from Zhang et al. (2021) while bond length data are taken from refined atomic positions in this study and previous reports as shown in the legend (Andrault et al. 1998; Hill et al. 1983; Karki et al. 1997b; Ross et al. 1990; Sinclair and Ringwood 1978; Sugiyama et al. 1987; Yamanaka et al. 2002). Note that bond length data from this study are shown in solid circles with different colors for figure clarity. Black lines show co-plotting of Landau modeling results for the elastic properties in Zhang et al. (2021) and linear incompressibility fitting results for bond lengths in Figure 3b. When the apical bond length is equal to the equatorial bond length, C11 converges with C12 in a and VS1[110] vanishes in b. The gray vertical band shows the post-stishovite phase transition region. Early studies are also plotted for comparison.
These crystallographic data and symmetry mode results can be correlated with Landau modeling parameters to have a better understanding of the transition. Previous studies have shown that the post-stishovite transition belongs to the pseudo-proper type, which is driven by the soft B1g optic mode (Carpenter et al. 2000; Kingma et al. 1995). The Raman active B1g mode represents a rotational vibration of O atoms about the c axis (Hemley et al. 1986; Traylor et al. 1971). As the two Si-O bond lengths cross over each other due to an in-plane stretching of O atoms with GM1+ symmetry (Figs. 3b, 5b, and 5c), the Raman shifts of the B1g optic mode decrease and would become zero at the critical pressure (PC = 110.2 GPa) (Kingma et al. 1995; Zhang et al. 2021). However, the transition occurs at a much lower pressure of ~51.4 GPa where the two Si-O bond lengths are equal (Fig. 3b). The O coordinates split across the transition (Fig. 3a), leading to a symmetry breaking from the point group 422 to 222 where one fourfold axis becomes a twofold axis. This symmetry reduction further results in the occurrence of the GM2+ rotational mode and the SiO6 octahedron rotation about the c axis (Figs. 5b and 5d). As a result, symmetry-breaking spontaneous strains appear (Figs. 7a and 7b). The eigenvalue C11–C12 and acoustic velocity VS1[110] accordingly vanish at the transition, leading to significant shear wave velocity softening (Zhang et al. 2021). Therefore, the Si-O bond lengths and SiO6 octahedron rotation, together with their relevant GM1+ and GM2+ distortion modes, play a key role in the ferroelastic transition from the stishovite to the post-stishovite phase.
Implications
As discussed in the introduction, pseudo-proper, proper, and improper typed ferroelastic transitions can occur in representative naturally occurring silicate minerals in the Earth’s deep crust and mantle. The ferroelastic transitions are manifested by the appearance of the symmetry-breaking spontaneous strain in the low-symmetry ferroelastic phase, although the driving force is different among these ferroelastic transitions (Wadhawan 1982). Our study on the post-stishovite transition, a typical pseudo-proper typed ferroelastic transition, reveals the relationship between the macroscopic spontaneous strain and microscopic structural angle. Previous studies on proper and improper typed transitions have also shown a similar relationship. For example, albite (NaAlSi3O8 feldspar) undergoes a proper typed ferroelastic transition from monoclinic (space group: C2/m) to triclinic (space group: C1) structure at ~1300 K (Salje 1985; Salje et al. 1985). The spontaneous strain e4 varies linearly with –cos α, where α is the lattice constant angle (Carpenter et al. 1998; Kroll et al. 1980). Improper typed ferroelastic transition occurs in CaPv from cubic to tetragonal phase at ~420 K and 12 GPa with the tetragonal shear strain proportional to the squared rotation angle of the SiO6 octahedron about the c axis (Φ2Pv) (Thomson et al. 2019; Zhao et al. 1993a,1993b). These results reveal that the symmetry-breaking strain occurs as the primary effect from the structural angle in the low-symmetry ferroelastic phase. Furthermore, the structural angles can be linked to given symmetry-adapted distortion modes based on a group-subgroup relation. For example, considering that CaPv has a parent structure with Pm3m space group and a low-symmetry phase with the subgroup I4/mcm, the ΦPv angle can be attributed to a distortion mode with symmetry R+ (Perez-Mato et al. 2010). Therefore, the change of the structural angle with the occurrence of symmetry-breaking distortion mode is an important consequence of the ferroelastic transition. Our results here can be combined with sound velocity and elastic moduli studies across the three types of ferroelastic transitions in silicates and oxides at high pressure. This helps shed light on the abnormal seismic properties across the transitions especially in the subducting slabs and deep crustal regions.
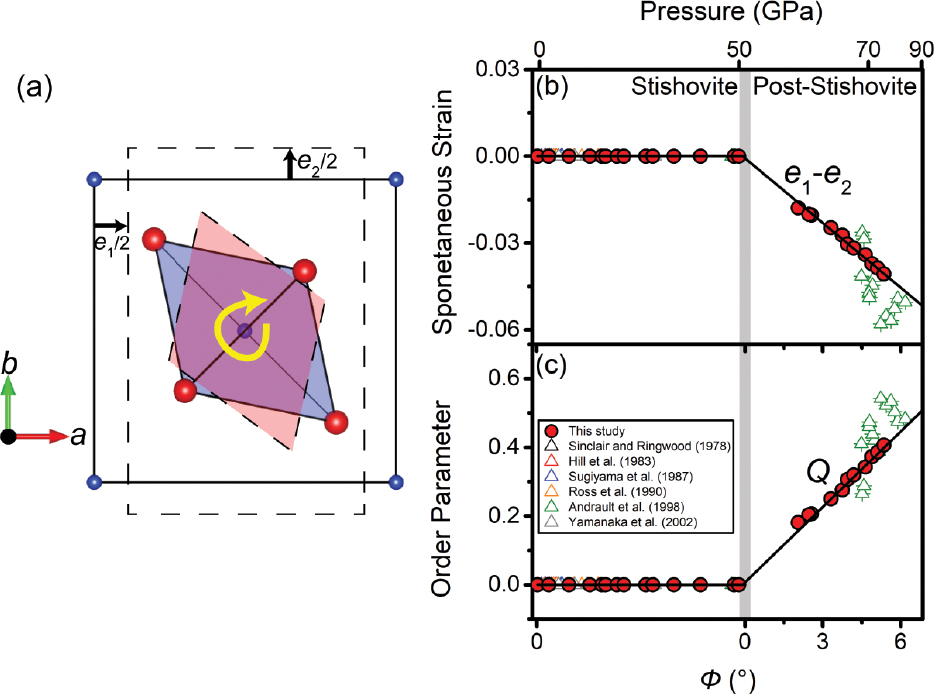
Landau parameters as a function of the SiO6 rotation angle Φ about the c axis across the post-stishovite transition. (a) Schematics to highlight the rotation of the SiO6 octahedron and the occurrence of the spontaneous strains e1 and e2 in b. Blue and red spheres represent Si and O atoms, respectively. The a-b plane of the post-stishovite unit cell is schematically drawn in the pink area with dashed lines, whereas the a-a plane in the stishovite structure is shown in the blue area with solid lines for comparison for the lattice rotation. (b) Symmetry-breaking spontaneous strain e1–e2 and (c) order parameter Q as a function of Φ. Crossing into the post-stishovite phase, e1–e2 and Q emerge and change linearly with Φ in b and c, respectively. The gray vertical band shows the transition pressure. Literature data are plotted for comparison (Andrault et al. 1998; Hill et al. 1983; Ross et al. 1990; Sinclair and Ringwood 1978; Sugiyama et al. 1987; Yamanaka et al. 2002).
Funding statement: GSECARS was supported by the National Science Foundation (EAR-0622171). This research used resources of the Advanced Photon Source, a U.S. Department of Energy (DOE) Office of Science User Facility operated for the DOE Office of Science by Argonne National Laboratory under Contract No. DE-AC02-06CH11357. Jung-Fu Lin acknowledges support from Geophysics Program of the U.S. National Science Foundation (EAR-1916941 and EAR-2001381) and the Joint-Use User Program of the Institute for Planetary Materials, Okayama University. The authors acknowledge partial support of the publication fee by the Owen-Coates Funds of the Department of Geological Sciences, the University of Texas at Austin.
Acknowledgments
We thank Vincent Lynch for his assistance on SCXRD measurements at ambient conditions and data analysis. High-pressure SCXRD experiments were performed at 13ID-D, GSECARS.
References cited
Aizu, K. (1969) Possible species of “ferroelastic” crystals and of simultaneously ferroelectric and ferroelastic crystals. Journal of the Physical Society of Japan, 27, 387–396.Search in Google Scholar
Aizu, K. (1970) Determination of the state parameters and formulation of spontaneous strain for ferroelastics. Journal of the Physical Society of Japan, 28, 706–716.Search in Google Scholar
Andrault, D., Fiquet, G., Guyot, F., and Hanfland, M. (1998) Pressure-induced Landautype transition in stishovite. Science, 282, 720–724.Search in Google Scholar
Andrault, D., Angel, R.J., Mosenfelder, J.L., and Bihan, T.L. (2003) Equation of state of stishovite to lower mantle pressures. American Mineralogist, 88, 301–307.Search in Google Scholar
Bärnighausen, H., Bossert, W., and Anselment, B. (1984) A second-order phase transition of calcium bromide and its geometrical interpretation. Acta Crystallographica, A40.Search in Google Scholar
Bell, R., and Rupprecht, G. (1963) Elastic constants of strontium titanate. Physical Review, 129, 90–94.Search in Google Scholar
Birch, F. (1947) Finite elastic strain of cubic crystals. Physical Review, 71, 809 –824.Search in Google Scholar
Boffa Ballaran, T., Kurnosov, A., and Trots, D. (2013) Single-crystal X-ray diffraction at extreme conditions: a review. High Pressure Research, 33, 453–465.Search in Google Scholar
Brown, J., Abramson, E., and Angel, R. (2006) Triclinic elastic constants for low albite. Physics and Chemistry of Minerals, 33, 256–265.Search in Google Scholar
Buchen, J., Marquardt, H., Schulze, K., Speziale, S., Boffa Ballaran, T., Nishiyama, N., and Hanfland, M. (2018) Equation of state of polycrystalline stishovite across the tetragonal-orthorhombic phase transition. Journal of Geophysical Research: Solid Earth, 123, 7347–7360.Search in Google Scholar
Bykova, E. (2015) Single-crystal X-ray diffraction at extreme conditions in mineral physics and material sciences, 283 p. Ph.D. thesis, University of Bayreuth, Bayreuther Graduiertenschule für Mathematik und Naturwissenschaften.Search in Google Scholar
Carpenter, M.A. (2006) Elastic properties of minerals and the influence of phase transitions. American Mineralogist, 91, 229–246.Search in Google Scholar
Carpenter, M.A., and Salje, E.K. (1998) Elastic anomalies in minerals due to structural phase transitions. European Journal of Mineralogy, 10, 693–812.Search in Google Scholar
Carpenter, M.A., Salje, E.K., and Graeme-Barber, A. (1998) Spontaneous strain as a determinant of thermodynamic properties for phase transitions in minerals. European Journal of Mineralogy, 10, 621–691.Search in Google Scholar
Carpenter, M.A., Hemley, R.J., and Mao, HK. (2000) High-pressure elasticity of stishovite and the P42/mnm ⇌ Pnnm phase transition. Journal of Geophysical Research: Solid Earth, 105, 10807–10816.Search in Google Scholar
Chariton, S., Bykov, M., Bykova, E., Koemets, E., Fedotenko, T., Winkler, B., Hanfland, M., Prakapenka, V.B., Greenberg, E., McCammon, C., and Dubrovinsky, L. (2020) The crystal structures of Fe-bearing MgCO3 sp2-and sp3-carbonates at 98 GPa from single-crystal X-ray diffraction using synchrotron radiation. Acta Crystallographica, E76, 715–719.Search in Google Scholar
Clegg, W. (2019) The development and exploitation of synchrotron single-crystal diffraction for chemistry and materials. Philosophical Transactions. Series A, Mathematical, Physical, and Engineering Sciences, 377, 20180239.Search in Google Scholar
Dera, P. (2010) All different flavors of synchrotron single crystal X-ray diffraction experiments. High-Pressure Crystallography, p. 11–22. Springer.Search in Google Scholar
Dolomanov, O.V., Bourhis, L.J., Gildea, R.J., Howard, J.A., and Puschmann, H. (2009) OLEX2: A complete structure solution, refinement and analysis program. Journal 4 of Applied Crystallography, 42, 339–341.Search in Google Scholar
Fei, Y., Ricolleau, A., Frank, M., Mibe, K., Shen, G., and Prakapenka, V. (2007) Toward an internally consistent pressure scale. Proceedings of the National Academy of Sciences, 104, 9182–9186.Search in Google Scholar
Gawryluk, D., Klein, Y., Shang, T., Sheptyakov, D., Keller, L., Casati, N., Lacorre, P., Fernández-Díaz, M., Rodríguez-Carvajal, J., and Medarde, M. (2019) Distortion mode anomalies in bulk PrNiO3: Illustrating the potential of symmetry-adapted distortion mode analysis for the study of phase transitions. Physical Review B, 100, 205137.Search in Google Scholar
Harris, K.D., Tremayne, M., and Kariuki, B.M. (2001) Contemporary advances in the use of powder X-ray diffraction for structure determination. Angewandte Chemie International Edition, 40, 1626–1651.Search in Google Scholar
Helffrich, G. (2006) Small-scale seismic heterogeneity and mantle structure. Astronomy and Geophysics, 47, 1.20–1.26.Search in Google Scholar
Hemley, R., Mao, H.-K., and Chao, E. (1986) Raman spectrum of natural and synthetic stishovite. Physics and Chemistry of Minerals, 13, 285–290.Search in Google Scholar
Hemley, R., Shu, J., Carpenter, M., Hu, J., Mao, H., and Kingma, K. (2000) Strain/ order parameter coupling in the ferroelastic transition in dense SiO2. Solid State Communications, 114, 527–532.Search in Google Scholar
Hill, R., Newton, M., and Gibbs, G. (1983) A crystal chemical study of stishovite. Journal of Solid State Chemistry, 47, 185–200.Search in Google Scholar
Ishii, T., Kojitani, H., and Akaogi, M. (2019) Phase relations of harzburgite and MORB up to the uppermost lower mantle conditions: Precise comparison with pyrolite by multisample cell high-pressure experiments with implication to dynamics of subducted slabs. Journal of Geophysical Research: Solid Earth, 124, 3491–3507.Search in Google Scholar
Kaneshima, S. (2016) Seismic scatterers in the mid-lower mantle. Physics of the Earth and Planetary Interiors, 257, 105–114.Search in Google Scholar
Karki, B.B., Stixrude, L., and Crain, J. (1997a) Ab initio elasticity of three high-pressure polymorphs of silica. Geophysical Research Letters, 24, 3269–3272.Search in Google Scholar
Karki, B.B., Warren, M., Stixrude, L., Ackland, G., and Crain, J. (1997b) Ab initio studies of high-pressure structural transformations in silica. Physical Review B, 55, 3465 –3471.Search in Google Scholar
Kingma, K.J., Cohen, R.E., Hemley, R.J., and Mao, H-K. (1995) Transformation of stishovite to a denser phase at lower-mantle pressures. Nature, 374, 243 –245.Search in Google Scholar
Kroll, H., Bambauer, H.U., and Schirmer, U. (1980) The high albite–monalbite and analbite–monalbite transitions. American Mineralogist, 65, 1192–1211.Search in Google Scholar
Lakshtanov, D.L., Sinogeikin, S.V., Litasov, K.D., Prakapenka, V.B., Hellwig, H., Wang, J., Sanches-Valle, C., Perrillat, J.-P., Chen, B., Somayazulu, M., Li, J., Ohtani, E., and Bass, J.D. (2007) The post-stishovite phase transition in hydrous alumina-bearing SiO2 in the lower mantle of the earth. Proceedings of the National Academy of Sciences, 104, 13588–13590.Search in Google Scholar
Litasov, K.D., Kagi, H., Shatskiy, A., Ohtani, E., Lakshtanov, D.L., Bass, J.D., and Ito, E. (2007) High hydrogen solubility in Al-rich stishovite and water transport in the lower mantle. Earth and Planetary Science Letters, 262, 620–634.Search in Google Scholar
Liu, W., Yang, Y., Xia, Q., Ye, Y., Wang, Z., Zhang, P., and Li, G. (2018) Water decreases displacive phase transition temperature in alkali feldspar. European Journal of Mineralogy, 30, 1071–1081.Search in Google Scholar
Momma, K., and Izumi, F. (2011) VESTA 3 for three-dimensional visualization of crystal, volumetric and morphology data. Journal of Applied Crystallography, 44, 1272–1276.Search in Google Scholar
Niu, F., Kawakatsu, H., and Fukao, Y. (2003) Seismic evidence for a chemical heterogeneity in the midmantle: A strong and slightly dipping seismic reflector beneath the Mariana subduction zone. Journal of Geophysical Research: Solid Earth, 108.Search in Google Scholar
Orobengoa, D., Capillas, C., Aroyo, M.I., and Perez-Mato, J.M. (2009) AMPLIMODES: symmetry-mode analysis on the Bilbao Crystallographic Server. Journal of Applied Crystallography, 42, 820–833.Search in Google Scholar
Pawley, A.R., McMillan, P.F., and Holloway, J.R. (1993) Hydrogen in stishovite, with implications for mantle water content. Science, 261, 1024–1024.Search in Google Scholar
Perez-Mato, J., Orobengoa, D., and Aroyo, M. (2010) Mode crystallography of distorted structures. Acta Crystallographica, A66, 558–590.Search in Google Scholar
Petříček, V., Dušek, M., and Palatinus, L. (2014) Crystallographic computing system JANA2006: general features. Zeitschrift für Kristallographie—Crystalline Materials, 229, 345–352.Search in Google Scholar
Range, K.-J., Rau, F., Klement, U., and Heyns, A. (1987) β-PtO2: high pressure synthesis of single crystals and structure refinement. Materials Research Bulletin, 22, 1541–1547.Search in Google Scholar
Renner, B., and Lehmann, G. (1986) Correlation of angular and bond length distortions in TO4 units in crystals. Zeitschrift für Kristallographie—Crystalline Materials, 175, 43–59.Search in Google Scholar
Rigaku, O. (2015) Crysalis Pro. Rigaku Oxford Diffraction, Yarnton, England.Search in Google Scholar
Robinson, K., Gibbs, G., and Ribbe, P. (1971) Quadratic elongation: a quantitative measure of distortion in coordination polyhedra. Science, 172, 567–570.Search in Google Scholar
Ross, N.L., Shu, J., and Hazen, R.M. (1990) High-pressure crystal chemistry of stishovite. American Mineralogist, 75, 739–747.Search in Google Scholar
Rudnick, R., Gao, S., Holland, H., and Turekian, K. (2003) Composition of the continental crust. The Crust, 3, 1–64.Search in Google Scholar
Salje, E. (1985) Thermodynamics of sodium feldspar I: Order parameter treatment and strain induced coupling effects. Physics and Chemistry of Minerals, 12, 93–98.Search in Google Scholar
Salje, E. (1990) Phase transitions in ferroelastic and co-elastic crystals. Ferroelectrics, 104, 111–120.Search in Google Scholar
Salje, E. (1992) Application of Landau theory for the analysis of phase transitions in minerals. Physics Reports, 215, 49–99.Search in Google Scholar
Salje, E., Kuscholke, B., Wruck, B., and Kroll, H. (1985) Thermodynamics of sodium feldspar II: experimental results and numerical calculations. Physics and Chemistry of Minerals, 12, 99–107.Search in Google Scholar
Sheldrick, G.M. (2015) Crystal structure refinement with SHELXL. Acta Crystallographica, C71, 3–8.Search in Google Scholar
Sinclair, W., and Ringwood, A. (1978) Single crystal analysis of the structure of stishovite. Nature, 272, 714 –715.Search in Google Scholar
Spek, A.L. (2009) Structure validation in chemical crystallography. Acta Crystallographica, D65, 148–155.Search in Google Scholar
Sugiyama, M., Endo, S., and Koto, K. (1987) The crystal structure of stishovite under pressure up to 6 GPa. Mineralogical Journal, 13, 455–466.Search in Google Scholar
Sun, N., Bian, H., Zhang, Y., Lin, J.F., Prakapenka, V.B., and Mao, Z. (2022) Highpressure experimental study of tetragonal CaSiO3-perovskite to 200 GPa. American Mineralogist, 107, 110–115.Search in Google Scholar
Thomson, A., Crichton, W., Brodholt, J., Wood, I., Siersch, N., Muir, J., Dobson, D., and Hunt, S. (2019) Seismic velocities of CaSiO3 perovskite can explain LLSVPs in Earth’s lower mantle. Nature, 572, 643–647.Search in Google Scholar
Traylor, J.G., Smith, H., Nicklow, R., and Wilkinson, M. (1971) Lattice dynamics of rutile. Physical Review B, 3, 3457 –3472.Search in Google Scholar
Tsuchiya, T. (2011) Elasticity of subducted basaltic crust at the lower mantle pressures: Insights on the nature of deep mantle heterogeneity. Physics of the Earth and Planetary Interiors, 188, 142–149.Search in Google Scholar
Wadhawan, V.K. (1982) Ferroelasticity and related properties of crystals. Phase Transitions, 3, 3–103.Search in Google Scholar
Waeselmann, N., Brown, J.M., Angel, R.J., Ross, N., Zhao, J., and Kaminsky, W. (2016) The elastic tensor of monoclinic alkali feldspars. American Mineralogist, 101, 1228–1231.Search in Google Scholar
Wang, W., Xu, Y., Sun, D., Ni, S., Wentzcovitch, R., and Wu, Z. (2020) Velocity and density characteristics of subducted oceanic crust and the origin of lower-mantle heterogeneities. Nature Communications, 11, 1–8.Search in Google Scholar
Xu, F., Yamazaki, D., Sakamoto, N., Sun, W., Fei, H., and Yurimoto, H. (2017) Silicon and oxygen self-diffusion in stishovite: Implications for stability of SiO2-rich seismic reflectors in the mid-mantle. Earth and Planetary Science Letters, 459, 332–339.Search in Google Scholar
Yamanaka, T., Fukuda, T., and Mimaki, J. (2002) Bonding character of SiO2 stishovite under high pressures up to 30 GPa. Physics and Chemistry of Minerals, 29, 633–641.Search in Google Scholar
Yang, R., and Wu, Z. (2014) Elastic properties of stishovite and the CaCl2-type silica at the mantle temperature and pressure: An ab initio investigation. Earth and Planetary Science Letters, 404, 14–21.Search in Google Scholar
Zhang, Z., and Klemperer, S.L. (2005) West-east variation in crustal thickness in northern Lhasa block, central Tibet, from deep seismic sounding data. Journal of Geophysical Research: Solid Earth, 110.Search in Google Scholar
Zhang, Y., Fu, S., Wang, B., and Lin, J.-F. (2021) Elasticity of a pseudo-proper ferroelastic transition from stishovite to post-stishovite at high pressure. Physical Review Letters, 126, 025701 025701.Search in Google Scholar
Zhao, Y., Weidner, D.J., Parise, J.B., and Cox, D.E. (1993a) Critical phenomena and phase transition of perovskite—data for NaMgF3 perovskite. Part II. Physics of the Earth and Planetary Interiors, 76, 17–34.Search in Google Scholar
Zhao, Y., Weidner, D.J., Parise, J.B., and Cox, D.E. (1993b) Thermal expansion and structural distortion of perovskite—data for NaMgF3 perovskite. Part I. Physics of the Earth and Planetary Interiors, 76, 1–16.Search in Google Scholar
Zhao, W., Mechie, J., Brown, L.D., Guo, J., Haines, S., Hearn, T., Klemperer, S.L., Ma, Y.S., Meissner, R., Nelson, K.D., and others (2001) Crustal structure of central Tibet as derived from project INDEPTH wide-angle seismic data. Geophysical Journal International, 145, 486–498.Search in Google Scholar
© 2023 Mineralogical Society of America
This work is licensed under the Creative Commons Attribution 4.0 International License.
Articles in the same Issue
- MSA Review
- Nickel in olivine as an exploration indicator for magmatic Ni-Cu sulfide deposits: A data review and re-evaluation
- Repeat, fast, and high-resolution mapping of fine-scale trace element distribution in pyrite and marcasite by LA-Q-ICP-MS with the Aerosol Rapid Introduction System (ARIS)
- Continuous Be mineralization from two-mica granite to pegmatite: Critical element enrichment processes in a Himalayan leucogranite pluton
- An evolutionary system of mineralogy, Part VI: Earth’s earliest Hadean crust (>4370 Ma)
- Oxidation or cation re-arrangement? Distinct behavior of riebeckite at high temperature
- Fe3+/FeT ratios of amphiboles determined by high spatial resolution single-crystal synchrotron Mössbauer spectroscopy
- How clay delamination supports aseismic slip
- The influence of Al2O3 on the structural properties of MgSiO3 akimotoite
- Atomistic insight into the ferroelastic post-stishovite transition by high-pressure single-crystal X-ray diffraction
- Epidote as a conveyor of water into the Earth’s deep mantle in subduction zones: Insights from coupled high-pressure and high-temperature experiments
- Potential link between antigorite dehydration and shallow intermediate-depth earthquakes in hot subduction zones
- Stability of Fe5O6 and its relation to other Fe-Mg-oxides at high pressures and temperatures
- From schwertmannite to natrojarosite: Long-term stability and kinetic approach
- Trace element and isotopic (S, Pb) constraints on the formation of the giant Chalukou porphyry Mo deposit, NE China
- Textural and chemical evolution of magnetite from the Paleozoic Shuanglong Fe-Cu deposit: Implications for tracing ore-forming fluids
- Jingwenite-(Y) from the Yushui Cu deposit, South China: The first occurrence of a V-HREE-bearing silicate mineral
- Wenjiite, Ti10(Si,P,◻)7, and kangjinlaite, Ti11(Si,P)10, new minerals in the ternary Ti-P-Si system from the Luobusa ophiolite, Tibet, China
- Evaluating the physicochemical conditions for gold occurrences in pyrite
- Letter
- Synthesis and structural analysis of CaFe2O4-type single crystals in the NaAlSiO4-MgAl2O4-Fe3O4 system