
Development and Evolution of Aluminum Industry in China Based on Aluminum Flow Analysis
-
Qiang Yue
 ,
Zaidong Fan
,
Zaidong Fan

Abstract
The whole process of aluminum cycle consists of four stages: Production of alumina and primary aluminum, fabrication and manufacture of aluminum products, use of aluminum final products, and recycling of obsolete aluminum products. Aluminum cycle in China in 2011 was analyzed using alumium flow diagram, and the following indices were obtained: The resource self-support ratio of alumina, aluminum and the whole aluminum industry were 53.18%, 95.58% and 54.85%, respectively; self-produced and net imported aluminum scrap use ratios of the aluminum industry were 4.68% and 7.98%, respectively. Aluminum cycles and aluminum flow indices in China of the year 1990, 1995, 2000, 2005 and 2008–2010 were also analyzed. It was found that from 1990 to 2011, imported Al-containing resources increased and imported bauxite has increased significantly since 2005. Resources self-support ratio of aluminum industry changed gradually from fully self-support to depencdent on the imports of raw materials. Self-produced auminum scrap use ratio presented downtrend basically and the imported aluminum scrap use ratio was greater than self-produced aluminum scrap use ratio after 1995.
1 Introduction
Chinese aluminum industry was in a rapid development in recent years (see Table 1), aluminum production capacity increased quickly and demand for bauxite etc growed rapidly. Domestic bauxite mining, reserve consumption and imported Al-containing resources continue to grow. Aluminum production and consumption caused a huge gap of supply for bauxite, scrap etc raw materials. Decrease in the grade and short supply of ore resources has become a bottleneck in the development of aluminum industry in China.
Variations of aluminum production and consumption in China in the period of 1990–2013 (unti: 104t)
| Year | Production | Consumption | Year | Production | Consumption |
|---|---|---|---|---|---|
| 1990 | 85.43 | 83.68 | 2002 | 451.11 | 415.20 |
| 1991 | 96.25 | 98.50 | 2003 | 596.20 | 517.76 |
| 1992 | 109.60 | 132.80 | 2004 | 668.88 | 619.09 |
| 1993 | 125.15 | 135.00 | 2005 | 780.60 | 711.86 |
| 1994 | 149.84 | 153.70 | 2006 | 926.40 | 838.00 |
| 1995 | 186.97 | 168.50 | 2007 | 1228.40 | 1197.90 |
| 1996 | 190.07 | 175.00 | 2008 | 1317.63 | 1241.25 |
| 1997 | 217.86 | 211.50 | 2009 | 128861 | 1315.0 |
| 1998 | 243.53 | 242.54 | 2010 | 157713 | 15855 |
| 1999 | 280.89 | 292.59 | 2011 | 176789 | 17629 |
| 2000 | 298.82 | 353.27 | 2012 | 202084 | 2148.15 |
| 2001 | 357.58 | 354.54 | 2013 | 2205.85 | 2320.00 |
Bauxite resources are relatively poor in China, at the same time, the quality of more than 85% of the reserves are also disappointed. Bauxite reserve per person in China is 1/9 of the global average level and current reserve is accounted to lower than 2% of the global reserve. Dynamic reserve to consumption is less than 12 years and reserve to production is less than 20 years in China. In 2020 China’s domestic bauxite guarantee degree is only about 38% of the demand, and this is a very serious problem. There are some uncertain factors regarding to a large number of imports, which will be limited to the exporter. Imported bauxite is equal to imported a large number of pollutants at the same time, about 50% for hazardous waste (red sludge)[1].
Therefore, under a so large and rapidly increasing aluminum industry, bauxite resource was severely deficient and depends on a large number of imports at the same time, it is necessary to study on the history of aluminum industry in China. Analysis of Chinese aluminum industry based on substance flow analysis is very useful in finding the development and evolution of aluminum industry in China, which can help to attain the savings of Al-containing resources and achieve a sustainable development in the aluminum industry. It has been carried out some related research on the aluminum industry.
Melo used three different kinds of models to predict the amount of aluminum old scrap in the waste management stage in Germany[2]. Martchek used a simplified model to analyze the global aluminum cycle in 2003[3]. Hatayama and his colleagues calculated the output of aluminum old scrap produced from different sectors[4]. Plunkert adopted aluminum flow framework to analyze the aluminum cycle in the United States in 2000[5]. Liu and Müller described the global journey of anthropogenic aluminum by adopting trade-linked materials flow analysis[6]. Dahlström and Ekins analyzed aluminum flow in the United Kingdom in 2001 combining substance flow analysis and value chain analysis together[7]. Liu and Müller reviewed the problem of addressing the sustainability of aluminum industry by life cycle assessment approach[8]. Chen and his colleagues used aluminum flow diagram to analyze aluminum cycle of China in 2005[9]. Yue and his colleagues used alumnum flow diagram to analyze aluminum cycles in 2003–2007 in China[10]. Chen and his colleagues explored the production, consumption, import and export, losses and changes of stocks of aluminum in China for 2001, 2004 and 2007[11]. Yue and Lu analyzed aluminum social stock in China[12].
This paper is based on the theory of metal’s industrial metabolism, aluminum flow diagram was adopted to analyze, aluminum flow for the aluminum product life cycle of 1990, 1995, 2000, 2005 and 2008–2011 in China. Aluminum flow indices of China’s aluminum industry during these periods were calculated, and proposals for future development of China’s aluminum industry were put forward.
2 Methods and Indices
2.1 Method
Substance flow analysis (SFA) is an effective tool for studying the industrial metabolism of specific substances (e.g., aluminum, copper) on a certain spatial scale, for example, on the scale of a nation, a region or a firm. Industrial metabolism means the whole integrated collection of physical processes that convert raw materials and energy, plus labor, into finished products and wastes. Therefore, the subject of SFA is to identify and quantify the material flows related to those physical processes and the relationship among them[13]. The purpose of SFA is looking for the potentials and measures of resource conservation and environment protection, and encouraging industrial system to meet the requirement of sustainable development. Thus, the proposals offered in SFA can be of assistance to decision makers.
The aluminum flow diagram for the aluminum products life cycle is given in Figure 1.
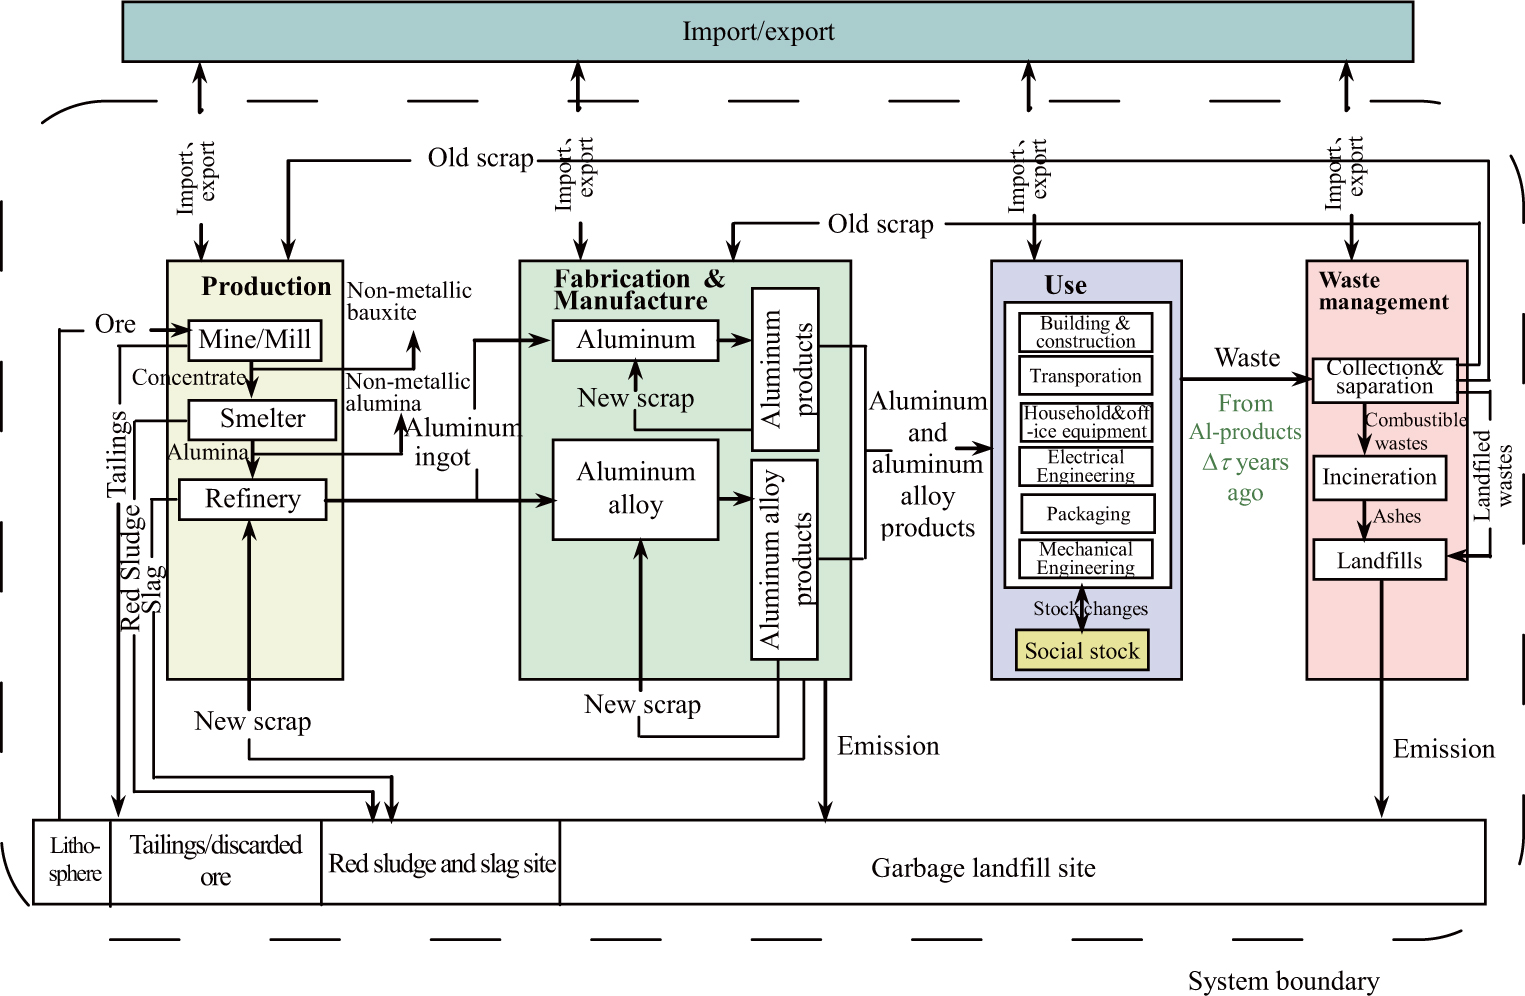
Aluminum flow diagram
The entire life cycle of aluminum products comprises four stages. Some explanations for the four stages are as follows [10, 14]:
Production: Bauxite mining/milling, the production of alumina and aluminum has been treated as a separate process, and is shown at stage I. The dissipating amount of Al-containing materials during this stage contains tailing, red sludge and slag.
Fabrication & Manufacture: The stage II is the fabrication and manufacture stage of the aluminum products. Aluminum flows within this stage include the fabrication of aluminum semis and aluminum alloy semis, and the manufacture of intermediate commodities and finished products.
Use: Aluminum products leave the manufacture stage in the form of finished products or being embedded into assembled products. When the aluminum products are produced, they are widely used in national economy, such as constructions and vehicles, and so on.
Waste Management: The retrieve of obsolete aluminum products is the fourth stage in aluminum cycle. Some of obsolete aluminum products are retrieved after their life cycle Δτ, while some are permanently stored in terrestrial establishments and constructions, otherwise, they will be dissipated into environment during their life cycle.
2.2 Relevant Indices
The items described in Figure 1 are listed in Table 2, we can obtain some important aluminum flow indices based on these parameters (see Table 2).
Items described in Figure 1 and the corresponding aluminum flow indices
| Items | Indicated Aluminum flow indices by | Calculating formulas | |
|---|---|---|---|
| Bauxite mined | Ok | Resources Self-support Ratio (RSR) and Resources Imported Ratio (RIR) | |
| Tailing | Ow | ||
| Bauxite produced | Oz | RSR in alumina production, Z1 | |
| Net imported bauxite | I1 | ||
| Net imported alumina | I2 | RIR in alumina production, J1 | |
| Net imported aluminum | I3 | ||
| Non-metallic bauxite | Kf | RSR in aluminum production, Z2 | |
| Self-produced alumina | Yz | ||
| Non-metallic alumina | Yf | RIR in aluminum production, J2 | |
| Net increase of Al-stock | Sn | ||
| Al-loss during production | D1 | RSR of aluminum industry, Z3 | |
| Aluminum output | Pτ | ||
| Old scrap recycled in the yearτ | Fz | RIR of aluminum industry, J3 | |
| Al-loss during obsolete aluminum products recycling in the year τ | Fs | ||
| Net imported alloy | I4 | Aluminum scrap use ratio of aluminum industry | |
| Net imported semis | I5 | ||
| Net imported scrap | I6 | Self-produced aluminum scrap use ratio, ZS | |
| Aluminum products output | Mτ | ||
| Al-loss during manufacture | D2 | Imported aluminum scrap use ratio, JS | |
| Old scrap recycled in the yearτ + τ | A2 | ||
| Al-loss during obsolete aluminum products recycling in the year τ +τ | D4 | Overall aluminum scrap use ratio, AS | |
| Al-loss during the aluminum products life cycle of the year τ | D | ||
The indices can be divided into three categories:
Resources self-support ratio and resources imported ratio
Resources self-support ratio is the self-produced resources accounted to total resources input, while resources imported ratio is the imported resources accounted to total materials imput.
Aluminum scrap use ratio
Aluminum scrap use ratio is the scrap used accounted to total resources input.
3 Aluminum Flow Analysis in China
3.1 Aluminum Flow Diagram of China in 2011
Based on China Nonferrous Metals Industry Yearbook, etc[15], a aluminum flow diagram for the aluminum products life cycle of 2011 in China can be drawn to reflect the directions of Al-flow and the distribution of aluminum based on the application of the conservation law at every stage with the following-observing method of substance flow analysis (see Figure 2 and Table 3).
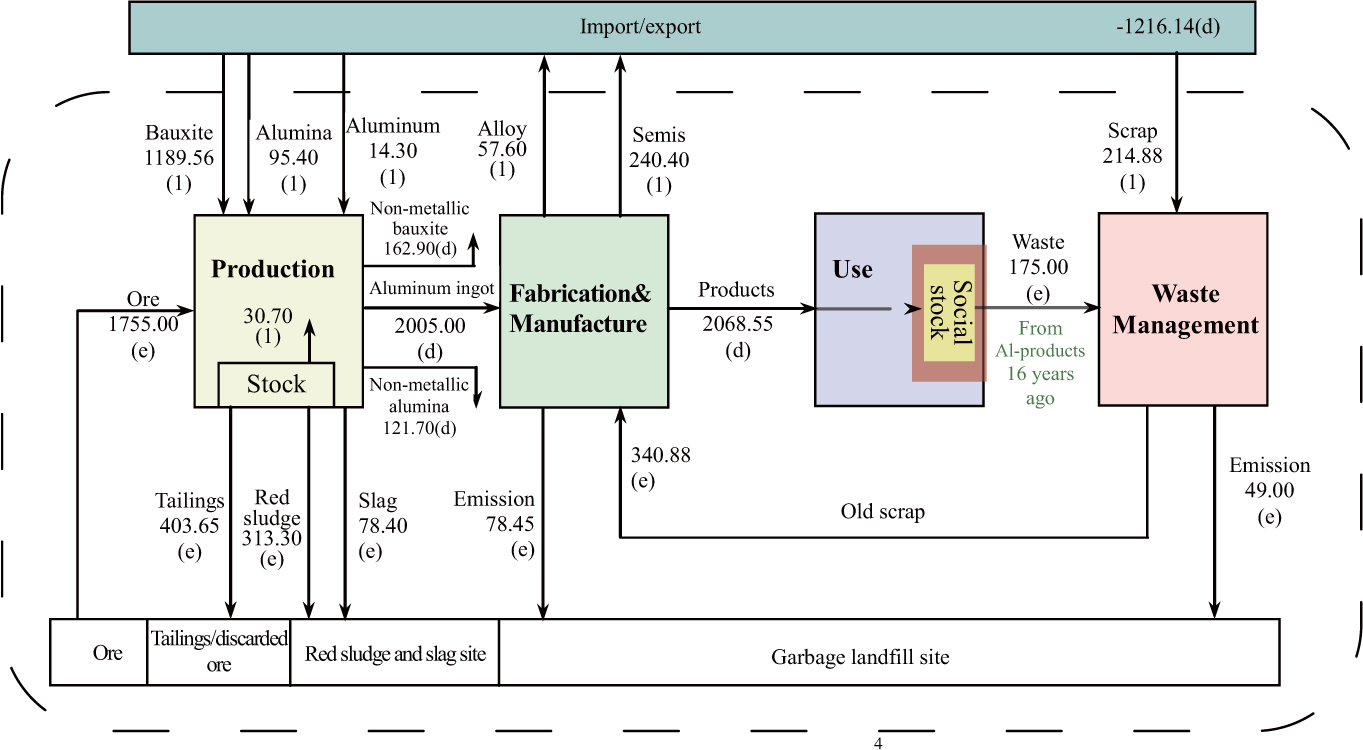
Aluminum flow diagram in China in 2011 (unit: 104t-Al/a)
Explanations on the data described in Figure 2
| Items | Values(104t)[1] | Quantitative relations | Data sources | |
|---|---|---|---|---|
| Ore mined | 1755.00 | Ok was estimated based on the major technical economic targets in [15] and [9] | ||
| Tailing | 403.65 | Ow was estimated based on the major technical economic targets in [15] and [9] | ||
| Self-produced bauxite | 1351.35 | Oz = Ok − Ow | ||
| Net imported bauxite | 1189.56 | I1=(imported bauxite − exported bauxite) | [15] | |
| Bauxite used in alumina production | 2378.01 | OA was calculated based on the major technical economic targets in [15] | ||
| Non-metallic bauxite | 162.90 | Kf = Oz + I1 − OA | ||
| Red sludge | 313.30 | Rw was estimated based on the major technical economic targets in [15] and [9] | ||
| Self-produced alumina | 2064.71 | [15] | ||
| Net imported alumina | 95.40 | I2 = (imported alumina − exported alumina) | [15] | |
| Alumina used in aluminum production | 2038.41 | YA was calculated based on the major technical economic targets in [15] | ||
| Non-metallic alumina | 121.70 | Yf = Yz + I2 − YA | ||
| Slag | 78.40 | Tw was estimated based on the major technical economic targets in [15] and [9] | ||
| Self-produced aluminum | 1960.00 | [15] | ||
| Net imported aluminum | 14.30 | I3 = (imported aluminum − exported aluminum) | [15] | |
| Net decrease of Al-stock | 30.70 | [15] | ||
| Al-loss during production | 795.35 | D1 = Ow + Rw + Tw | ||
| Aluminum used in aluminum products fabrication and manufacture | 2005.00 | PA = Pτ + I3 − Sn | ||
| Net imported alloy | − 57.60[2] | I4 = (imported alloy − exported alloy) | [15] | |
| Net imported semis | − 240.402 | I5 = (imported semis − exported semis) | [15] | |
| Al-loss during fabrication and manufacture | 78.45 | D2 was estimated based on the major technical economic targets in [15] and [9] | ||
| Obsolete aluminum product produced in 2011 | 175.00 | [15] | ||
| Self-produced old scrap recycled in 2011 | 126.00 | Fz = =α × Mτ − Δ τ | α is the recycling rate of obsolete aluminum products, α ≈ 0.72[16] | |
| Net imported scrap | 214.88 | I6 = (imported scrap − exported scrap) | [15] | |
| Aluminum products output | 2068.55 | Mτ = PA + I4 + I5 + Fz + I6 − D2 | ||
| Al-loss during obsolete aluminum products recycling in 2011 | 49.00 | Fs = Mτ − Δ τ − Fz | ||
| Old scrap recycled in 2027 | 1489.36 | A2 = α × Mτ | α is the recycling rate of obsolete aluminum products, α ≈ 0.72[16] | |
| Al-loss during obsolete aluminum products recycling in 2027 | 579.19 | D4 = Mτ − A2 | ||
| Al-loss during the aluminum products life cycle of 2011 | 1452.99 | D = D1 + D2 + D4 | ||
Corresponding data of aluminum flow described in Figure 2 are shown in Table 3.
3.2 Al-containing Materials Flow and Corresponding Aluminum Flow Indices in 1990, 1995, 2000, 2005 and 2008–2011
Similar to the diagram described in Figure 3, aluminum cycles in China in 1990, 1995, 2000, 2005 and 2008–2011 were also analyzed. The values of Al-containing materials flow are described in Table 4.
Net imported Al-contained resources in China in 1990, 1995, 2000, 2005 and 2010
Al-containing materials flow of aluminum industry in China (unit: 104t)
| Year | 2011 | 2010 | 2009 | 2008 | 2005 | 2000 | 1995 | 1990 |
|---|---|---|---|---|---|---|---|---|
| Alumina production stage | ||||||||
| Self-produced bauxite | 1351.35 | 1091.85 | 1041.32 | 824.82 | 564.3 | 277.29 | 216 | 108.62 |
| Net imported bauxite | 1189.56 | 804.54 | 524.75 | 687.07 | 57.3 | 19.35 | −9.47 | −18.03 |
| Aluminum production stage | ||||||||
| Self-produced alumina | 2064.71 | 1531.59 | 1259.47 | 1218.71 | 451.9 | 228.81 | 116.44 | 77.51 |
| Net imported alumina | 95.4 | 227.9 | 268.71 | 240.93 | 370.18 | 99 | 63 | 1.74 |
| Aluminum industry | ||||||||
| Self-produced bauxite | 1351.35 | 1091.85 | 1041.32 | 824.82 | 564.3 | 277.29 | 216 | 108.62 |
| Self-produced scrap | 126 | 121.32 | 110.66 | 97.2 | 59.11 | 37.78 | 28.74 | 15.93 |
| Net imported bauxite | 1189.56 | 804.54 | 524.75 | 687.07 | 57.3 | 19.35 | −9.47 | −18.03 |
| Net imported alumina | 95.4 | 227.9 | 268.71 | 240.93 | 370.18 | 99 | 63 | 1.74 |
| Net imported aluminum | 14.3 | −38.94 | 142.98 | 1.15 | −70.9 | 70.51 | 19.66 | 0.66 |
| Net imported alloy | −57.6 | −38.13 | −2.1 | −59.25 | 2.73 | 17.14 | 4.78 | 0.16 |
| Net imported semis | −240.4 | −158.94 | −80.37 | −126.27 | −6.39 | 32.69 | 16.24 | 2.6 |
| Net imported scrap | 214.88 | 226.04 | 210.02 | 170.32 | 134.89 | 63.77 | 28.8 | 0.44 |
Based on the aluminum cycles in China during these years, materials flow indices of aluminum industry were also analyzed (see Table 5).
Materials flow indices of aluminum industry in China (unit: %)
| Year | 2011 | 2010 | 2009 | 2008 | 2005 | 2000 | 1995 | 1990 |
|---|---|---|---|---|---|---|---|---|
| Resources self-suport ratio and resources import ratio | ||||||||
| Resources self-support ratio in alumina production | 53.18 | 57.58 | 66.49 | 54.55 | 90.78 | 93.48 | 100 | 100 |
| Resources import ratio in alumina production | 46.82 | 42.42 | 33.51 | 45.45 | 9.22 | 6.52 | 0 | 0 |
| Resources self-support ratio in aluminum production | 95.58 | 87.06 | 82.42 | 83.49 | 54.97 | 69.83 | 64.89 | 97.80 |
| Resources import ratio in aluminum production | 4.42 | 12.94 | 17.58 | 16.51 | 45.03 | 30.17 | 35.11 | 2.20 |
| Resources self-support ratio of aluminum industry | 54.85 | 54.26 | 51.99 | 51.57 | 56.10 | 51.05 | 61.48 | 100 |
| Resources import ratio of aluminum industry | 45.15 | 45.74 | 48.01 | 48.43 | 43.90 | 48.95 | 38.52 | 0 |
| Aluminum scrap use ratio of aluminum industry | ||||||||
| Self-produced aluminum scrap use ratio | 4.68 | 5.43 | 4.99 | 5.44 | 5.32 | 6.12 | 7.22 | 14.21 |
| Net imported aluminum scrap use ratio | 7.98 | 10.11 | 9.48 | 9.64 | 12.14 | 10.33 | 7.23 | 0.39 |
| Overall aluminum scrap use ratio | 12.66 | 15.54 | 14.47 | 15.08 | 17.46 | 16.45 | 14.45 | 14.60 |
4 Analysis and Discussion
4.1 Indices Analysis for the Year 1990, 1995, 2000, 2005 and 2010
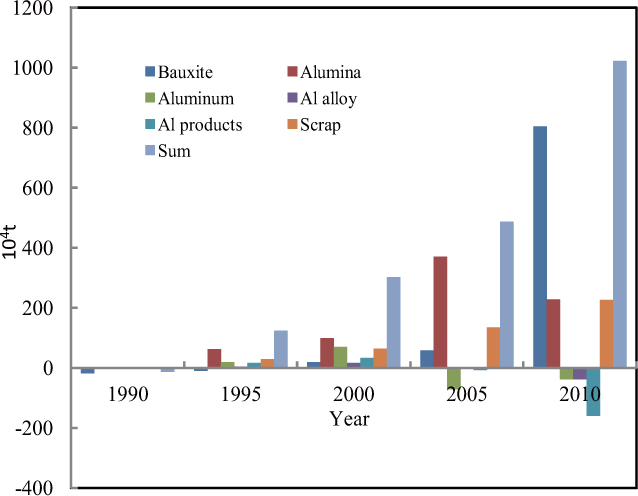
Net imported of Al-contained resources (Figure 3)
Bauxite in China during 1990 and 1995 was in a state of net exports, and then the net imports of bauxite increased year by year, especially from 2005 to 2010 net imports of bauxite rose from 575000 tons to 8.0454 million tons, the growth is significant. At the same time, the quantities of China’s net imported aluminum scrap increased year by year. Aluminum products consumption increased quickly with the rapid development of Chinese economy, as there is a shortage of bauxite resources in China, make the production of aluminum industry in China depend on foreign imports of bauxite and aluminum scrap to a certain extent.
In the period 1995–2010, China’s aluminum, aluminum alloy and aluminum products were changed from net imports gradually to a net export state, the main reason is with the rapid development of China’s economic and industrial smelting technology and progress, makes the domestic production of aluminum products at a faster rate than the growth of the domestic aluminum products needed for consumption. But alumina production in China has maintained a net import state, this is mainly due to the production of raw material for aluminum is mainly alumina, and with the increasing of primary aluminum production in China, the production for alumina is sure to increase.
RSR of alumina, aluminum and aluminum industry (Figure 4)
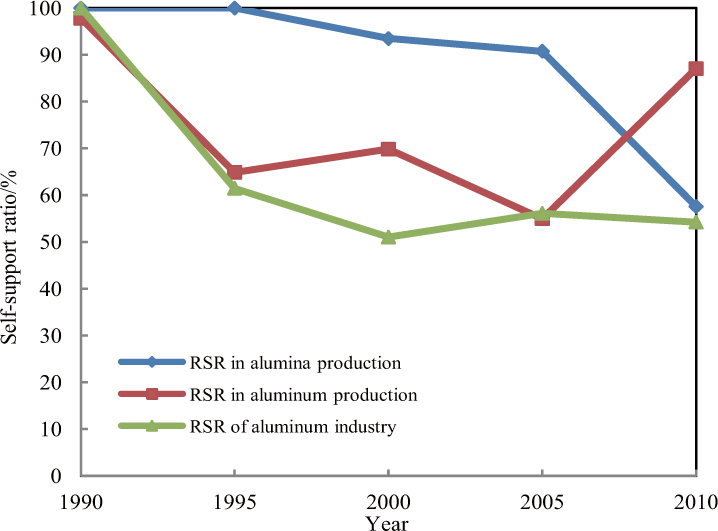 Figure 4
Resources self-support ratio of alumina, aluminum and aluminum industry in China in 1990, 1995, 2000, 2005 and 2010
In 1990, production of alumina and aluminum had almost completely self-support. Its resource self-support ratio of alumina production dropped from 100% in 1990 and 1995 to 57.58% in 2010. This is mainly because with the rapid increase of alumina production, bauxite appears more and more insufficient, the raw materials for alumina production depended on imports of bauxite.
In 2010, resources self-support ratio of primary aluminum production increased, close to 90%. Except in 1990, the whole aluminum industry has a relatively stable its self-support ratio of raw materials, basically remain unchanged.
Aluminum scrap use ratio (Figure 5)
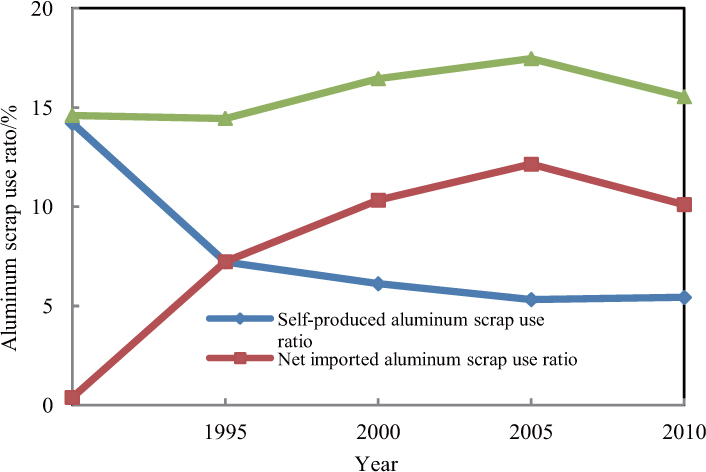 Figure 5
Aluminum scrap use ratio in China in 1990, 1995, 2000, 2005 and 2010
Self-produced aluminum scrap use ratio presented downtrend basically, the main reason is that average use life aluminum products is longer, which is about 15–16 years, and now the old aluminum scrap used is generated from aluminum products put into use about 15–16 years ago. Aluminum products consumption 15–16 years ago is much smaller compared with now, so the proportion of old scrap reclaimed and recoveried in the aluminum production is even much small, the scrap use ratio declined gradually on the overall trend.
Since 1995 the imported aluminum scrap use ratio was greater than self-produced aluminum scrap use ratio, which is closely related to China has imported a lot of aluminum scrap in recent years. Due to the imported aluminum scrap use ratio is relatively stable, which compensate the decline of self-produced aluminum scrap use ratio to some extent, so the total aluminum scrap ratio fluctuated, but the change is not large.
4.2 Indices Analysis for the Year 2008–2011
Net imported of Al-contained resources (Figure 6)
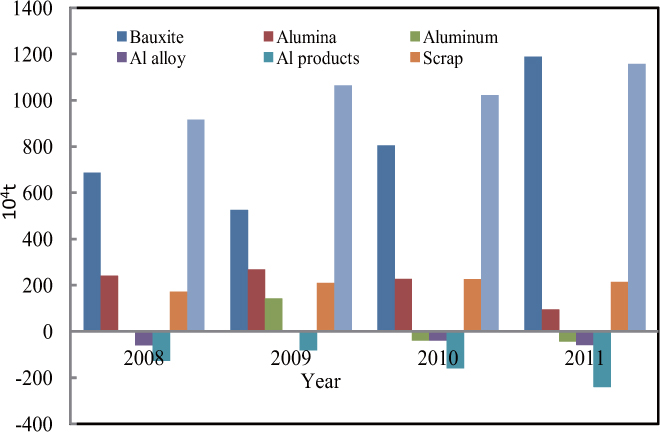 Figure 6
Net imported Al-contained resources in China in 2008–2011
Net imports of bauxite increased obviously in 2008-2011, aluminum scrap also had a small increment in general, the net imported alumina had an obvious decrease trend. Aluminum alloy and aluminum products were net exported during this period, and primary aluminum were also in a net exported state in 2010 and 2011. In 2008-2011, net imports of Al-containing resources have edged up on the whole
RSR of alumina, aluminum and aluminum industry (Figure 7)
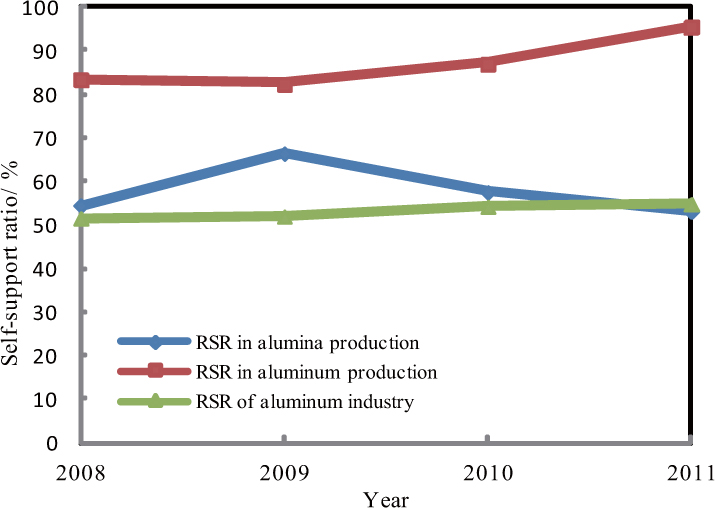 Figure 7
Self-sufficiency rate of alumina, primary aluminum production and the entire aluminum industry in China in 2008–2011
Resource self-support ratio in alumina production has been reduced since 2009, which showed alumina production was more dependent on foreign bauxite
Resource self-support ratio in aluminum production continued to increase during the period 2008-2011, this is because the rapid increase of alumina production in China.
Aluminum scrap use ratio (Figure 8)
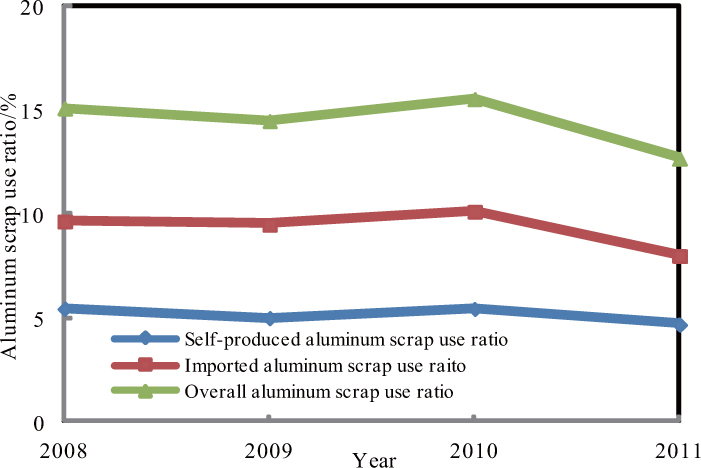 Figure 8
Aluminum scrap use ratio in China in 2008–2011
Self-produced auminum scrap use ratio were kept constant during 2008–2011. Imported aluminum scrap use ratio was greater than self-produced aluminum scrap use ratio. In 2011, imported aluminum scrap use ratio and overall aluminum scrap use ratio declined obviously, which was mainly affected by the market price of aluminum products, it made the cost of imported aluminum scrap increased.
5 Conclusions
From the point of overall analysis, imported bauxite increased in China during the past 20 years, especially after 2005, imported bauxite has increased significantly, which is closely linked to the rapid increase of China’s aluminum consumption and shortage of bauxite resources in China. In order to alleviate the shortage situation of bauxite resources, the production of aluminum industry in China depended on imports of raw materials to a certain extent.
Alumina was net imported in this twenty years from 1990 to 2010 on the whole, but the imported alumina was in a significant downward trend in recent years. China’s aluminum, aluminum products and aluminum alloy were transformed from net imports to net exports, and these three net exports are increased year by year in recent years.
From 1990 to 2011, the variation of resources self-support ratio of aluminum industry in China changed gradually from fully self-support to depencdent on the imports of raw materials. Alumina production was completely on self-support in 1990 and 1995 and close to 50% by 2011. With the rapid increase of alumina production, produced bauxite appears more and more shortage. During the past 20 years, resources self-support ratio of alumina production reduced and depended on imported bauxite to a certain extent. The self-support ratio of primary aluminum production has increased since 2005 and reached 95.58% in 2011. In addition, the resource self-support ratio of the whole aluminum industry was relatively stable and basically remained unchanged since 2005.
Self-produced auminum scrap use ratio presented downtrend basically. Aluminum products consumption 15–16 years ago is much smaller compared with now, so the proportion of old scrap reclaimed and recoveried in the aluminum production is even much small, the scrap use ratio declined gradually on the overall trend.
Since 1995 the imported aluminum scrap use ratio was greater than self-produced aluminum scrap use ratio, which is closely related to China has imported a lot of aluminum scrap in recent years. Due to the imported aluminum scrap use ratio is relatively stable, which compensate the decline of self-produced aluminum scrap use ratio to some extent, so the total aluminum scrap ratio fluctuated, but the change is not large.
Supported by the National Natural Science Foundation of China (71373003) and the Fundamental Research Funds for the Central Universities (N140204007)
References
[1] China aluminum web. 2012 Chinese bauxite. http://news.cnal.com/industry/2013/01-14/1358146181314537.shtml, 2013-01-14.Suche in Google Scholar
[2] Melo M T. Statistical analysis of metal scrap generation: The case of aluminum in Germany. Resources, Conservation and Recycling, 1999, 26(2): 91–113.10.1016/S0921-3449(98)00077-9Suche in Google Scholar
[3] Martchek K J. Modelling more sustainable aluminium. International Journal of Life Cycle Assessment, 2006, 11(1): 34–37.10.1065/lca2006.01.231Suche in Google Scholar
[4] Hatayama H, Yamada H, Daigo I, et al. Dynamic substance flow analysis of aluminum and its alloying elements. Nippon Kinzoku Gakkaishi/Journal of the Japan Institute of Metals, 2006, 70(12): 975–980.10.2320/matertrans.MRA2007102Suche in Google Scholar
[5] Plunkert P A. Aluminum Recycling in the United States in 2000. http://pubs.usgs.gov/circ/c1196w/c1196w.pdf, 2009-08-10.Suche in Google Scholar
[6] Liu G, Müller D B. Mapping the global journey of anthropogenic aluminum: A trade-linked multilevel material flow analysis. Environ. Sci. Technol, 2013, 47(20): 11873–11881.10.1021/es4024404Suche in Google Scholar
[7] Dahlström K, Ekins P. Combining economic and environmental dimensions: Value chain analysis of UK aluminium flows. Resources, Conservation and Recycling, 2007, 51(3): 541–560.10.1016/j.resconrec.2006.09.010Suche in Google Scholar
[8] Liu G, Müller D B. Addressing sustainability in the aluminum industry: A crttical review of life cycle assessments. Journal of Cleaner Production, 2012, 35: 108–117.10.1016/j.jclepro.2012.05.030Suche in Google Scholar
[9] Chen W Q, Shi L, Qian Y. Aluminium substance flow analysis for Mainland China in 2005. Resource Science, 2008, 30(9): 1320–1326.Suche in Google Scholar
[10] Yue Q, Wang H M, Lu Z W, et al. Analysis of anthropogenic aluminum cycle in China. Transactions of Nonferrous Metals Society of China, 2014, 24(4): 1134–1144.10.1016/S1003-6326(14)63172-1Suche in Google Scholar
[11] Chen W Q, Shi L, Qian Y. Substance flow analysis of aluminium in mainland China for 2001, 2004 and 2007: Exploring its initial sources, eventual sinks and the pathways linking them. Resources, Conservation and Recycling, 2010, 54(9): 557–570.10.1016/j.resconrec.2009.10.013Suche in Google Scholar
[12] Yue Q, Lu Z W. Analysis on quantities of in-use aluminum stocks in China. Journal of Northeastern University, 2011, 32(7): 944–947.Suche in Google Scholar
[13] Brunner P H, Rechberger H. Practical handbook of material flow analysis. Lewis Publishers, Boca Raton, 2004.10.1201/9780203507209Suche in Google Scholar
[14] Lu Z W. The following-observing method for substance flow analysis. Engineering Science, 2006, 8(1): 18–25.Suche in Google Scholar
[15] Editorial Board of China Nonferrous Metals Industry Yearbook. China nonferrous metals industry yearbook. China General Print Company, Beijing, 1991–2012.Suche in Google Scholar
[16] Xiong H, Guan H Q, Chen Q. Analysis on the import of aluminum scrap in China (II). Non-ferrous Metals Recycling and Utilization, 2005(10): 19–21.Suche in Google Scholar
© 2016 Walter de Gruyter GmbH, Berlin/Boston
Artikel in diesem Heft
- Capability Oriented Combat System of Systems Networked Modeling and Analyzing
- Development and Evolution of Aluminum Industry in China Based on Aluminum Flow Analysis
- A Study on the Rapid Parameter Estimation and the Grey Prediction in Richards Model
- Does Medical Insurance Improve Household Consumption in China? — A Re-analysis Based on Meta Regression Analysis
- The Optimal Strategy of Reinsurance-Investment Problem for an Insurer with Dynamic Income Under Stochastic Interest Rate
- Group Consensus of Second-Order Dynamic Multi-Agent Systems with Time-Varying Communication Delays and Directed Networks
- A Generalized Constant Elasticity of Substitution Production Function Model and Its Application
- Fuzzy Integral Multiple Criteria Decision Making Method Based on Fuzzy Preference Relation on Alternatives