Characterization of amniotic fluid of Dohne Merino ewes (Ovis aries) and its possible role in neonatal recognition
-
 ,
,

Abstract
Amniotic fluid (AF) was investigated as a possible source of the neonatal recognition cue that plays a crucial role in ewe–lamb bonding in sheep. A total of 70 of the 133 volatile organic compounds (VOCs), previously identified in the cranial wool of neonatal Dohne Merino lambs, was also identified in AF collected individually from neonatal twins. As in the case of the wool of neonatal lambs, the VOC profiles (GC-MS) of the AF of twins were remarkably similar. However, the VOC profiles of the AF differed from that of the wool VOCs of the same lambs. The VOCs that best represent the total variance in the AF and wool of neonatal lambs were not identified as ligands of the AF proteins. These observations suggest that it is unlikely that the neonatal recognition cue of sheep could be a maternal label derived from the AF in which a lamb is born, and that the neonatal recognition cue is probably produced by the lamb. Taking cognizance of the temporal changes that take place in the quantitative composition of the cranial wool VOCs, we hypothesize that components of the neonatal recognition cue are already produced by the lamb well before its birth and that the quantitative composition in which these volatiles are released into the AF does not correspond to the composition of the recognition cue of the lamb at its birth. When grooming the newborn lamb, its mother removes AF containing incorrect chemical information from her lamb’s body and this affords her enough time to learn its personal recognition cue.
1 Introduction
Sheep are seasonal breeders, and large proportions of ewes give birth during a relatively short lambing season. Recognition of a lamb is, therefore, crucial for the mother to provide nourishment selectively to her own offspring. When ewes are not in parturition, the odor of neonatal lambs plays an inhibitory role in maternal responsiveness [1]. However, for a few hours after parturition ewes become extremely attracted to birth fluids. Parturient ewes prefer eating food contaminated with amniotic fluid (AF) to non-contaminated food [2, 3] and ewes are more attracted to a model lamb smeared with amniotic fluid than to one not subjected to this treatment [4]. Lévy and Poindron [5] treated rejected lambs with AF, which led to an increase in the rate of acceptance of the lambs. The attraction to AF results in the ewe licking and grooming her lamb, low-pitched bleating and the acceptance of the lamb at the udder. These behaviors are directed toward the formation of the exclusive olfactory attachment between the ewe and lamb and rely on the ewe’s ability to memorize the individual olfactory cues from her offspring [6]. The bond between ewe and lamb is established through contact with the newborn lamb within 4–6 h after birth. If this fails to happen, maternal interest wanes and the ewe will not accept the lamb. Once the bond has been formed, ewe and lamb can be separated for relatively long periods without disrupting the integrity of the bond [3]. The importance of ewe multiple rearing ability in lamb survival has been highlighted in a review by Brien et al. [7] in which six ewe and lamb behaviors are pointed out as conducive to lamb survival. Although not specifically discussed in that article, ewe–lamb bonding is the underlying factor in most of these behaviors, in which neonatal recognition is the key element. Exploring the possibility that the neonatal recognition pheromone originates from the wool of the lamb, Burger et al. [8] have identified 133 VOCs associated with the wool of Dohne Merino lambs that presumably include the constituents of a putative neonatal recognition pheromone in sheep. Quantitative analysis and comparison of the odor profiles of twins revealed that the wool volatiles of twins are qualitatively and quantitatively practically identical but differ from those of other twins or non-twin lambs in the flock. Thus far, it has not been possible to confirm that these compounds are constituents of a kin-recognition odor signature in sheep by carrying out bioassays using synthetic mixtures emulating the composition of the lambs’ wool VOCs [8]. The failure of these bioassays will have to be reconsidered in the light of the recent discovery that the neonatal recognition cue of sheep undergoes temporal changes for at least the first 100 days of the lambs’ lives [9], information that implies that the analysis of the experimental lambs’ wool VOCs, the formulation of corresponding test mixtures and the bioassays should have been carried out well within the first 3 days after the cranial wool had been harvested.
Sheep farmers often smear the newborn lamb with the ewe’s AF in attempting to strengthen or restore the bond with a rejected lamb and general consensus seems to be that the ewe’s own AF has to be used to be effective. However, Alexander and Shillito [10], Terrazas et al. [11], Alexander and Stevens [12], Lindsay [3], and Lynch et al. [13] have presented irrefutable evidence showing that the discrimination of ewes between their own and alien lambs is mediated primarily by an olfactory cue from the lamb’s wool and skin, not from a specific area on the lamb’s body nor from the AF. It is known that that pheromone-binding proteins (PBPs) assist in the transport of volatile pheromones in mammals (e.g. Beynon and Hurst [14]) and insects [15, 16] and that proteins from the preorbital secretion of the klipspringer, Oreotragus oreotragus, have specific affinity for the semiochemicals secreted by this animal [17]. Thus, despite the strong evidence to the contrary as mentioned, we investigated the possibility that proteins from the AF could, nevertheless, in some way be involved in neonatal recognition in sheep, for example, in the dissemination of the neonatal recognition cue.
Attempting to find a plausible explanation for the apparent contradiction between the extraordinary interest of parturient ewes in AF and the results of our previous research on this topic as mentioned, qualitative and quantitative analyses were carried out on the AF collected from the bodies of the same Dohne Merino twins (Ovis aries) from which cranial wool was harvested for the identification of the wool VOCs of neonatal lambs. Here, we report the comprehensive characterization of the AF collected from the bodies of newborn lambs, as well as the results of a comparison of the VOCs extracted from neonatal wool and AF.
2 Materials and methods
2.1 Sample collection
A flock of 165 twin-bearing Dohne Merino ewes was available for the collection of samples at Stellenbosch University’s experimental farm at Mariendahl, South Africa. AF samples were collected during the lambing season of 2007 individually in the field from the dizygotic twins born from a sample group of 16 of these ewes (9.69%). The ewes, in groups containing one to five ewes, were mated with five different rams. These samples were used for the chemical characterization of VOCs present in the AF and for protein analyses. During the lambing season of 2007, AF and wool samples were collected from the same lambs. These samples were used to compare the wool VOC profiles with the AF VOC profiles of each of the lambs. AF samples (ca. 30 mL) were scraped off the bodies of the newborn lambs with a stainless steel spoon immediately after the ewes had given birth and were stored in glass bottles with Teflon-lined screw caps. The samples were kept on ice in the field and then stored at –20 °C in the laboratory until analyzed.
The procedures followed in our research were approved by the Stellenbosch University Ethics Committee: Animal Care and Use (Ethics number 11NC_BU01).
2.2 Analytical procedures
Syringes and other glassware were cleaned as described by Burger et al. [8]. The stainless steel spoon and tweezers used for the collection of AF samples from lambs were washed with 70% ethanol (Merck, Darmstadt, Germany) and dried prior to use. Dichloromethane (DCM) (Romil, Super Purity, Cambridge, UK or Pestanal Grade, Riedel de-Haën, Seelze, Germany) and tert-butyl methyl ether (TBME) (Sigma-Aldrich, anhydrous, 99.8%, St Louis, MO, USA) were used for the extraction of volatile organic material from AF and wool samples.
Gas chromatographic (GC), gas chromatographic-low resolution mass spectrometric (GC-LRMS), gas chromatographic-high resolution mass spectrometric (GC-HRMS), and enantioselective GC-MS analyses, as well as retention time index (RI) determinations of the volatile organic constituents of the AF samples were carried out as described by Burger et al. [8].
2.2.1 Headspace sampling of AF VOCs:
A second generation sample enrichment probe (SEP) [18] was used to enrich the VOCs from the AF samples for GC and GC-MS analyses. A fresh and clear sample of AF (20 mL) was placed in a 50-mL glass bottle with a stainless steel insert that had the same thread as the injector cap of the GC. The AF was stirred at 40 °C with a glass-encapsulated magnetic stir bar. A SEP50 (stalk 130×0.70 mm) carrying a 50-mm sleeve of polydimethylsiloxane (PDMS) tubing (47 mg) near its lower tip, was used to enrich the VOCs from the headspace gas of the AF for 4 h. The volatile compounds retained in the PDMS were desorbed at 220 °C in the injector of the GC-MS instrument, and the SEP was left in the injector until completion of the analysis [19].
2.2.2 Solvent extraction of VOCs from AF samples:
DCM and TBME were tested for the extraction of VOCs from the collected AF samples. TBME was found to be the more effective solvent, and the VOCs were extracted from the AF samples (5 mL) with small volumes (1 mL) of this solvent. On extracting the VOCs from the AF with these solvents, a gel was formed. Separation of the phases was facilitated by centrifuging the emulsion for 1 min at 1200 g, freezing the AF at –20 °C and pouring off the supernatant solvent layer into a 2-mL vial. The extracts were concentrated to ca. 10 μL [20], and aliquots (1 μL) of the extracts were subjected to GC-MS analysis using split and septum purge flows of 10 and 1 mL/min, respectively, as described by Burger et al. [8]. Synthetic analogs of all the compounds identified in this study were used as external reference standards in qualitative analyses and methyl hexanoate (14.8 μg/mL) as internal standard in quantitative analyses of the AF volatiles.
2.2.3 Solvent extraction of VOCs from cranial wool:
For quantitative comparison of the VOC content of the AF and wool of the same lambs, VOCs were extracted from cranial wool samples by a method adapted from Burger et al. [8]. Samples of cranial wool of 7-day-old lambs were sonicated for 5 min at 22 °C in Reacti-Vials (Pierce Chemical Co., Rockford, IL, USA) with enough TBME to cover the wool (ca. 150 μg). The wool and extracts were transferred to Reacti-Vials with custom-made glass filter inserts, and the extracts were filtered off by centrifuging at 540 g for 1 min. The extracts were concentrated and analyzed as previously described.
2.2.4 Determination of double bond positions of unsaturated VOCs:
The positions of the double bond(s) in the unsaturated VOCs of the AF were determined by dimethyl disulfide (DMDS) derivatization and GC-MS analysis of the resulting adducts, according to an adapted version [8] of the method of Vincenti et al. [21].
2.2.5 Determination of absolute configuration of chiral compounds:
The absolute configuration of the chiral VOCs present in the AF samples was determined by enantioselective GC-MS [8]. Information on the enantioselective gas chromatographic behavior of several of the chiral compounds identified in this study has previously been provided by Maas et al. [22] and Burger et al. [23].
2.2.6 Protein separation:
The protein content of the AF collected from three twins (n=6) was estimated according to Bradford [24], using bovine serum albumin as standard. By adding an equal volume of 20% (w/v) trichloroacetic acid (TCA) to the protein sample and incubating the mixture on ice for 30 min, followed by centrifugation at 16,000 g for 15 min at 4 °C, the proteins were concentrated by precipitation. The supernatant was removed and cold acetone (300 μL) was added. The sample was centrifuged at 16,000 g for 15 min at 4 °C. The supernatant was removed and the protein pellet dried at room temperature.
The proteins associated with the cranial wool of two single-born lambs and two pairs of twins (n=6), all of the same age, were identified. To remove the wool-associated proteins from the wool without denaturing the wool keratin proteins, wool of each lamb (2.5 g) was placed in a 150-mL Erlenmeyer flask and 0.5% (w/v) sodium dodecyl sulfate (SDS) in 50 mL of 0.1 M sodium phosphate buffer (pH 6) was added and the mixture shaken for 2.5 h at 30 °C. The mixture was then placed in a 100-mL syringe, the aqueous phase separated from the wool and then centrifuged at 5000 g for 10 min. The aqueous phase was decanted from the dirt-containing pellet and an equal volume of 20% TCA was added to the aqueous phase. The mixture was stored overnight at –20 °C. The aqueous phase was centrifuged at 10,500 g for 10 min, and the protein pellet resuspended in 2.5 mL of 15 mM phosphate buffer (pH 6) and placed in a 15-cm long, high-retention, seamless, cellulose dialysis tubing (flat width 32 mm × length 20 mm, MW 06205, D0530-100FT, Sigma-Aldrich) in a 10-L glass beaker and dialyzed against 15 mM sodium phosphate buffer (pH 6) for 24 h at 4 °C to remove SDS and other contaminants. The proteins were concentrated, precipitated and dried as described for the AF proteins.
2.2.7 Protein identification:
The proteins were analyzed by denaturing PAGE (8% SDS PAGE; [25]) and stained with Coomassie blue [26]. In-gel digestion with trypsin was performed according to published methods [27]. The partially digested peptides were separated on a Waters CapLC instrument (Atlantis, FL, USA) fitted with a dC18 column (150 mm × 100 μm, bead size 3 μm). The peptide samples were loaded in 2% acetonitrile/0.2% formic acid (solvent A), and the column was eluted by using a linear gradient from 3% of solvent B (98% acetonitrile/0.2% formic acid) to 100% of solvent B over 50 min at a flow rate of 1.5 μL/min. Tandem mass spectrometric (MS/MS) data of the eluting peptides were acquired by nano-electrospray quadrupole time-of-flight MS (Waters API Q-TOF Ultima, Milford, MA, USA), scanning from m/z 400 to m/z 1995 at 0.5 s per scan with an interscan delay of 0.1 s. The resulting data were analyzed by Matrix software (http://www.matrixscience.com). Fragments were sequence-identified by database searches against publicly available mammalian databases using the Mascot search engine [28] and confirmed using the Basic Local Alignment Search Tool (BLAST) [29]. Probability-based molecular weight search (MOWSE) [28] scores were estimated by comparing searched results against an estimated random match population and were reported as –10 × log10(p), with p as the absolute probability.
2.2.8 Anion-exchange chromatography:
The protein content of samples of AF was estimated according to Bradford [24], using serum albumin as standard. Each protein sample (1 mg) was desalted and buffer-exchanged on a PD-10 column (Sephadex G-25 medium, GE Healthcare, Uppsala, Sweden) previously equilibrated with 25 mL of 20 mM Tris-HCl buffer (pH 8.8) containing 5 mM DTT and 1 mM ethylenediaminetetraacetic acid). A 5-mL HiTrap Q strong anion exchange column (GE Healthcare) was used for the separation. The column was equilibrated with several column volumes of binding buffer. A linear salt gradient (0–1 M NaCl in binding buffer) was used to elute the bound protein from the column and fractions of 1 mL were collected and pooled. The pooled fractions were loaded on a 10% SDS-PAGE gel as previously described and identified by comparing their molecular masses with those of the previously identified proteins.
2.2.9 Ligand identification:
The protein-containing fractions, separated by anion exchange chromatography, were combined in glass vials and 500 μL of TBME was added to each fraction [30]. The vials were sealed and the VOCs extracted from the protein fractions by shaking the resulting suspensions overnight at 28 °C. The concentrated extracts were conventionally sampled and analyzed by GC-MS.
2.3 Statistical analysis
The peak areas from the total ion chromatograms (TICs) of the AF VOCs were normalized across all samples to produce variables with zero means and unit standard deviation [31] and were used to construct data-matrices for the VOCs extracted from AF collected from day-old lambs. Principal component analysis (PCA) biplots, permutation tests and investigations into predictivity were performed using R as described in Aldrich et al. [32] and Gardner-Lubbe et al. [33].
3 Results and discussion
3.1 Chemical characterization of the AF VOCs
The presumption that the odor profiles of dizygotic twins are qualitatively and quantitatively similar, but quantitatively different from those of other lambs in the flock [8], was employed as a working hypothesis in the current investigation aimed at the identification of constituents of AF that might play a role in neonatal recognition in sheep.
Headspace analysis using the SEP technique in conjunction with GC-MS analysis was considered as a possible method for the determination of the VOCs presumably present in the AF samples. However, because of the high viscosity of the AF, which precluded effective stirring of the AF, the unfavorable partition between the large volume of the AF sample and the small volume of PDMS of the SEP’s sleeve, only a few volatile compounds were detected in the resulting total ion chromatogram (TIC). Diluting the AF sample to 50% with water did not produce appreciably better results. Conventional solvent extraction with TBME was therefore adopted for the investigation of the chemical composition of the volatile fraction of the collected AF samples, although given the high viscosity of AF, solvent extraction was not expected to produce highly reproducible quantitative data. The concentrated extracts were subjected to GC-MS analysis. A typical TIC of a TBME extract of an AF sample is shown in Figure 1.
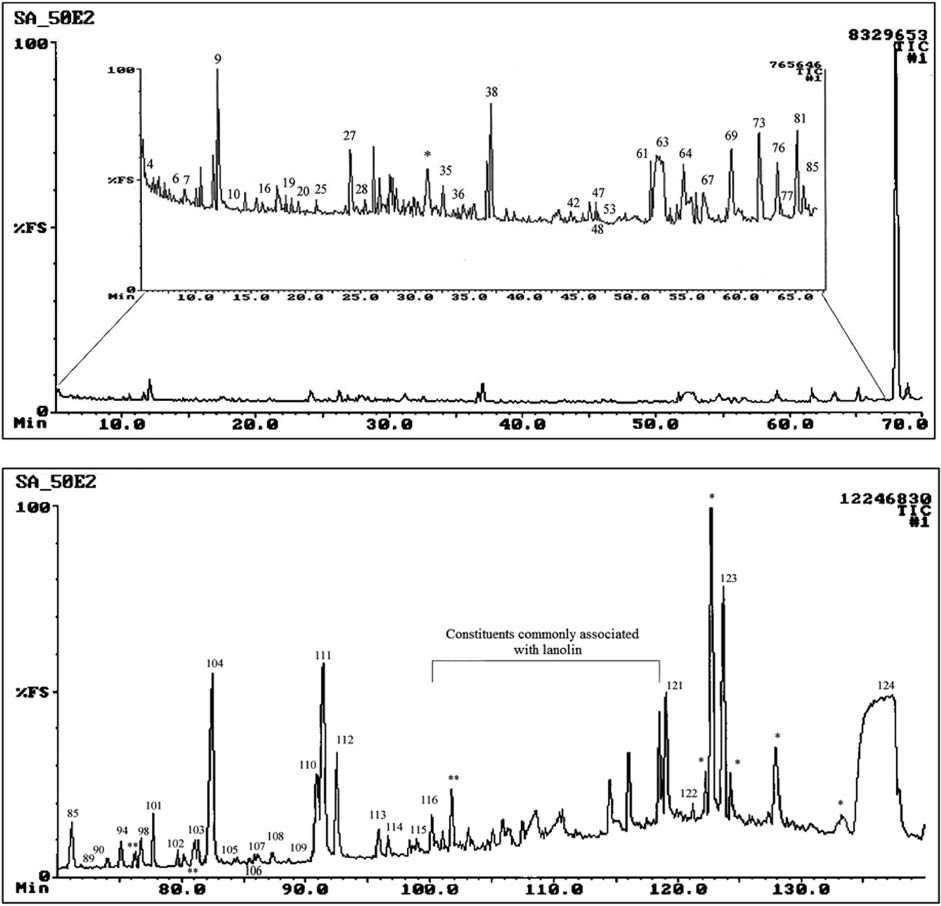
Total ion chromatogram of a tert-butyl methyl ether extract of amniotic fluid collected from the body of lamb US-2007-0050.
*Contaminants.
The TBME extracts of the AF samples contained low concentrations of about 50% of the VOCs previously identified in lamb’s wool. Saturated and unsaturated alkanes, branched and unbranched primary alcohols, branched and unbranched aldehydes, branched and unbranched methyl ketones, an ethyl ketone, branched and unbranched saturated carboxylic acids, unsaturated carboxylic acids, benzoic acid, isopropyl tetradecanoate, γ-lactones (butanolides), terpenoids, dimethyl sulfone, pyrrolidine-2,5-diones and steroids in low concentrations were unambiguously identified in the extracts by GC-LRMS and GC-HRMS analyses, by determination of Kovats retention indices (RI) [34], and by GC-MS comparison of the VOCs with authentic synthetic analogs (Table 1). These compounds have molecular masses from 60.05 to 410.39 Da and boiling points ranging from 119 °C to 360 °C. Some compounds identified in this study have previously been identified in lanolin [36–39].
Volatile organic compounds identified in tert-butyl methyl ether extracts of the amniotic fluid collected from the bodies of neonatal Dohne Merino twins.
| Compound numbera | Compound | Column | Remarks | Compound number | Compound | Column | Remarksb | ||
|---|---|---|---|---|---|---|---|---|---|
| Apolar | Polar | Apolar | Polar | ||||||
| C10 | Nonane | √ | a,c,d,l | P9 | Octanoic acid | √ | a,c,d,k | ||
| C20 | Decane | √ | a,b,c,d,l | C42 | Nonanoic acid | √ | √ | a,b,c,d,k | |
| C28 | Undecane | √ | a,b,c,d | C53 | Decanoic acid | √ | √ | a,b,c,d,k | |
| C36 | Dodecane | √ | √ | a,b,c,d | C69 | Dodecanoic acid | √ | √ | a,b,c,d,k |
| C58 | Tetradecane | √ | √ | a,b,c,d,k | C85 | Tetradecanoic acid | √ | √ | a,b,c,d,k |
| C80 | Heptadecane | √ | a,b,c,d,k | C94 | Pentadecanoic acid | √ | √ | a,b,c,d,k | |
| C89 | Octadecane | √ | a,b,c,d,k | C104 | Hexadecanoic acid | √ | √ | a,b,c,d,k | |
| C118 | 1-Pentacosene | √ | a,b,c,e | C107 | Heptadecanoic acid | √ | a,b,c,d,k | ||
| C120 | 1-Hexacosene | √ | a,b,c,e | C112 | Octadecanoic acid | √ | √ | a,b,c,d,k | |
| C25 | 1-Octanol | √ | √ | a,c,d,k | C115 | Eicosanoic acid | √ | √ | a,b,c,d,k |
| C108 | 1-Octadecanol | √ | a,c,d,k,m | M117 | Heneicosanoic acid | √ | a,b,c,d,k | ||
| C114 | 1-Eicosanol | √ | a,c,d,k | M119 | Docosanoic acid | √ | a,b,c,d,k | ||
| C116 | 1-Heneicosanol | √ | a,c,e,k | C82 | 12-Methyl tridecanoic acid | √ | a,b,c,d,e,k | ||
| C6 | 4-Methyl-1-pentanol | √ | √ | a,c,d | C102 | 14-Methyl pentadecanoic acid | √ | √ | a,b,c,d,e,k |
| C4 | Hexanal | √ | a,c,d,l | C106 | 15-Methyl hexadecanoic acid | √ | a,b,c,d,e,k | ||
| C8 | Heptanal | √ | √ | a,b,c,d,l | C113 | 17-Methyl octadecanoic acid | √ | a,b,c,d,e,k | |
| C19 | Octanal | √ | √ | a,b,c,d | C103 | (Z)-9-Hexadecenoic acid | √ | √ | a,b,c,d,f |
| C27 | Nonanal | √ | √ | a,b,c,d | C110 | (Z,Z)-9,12-Octadecadienoic acid | √ | √ | a,b,c,d |
| C35 | Decanal | √ | √ | a,b,c,d | C111 | (Z)-9-Octadecenoic acid | √ | √ | a,b,c,d,f |
| C45 | Undecanal | √ | a,c,d | C92 | Isopropyl tetradecanoate | √ | a,b,c,d,e | ||
| C57 | Dodecanal | √ | √ | a,b,c,d | C48 | Nonan-4-olide | √ | √ | a,b,c,d,g |
| C67 | Tridecanal | √ | √ | a,b,c,d | C61 | Decan-4-olide | √ | a,b,c,d,g | |
| C73 | Tetradecanal | √ | √ | a,c,d,o | C76 | Dodecan-4-olide | √ | a,b,c,d,g | |
| C81 | Pentadecanal | √ | √ | a,b,c,d,o | C109 | Hexadecan-4-olide | √ | a,b,c,d,g | |
| C90 | Hexadecanal | √ | a,b,c,d,o | C93 | 6,10,14-Trimethyl-2-pentadecanone | √ | √ | a,b,c,d,h | |
| C101 | Heptadecanal | √ | a,c,d,o | C122 | Squalene | √ | √ | a,b,c,d,j | |
| C105 | Octadecanal | √ | a,c,d | C9 | Dimethyl sulphone | √ | √ | a,b,c,d | |
| C77 | 13-Methyltetradecanal | √ | a,c,d,e,o | C32 | Benzoic acid | √ | √ | a,c,d | |
| C97 | 15-Methylhexadecanal | √ | a,c,d,e,o | C124 | Cholest-5-en-3β-ol | √ | a,b,c,d,k | ||
| C79 | 2-Pentadecanone | √ | √ | a,b,c,d,o | C38 | 3-Ethyl-4-methylpyrrolidine- 2,5-dione | √ | √ | a,b,i,g |
| C14 | 6-Methyl-2-heptanone | √ | √ | a,b,c,d,l | C39 | 3-Methyl-4-vinyl-1H-pyrrole- 2,5-dione | √ | √ | a,b,c,i |
| C47 | 3-Methyl-2-undecanone | √ | a,c,d,e,g | C59 | Unidentified | √ | |||
| C16 | 3-Octanone | √ | a,b,c,d | C63 | Unidentified | √ | √ | ||
| P3 | Acetic acid | √ | a,c,d | C121 | Unidentified | √ | |||
| P6 | Butanoic acid | √ | a,c,d | C123 | Unidentified | √ | |||
aCompounds C1–C124 are numbered in order of their elution from a glass capillary column coated with PS-089-OH (DB-5 equivalent) as in Figure 1, additional compounds P3, P6 and P9 were identified using a column coated with polar free fatty acid phase, and compounds M117 and M119 were identified using a column coated with OV-1701 of medium polarity. bReliability of identification is indicated by the following: a, low-resolution electron impact mass spectrum; b, high-resolution electron impact mass spectrum; c, library spectrum (National Bureau of Standards [NBS] and/or National Institute of Standards and Technology [NIST]); d, retention time comparison with synthetic compound; e, Kovats retention index; f, double bond localization by dimethyl disulfide derivatization and GC-MS analysis; g, absolute configuration given in Burger et al. [8]; h, absolute configuration not determined; i, tentative identification; j, compounds previously identified in amniotic fluid [35]; k, compounds previously identified in lanolin [36–39]; l, compounds previously identified in wool [40]; m, compounds previously identified in inguinal gland of ewes [35]; n, compounds synthesized in this investigation; o, compounds identified as ligands associated with protein fractions.
Except for an unidentified steroid (C121), all of the 70 VOCs detected in the AF samples were also present in cranial wool of neonatal lambs [8, 9]. Of the 133 wool VOCs, 63 were not detected in the AF samples. This could possibly be attributed to the inherent difference in sensitivity between the SEP enrichment technique employed for the extraction of VOCs from lamb’s wool in the previous investigations and the much less efficient solvent extraction followed by evaporation of the solvent from the extracts, which was used in the present study. In this regard, the loss of volatile molecules from the extract when it is concentrated for GC-MS has also to be taken into consideration [41]. Of the 70 VOCs identified in the AF extracts, 33 were observed only when using an apolar column, and 3 only when using a polar AT-1000 column (an equivalent of free fatty acid phase, or FFAP), probably because of the difference in selectivity of these columns. Information on the VOCs identified in the AF is collated in Table 1.
3.2 Quantitative composition of AF VOCs
The quantitative composition of VOCs present in AF of twin lambs and in that of randomly selected lambs were compared to evaluate the intra-twin similarities and the inter-twin differences in the experimental flock of lambs. The 70 compounds identified in this study were all present in at least 10% of the samples collected during 2007. The number and varying concentrations of these compounds are consistent with the constraints on the design of chemical communication systems used in kin recognition, which, according to Alberts [42], requires a wide variety of compounds present in different concentrations. Approximately 78% of the total average peak area of the VOCs present in the AF samples consisted of only six compounds: cholest-5-en-3β-ol (44%), hexadecanoic acid (12%), 9-octadecenoic acid (10%), two unidentified steroids (5% and 4%) and octadecanoic acid (3%). Of these constituents, only hexadecanoic acid had also been identified as a major neonatal wool VOC [8]. Hexadecanoic acid and octadecanoic acid have previously been identified in lanolin [36, 39] and are almost omnipresent in mammalian tissue and glandular secretions. The total ion chromatograms (TIC profiles) of the extracts of the AF samples collected from the bodies of twin lambs are quite similar but remarkably different from those of other twins, as is illustrated in Figure 2A and B.
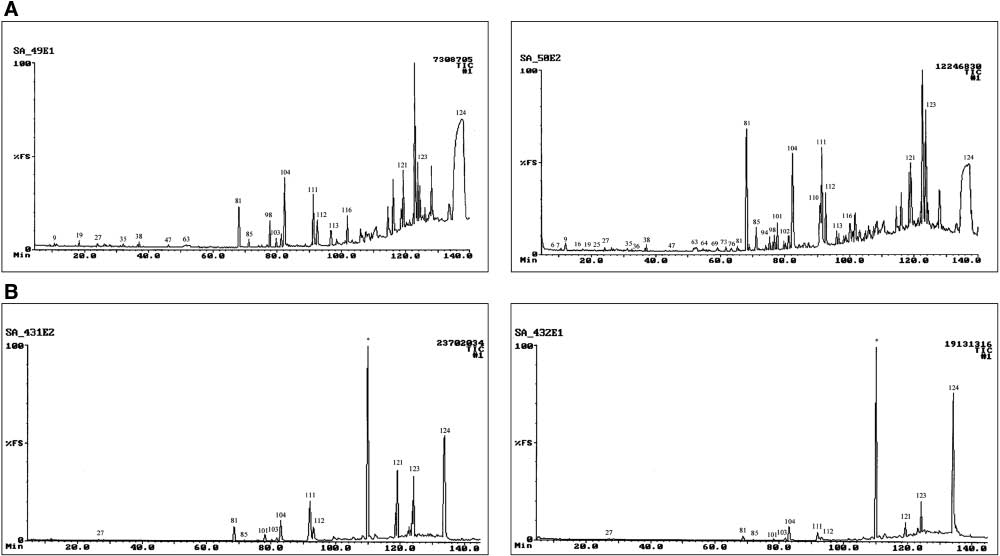
Total ion chromatograms of the tert-butyl methyl ether extracts of amniotic fluid collected from the bodies of two pairs of twin lambs (A) US-2007-0049 (left) and US-2007-0050 (right); (B) US-2007-0431 (left) and US-2007-0432 (right).
Of the 70 constituents identified as AF volatiles, only those present in 20% or more of the samples were considered as variables for statistical analysis, reducing the number of constituents analyzed to 48. The chromatographic data used for multivariate analyses were characterized by a large number of variables, in this case the peak areas of the identified constituents (n≤48), compared to the number of sample units, and the number of AF extracts (n=32). A permutation test of the analytical data calculated a p-value <0.027, indicating that the pairing of twin lambs, according to the qualitative and quantitative composition of the AF VOCs, did not occur by chance and was significant. The p-value is higher than that obtained for the wool VOCs of twin lambs (p<0.001) [8] but is nevertheless statistically significant.
The PCA biplots depicted in Figure 3A and B provide optimal two-dimensional presentations of the data matrix. Biplots can be considered as multivariate scatterplots that simultaneously give a graphical presentation of samples (lambs as points on the graph) and variables (identified constituents as linear axes on the graph). The significance of an axis of a biplot is similar to that of an ordinary scatterplot; if a line is drawn from any point in a biplot perpendicular to a biplot axis, the value of the variable at that point can be read off from the axis. In addition to this usage of biplot axes, the angle between any two axes is an approximation of the correlation between the two relevant variables. Constituents lying on axes close to each other have a high level of correlation with each other and constituents displayed as axes that are 90 degrees in relation to one another have no correlation with one another. An axis is labeled at the positive value of its calibration. The quality of a biplot is an overall measure of the accuracy of the two-dimensional approximation of the data matrix and hence also of the reliability of the analytical data.
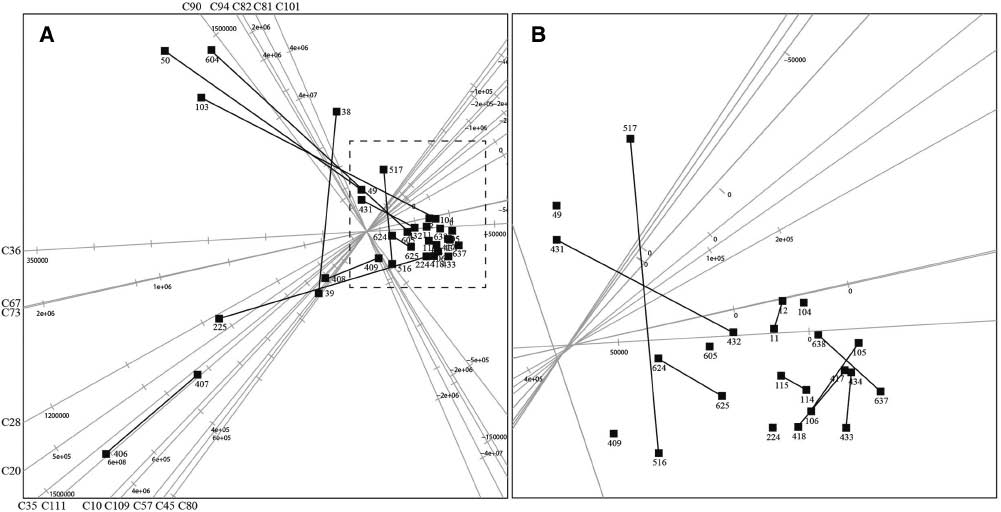
Principal component analysis (PCA) biplot of the amniotic fluid (AF) dataset displaying only the 17 axes that best represent the variation in the AF composition.
In (A) all 32 lambs are shown, whereas (B) provides an enlarged display of the demarcated crowded square area in (A). The two members of each pair of twins are connected with a line.
Not all 32 samples and 48 variables evaluated in the present study are equally well represented in the biplots, as measured by the sample and axis predictivities, respectively [33]. The quality of a biplot is an overall measure of the accuracy of the two-dimensional approximation of the data matrix and hence also of the reliability of presenting the analytical data in a two-dimensional plot. Furthermore, sample and axis predictivities provide detailed information about how accurately each datum point is represented in the biplot and the degree of accuracy in the predictions made from the biplot axes. Predictivity values range from 0 to 1, the latter figure representing the highest predictivity. The quality of display for the PCA biplot in Figure 3A and B is 48.1%. The 17 constituents that best represent the total variance in the AF VOC dataset with predictivities of higher than 0.6, in order of decreasing predictivity, are dodecane (C36), heptadecane (C80), pentadecanoic acid (94), 12-methyltridecanoic acid (C82), decanal (C35), hexadecan-4-olide (C109), hexadecanal (C90), pentadecanal (C81), undecane (C28), nonane (C10), undecanal (C45), tridecanal (C67), (Z)-9-octadecenoic acid (C111), tetradecanal (C73), heptadecanal (C101), decane (20) and dodecanal (57). In Figure 3A, only the 17 axes that best represent the predictivity in the AF are displayed. Each black square represents an AF sample collected from the body of a newborn lamb and extracted with TBME. The last two or three digits of the lambs’ numbers are given on the biplot, and twin lambs were numbered consecutively. The connecting black lines in the biplot in Figure 3A and B indicate the positions of the 16 experimental twins.
Constituents C81, C82, C90, C94 and C101 are a highly correlated group of variables in the biplot depicted in Figure 3A and B. The majority of the lambs are concentrated in the encircled area in Figure 3B, indicating that all of the AF samples have similar qualitative and quantitative compositions.
3.3 Comparison of the VOC content of wool and AF of twins
The AF samples used in the present study were collected after birth from the lambs from which cranial wool was collected a few hours later for the previously reported investigation into the composition of the wool VOCs of Dohne Merino twins. About 50% of the compounds identified in the cranial wool of neonatal lambs were also detected in the AF.
The efficiency of the SEP technique that was used for the extraction of the wool VOCs depends on the volatility of the VOCs and their dissolution in the apolar PDMS sleeve of the SEP, whereas the extraction of the VOCs from AF is governed by the relative solubility of the VOCs in the medium-polar solvent TBME and the aqueous AF, i.e. on the distribution ratio of the VOCs between the AF and TBME. Because these quite different sample preparation techniques were used to extract the VOCs from both the wool and AF samples, the detection of a larger number of VOCs in the cranial wool than in the AF of the same lamb cannot be construed as evidence in favor of the neonatal recognition cue being produced by the lamb. However, it can be argued that the extraction of the wool VOCs with TBME gave quantitative data accurately reflecting the relative quantitative ratios in which the VOCs were present in the different wool samples. Although TBME extraction was also used to extract VOCs from AF, the resulting data have to be considered with great circumspection. Short-chain carboxylic acids and alcohols are capable of forming strong hydrogen bonds and are not extracted equally effectively from aqueous matrices with medium-polar solvents as these homologues have widely differing distribution constants in the extraction of these compounds from aqueous matrices. The results obtained by TBME extraction of the AF samples thus were not expected to accurately reflect the ratio in which these VOCs were present in the AF samples. The same argument applies, to a somewhat lesser extent, to the extraction of short-chain aldehydes and ketones from AF. Conversely, the distribution constants of the medium- to long-chain apolar and medium-polar compounds, and specifically the alkanes, aldehydes and ketones, are practically identical as far as their extraction from aqueous media is concerned. The relative ratio in which neighboring homologous VOCs – for example tetradecanal and pentadecanal – are extracted from AF is therefore a credible reflection of the ratio in which they are present in the AF samples. The same argument applies to the other aldehydes and compound classes that showed high predictivities in statistical analyses of the quantitative data. The data shown in Table 2 provide reliable evidence that the VOC composition of the AF differs considerably from that of the cranial wool of lamb US-2007-0431.
Comparison of the quantitative ratios in which selected compound classes are extracted with tert-butyl methyl ether from cranial wool and from amniotic fluid of lamb US-2007-0431.a
| Compound number | Compound | Wool extract | Amniotic fluid extract |
|---|---|---|---|
| C11 | Nonane | 6.19 | 6.20 |
| C19 | 2-Octanone | 3.50 | 0.00 |
| C21 | Octanal | 25.09 | 9.61 |
| C22 | Decane | 5.59 | 24.02 |
| C30 | 2-Nonanone | 0.87 | 0.00 |
| C32 | Nonanal | 100.00 | 100.00 |
| C33 | Undecane | 8.77 | 42.87 |
| C40 | 2-Decanone | 2.15 | 0.00 |
| C41 | Decanal | 13.13 | 18.80 |
| C42 | Dodecane | 6.81 | 8.44 |
| C51 | 2-Undecanone | 2.92 | 0.00 |
| C53 | Undecanal | 14.31 | 0.00 |
| C54 | Tridecane | 10.40 | 0.00 |
| C61 | 2-Dodecanone | 1.94 | 0.00 |
| C64 | Dodecanal | 14.15 | 0.00 |
| C65 | Tetradecane | 13.04 | 3.46 |
| C75 | Tridecanal | 40.55 | 142.67 |
| C84 | 2-Tetradecanone | 3.94 | 0.00 |
| C85 | Hexadecane | 6.57 | 0.00 |
| C86 | Tetradecanal | 49.77 | 37.28 |
| C94 | 2-Pentadecanone | 3.42 | 0.00 |
| C95 | Heptadecane | 9.07 | 0.00 |
| C96 | Pentadecanal | 78.04 | 1833.66 |
| C105 | Octadecane | 6.20 | 12.36 |
| C106 | Hexadecanal | 27.22 | 65.22 |
| C121 | 2-Heptadecanone | 11.74 | 0.00 |
| C122 | Nonadecane | 15.10 | 0.00 |
| C123 | Heptadecanal | 24.74 | 253.61 |
aThe data are normalized with respect to nonanal=100.
From the ratio in which dodecanal and its neighboring homologs undecanal and tridecanal, for example, were extracted from the AF and wool of lamb US-2007-0431 (Table 2), it is clear that these three compounds are indeed present in totally different quantitative ratios in the cranial wool and AF of the same lamb. These aldehydes are used here as examples, because the statistical analyses showed that the aldehydes have high predictivities. The ratio in which tetradecanal and pentadecanal were extracted from AF and wool is even more convincing evidence that there are large differences in the VOC content of AF and cranial wool from the same lamb.
Visual comparison of the reconstructed TICs of the normalized peak areas of extracts of the cranial wool and AF of seven lambs, as depicted for example in Figure 4A and B, also clearly reveals large differences in the ratios in which the VOCs are present in the two matrices.
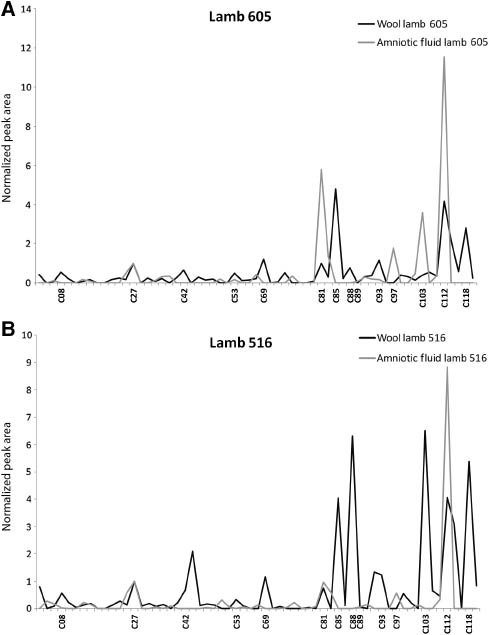
Comparison of the reconstructed total ion chromatograms of volatile organic compounds extracted from the cranial wool (black) and amniotic fluid (gray) from (A) lamb US-2007-0605 and (B) lamb US-2007-0516.
The quantitative data (n=7), were subjected to analysis-of-distance (AoD) as described in Gower et al. [43] to display the differences between the AF and wool measurements, respectively, of the lambs. The resulting 14×14 distance matrix was used as input to a principal coordinate analysis (PCO), and the construction of the associated AoD biplot depicted in Figure 5 graphically illustrates these differences. It is clear from Figure 5B that there is no overlap among heptanal, dodecanal, tetradecane, hexadecane and heptadecanone, whereas there is some overlap of hexadecanal, undecanone and pentadecanone.
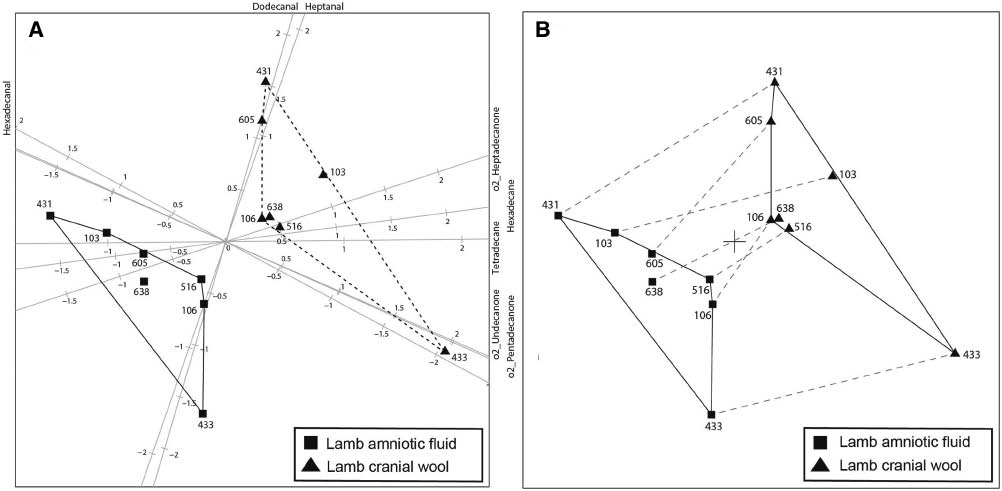
Analysis of the distance biplot constructed from the 14×14 distance matrix of the amniotic fluid and cranial wool data using Euclidean distance.
In (A) the eight axes (constituents) with predictivities larger than 60% are shown, whereas in (B) the plotting of axes (constituents) has been suppressed. Each lamb has two positions relating to its amniotic fluid analysis and its cranial wool analysis, respectively. In (B), these two positions are linked with dashed lines. Lambs are labeled using the last three digits of their US numbers. Convex hulls denoted by solid lines are constructed for the positions of the amniotic fluid and the cranial wool, respectively.
3.4 Characterization of the AF and wool-associated proteins
To investigate the possibility that residual AF proteins on a lamb’s wool could be involved in the dissemination of the neonatal recognition cue, the proteins present in the AF and on the wool of neonatal lambs were identified to establish whether these proteins are known for their ligand binding properties in mammals. This was followed by an investigation into the possible ligand binding properties of the identified proteins.
The protein concentrations of the AF and the wool extracts were determined as ca. 520 μg/mL and ca. 800 μg/g, respectively [24]. Typical SDS-PAGE gels obtained for wool- and AF-associated proteins are shown in Figure 6. The AF samples contained proteins with molecular masses ranging from 11 to 250 kDa. Five of the seven electrophoretically separable proteins selected for peptide analysis were identified. The wool sample contained proteins with molecular masses ranging from 11 to 70 kDa. Three of the nine electrophoretically separable protein bands selected for peptide analysis were identified. The results are summarized in Table 3.
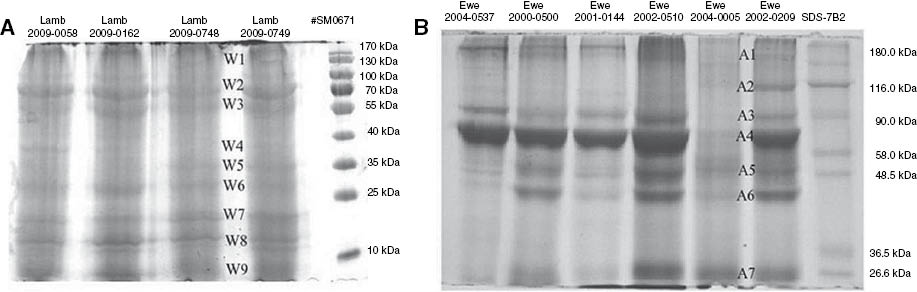
Protein separation on 8% SDS-PAGE gel (200 μg from each sample) of (A) wool-associated proteins (protein bands numbered W1–W9), and (B) amniotic fluid proteins (protein bands numbered A1–A7).
Proteins identified in the amniotic fluid and cranial wool of Dohne Merino lambs.
| Band no. | MASCOT/BLAST result | Accession number | Theoretical molecular mass, kDa | MASCOT MOWSE scorea | NCBI BLAST bit scoreb | NCBI BLAST E-valuec | Percentage coveraged |
|---|---|---|---|---|---|---|---|
| Amniotic fluid proteins | |||||||
| A1 | Fibronectin (Bos taurus) | NP_001157250 | 249.401 | 237 | 49.3 | 1e–04 | 4 (7) |
| A2 | Glycogen phosphorylase, liver form (Mus musculus) | NP_573461 | 97.238 | 54 | 46.0 | 8e–06 | 1 (1) |
| A3, A4, A5 | Serum albumin precursor (Ovis aries) | NP_001009376 | 69.143 | 355 | 51.6 | 6e–09 | 9 (5) |
| A6 | Fetuin precursor (Ovis aries) | NP_001009802 | 38.655 | 78 | 45.2 | 2e–07 | 3 (1) |
| A7 | Immunoglobulin lambda light chain constant region segment 1 (Ovis aries) | AAU45093 | 11.322 | 166 | 43.1 | 2e–06 | 32 (2) |
| Wool-associated proteins | |||||||
| W1, W2 | Serum albumin precursor (Ovis aries) | NP_001009376 | 69.143 | 394 | 64.3 | 1e–12 | 16 (8) |
| W5, W6 | Haemoglobin beta chain, foetal (Ovis aries) | P02083 | 15.921 | 329 | 63.5 | 1e–12 | 50 (5) |
| W9 | Immunoglobulin lambda chain C region (Ovis aries) | B30554 | 11.305 | 169 | 45.4 | 4e–07 | 32 (2) |
aProbability-based MOWSE score: Ions score is –10 × Log (p), where p is the probability that the observed match is a random event. Protein scores are derived from ions scores as a non-probabilistic basis for ranking protein hits. Individual ions scores indicating identity or extensive homology (p< 0.05) for each of the proteins were as follows: A1 ≥ 38; A2 ≥ 39; A3, A4, A5, and A6 ≥ 37; A7 ≥ 38; W1, W2, W5, W6 and W9 ≥ 37. bBit score rates the alignment of the peptide(s) with the protein sequence. High bit scores indicate good alignments. Bit scores are calculated to take into account the alignment of similar or identical residues and any gaps introduced to align the sequence. cE-value indicates the statistical significance of the peptide and protein alignment, and reflects the size of the database and the scoring system used. The lower the E-value, the more significant is the hit. A sequence alignment with an E-value of 0.10 indicates that the similarity has a 10 in 100 probability of occurring by chance. dNumber of peptides identified is indicated in brackets.
AF was subjected to anion-exchange chromatography to separate the proteins without denaturation. The elution profile exhibited one broad peak (fraction 1) of unbound protein, and two incompletely resolved peaks: a sharp peak (fraction 2), and a broad peak (fraction 3), as depicted in Figure 7A. Fraction 1 did not associate with the column and did not contain any detectable proteins. Figure 7B shows an SDS-PAGE gel of the protein-containing fractions 2 and 3. The gel in Figure 7B was visually compared with the gel obtained from the protein fractions separated by anion-exchange chromatography (Figure 7B) in order to tentatively identify the proteins’ apparent masses. The proteins A22 and A24 in fraction 2 corresponded to the previously identified glycogen phosphorylase (A2) (NP_573461) and serum albumin (A4) (NP_001009376). The proteins present in fraction 3 were present in much higher concentrations and in higher purity and were separated into sharp bands. These proteins, A24 and A27, corresponded to the previously identified serum albumin (A4) (NP_001009376) and a peptide from the immunoglobulin lambda light-chain (constant region) (A7) (AAU45093).
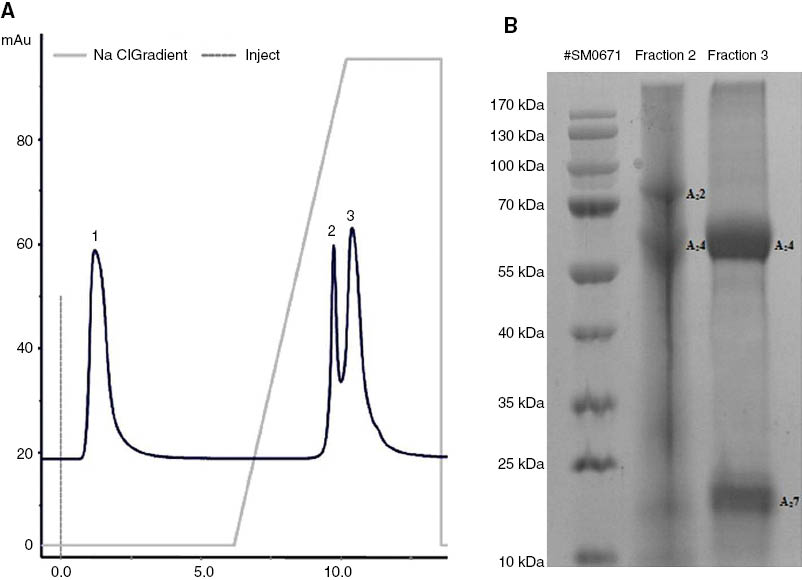
Separation of amniotic fluid proteins by (A) anion-exchange chromatography using a HiTrap Q column and a NaCl gradient, and (B) on a 10% SDS-PAGE gel (200 μg).
The collected protein fractions (fractions 1, 2 and 3) were extracted with TBME and the extracts concentrated and subjected to GC-MS analysis to identify any putative ligands associated with the proteins present in the collected fractions. The TBME extract of fractions 1 and 2 did not contain any VOCs. However, five constituents of the AF (Table 1) were also identified in the TIC of the TBME extract of fraction 3, viz. hexadecanoic acid (C104), 9-octadecenoic acid (C111), octadecanoic acid (C112), the unidentified steroid C123 and cholest-5-en-3β-ol (C124). No low molecular mass volatile ligands were identified in these protein-containing fractions by GC-MS analysis.
The binding specificity of serum albumin is well known [44, 45] and probably accounts for the presence of the three long-chain carboxylic acids identified in fraction 3. The binding capacity of serum albumin for cholest-5-en-3β-ol has also been demonstrated [46, 47], and this probably explains the presence of cholest-5-en-3β-ol in fraction 3. In addition to the ligands hexadecanoic acid, (Z)-9-octadecenoic acid, octadecanoic acid, and cholest-5-en-3β-ol, previously identified as ligands of serum albumin [47, 48], the unidentified steroid C123 was also found as a ligand of serum albumin in the present study.
The ligand binding properties of the wool-associated proteins were not investigated because the method that was used to extract the proteins from the lambs’ wool resulted in denaturation of the proteins and hence a concomitant loss of any possible ligands.
Several of the proteins identified in the AF and those associated with the wool are known to be present in blood plasma. Two proteins, serum albumin and an immunoglobulin protein were identified in both the AF and the lambs’ wool. The major blood plasma protein is serum albumin, whereas hemoglobins, immunoglobins and fetuin are also associated with blood plasma [49]. Five proteins, fibronectin, glycogen phosphorylase (liver form), serum albumin precursor, fetuin precursor and immunoglobulin lambda chain (C region) were identified in the AF samples collected from of the bodies of newborn lambs. Three proteins, the serum albumin precursor, fetal hemoglobin (beta chain) and immunoglobulin lambda chain (C region), were identified as wool-associated proteins.
The possibility has to be considered that traces of blood from the ewes possibly present in some of the AF samples collected from the bodies of the newborn lambs could have contributed to the protein content of the AF. It is also possible that proteins possibly present in the saliva of the ewe could be left on the wool during the grooming process. Taking into consideration that AF samples visibly contaminated with blood were not used in this study and that any blood nevertheless present in the AF came from the same ewe, it is unlikely that contamination from these sources could have had a major impact on our results. This is also borne out by the results of the statistical analyses of the quantitative data on the wool, as well as AF VOCs.
4 Conclusions
It is significant that neither the lower molecular weight compounds present in high concentrations in lamb’s wool, nor compounds that displayed high predictivities in the discrimination between the odor profiles of neonatal lambs, were identified as ligands of the AF proteins. The denaturation of AF proteins remaining on the lambs’ wool fibers thwarted attempts to determine ligand-binding properties of any putative wool-associated protein. Although the question regarding the possible role of AF in neonatal recognition in sheep thus has not been fully answered, it is unlikely that residual VOC-disseminating AF proteins could persist for 100 days or longer. Until credible contradictory evidence becomes available, we propose that the evidence presented here confirms earlier results according to which the AF does not carry the recognition cue.
The discovery that large differences exist in the quantitative composition of the VOCs from the cranial wool and AF collected within a few hours from the same lamb is an important outcome of the present investigation. It is unlikely that specific constituents of the AF of twin-born lambs could be selectively removed from the bodies of the twin lambs while the ewe is grooming them, even if the ewe is allowed unrestricted time. It is also unlikely that the composition of the VOCs could be spontaneously changed by as yet unknown influences to leave them with almost identical recognition cues that have practically no quantitative relationship with the VOC profiles of the AF they were born in. The presently available information thus supports earlier research that concluded that the major role of AF is to induce grooming behavior in the ewe.
We hypothesize that the available information on neonatal recognition in sheep could be rationalized as follows. Taking into consideration that a lamb already carries a thin coat of wool a month or more before parturition, it is possible that production of components of the recognition cue could commence well before the lamb is born. Assuming that the observed temporal postpartum changes in the quantitative composition of lamb’s wool VOCs set in before birth, probably as soon as production of some or all of the components of the eventual recognition cue commences, the composition of the VOCs released into the AF will necessarily differ substantially from the quantitative composition of the lamb’s personal recognition cue when it is born a month later. Prompted by the AF, the ewe grooms her newborn lamb, removes the AF containing the dated message from its body to leave the cleaned lamb with an unadulterated recognition cue, which is produced by the lamb. The grooming process is an essential element in the bonding between lamb and ewe, as it affords her the time to learn her lamb’s recognition cue.
In future work on the current topic, attempts will be made to identify those VOCs that are present in lamb’s wool but are not essentially involved in the neonatal recognition in sheep. If this could be done, it might be possible to carry out a quantitative analysis of a lamb’s cranial wool VOCs, compose a corresponding synthetic mixture consisting of the remaining VOCs and conduct bioassays within the approximately two to three days during which time a ewe can be expected to recognize her own lamb’s recognition cue. In this endeavor we plan to use a recently developed novel and particularly reliable bioassay.
Acknowledgments
This work was supported by the National Research Foundation, Pretoria, South Africa and Stellenbosch University. Financial support by the NRF and Stellenbosch University is gratefully acknowledged. We thank the experimental farm of Stellenbosch University, Mariendahl, for making experimental sheep available for this research and for invaluable advice and assistance.
References
1. Dwyer CM. Genetic and physiological determinants of maternal behaviour and lamb survival: implications for low-input sheep management. J Anim Sci 2008;86:e246–58.10.2527/jas.2007-0404Search in Google Scholar
2. Lévy F, Poindron P, Le Neindre P. Attraction and repulsion by amniotic fluids and their olfactory control in the ewe around parturition. Physiol Behav 1983;31:687–92.10.1016/S0031-9384(83)80004-3Search in Google Scholar
3. Lindsay D. Breeding the flock: modern research and reproduction in sheep. Melbourne, AU: Inkata, 1988.Search in Google Scholar
4. Vince MA, Lynch JJ, Mottershead B, Green G, Elwin R. Sensory factors involved in immediately postnatal ewe/lamb bonding. Behaviour 1985;94:60–84.10.1163/156853985X00271Search in Google Scholar
5. Lévy F, Poindron P. Influence du liquide amniotique sur la manifestation du comportement maternel chez la brebis parturiente. Biol Behav 1984;9:65–88 (in French).Search in Google Scholar
6. Lévy F, Keller M, Poindron P. Olfactory regulation of maternal behavior in mammals. Horm Behav 2004;46:284–302.10.1016/j.yhbeh.2004.02.005Search in Google Scholar
7. Brien FD, Cloete SP, Fogarty NM, Greeff JC, Hebart ML, Hiendleder S, et al. A review of the genetic and epigenetic factors affecting lamb survival. Anim Prod Sci 2014;54:667–93.10.1071/AN13140Search in Google Scholar
8. Burger BV, Viviers MZ, le Roux NJ, Morris J, Bekker JI, le Roux M. Olfactory cue mediated neonatal recognition in sheep, Ovis aries. J Chem Ecol 2011;37:1150–63.10.1007/s10886-011-0020-7Search in Google Scholar
9. Viviers MZ, Burger BV, le Roux NJ, Morris J, le Roux M. Temporal changes in the neonatal recognition cue of Dohne Merino lambs (Ovis aries). Chem Senses 2014;39:249–62.10.1093/chemse/bjt075Search in Google Scholar
10. Alexander G, Shillito EE. The importance of odor, appearance and voice in maternal recognition of the young in Merino sheep (Ovis aries). Appl Anim Ethol 1977;3:127–35.10.1016/0304-3762(77)90021-9Search in Google Scholar
11. Terrazas A, Ferreira G, Lévy F, Nowak R, Serafin N, Orgeur P, et al. Do ewes recognize their lambs within the first day postpartum without the help of olfactory cues? Behav Proc 1999;47:19–29.10.1016/S0376-6357(99)00045-5Search in Google Scholar
12. Alexander G, Stevens D. Recognition of washed lambs by Merino ewes. Appl Anim Ethol 1981;7:77–86.10.1016/0304-3762(81)90053-5Search in Google Scholar
13. Lynch JJ, Hinch GN, Adams DB. The behaviour of sheep. biological principles and implications for production. Melbourne, AU: CAB International and CSIRO Australia, 1992.Search in Google Scholar
14. Beynon RJ, Hurst JL. Urinary proteins and the modulation of chemical scents in mice and rats. Peptides 2004;25:1553–63.10.1016/j.peptides.2003.12.025Search in Google Scholar
15. Burger BV, Munro Z, Brand WF. Pheromones of the Scarabaeinae, II. Composition of the pheromone disseminating carrier material secreted by male dung beetles of the genus Kheper. Z Naturforsch 1990;45c:863–72.10.1515/znc-1990-7-820Search in Google Scholar
16. Leal WS. Pheromone reception. In: Schultz, S, editor. The chemistry of pheromones and other semiochemicals. Berlin: Springer, 2005:240, pp.1–36.10.1007/b98314Search in Google Scholar
17. Burger BV, Yang TP, le Roux M, Brandt WF, Cox AJ, Hart PF. Mammalian exocrine secretions XI. Constituents of the preorbital secretion of klipspringer, Oreotragus oreotragus. J Chem Ecol 1997;23:2383–400.10.1023/B:JOEC.0000006681.33646.f4Search in Google Scholar
18. Burger BV, le Roux M, Marx B, Herbert SA, Amakali KT. Development of a second-generation sample enrichment probe (SEP) for improved sorptive analysis of volatile organic compounds. J Chrom A 2011;1218:1567–75.10.1016/j.chroma.2011.01.038Search in Google Scholar
19. Burger BV, Marx B, le Roux M, Burger WG. Simplified analysis of organic compounds in headspace and aqueous samples by high-capacity sample enrichment probe. J Chrom A 2006;1121:259–67.10.1016/j.chroma.2006.04.007Search in Google Scholar
20. Reiter B, Burger BV, Dry J. Mammalian exocrine secretions XVIII. Chemical characterization of interdigital secretion of red hartebeest, Alcelaphus buselaphus Caama. J Chem Ecol 2003;29:2235–52.10.1023/A:1026218213151Search in Google Scholar
21. Vincenti M, Guglielmetti G, Cassani G, Tonini C. Determination of double bond position in diunsaturated compounds by mass spectrometry of dimethyl disulfide derivatives. Anal Chem 1987;59:694–9.10.1021/ac00132a003Search in Google Scholar
22. Maas B, Dietrich A, Mosandl A. Collection of enantiomer separation factors obtained by capillary gas chromatography on chiral stationary phases. J High Resolut Chrom 1994;17:109–15.10.1002/jhrc.1240170216Search in Google Scholar
23. Burger BV, Viviers MZ, Bekker JI, le Roux M, Fish N, Fourie WB, et al. Chemical characterization of territorial marking fluid of male Bengal tiger, Panthera tigris. J Chem Ecol 2008;34:659–71.10.1007/s10886-008-9462-ySearch in Google Scholar
24. Bradford MM. A rapid and sensitive method for the quantitation of macrogram quantities of protein utilizing the principle of protein-dye binding. Anal Biochem 1976;72:248–54.10.1016/0003-2697(76)90527-3Search in Google Scholar
25. Laemmli UK. Cleavage of structural proteins during the assembly of the head of bacteriophage T4. Nature 1970;227:680–5.10.1038/227680a0Search in Google Scholar
26. Sambrook J, Russell DW. Molecular cloning: a laboratory manual, 3rd ed. New York: Cold Spring Harbour Laboratory Press, 2001.Search in Google Scholar
27. Shevchenko A, Wilm M, Vorm O, Mann M. Mass spectrometric sequencing of proteins from silver-stained polyacrylamide gels. Anal Chem 1996;68:850–8.10.1021/ac950914hSearch in Google Scholar
28. Perkins DN, Pappin DJ, Creasy DM, Cottrell JS. Probability-based protein identification by searching sequence databases using mass spectrometry data. Electrophoresis 1999;20:3551–67.10.1002/(SICI)1522-2683(19991201)20:18<3551::AID-ELPS3551>3.0.CO;2-2Search in Google Scholar
29. Altschul SF, Gish W, Miller W, Myers EW, Lipman DJ. Basic local alignment search tool. J Mol Biol 1990;215:403–10.10.1016/S0022-2836(05)80360-2Search in Google Scholar
30. Armstrong SD, Robertson DL, Cheetham SA, Hurst JL, Beynon RJ. Structural and functional differences in isoforms of mouse major urinary proteins: a male-specific protein that preferentially binds a male pheromone. J Biochem 2005;391:43–50.10.1042/BJ20050404Search in Google Scholar
31. Kowalski BR, Bender CF. Pattern recognition. A powerful approach to interpreting chemical data. J Am Chem Soc 1972;94:5632–9.10.1021/ja00771a016Search in Google Scholar
32. Aldrich C, Gardner S, le Roux NJ. Monitoring of metallurgical process plants using biplots. J Am Inst Chem Eng 2004;50: 2167–86.10.1002/aic.10170Search in Google Scholar
33. Gardner-Lubbe S, le Roux NJ, Gower JC. Measures of fit in principal component and canonical variate analyses. J Appl Statist 2008;35:947–65.10.1080/02664760802185399Search in Google Scholar
34. Kovats E. Gas-chromatographische Charakterisierung organischer Verbindungen. Teil 1: retentionsindices aliphatischer Halogenide, Alkohole, Aldehyde und Ketone. Helv Chim Acta 1958;41:1915–32 (in German).10.1002/hlca.19580410703Search in Google Scholar
35. Rietdorf M. Identifizierung und Synthese flüchtiger Substanzen aus Säugetieren. PhD Thesis, Institut für Organische Chemie, Universität Hamburg, 1992 (in German).Search in Google Scholar
36. Motiuk K. Wool wax acids: a review. J Am Oil Chem Soc 1979;56:91–97.10.1007/BF02914277Search in Google Scholar
37. Motiuk K. Wool wax alcohols: a review. J Am Oil Chem Soc 1979;56:651–8.10.1007/BF02679344Search in Google Scholar
38. Motiuk K. Wool wax hydrocarbons: a review. J Am Oil Chem Soc 1980;57:145–6.10.1007/BF02672239Search in Google Scholar
39. Schlossman ML, McCarthy JP. Lanolin and derivatives chemistry: relationship to allergic contact dermatitis. Contact Dermatitis 1979;5:65–72.10.1111/j.1600-0536.1979.tb04801.xSearch in Google Scholar
40. Lisovac AM, Shooter D. Volatiles from sheep wool and the modification of wool odours. Small Ruminant Res 2003;49: 115–24.10.1016/S0921-4488(03)00075-0Search in Google Scholar
41. Soini HA, Bruce KE, Wiesler D, David F, Sandra P, Novotny MV. Stir bar sorptive extraction: a new quantitative and comprehensive sampling technique for determination of chemical signal profiles from biological media. J Chem Ecol 2005;31: 377–92.10.1007/s10886-005-1347-8Search in Google Scholar
42. Alberts AC. Constraints on the design of chemical communication systems in terrestrial vertebrates. Am Nat 1992;139:62–89.10.1086/285305Search in Google Scholar
43. Gower JC, Lubbe S, le Roux NJ. Understanding biplots. Chichester, UK: Wiley, 2011.10.1002/9780470973196Search in Google Scholar
44. Bhattacharya AA, Grüne T, Curry S. Crystallographic analysis reveals common modes of binding of medium and long-chain fatty acids to human serum albumin. J Mol Biol 2000;303: 721–32.10.1006/jmbi.2000.4158Search in Google Scholar
45. Spector AA, John K, Fletcher JE. Binding of long-chain fatty acids to bovine serum albumin. J Lipid Res 1969;10:56–67.10.1016/S0022-2275(20)42649-5Search in Google Scholar
46. Peng L, Minbo H, Fang C, Xi L, Chaocan Z. The interaction between cholesterol and human serum albumin. Protein Pept Lett 2008;15:360–4.10.2174/092986608784246542Search in Google Scholar PubMed
47. Deliconstantinos G, Tsopanakis C, Karayiannakos P, Skalkeas G. Evidence for the existence of non-esterified cholesterol carried by albumin in rat serum. Atherosclerosis 1986;61:67–75.10.1016/0021-9150(86)90114-0Search in Google Scholar
48. Saifer A, Goldman L. The free fatty acids bound to human serum albumin. J Lipid Res 1961;2:268–70.10.1016/S0022-2275(20)39014-3Search in Google Scholar
49. Metzler DE. Biochemistry. The chemical reactions of living cells, 2nd ed., Vol. 1. San Diego: Harcourt Academic Press, 2001.Search in Google Scholar
©2015 by De Gruyter
Articles in the same Issue
- Frontmatter
- Characterization of amniotic fluid of Dohne Merino ewes (Ovis aries) and its possible role in neonatal recognition
- Chemical composition, antitumor activity, and toxicity of essential oil from the leaves of Lippia microphylla
- Anti-hyperlipidemic activity of an extract from roots and rhizomes of Panicum repens L. on high cholesterol diet-induced hyperlipidemia in rats
- Feeding stimulants for larvae of Graphium sarpedon nipponum (Lepidoptera: Papilionidae) from Cinnamomum camphora
- Effect of fluoride on the proteomic profile of the hippocampus in rats
- Anti-angiogenic and antiproliferative properties of the lichen substances (-)-usnic acid and vulpinic acid
- Research note
- Fungal biotransformation of crude glycerol into malic acid