Evaluation of four different HPLC devices for hemoglobinopathy screening
-
Müjgan Ercan Karadağ

 ,
Emiş Deniz Akbulut
,
Emiş Deniz Akbulut

Abstract
Objective
Hemoglobinopathies are a common public health problem in Turkey. In the screening of these disorders in population, cation-exchange high performance liquid chromatography (HPLC) is accepted as the gold standard method. In this study, the aim was to assess four different HPLC devices used in hemoglobinopathy screening.
Materials and methods
A total of 58 blood samples were analyzed with four different HPLC methods (Bio-Rad variant II, Agilent 1100, Tosoh G8 and Trinity Ultra2 trademarks).
Results
The comparison study demonstrated a good correlation between the results of each HPLC analyzer and the reference value obtained by averaging all the HbA2 results belonging to the methods tested in the study [ (Tosoh G8 (r=0.988), Bio-Rad variant II (r=0.993), Agilent 1100 (r=0.98) and Trinity Ultra2 (r=0.992) ]. HbA2 determination in the presence of HbE was interfered in both Bio-Rad variant II and Tosoh G8.
Conclusion
The analyzers were found to have compatible HbA2 results but with accompanying different degrees of proportional and systematic biases. HPLC analyzers may be affected by different hemoglobin variants at different HbA2 concentrations, which is an important point to take into consideration during the evaluation of HbA2 results in thalassemia screening.
ÖZ
Amaç
Hemoglobinopatiler Türkiye’de yaygın bir halk sağlığı sorunudur. Bu bozuklukların popülasyon taramasında, katyon değişimi HPLC, altın standart yöntem olarak Kabul edilir. Bu çalışmada hemoglobinopati taramasında kullanılan dört farklı HPLC cihazının değerlendirilmesi amaçlanmıştır.
Gereç ve Yöntemler
Toplam 58 kan örneği dört farklı HPLC (Bio-Rad variant II, Agilent 1100, Tosoh G8 ve Trinity Ultra2 marka) cihazı ile analiz edildi
Bulgular
Karşılaştırma çalışmasında, her bir HPLC analizörünün sonuçları ile çalışmada değerlendirilen metotlara ait tüm HbA2 sonuçlarının ortalaması alınarak elde edilen referans değer arasında iyi bir korelasyon olduğunu göstermiştir [ (Tosoh G8 (r=0.988), Bio-Rad variant II (r=0.993), Agilent 1100 (r=0.98) ve Trinity Ultra2 (r=0.992) ]. HbE varlığının hem Bio-Rad Varyant II hem de Tosoh G8 cihazlarının HbA2 sonuçlarında interferansa neden olduğu gözlenmiştir.
Sonuç
Eşlik eden farklı derecelerde orantılı ve sistematik biasla birlikte analizörlerin uyumlu HbA2 sonuçlarına sahip oldukları gösterilmiştir. Talasemi taramaları değerlendirilirken, kullanılan HPLC analizörlerinin farklı HBA2 konsantrasyonlarında farklı hemoglobin varyantlarının varlığından etkilenebileceği göz önünde bulundurulmalıdır.
Introduction
Hemoglobinopathies, a common public health problem in Turkey, comprise a diverse group of diseases including thalassemia and hemoglobin variants. Mutations in the genes for globin subunits causing constitutional changes lead to hemoglobin variants whereas the mutations impairing hemoglobin synthesis give rise to thalassemia’s [1]. About 1.5% of the world populations are carriers of beta thalassemia but prevalence in Turkey increases to 2.1% [2], [ 3]. When the prevalence of carriers is considered, 300–400 affected newborns are expected per year and this causes significant emotional and economic harm to public health. Fight against hemoglobinopathies must essentially include the detection of thalassemia carriers, hemoglobin variants expected to present with severe clinical manifestations and clinically silent hemoglobin variants [3], [4].
Quantitative detection of HbA2 and HbF levels and also usage of red cell indices are the main methodologies in hemoglobinopathy screening [5]. HbA2 determination has a major role in carrier detection but always must be evaluated with other parameters like erythrocyte indices, iron status and also be connected with family history [5], [6]. Several electrophoresis types like cellulose acetate, immunofixation (IFE), capillary electrophoresis and chromatographic methods using micro-columns and cation-exchange high performance liquid chromatography (HPLC) are the methods mostly preferred for analysis of HbA2 [7]. However introduction of automated techniques for Hb fractionation improved the laboratory efficiency and quality of results [1]. For being fully automated and allowing both qualitative and quantitative analysis of Hb fractions, cation exchange HPLC is accepted as the gold standard for population screening of hemoglobinopathies [5], [8].
The main advantage of HPLC is the quantification of HbA2 along with other variants within a single screening test. The strength of HPLC is being sensitive, reproducible, fast and also it requires less effort during analysis. Therefore, it seems to be ideal for routine clinical laboratories with high workload. HPLC allows accurate quantification of the most common hemoglobin variants with the exceptions of glycated or modified HbS slightly elevating HbA2 level (3.8–4.5%) [1], [9] and Hb Lepore and HbE artificially increasing HbA2 levels by 10–15% and 22–28%, respectively due to co-elution [1]. Accordingly, these potential error sources should be taken into consideration in order to reduce or eliminate false results.
Premarital screening of hemoglobinopathy helps to reduce affected births in endemic countries like Turkey. Therefore efforts are made in the clinical laboratory to enhance the efficiency of screening process via implementation of the most appropriate analytical method.
In this study our aim was to assess the performance of four different HPLC devices used in hemoglobinopathy screening and produce data in order to help the evaluation of HbA2 results in thalassemia screening laboratories.
Materials and methods
Samples and analyzers
The study included 58 subjects who admitted to Public Health Laboratory for hemoglobinopathy screening. Approximately two 3 ml blood samples were taken from each participant into EDTA containing tubes. Complete blood count was performed on ABX Pentra 60 (Horiba Medical, France) by cytochemistry, focused flow impedance and light absorbance methods. For hemoglobinopathy detection, specimens were split into 4 small aliquots and analyzed within one day on Bio-Rad variant II (Bio-Rad Laboratories, Hercules, CA, USA), Agilent 1100 (Agilent Technologies, Waldbronn, Germany), Tosoh G8 (Tosoh Bioscience, Tokyo, Japan) and Trinity Ultra2 HPLC (Trinity Biotech, Wicklow, Ireland) analyzers. Measurement principle depended on ion exchange chromatography. Chromatograms were interpreted by determining HbA2 concentration for beta-thalassemia with also evaluating retention times, area percentages and windows of all the other structural variants. In each chromatogram, there were peaks for HbA, HbA2, and HbF along with a window for other variants (Hb S, C and D) Agilent 1100 and Trinity Ultra2 also detected HbE. HbE co–eluated with HbA2 on Bio-Rad variant II and Tosoh G8 which was indicated by an error flag. The analyzers were calibrated for quantifying HbA2 according to the manufacturer’s recommendations with the exception of Agilent 1100 HPLC analyzer which did not require a calibration process. HbA2 cut-off values were 3.5, 3.5, 3.2 and 3.3% for Tosoh G8, Trinity Ultra2, Bio-Rad variant II and Agilent 1100, respectively. With-in run coefficient of variation (CV%) values of HbA2 for Tosoh G8, Trinity Ultra2, Bio-Rad variant II and Agilent 1100 according to manufacturers’ certificates were 1.5, 0, 1.88 and 1.09% for level 1 control samples and 1.8, 0.8, 0.88 and 0.02% for level 2 control samples, respectively.
During the analysis, four devices were configured side-by-side in order to maintain the same environmental conditions. Quality control assessment was performed for all the systems. Within-run imprecision of HbA2 measurements were obtained by analyzing two levels of serum pool specimens 20 times consecutively during the study day.
The study protocol was approved by the ethics committee of Harran University Faculty of Medicine (Ref number: 201010).
Statistical analysis
The findings of this study were analyzed using statistical software programs, SPSS v20 (IBM, NY, USA) and MedCalc v18.11.6 (Ostend, Belgium). The conformity of continuous variables to normal distribution was tested with the Kolmogorov–Smirnov test. The descriptive statistics of continuous variables were expressed as mean ± standard deviation or median (min-max was used for abnormal hemoglobin, 25th–75th quartile was used for age) The presence of a statistically significant difference between the groups in terms of continuous variables was examined with ANOVA or Kruskall-Wallis tests. Post-hoc testing was performed where the overall significance of the ANOVA or Kruskall-Wallis test. Imprecision was calculated using the coefficient of variation. Correlation between methods was evaluated with Deming regression analysis and illustrated using Bland-Altman plots with the differences in HbA2 values (thalassemia and control group). Since a reference method for comparison (x-axis) was missing, the value obtained by averaging the HbA2 results of all the tested methods was used. p-value of <0.05 was considered statistically significant.
Results
We separated 58 individuals into three groups according to their results. Group 1 (n=20) consisted of β- thalassemia carriers, group 2 (n=24) consisted of healthy subjects and group 3 (n=14) consisted of individuals with various hemoglobinopathies. Gender distributions were similar among the groups (Female/Male; 10/10; 7/17; 7/7, respectively). No significant difference was found among the groups in the terms of age [medians (25th–75th quartile); 28(26–34), 27(24–29) and 27(22–37), respectively)] and Hematocrit (HCT) (p=0.449 and p=0.078, respectively). In the subgroup analysis, Mean corpuscular volume (MCV) and Mean corpuscular hemoglobin (MCH) levels were found to be significantly different between group 1-group 2 (p<0.001) and group 1-group 3 (p<0.001). Statistically significant difference was detected for Hemoglobin (Hb) levels between group 1 and 2 (p=0.003). Hb (g/dL) levels were 12.20 ± 2.17, 14.09 ± 1.40, 12.98 ± 2.10; Hematocrit (%) levels were 38.36 ± 5.56, 41.49 ± 3.99, 39.65 ± 5.52; MCV (fL) levels were 70.95 ± 6.53, 86.08 ± 5.53, 84 ± 9.13, and MCH (pg) concentrations were 22.47 ± 2.42, 29.24 ± 2.36 and 26.54 ± 3.79 (Mean ± SD) for the groups, respectively. Within-day reproducibility studies determined that CV% results on the Biorad-Variant II, Agilent 1100, Tosoh G8 and Trinity Ultra2 devices for level 1 (mean HbA2 concentration: <3.5%) were 2.01, 2.64, 2.62, 1.92% and level 2 were (mean HbA2 concentration: >3.5%) 3.70, 5.50, 5.01, 1.10% from the serum pools analyzers. It was observed that our serum pools have higher CV% values compared to within-run CV% values of the manufacturers. Detection of abnormal hemoglobin variants and HbA2 results of these samples varied at different degrees according to the method used as shown in Table 1.
HbA2 (n=14) values of the patients with various hemoglobin variants on each analyzer.
| Analyzer | Biorad-Variant II | Agilent 1100 | Tosoh G8 | Trinity Ultra2 |
|---|---|---|---|---|
| Hb S(n) Hb A2% Median (Range) | 3 3.3 (1.70–4)a | 6 2.9 (2.38–3.32)a | 3 3 (2.90–3.10)a | 3 4.1 (4.10–4.20)a |
| Hb D(n) Hb A2% Median (Range) | 4 1.50 (1.40–1.80)a | 5 2.79 (1.42–4.13)a | 5 2.80 (2.30–3.80) | 5 2.20 (1.70–2.50) |
| Hb C(n) Hb A2% Median(Range) | 0 | 1 2.15 – | 2 1.45 (0.90–2) | 0 |
| Hb E(n) Hb A2% Median (Range) | 2 39 (38.4–39.6) | 2 2.98 (2.84–3.12)a | 2 50.7 (49.40–52)a | 0 |
| Hb O(Arab)(n) Hb A2% Median (Range) | 0 | 0 | 0 | 1 3.4 – |
| Unknown variant(n) Hb A2% Median (Range) | 5 2.25 (0.40–3.30)a | 0 | 2 2.15 (1.4–2.9)a | 5 1.85 (1–2.50)a |
aMedian(min-max).
Method comparison included regression analysis, correlation analysis and Bland-Altman difference analysis for HbA2% on Tosoh G8, Trinity Ultra2 HPLC, Bio-Rad variant II and Agilent 1100 analyzer illustrated in Table 2 and in Figures 1 and 2
Comparison of HbA2 results of methods with target % HbA2 (average of all HbA2 measurement results).
| Method | HbA2% (n=44) | Bland-altman analysis | Correlation analysis | Passing-Bablok regression analysis | ||
|---|---|---|---|---|---|---|
| Group 1 (n=20) | Group 2 (n=24) | |||||
| Mean ± SD | Mean ± SD | Bias | R | Slope (95% CI) | Intercept (95% CI) | |
| Trinity Ultra2 | 4.82 ± 0.66 | 2.38 ± 0.25 | 0.25 | 0.992 | 1 (0.95 to 1) | −0.3 (−0.3 to −0.08) |
| Tosoh G8 | 5.52 ± 0.76 | 2.41 ± 0.40 | −0.08 | 0.988 | 1.25 (1.19 to 1.30) | −0.77 (−0.95 to -0.60) |
| Agilent 1100 | 5.07 ± 0.76 | 2.83 ± 0.31 | −0.10 | 0.980 | 0.94 (0.87 to 1.01) | 0.38 (0.11 to 0.60) |
| Biorad-Variant II | 5.01 ± 0.57 | 2.78 ± 0.20 | −0.05 | 0.993 | 1.11 (1.03 to 1.17) | 0.45 (0.29 to 0.56) |
Group 1: β-thalassemia carriers, Group 2: Healthy Subjects, CI:Confidence intervals.
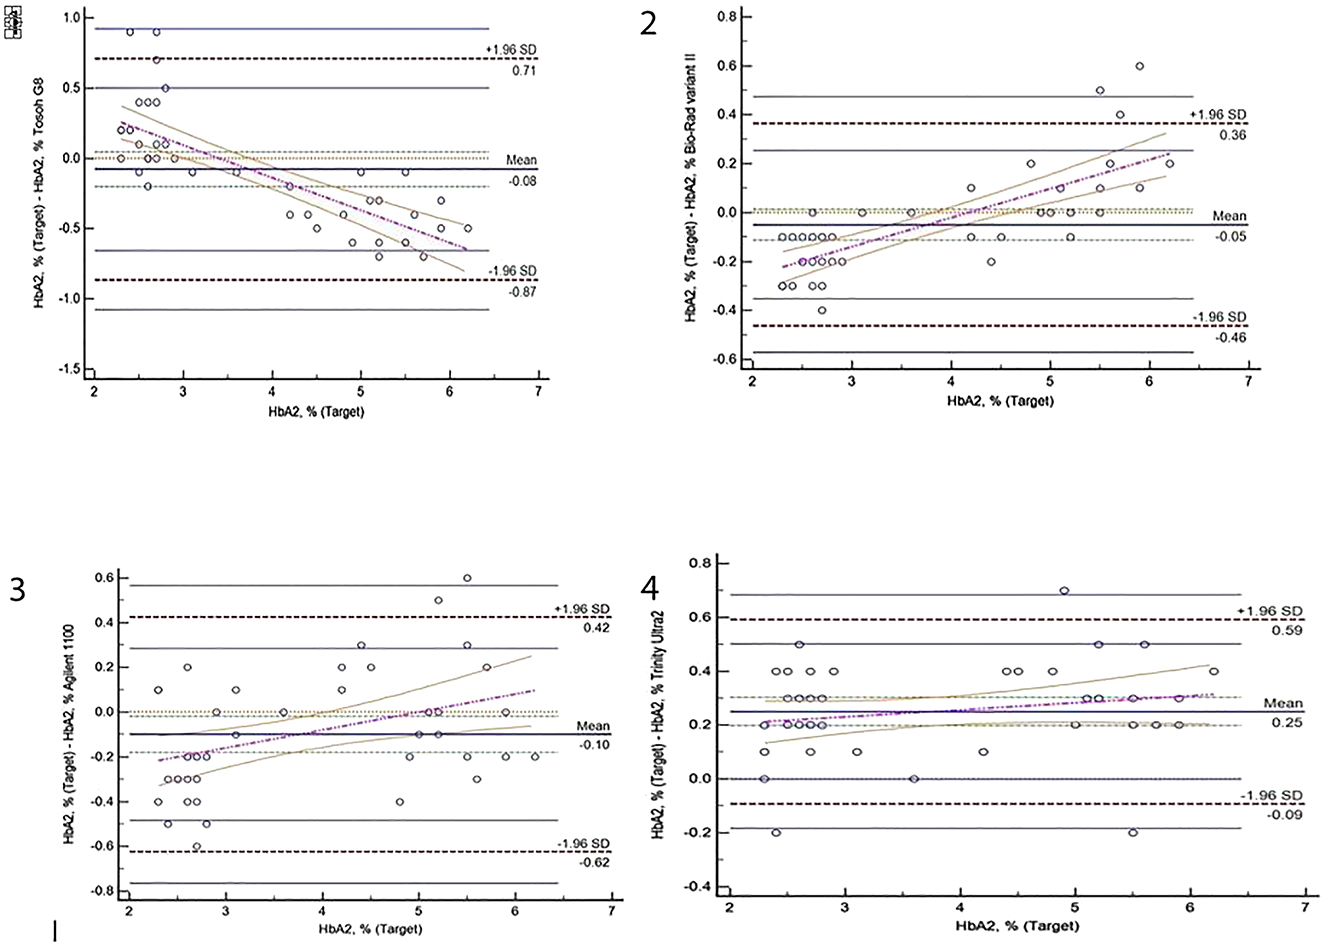
Bland-Altman difference plots for HbA2% results obtained from Tosoh G8, Biorad Variant II, Agilent 1100 and Trinity Ultra2 analyzer.

Passing-Bablok regression graphics for HbA2% on Tosoh G8, Biorad Variant II, Agilent 1100 and Trinity Ultra2 analyzer.
Discussion
In the present study, proportional and systematic biases were found among four different HPLC devices used in thalassemia screening for HbA2 measurement. However in the correlation analysis excellent correlations were detected for Tosoh G8 (r=0.988), Bio-Rad variant II (r=0.993), Agilent 1100 (r=0.98) and Trinity Ultra2 (r=0.992) when the average HbA2 results were taken as the reference. Also when HbA2 cut off value was set as 3.5%, it was seen that the individuals could be separated either as carrier or as normal by all the systems, in accordance with each other. Bland-Altman plots showed that bias ranging between 0.25% and −0.10% for the results of samples (n=44) when variant hemoglobin containing samples were excluded. For most of the methods, HbA2 values did not distribute at a constant interval the bias tend to be positive with exception Tosoh G8. Trinity Ultra 2, Biorad Variant II HPLC and Agilent 1100 revealed higher results in low values of HbA2, in terms of target HbA2. However it was in the opposite direction for Tosoh G8.
Our results of within-day reproducibility study were similar to the results (1.10–5.50% for four different HPLC analyzers) of a previous study published in 2012 which reported within-day CV% values ranging form 0.5 to 4.4% for HPLC analyzers [10]. In another study which was conducted in 2018, CV% values were between 0.6 and 10.1% for HbA2 values lower and higher than 3.5%, respectively [11]. In 2004, Paleari reported CV% values ranged from 0.8 to 2.2% on different HPLC analyzers [12]. Merona et al. found within-run CV% lower than 1%, for normal and raised HbA2 levels [13]. In a study by Cotton et al. the CV% ranged from 3 to 6% for Hb A2 at physiological and pathological concentrations [14]. According to Ricos et al. desirable CVA for HbA2 measurement was ≤0.2% [15]. Because HbA2 had a very narrow intra-individual biological variation and this goal was set on the basis of the intra-individual variability of the analyte at present, there is not any HPLC method able to reach this goal. According to our results Trinity Ultra 2 analyzer was found to have the best analytical performance in terms of precision among the four analyzers with within-day CV% values ranging from 1.10 to 1.92%.
In a comparison study, Higgins et al. found a good correlation between Bio-Rad and Capillarys 2 devices on 207 samples with and without β-Thalassemia Trait [16]. Merono et al. revealed that results on Tosoh G8 had a good correlation with both Bio-Rad Variant II HPLC system and Sebia Capillary’s system [13]. Paleari et al. showed good correlation among five different HPLC systems (without assuming a reference method, comparison method depended on averaging the HbA2 results of all five HPLC systems) [10]. On the other hand, the performance of Tosoh G8 analyzer was reported to be insufficient despite enough separation of thalassemia carriers [17]. Similar to previous studies, we used Deming regression analysis and our results showed a good correlation between the devices. In the literature, studies comparing different analyzers for abnormal hemoglobin variants and HbA2% measurement had different results for coefficient of correlation ranging between 0.55 and 0.999 [10], [11], [12], [13], [14], [17]. Possible sources of difference in the correlation coefficient results may be the presence of carry-over, abnormal hemoglobin variant (known and unknown), erroneous calibration, inter-batch differences, column changes within the same batch, sample concentration, estimation of elution time, external temperature, chromatogram estimations, and waiting time of the samples.
Coefficient of variation of a method can be a major factor affecting HbA2 results. The Italian Society for Hemoglobinopathy has launched a control quality program (VEQHbA2) for the evaluation of intra- and inter-laboratory variations and accurate determination of HbA2 by using HPLC analyzers [1], [18]. In this pilot study, normal, pathological and borderline HbA2 samples were clearly differentiated by all participant laboratories. But the overall interlaboratory CV% was between 4 and 8.2% for three levels of samples. Consequently, HbA2 analytical quality measurement should be improved according to IFCC Working Group Standardization of HbA2 committee.
The accurate quantitation of HbA2 may be deteriorated in the presence of Hb variants. In order to evaluate this effect we performed a preliminary investigation with a few samples (n=14) containing Hb variants. Literature previously indicated that HPLC methods had a limitation in determining each hemoglobin variant synchronously among instruments. Gosselin et al. reported that the major problem of this technique was co-elution of hemoglobin fractions. They suggested that when patient samples having co‐elution issues were eliminated from data set, there was markedly improved correlation between HPLC devices [19]. In a study, Dina et al. evaluated the sources of interference for HbA2 and found that HPLC systems were interfered in the presence of HbS and HbE while capillary flex system was affected with the presence of HbC [20]. They suggested that HPLC analyzers were shown to quantify HbA2 accurately in the presence of HbC, but not in the presence of HbE or glycated HbS [20]. In our study, in the presence of HbS variant, there was a slight increase in HbA2 levels on only Trinity Ultra2 analyzer. When HbD variant was detected, only HbA2 levels on Biorad Variant II analyzer were found to be lower. The effect of HbC variant was lowering HbA2 results on both Agilent 1100 and Tosoh G8 analyzers. On two instruments, Bio-Rad-Variant II and Tosoh G8, determined HbA2 values were higher when HbE was detected. Since presence of HbE variant had no interfering effect with HbA2 measurement on Agilent 1100 analyzer, we thought that the analyzer had ability to discriminate HbE from HbA2 window. Only one variant (HbO) was detected on Trinity Ultra2 analyzer. As presented in Table 1, it was seen that unknown variants detected with varying numbers on dedicated HPLC analyzers did not interfere with HbA2 results.
There were some limitations of the present study. The most important one was our inability for conducting advanced genetic testing to establish the final diagnosis of the study group. As a result, we could not determine the possible false positive or negative results of HbA2 for the patients discriminated according to our cut-off point.
As a conclusion, the HPLC analyzers tested in this study were found to be compatible (four different HPLC analyzers showed excellent correlation) in terms of HbA2 measurement, which is an important marker of hemoglobinopathy. Evaluation of HbA2 results should be done carefully when warning flags are present on the instrument which may be related with hemoglobin variants and cause erroneous results. HPLC analyzers could be affected at varying levels with the presence of different hemoglobin variants for HbA2 measurement, which is an important point to take into consideration during the evaluation of HbA2 results in Thalassemia screening.
Research funding: The authors declare that this study has received no financial support.
Author contributions: All authors have accepted responsibility for the entire content of this manuscript and approved its submission.
Competing interests: Authors state no conflict of interest.
Informed consent: Informed consent was obtained from all individuals included in this study.
References
1. Giambona, A, Passarello, C, Renda, D, Maggio, A. The significance of the hemoglobin A(2) value in screening for hemoglobinopathies. Clin Biochem 2009;42:1786–96. https://doi.org/10.1016/j.clinbiochem.2009.06.026.Suche in Google Scholar
2. Weatherall, DJ, Clegg, JB. The α Thalassaemias and their interactions with structural haemoglobin variants, John Wiley & Sons; 2001.10.1002/9780470696705.ch11Suche in Google Scholar
3. Aydinok, Y, Oymak, Y, Atabay, B, Aydogan, G, Yesilipek, A, Unal, S, et al. A national registry of thalassemia in Turkey: demographic and disease characteristics of patients, achievements, and challenges in prevention. Turk J Haematol 2018;35:12–8.10.4274/tjh.2017.0039Suche in Google Scholar PubMed PubMed Central
4. Canatan, D. Thalassemias and hemoglobinopathies in Turkey. Hemoglobin 2014;38:305–7. https://doi.org/10.3109/03630269.2014.938163.Suche in Google Scholar
5. Mosca, A, Paleari, R, Ivaldi, G, Galanello, R, Giordano, PC. The role of haemoglobin A(2) testing in the diagnosis of thalassaemias and related haemoglobinopathies. J Clin Pathol 2009;62:13–7. https://doi.org/10.1136/jcp.2008.056945.Suche in Google Scholar
6. Öz, Ö. The frequency of JAK2 V617F mutation in patients with chronic myeloproliferative disease. J Harran Univ Med Fac 2019;16:492–5.10.35440/hutfd.645383Suche in Google Scholar
7. Clarke, GM, Higgins, TN. Laboratory investigation of hemoglobinopathies and thalassemias: review and update. Clin Chem 2000;46:1284–90. https://doi.org/10.1093/clinchem/46.8.1284.Suche in Google Scholar
8. Tan, GB, Aw, TC, Dunstan, RA, Lee, SH. Evaluation of high performance liquid chromatography for routine estimation of haemoglobins A2 and F. J Clin Pathol 1993;46:852–6. https://doi.org/10.1136/jcp.46.9.852.Suche in Google Scholar
9. Suh, DD, Krauss, JS, Bures, K. Influence of hemoglobin S adducts on hemoglobin A2 quantification by HPLC. Clin Chem 1996;42:1113–4. https://doi.org/10.1093/clinchem/42.7.1113.Suche in Google Scholar
10. Paleari, R, Gulbis, B, Cotton, F, Mosca, A. Interlaboratory comparison of current high-performance methods for HbA2. Int J Lit Humanit 2012;34:362–8. https://doi.org/10.1111/j.1751-553x.2012.01403.x.Suche in Google Scholar
11. Paleari, R, Ceriotti, F, Harteveld, CL, Strollo, M, BakkerVerweij, G, ter Huurne, J, et al. Calibration by commutable control materials is able to reduce intermethod differences of current high-performance methods for HbA2. Clin Chim Acta 2018;477:60–5. https://doi.org/10.1016/j.cca.2017.12.001.Suche in Google Scholar
12. Paleari, R, Cannata, M, Leto, F, Maggio, A, Demartis, FR, Desogus, MF, et al. Analytical evaluation of the Tosoh HLC-723 G7 automated HPLC analyzer for hemoglobin A2 and F determination. Clin Biochem 2005;38:159–65. https://doi.org/10.1016/j.clinbiochem.2004.10.017.Suche in Google Scholar
13. Merono, F, Agouti, I, Bonello-Palot, N, Paolasso, C, Levy, N, Badens, C. Analytical evaluation of the Tosoh HLC-723 G8 automated HPLC analyzer for hemoglobin analysis in beta-thalassemia mode. Clin Biochem 2011;44:441–3. https://doi.org/10.1016/j.clinbiochem.2010.12.007.Suche in Google Scholar
14. Cotton, F, Lin, C, Fontaine, B, Gulbis, B, Janssens, J, Vertongen, F. Evaluation of a capillary electrophoresis method for routine determination of hemoglobins A2 and F. Clin Chem 1999;45:237–43. https://doi.org/10.1093/clinchem/45.8.1317.Suche in Google Scholar
15. Ricos, C, Alvarez, V, Cava, F, Garcia-Lario, JV, Hernandez, A, et al. Current databases on biologic variation: pros, cons and progress. Scand J Clin Lab Invest 1999;59:491–500.10.1080/00365519950185229Suche in Google Scholar PubMed
16. Higgins, TN, Khajuria, A, Mack, M. Quantification of HbA(2) in patients with and without beta-thalassemia and in the presence of HbS, HbC, HbE, and HbD Punjab hemoglobin variants: comparison of two systems. Am J Clin Pathol 2009;131:357–62. https://doi.org/10.1309/ajcp28qksophyobc.Suche in Google Scholar
17. Ellidağ, HY, Eren, E, Aydın, Ö, İnce, FDA, Gök, İ, Yılmaz, N. Comparison of agilent 1100 (chromsystems) and Tosoh HLC-723 G8 HPLC systems in thalassemia screening. Turk J Biochem 2014;39:544–8.10.5505/tjb.2015.80774Suche in Google Scholar
18. Paleari, R, Giambona, A, Cannata, M, Leto, F, Maggio, A, Mosca, A. External quality assessment of hemoglobin A2 measurement: data from an Italian pilot study with fresh whole blood samples and commercial HPLC systems. Clin Chem Lab Med 2007;45:88–92. https://doi.org/10.1515/cclm.2007.002.Suche in Google Scholar
19. Gosselin, RC, Carlin, AC, Dwyre, DM. Comparison of the BioRad variant and primus Ultra2 high-pressure liquid chromatography (HPLC) instruments for the detection of variant hemoglobins. Int J Lit Humanit 2011;33:159–67. https://doi.org/10.1111/j.1751-553x.2010.01260.x.Suche in Google Scholar
20. Greene, DN, Pyle, AL, Chang, JS, Hoke, C, Lorey, T. Comparison of Sebia Capillarys Flex capillary electrophoresis with the BioRad Variant II high pressure liquid chromatography in the evaluation of hemoglobinopathies. Clin Chim Acta 2012;413:1232–8. https://doi.org/10.1016/j.cca.2012.03.027.Suche in Google Scholar
© 2021 Müjgan Ercan Karadağ et al., published by De Gruyter, Berlin/Boston
Artikel in diesem Heft
- Frontmatter
- Editorial
- Turkish journal of biochemistry is an open access journal again
- Review Articles
- A critical review on human serum Paraoxonase-1 in the literature: truths and misconceptions
- The effect of platelet rich plasma on radiotherapy
- Research Articles
- TBS preanalytical phase working group survey study – preanalytical phase in coagulation laboratories
- Lymphocyte-to-C-reactive protein ratio may serve as an effective biomarker to determine COVID-19 disease severity
- Evaluation of the performance of sysmex XN-3100 automated hematology analyzer regarding the sysmex XE-2100 and microscopic examination
- Evaluation of four different HPLC devices for hemoglobinopathy screening
- Reticulocyte hemoglobin equivalent in differential diagnosis of iron deficiency, iron deficiency anemia and β thalassemia trait in children.
- Investigation of miR-144-3p expression levels in HbSS cases with high and normal HbF
- The effect of diurnal variation on erythrocyte sedimentation rate
- Inhibition of apoptosis may lead to the development of bortezomib resistance in multiple myeloma cancer cells
- The role of the delta neutrophil index in determining the etiology of neonatal sepsis
- Effect of transportation and freeze-thaw procedure on hemostatic tests
- A data analysis study: is there a relationship between 25(OH)D deficiency and iron-deficient anaemia in the pediatric population?
- case-report
- First observation of hemoglobin G-Norfolk in the Turkish population