Recycling fish skin for utilization in food industry as an effective emulsifier and foam stabilizing agent
-
Krishna Kant Kumar


Abstract
Background
Indian fish industry produces a staggering amount of waste every year part of which is dumped as landfill leading to pollution.
Objective
This study aims to extract collagen from fish skin, a major component of this waste, hydrolyze it and use the hydrolysate as emulsifiers to increase the shelf life of food products.
Materials and methods
Collagen was purified from the skin of Catfish, Mullet and Indian Salmon were characterized through infrared and diffraction studies. The samples were hydrolyzed enzymatically. The hydrolysates were assayed for emulsifying, foam stabilizing and hemolytic properties.
Results
The samples displayed an electrophoretic and infrared spectral profile corresponding to that of collagen type I. X-ray diffraction patterns revealed the presence of triple helix and traces of phosphate. The hydrolysates (6 kDa) exhibited the highest emulsion at 2.74±0.20 m2/g (for 57.00±0.50 min) and foam stability in the range of 75–78%, respectively. The hydrolysates were able to stabilize drug and food formulations successfully and two of the samples exhibited less than 3% toxicity as determined through hemolytic assay.
Conclusion
Collagen hydrolysates from fish skin, a common fish industry waste, were found to be bioactive and non-toxic making them suitable replacements for synthetic emulsifiers.
Öz
Amaç
Hintli balık endüstrisi, her yıl bir kısmı kirliliğe neden olan depolama sahası olarak terk edilmiş olan şaşırtıcı miktarda atık üretmektedir. Bu çalışma, balık derisinden kolajen ekstraktının, bu atığın önemli bir bileşeninin çıkarılmasını, hidrolize edilmesini ve hidrolizatın gıda ürünlerinin raf ömrünü uzatmak için emülsiyonlaştırıcılar olarak kullanmayı amaçlamaktadır.
Gereç ve Yöntemler
Kolajen, Kılçık, Mullet ve Hint Somon derisinden saflaştırılarak infrared ve difraksiyon çalışmaları yapıldı. Numuneler enzimatik olarak hidrolize edildi. Hidrolisatlar emülsiyonlaştırıcı, köpük stabilize edici ve hemolitik özellikler açısından analiz edilmiştir.
Tartışma
Örnekler, kolajen tip I’inkine karşılık gelen elektroforetik ve kızıl ötesi spektral profili gösterdi. X-ışını kırınım paternleri, üçlü sarmalın ve fosfat izlerinin varlığını ortaya koydu. Hidrolisatlar (6 kDa), en yüksek emülsiyonu sırasıyla% 75–78 aralığında 2.74±0.20 m2/g (57.00±0.50 dakika) ve köpük stabilitesinde sergilemiştir. Hidrolizatlar, ilaç ve gıda formülasyonlarını başarılı bir şekilde dengeleyebildi ve iki örnek, hemolitik analiz yoluyla belirlenen% 3’ten az toksisite sergiledi.
Sonuçlar
Balık derisinden elde edilen kollajen hidrolizatlar, yaygın bir balık sanayi atığının, biyoaktif ve toksik olmadığı, sentetik emülgatörler için uygun yer değiştirmeler yaptığı görülmüştür.
Introduction
India boasts of 7500 km long coastline, including 3 million hectares of reservoirs with access to high yielding fishing zones, making fish processing an exceptionally profitable trading commodity [1]. As per Government statistics, the fisheries sector exported 983,756 tonnes of processed products worth values 4.6 billion USD in 2013–2014 [2] and have contributed significantly to India’s economic growth. The food processing industry of India is ranked fifth in terms of production, consumption, export and expected growth [3]. Depending on the level of processing and the type of fish involved, raw fish is subjected to a series of steps which gradually removes an average of 50% material from it, before being packaged for the final sale. The fish processing industry, as a consequence, ends up generating a huge amount of waste materials, part of which is conventionally utilized to form isinglass and animal/fish feed [4], [5], [6]. The extracellular protein collagen prevalent in these wastes has been reported to contain dormant fragments within their sequences, that when excised out, display myriad physiological activity [7], [8], [9], [10]. Consequently collagen can be recycled from the waste, hydrolyzed to release bioactive fragments that can be utilized in emerging industries.
Existence of lipid based food is as primitive as early Bronze Age. Lipid based food are an amalgamation of oil and water and displays a high tendency to separate leading to rancidity. This can be inhibited by the application of a group of organic moieties termed as emulsifiers which interacts simultaneously with both oil and aqueous phases aiding in the formation of a stable emulsion. Synthetic emulsifiers like polysorbate-80 and carboxymethylcellulose are considered to be in the “Generally Regarded As Safe” (GRAS) category and are routinely used in commercially available food products [11]. However, most substances in the GRAS category which are deemed non-toxic and non-carcinogenic have not been tested for any side effects upon continuous consumption. It has also been reported that these synthetic emulsifiers act like detergents leading to disruption of the mucous membranes of the intestinal walls with subsequent disruption of micro-biome leading to increased inflammation [11]. Investigations have linked these synthetic additives to metabolic syndromes – including obesity, high blood pressure and type II diabetes [12].
Such impediments associated with synthetic emulsifiers have driven the current research towards natural emulsifiers that could reduce metabolic complications and provide health benefits to the consumer. A natural emulsifier needs to be non-immunogenic, non-toxic and should be able to display a level of activity that is equivalent to its synthetic counterpart. Collagen hydrolysate (CH) can be considered as a potential candidate for a natural emulsifier as it contains adequate amounts of both hydrophobic and hydrophilic residues and is known to be immunocompatible [13].
The present study attempts to assess the emulsification property of CHs obtained from Mullet, Catfish and Indian Salmon skin (henceforth referred to as MSK, CFSK and SLSK respectively), generally discarded as waste, so as to utilize them as food stabilizing agents.
Materials and methods
Materials
The chemicals used for the experiment were procured from various sources. Tris-HCl, N,N,N′,N′- tetramethylethylenediamine, Glycine, Methanol, Ammonium Persulfate and Bromophenol Blue were procured from Merck Ltd., USA. The cellulose membrane and Coomassie Brilliant Blue was procured from HiMedia Laboratories Pvt. Ltd., Mumbai, Maharashtra, India. All chemicals used for the assays were of analytical grade.
Collection of waste and Isolation of collagen
Skins of Mullet (Mugil cephalus), Catfish (Heteropneustus teropfossilis) and Indian Salmon (Eleutheronema tertradactylum) were collected from a fish market in Kumaraswamy Layout, Bengaluru, Karnataka. The skins were washed thoroughly with tap water and adhering muscles and bones were scraped off the skin using sterilized knife and forceps. Next, the dry weights of these skin samples were noted followed by fragmentation. Collagen was isolated from the fragmented pieces through acid dissolution and salt precipitation technique [10]. The details of the extraction process are displayed in the form of a flow scheme in Figure 1. Dry weight was noted after each step and the exact amount of collagen obtained with respect to the skin was calculated from the insoluble residue left after one complete round of extraction. The extracted collagen samples were dialyzed against 0.005 M acetic acid and the dialyzed samples were freeze-dried.

The process flow scheme outlines the protocol for collagen extraction.
Dry weight was noted after each step and the exact amount of collagen obtained with respect to the skin was calculated from the insoluble residue left after one complete round of extraction.
Characterization of purified collagen
UV-Vis Spectra of collagen
The UV-Vis absorption spectrum of extracted collagen samples CFSK, MSK and SLSK were recorded in the range of 200–400 nm using a Shimadzu spectrophotometer UV-240.
Electrophoretic profile of Collagen
The purity of CFSK, MSK and SLSK was confirmed by sodium dodecyl sulfate polyacrylamide gel electrophoresis (SDS-PAGE) using a 7% resolving gel against – rat tail tendon collagen (RTTC) [14]. The gel was run for 2 h at 50 mV and on completion was stained with Coomassie Brilliant Blue for 30 min and de-stained till collagen bands were distinctly visible.
Fourier Transform Infra-red spectral analysis of collagen
Fourier Transform Infra-red (FT-IR) spectroscopy of lyophilized CFSK, MSK and SLSK were performed using a Bio-Rad FT-IR- 40 model, USA. Samples (2 mg) were mixed with 100 mg of dried potassium bromide (KBr), and compressed to form as a salt disc (10 mm in diameter) for reading the spectrum.
X-ray diffraction pattern of collagen
X-ray diffraction (XRD) patterns of CFSK, MSK and SLSK were obtained using a Rigaku Ultimate IV machine with CuKα radiation from a rotating anode generator operated at 35 kV and 20 mA in the range of 2θ=10°–70°. The scanning step was 0.02° while the scanning speed was 2°/min. Peaks obtained were matched against standard XRD peaks of collagen.
Elution profile of collagen
An AKTA Prime Fast Protein Liquid Chromatography unit was used for obtaining sample elution pattern following standard protocol [15]. Individual samples (CFSK, MSK and SLSK) were loaded into a 1.5×13 cm Sephadex G100 column and elution was carried out at the flow rate of 1.0 mL/min. Absorbance was taken at 280 nm and fractions of 3 mL were collected. The column was calibrated using standard markers. The molecular weight of collagen samples were calculated by plotting their elution time in the standard calibration line. The purified collagen was stored to be used for hydrolysis.
Enzymatic hydrolysis of purified collagen samples
Collagenase type I, extracted from Clostridium histolyticum, was used to fragment the purified collagen samples. The enzyme was mixed with the substrate (intact collagen) in 0.1 M pH 7 phosphate buffer in the ratio 1:500 and the mixture was sealed at 37°C for 24 h. After the incubation period, the mixture was heated to deactivate the enzyme and CH was extracted with 0.5 M acetate buffer.
Characterization of extracted CH
Electrophoretic band patterns were obtained by running the Catfish skin collagen hydrolysate (CFCH), Mullet skin collagen hydrolysate (MCH), Indian Salmon skin collagen hydrolysate (SLCH) samples in 10% SDS-PAGE gel along with a standard marker for molecular weight determination. Staining and destaining was done as before.
Bioactivity of CH
Emulsification assay
Emulsifying capacity was determined according to previous methods [16] using soya bean oil and 0.5 M phosphate buffer as the lipophilic and hydrophilic phases, respectively, with CH acting as the emulsifier. The emulsification activity and stability were calculated using the formula as given below.
Where, EAI is emulsification activity index, A is the absorbance at 520 nm; c is the protein concentration (g/mL); θ is the disperse phase volume fraction (0.25); and p is the optical path (0.01 m).
Where, ESI is the Emulsion Stability Index, A0 is the absorbance at 520 nm at time 0 min; A10 is the absorbance at 520 nm at time 10 min; and t is the time difference. Poly ethylene glycol (PEG), a known emulsifier was used as the positive control (PC) while intact collagen sample was used as the negative control (NC).
Foaming stability
Foaming Stability was determined according to the previous methodology [17] using soya bean oil and 0.05 M phosphate buffer as the lipophilic and hydrophilic phases, respectively, with CH acting as the emulsifier. This emulsion was vortexed at 10,000 rpm for 1 min and the foam volume was noted at 5th, 10th and 30th min. The foam stability index (FSI) was calculated using the formula given below:
PEG was used as the PC while intact collagen sample was used as the NC.
In vitro diffusion assay of CH
The CH samples were tested for the strength of the emulsion formed through an in vitro diffusion assay. Atorvastatin, a sparingly soluble drug was dissolved in methanol at a concentration of 150 mg mL−1 and the volume was made up to 6 mL with phosphate buffer, pH 7. CH (2.5 mg mL−1) was added in an equal volume ratio to the drug suspension and homogenized to create the emulsion. PEG and intact collagen were used as the positive and NCs, respectively. The emulsion was dispensed inside a dialysis bag, clamped and placed inside a dialysis chamber containing 800 mL 0.2% methanol as the dialysis medium. Aliquots of 5 mL were removed from the medium at 1 h interval, suitably diluted and checked for the drug by a UV-visible Spectrophotometer (Shimadzu 8400) at 244 nm. The absorbance was matched with a standard dilution series of the drug to find the amount diffused out. The medium was replaced with the same solution to maintain a constant volume. The % of diffusion was calculated by the following equation
Where Test represents the amount obtained from the dialysis medium in mg. The assay was conducted in triplicates.
Hemolytic assay of CH
Hemolytic assay was performed as per standard protocol [18] with fresh blood sample. Hemolysis percentage was calculated using the formula given below:
Where At is the absorbance of the test sample, Apc and Anc are the absorbance of PC and NC, respectively. Cells incubated with Tween 20 were used as the PC while cells incubated with glycine were used as the NC.
Food emulsion stability assay
MCH was chosen for the food emulsion stability assay based on its efficient emulsion stability and low toxicity as seen in hemolytic assay. Jelly and coconut paste, two common household food items were chosen for the analysis. The food items were mixed with MCH (in phosphate buffer) at a ratio of 100:1. As control, only phosphate buffer was added to the food. Food mixed with intact collagen was taken as the NC and glycine – added food was taken as the PC. The samples were kept for 4 weeks at room temperature in a closed-lid container. Triplicates were used for each sample. A fixed volume of sample (500 μL) was aspirated every 24 h while maintaining sterile conditions. The aliquot was diluted with deionized water and absorbance read in a spectrophotometer. A second assay was performed in which the same set of samples were stored in the refrigerator for 4 weeks and emulsion stability was checked once a week as mentioned above.
Statistical assay
The emulsification, foam stability, drug diffusion, hemolytic and food stability assay were performed in triplicates. Values were checked with two way ANOVA and p-values<0.05 were considered as significant.
Results
Extraction and characterization of collagen
The extraction efficiency of collagen is shown in Table 1. As seen from the table, the total yield of collagen from fish skin was restricted to about 3–14% with highest amount (13.7%) extracted from MSK. Spectrophotometric analysis of the fish skin samples revealed a diminished peak at 280 nm and a significantly high peak at 220 nm which is a characteristic for collagen type I (not shown in figure). The SDS-PAGE pattern of CFSK and MSK displayed a double band of α1 and α2, along with repeating β and γ bands of higher molecular weights, specific to collagen type I (Figure 2, lane 1 and 2). The band pattern matched with that of RTTC (lane 3) used as a standard to identify collagen type I. The molecular weight of the α1 chain from collagen was found out to be 121.13 kDa, while the α2 chain value was 117.51 kDa.
Extraction efficiency of collagen from Catfish, Mullet and Indian Salmon.
| Skin sample | W1 (g) dry weight | W2 (g) | W3 (g) | W4 (g) | Insoluble material W5 (g) | Soluble collagen (g) W5–W4 | % Collagen (wt/g of skin) [(W5–W4)/W1]×100 | ||||
|---|---|---|---|---|---|---|---|---|---|---|---|
| Catfish | 48.8 | NaOH | 42.5 | Butanol | 30.5 | EDTA | 15.6 | Acetic acid | 13.65 | 1.95 | 3.9 |
| Mullet | 61.2 | 55.5 | 44.4 | 36.25 | 20.85 | 8.4 | 13.7 | ||||
| Indian Salmon | 35.4 | 29.8 | 18.5 | 14.2 | 10.3 | 3.9 | 11.0 |

Electrophoretic profile of extracted collagen samples; CFSK (Lane 1), MSK (Lane 2) and positive control, rat tail tendon collagen (Lane 3).
The α1 and α2 bands along with higher order β and γ bands are visible.
The FT-IR spectrum of CFSK, MSK and SLSK, as displayed in Figure 3, depicted multiple peaks corresponding to the presence of collagen. The peak details and their corresponding bond vibrations are given in Table 2. XRD was used to investigate the collagen fibril distribution. Figure 4A and B shows the X-ray spectrum of the lyophilized MSK and SLSK, respectively. The following peaks could be distinctly identified in both samples: 110 (18.82°), 200 (21.76°), 111 (22.85°), 211 (31.7°), 112 (32.8°), 300 (32.9°), 311 (41.99°), 312 (48.07°), 402 (52.07°) and 004 (53.17°).

FT-IR bands of collagen samples CFSK, MSK and SLSK.
Along with typical peaks from collagen, minor peaks of phosphate were also observed.
FT-IR Peaks and their corresponding functional groups.
| Peaks (cm−1) | Vibrations |
|---|---|
| 1038 | P-O asymmetric stretching |
| 1240 | Amide III – NH stretching |
| 1337 | CH2 wagging of proline |
| 1556 | Amide II – NH stretching |
| 1634 | Amide I – C-O stretching |
| 2786 | Amide B – CH2 symmetrical stretch |
| 3362 | Amide A – NH stretch coupled with hydrogen bonding |

X-ray spectrum data of the lyophilized collagen from (A) Mullet and (B) Salmon skin.
Major peaks correspond to the presence of collagen along with minor amounts of hydroxyapatite.
The CFSK, MSK and SLSK samples eluted with a minor peak at 7.5±1.5 min and a major peak at 19±02 min in sephadex G100, as exhibited in Figure 5, indicating the collagen to be of type I. The molecular weight of the major peak was found out to be 121±3.5 kDa, by correlating with known markers eluted through the column.
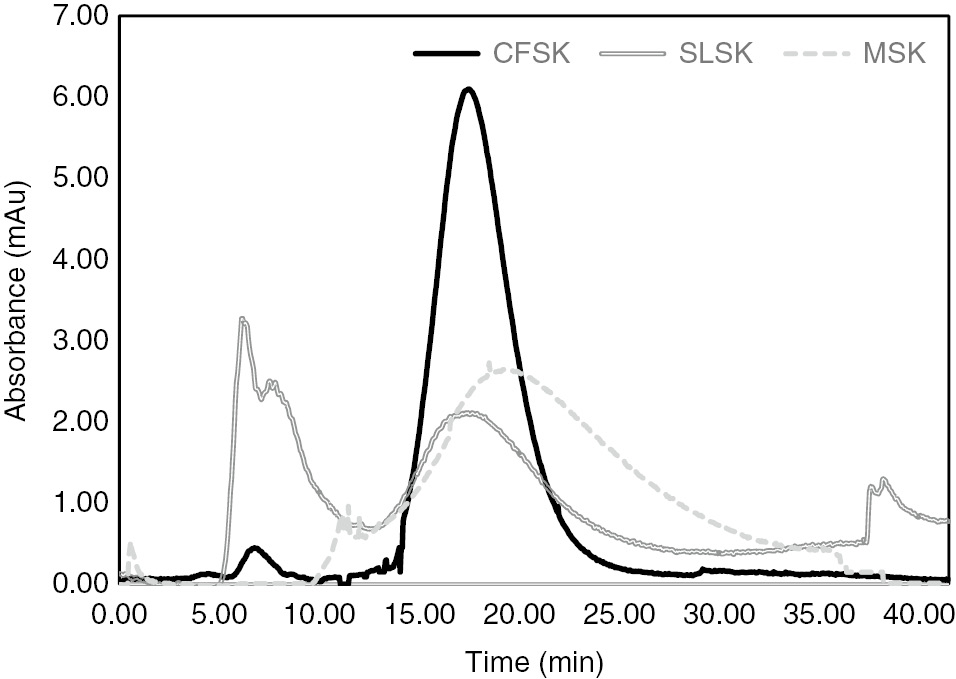
Gel permeation chromatography of collagen samples showing a minor and major peak for the aggregated polypeptides (β band) and individual α chains, respectively.
Note the slight higher absorbance for CFSK indicating presence of more tyrosine residues when compared to SLSK and MSK.
Electrophoretic profile of CH
Hydrolysis was confirmed with the absence of higher order bands and the presence of low molecular weight bands as displayed in Figure 6. A graph was plotted with molecular weights of the marker against distance moved and the hydrolysates were found to exhibit a molecular weight of 6 kDa.

SDS-PAGE of collagen hydrolysates (Lane 1: MCH, Lane 2: CFCH, Lane 3: SLCH, Lane 4: RTTC hydrolysate) run against standard marker in Lane 5.
Bioactivity of CH
Emulsification assay of CH
The results of the emulsification assay are displayed in Figure 7A and B

. The EAI and ESI of CH were calculated from difference in absorbance at 0th min and 10th min. At low concentrations (0.005%), MCH and CFCH displayed similar emulsifying ability, followed by SLCH. However, at a higher concentration (0.05%), MCH displayed significantly high (p<0.05) emulsion stability when compared to CFCH and SLCH.
All three samples displayed similar ESI at low concentrations and the time duration of emulsion stability (30 min) was about 50% that of the PC. However, at high concentration (0.05%), CFCH could stabilize the emulsion for more than 50 min, which was significantly higher (p<0.05) than SLCH and MCH, both of which displayed similar stability time of 22–25 min. Interestingly, the PC exhibited significantly lower ESI at a concentration of 0.05%, possibly because of low solubility and miscibility.
Overall, the CH samples displayed significantly higher EAI and ESI than the intact collagen, used as the NC.
Foam stability assay of CH
It was found that the CH could significantly (p<0.05) stabilize foam volume when compared to the intact collagen sample (MSK) as shown in Figure 8. All three samples CFCH, MCH and SLCH (at 0.05%) displayed retention of 75–78% of foam volume after 30 min.

FSI value of CH with intact collagen (MSK) for comparison.
In vitro diffusion assay of CH
As exhibited in Table 3, the rate of diffusion of the drug from the emulsion was significantly lowered (p<0.05) by the addition of CFCH. Interestingly, the rate was analogous to that of the diffusion rate from PEG emulsion, indicating an emulsion stability equivalent to a known emulsification agent.
Results of the drug diffusion assay.
| Time (h) | % Diffusion | ||
|---|---|---|---|
| Free drug | PEG | CFCH | |
| 0 | 0±0 | 0±0 | 0±0 |
| 1 | 0.4±0.6 | 0±0 | 0±0 |
| 2 | 2.1±0.4 | 0±0 | 0±0 |
| 3 | 4.8±0.2 | 1.5±0.7 | 0±0 |
| 4 | 9.5±1.2 | 2.2±0.3 | 0±0 |
| 5 | 18.4±2.7 | 3.1±0.3 | 1.4±0.2 |
| 6 | 32.0±3.5 | 3.5±0.4 | 3.9±0.3 |
| 7 | 48.0±2.0 | 4.8±1.5 | 5.6±0.3 |
| 8 | 54.0±2.6 | 5.1±0.9 | 6.8±0.4 |
The columns (from the left) indicate the % of drug leaching out of the emulsion for the free drug, PEG (used as PC) and CFCH.
Toxicity assay of CH
As observed from Figure 9, the hemolysis percentage of CFCH, MCH and SLCH samples at concentration of 2.5% (w/v) was 12.40±1.01, 1.08±1.06 and 2.77±0.85%, respectively.

Hemolytic activity of CH at a concentration of 2.5% with cells incubated with glycine and Tween 20 as NC and PC, respectively.
Food stability assay
The activity of the CH samples on food stability was analyzed in both refrigerated and non refrigerated condition. As seen in Figure 10A–D, jelly mixed with intact collagen (used as NC) and glycine (used as PC) displayed increasing absorbance indicating enhanced breakdown of the emulsion. However, the food mixed with MCH showed a constant absorbance indicating a stable emulsion for 4 days in non refrigerated condition. Similar results were obtained with refrigerated experimental set-ups. The emulsion and texture of the CH mixed food was found to be stable for up to 4 weeks while other samples displayed a gradual loss in stability.
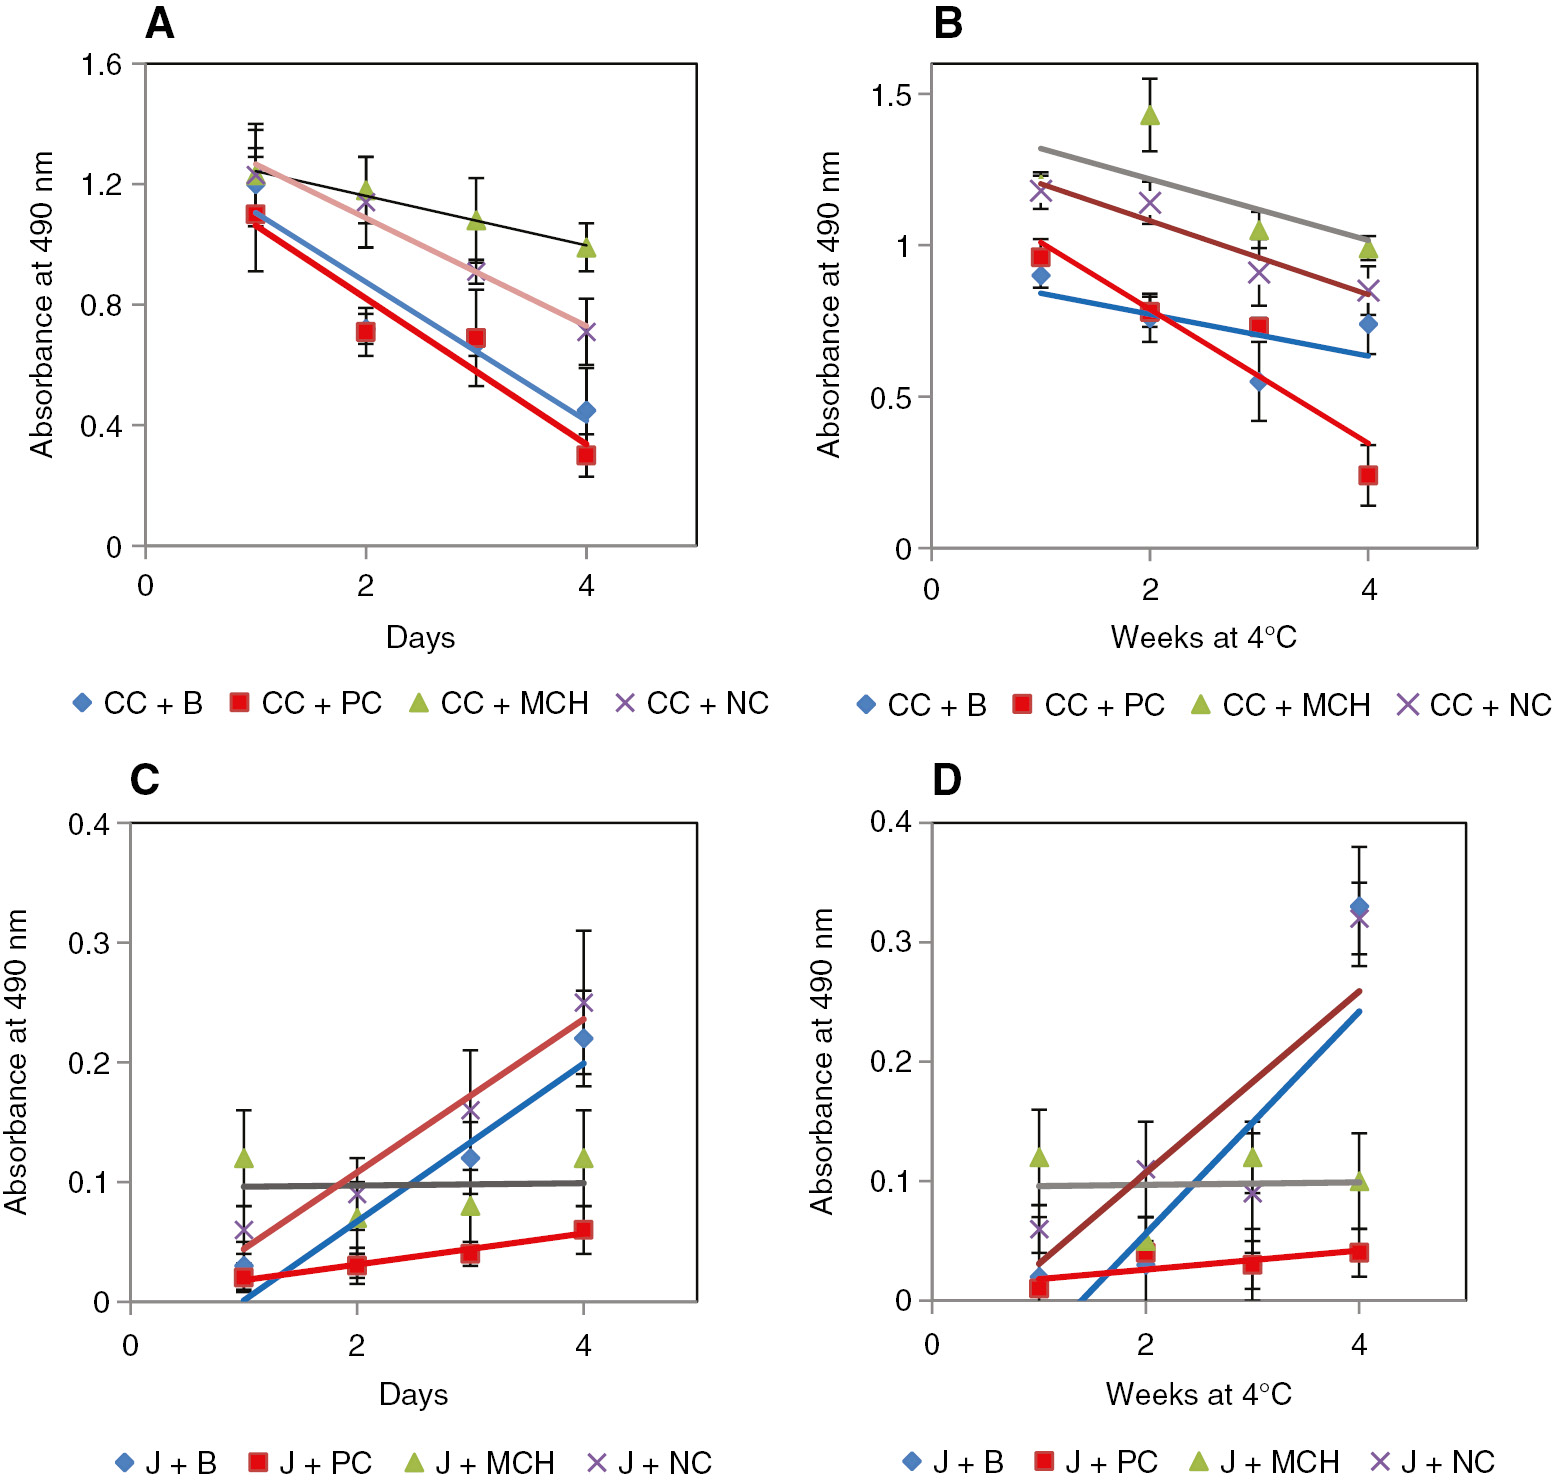
Food stability assay results with MCH as the test sample, phosphate buffer as blank-B, glycine as PC and MSK as NC.
The emulsions tested were (A) coconut chutney, represented as CC, kept at room temperature (B) CC kept at 4°C, (C) jelly, represented as J kept at room temperature and (D) J kept at 4°C. The MCH displayed emulsion stability equivalent to that of PC.
Discussion
Extraction and characterization of collagen
As displayed in the process flow scheme, collagen is extracted by treating the skin samples with NaOH, 10% butanol and EDTA to remove non-collagenous proteins, fat and minerals, respectively. The resultant residue is subjected to acetic acid dissolution to obtain pure acid-soluble collagen. The % collagen obtained in the study (3.9–13.7%) was lower than that obtained from Egyptian Nile Tilapia (Oreochromis niloticus) scales [19] and Yellowfin tuna (Thunnus albacares) skin [20] which yielded 23.0 and 27.1% collagen, respectively, and similar to that of jumbo squid (Docidicus gigas) [21] and big-eye snapper (Priacathustayenus) [22] which yielded 5% and 11% collagen, respectively. The difference in collagen yield obtained in this study was due to the extraction method administered and the variation in quality, age and type of fish [23].
The electrophoretic profile of the extracted collagen samples exhibited a double band at 121.13 and 117.51 kDa in accordance with the relative arrangement of α chains in collagen type I, the most abundant type of collagen in skin. Each tropocollagen unit of collagen type I comprises of a triple helix consisting of two α1 chains and one α2 chain [(α1)2(α2)1]. This unequal distribution pattern of α chains leads to α1 (121.13 kDa) displaying a stronger band intensity than that of α2 (117.51 kDa) [24]. The high recoiling tendency of collagen α chains forms inter chain associations resulting in high molecular weight β and γ bands.
FT-IR studies reveal specific vibration bands characteristic of peptide bonds and side chain groups. The isolated samples displayed the band regions characteristic to that of collagen, including Amide I, II, A, B and C [25], [26], [27]. The XRD peaks showed that this protein had ordered structure snippet, confirming presence of stable triple helical collagen fibril [28], [29]. However, both XRD and FT-IR data revealed that the collagen sample was contaminated with residual phosphate group. Hence, the collagen was purified by running in gel permeation column before converting it into hydrolysate.
The major gel permeation elution peak, as shown in Figure 5, was due to the presence of non-aggregated α chains in the molecular weight range 118–125 kDa. The minor initial elution peak is a result of the aggregation of α1 and α2 polypeptide chains to form the β and γ bands. Similar elution patterns have been observed for collagen extracted from big eye snapper [22] and skin of tilapia [24]. Even though equal amounts of the collagen samples were run in FPLC, CFSK displayed a higher absorbance peak indicating presence of comparatively higher tyrosine and tryptophan (hydrophilic aromatic residues) with respect to the other two collagens – SLSK and MSK.
Activity of CH
Protein hydrolysates, including that of collagen are surface-active materials and promote an oil-in-water emulsion because of comparatively higher abundance of hydrophobic groups [30], [31]. Fragmentation of protein also increases the number of exposed N- and C-terminals consequently increasing the hydrophilicity of collagen. This provides a balance between abundance of hydrophobic and hydrophilic residues allowing the CH to act as an effective emulsifier.
The samples CFCH and MCH showed better EAI when compared with SLCH at 0.05%. All three samples displayed EAI almost equal to that of eel skin gelatin, −63.97% at 2% concentration [32] but less than Spanish mackerel CH −97.44±1.76% at 1% concentration [33]. All three CH samples could retain >75% foam volume for over 30 min, which was significantly better than Spanish mackerel CH with a reported 65.27% foam retention [33].
The three samples, CFCH, MCH and SLCH exhibited better ESI and FSI when compared to EAI, which indicated that the CH could stabilize low emulsion/foam volumes but for a longer duration when compared to a standard emulsifier. The interesting thing was that even though all three samples contained collagen type I fragments, differences in activity were noticeable. This is because, even though collagen type I is conserved throughout the animal kingdom, minute discrepancies in sequences do exist based on the type of fish. The number of cross links will also be more in older fishes leading to lower availability of specific sequences. These events lead to change in the hydrophilic to hydrophobic residue ratio in fish-extracted collagen resulting in slight changes in emulsion stabilization properties. Another interesting pattern that could be traced is that the activity of hydrolysates did not entirely correlate with its concentration. The lowering of activity at higher concentrations in most cases was due to the fact that at higher concentrations, the peptides of a CH exhibits a tendency to coil with each other [10], [15], thus effectively reducing its interaction with both aqueous and oil phases. This tendency increases with increasing abundance of hydrophobic residues in the CH, as observed for MCH and SLCH. However, the effect was not observable in CFCH, possibly because of slightly lower amount of hydrophobic residues and higher hydrophilic residues as indicated by the increased absorbance during elution (Figure 4).
To summarize, the amount of CH used in a particular emulsion is of paramount interest – it should not be too low, lest it does not form a stable emulsifier nor too high so that it may recoil and destabilize the emulsion.
The diffusion assay revealed that the CFCH could successfully maintain the drug emulsion with the lowest value of 6.75% leakage in 8 h. Thus the samples could be used as drug encapsulation agents or time capsules that would stabilize a drug in vivo and initiate controlled release, increasing its bio availability. The food stability assay was performed using a spectrophotometer to monitor the stability of the emulsion formed by MCH over a fixed time period. The CH was able to sustain the emulsion as long as the PC, substantiating the earlier results obtained with soya bean oil and in the diffusion assay. Both assays confirm the unsurpassable potential of skin CH as an emulsifying agent.
The Food and Drug Administration mandates that every compound added to food has to be tested for toxicity. The samples SLCH and MCH displayed less than 3% erythrocyte breakdown after 30 min of incubation with whole blood, proving their low hemolytic tendencies.
Conclusion
Hydrolysate-based emulsifiers are a promising alternative over their chemical counterparts due to their high efficiency, biodegradability and low toxicity. Based on the relative ease of extraction and the high emulsion/foam stability of CH as seen in this study, it can be concluded that Mullet and Indian Salmon skin are safe to be used as food stabilizing agents.
Acknowledgements
The authors are thankful to Vision Group on Science and Technology (Grant Number: 316), Government of Karnataka for funding the study. The authors also express their gratitude to Dayananda Sagar University where the work was carried out.
Conflict of interest: The authors declare that they do not have any conflict of interest.
References
1. Nayak S. Coastal zone management in India−present status and future needs. Geo Spat Inf Sci 2017;20:174–83.10.1080/10095020.2017.1333715Search in Google Scholar
2. Handbook on Fisheries Statistics. Department of Animal Husbandry, Dairying and Fisheries, 2014.Search in Google Scholar
3. Food Processing, Indian Brand Equity Foundation [IBEF], 2017.Search in Google Scholar
4. Zynudheen AA. Utilization of fishery waste in India. Central Institute of Fisheries Technology, Cochin 682089, 2010.Search in Google Scholar
5. FAO – The State of World Fisheries and Aquaculture 2014, United Nations, 2014.Search in Google Scholar
6. Das J, Banerjee P. Matsyavatar: a modern outlook of a mythological tale. LS: Int J Life Sci 2015;4:77.10.5958/2319-1198.2015.00011.1Search in Google Scholar
7. Saiga-Egusa A, Iwai K, Hayakawa T, Takahata Y, Morimatsu F. Antihypertensive effects and endothelial progenitor cell activation by intake of chicken collagen hydrolysate in pre- and mild-hypertension. Biosci Biotechnol Biochem 2009;73:422–4.10.1271/bbb.80189Search in Google Scholar PubMed
8. Saito M, Kiyose C, Higuchi T, Uchida N, Suzuki H. Effect of collagen hydrolysates from Salmon and Trout skins on the lipid profile in Rats. J Agric Food Chem 2009;57:10477–82.10.1021/jf902355mSearch in Google Scholar PubMed
9. Gómez-Guillén MC, Giménez B, López-Caballero ME, Montero MP. Functional and bioactive properties of collagen and gelatin from alternative sources: a review. Food Hydrocoll 2011;25:1813–27.10.1016/j.foodhyd.2011.02.007Search in Google Scholar
10. Banerjee P, Suseela G, Shanthi C. Isolation and identification of cryptic bioactive regions in bovine achilles tendon collagen. Protein J 2012;31:374–86.10.1007/s10930-012-9415-8Search in Google Scholar PubMed
11. Chassaing B, Koren O, Goodrich JK, Poole AC, Srinivasan S, Ley RE, et al. Dietary emulsifiers impact the mouse gut microbiota promoting colitis and metabolic syndrome. Nature 2015;519:92–6.10.1038/nature14232Search in Google Scholar PubMed PubMed Central
12. Suez J, Korem T, Zeevi D, Zilberman-Schapira G, Thaiss CA, Maza O, et al. Artificial sweeteners induce glucose intolerance by altering the gut microbiota. Nature 2014;514:181–6.10.1038/nature13793Search in Google Scholar PubMed
13. Zague V. A new view concerning the effects of collagen hydrolysate intake on skin properties. Arch Dermatol Res 2008;300:479–83.10.1007/s00403-008-0888-4Search in Google Scholar PubMed
14. Laemmli UK. Cleavage of structural proteins during the assembly of the head of bacteriophage T4. Nature 1970;227:680–5.10.1038/227680a0Search in Google Scholar PubMed
15. Das J, Dey P, Chakraborty T, Saleem K, Nagendra R, Banerjee P. Utilization of marine industry waste derived collagen hydrolysate as peroxide inhibition agents in lipid-based food. J Food Process Preserv 2018;42:e13430.10.1111/jfpp.13430Search in Google Scholar
16. Pearce KN, Kinsella JE. Emulsifying properties of proteins: evaluation of a turbidimetric technique. J Agric Food Chem 1978;26:716–23.10.1021/jf60217a041Search in Google Scholar
17. Mutilangi WA, Panyam D, Kilara A. Functional properties of hydrolysates from proteolysis of heat-denatured whey protein isolate. J Food Sci 1996;61:270–4.10.1111/j.1365-2621.1996.tb14174.xSearch in Google Scholar
18. Wang JH, Mizuta S, Yokoyama Y, Yoshinaka R. Purification and characterization of molecular species of collagen in the skin of Skate (Raja kenoji). Food Chem 2007;100:921–5.10.1016/j.foodchem.2005.10.046Search in Google Scholar
19. El-Rashidy AA, Gad A, Abu-Hussein AE, Habib SI, Badr NA, Hashem AA. Chemical and biological evaluation of Egyptian Nile Tilapia (Oreochromis niloticas) fish scale collagen. Int J Biol Macromol 2015;79:618–26.10.1016/j.ijbiomac.2015.05.019Search in Google Scholar PubMed
20. Woo JW, Yu SJ, Cho SM, Lee YB, Kim SB. Extraction optimization and properties of collagen from yellowfin tuna (Thunnus albacares) dorsal skin. Food Hydrocoll 2008;22:879–87.10.1016/j.foodhyd.2007.04.015Search in Google Scholar
21. Uriarte-Montoya MH, Arias-Moscoso JL, Plascencia-Jatomea M, Santacruz-Ortega M, Rouzaud-Sández O, Cardenas-Lopez JL, et al. Jumbo squid (Dosidicus gigas) mantle collagen: extraction, characterization, and potential application in the preparation of chitosan–collagen biofilms. Bioresour Technol 2010;101: 4212–9.10.1016/j.biortech.2010.01.008Search in Google Scholar PubMed
22. Kittiphattanabawon P, Benjakul S, Visessanguan W, Nagai T, Tanaka M. Characterisation of acid-soluble collagen from skin and bone of bigeye snapper (Priacanthus tayenus). Food Chem 2005;89:363–72.10.1016/j.foodchem.2004.02.042Search in Google Scholar
23. Songchotikunpan P, Tattiyakul J, Supaphol P. Extraction and electrospinning of gelatin from fish skin. Int J Biol Macromol 2008;42:247–55.10.1016/j.ijbiomac.2007.11.005Search in Google Scholar PubMed
24. Sun L, Hou H, Li B, Zhang Y. Characterization of acid- and pepsin-soluble collagen extracted from the skin of Nile tilapia (Oreochromis niloticus). Int J Biol Macromol 2017;99:8–14.10.1016/j.ijbiomac.2017.02.057Search in Google Scholar PubMed
25. Paschalis EP, Verdelis K, Doty SB, Boskey AL, Mendelsohn R, Yamauchi M. Spectroscopic characterization of collagen cross-links in bone. J Bone Miner Res 2001;16:1821–8.10.1359/jbmr.2001.16.10.1821Search in Google Scholar
26. Muyonga JH, Cole CG, Duodu KG. Characterisation of acid soluble collagen from skins of young and adult Nile perch (Lates niloticus). Food Chem 2004;85:81–9.10.1016/j.foodchem.2003.06.006Search in Google Scholar
27. Nagai T, Yamashita E, Taniguchi K, Kanamori N, Suzuki N. Isolation and characterisation of collagen from the outer skin waste material of cuttlefish (Sepia lycidas). Food Chem 2001;72:425–9.10.1016/S0308-8146(00)00249-1Search in Google Scholar
28. Hu L, Xiao Y, Fang M, Gao Y, Huang L, Jia A, et al. Effects of type I collagen degradation on the durability of three adhesive systems in the early phase of dentin bonding. PLoS One 2015;10:e0116790.10.1371/journal.pone.0116790Search in Google Scholar PubMed PubMed Central
29. Mendes LC, Ribeiro GL, Marques RC. In situ hydroxyapatite synthesis: influence of collagen on its structural and morphological characteristic. Mat Sci Appl 2012;3:580–6.10.4236/msa.2012.38083Search in Google Scholar
30. Gbogouri GA, Linder M, Fanni J, Parmentier M. Influence of hydrolysis degree on the functional properties of Salmon byproducts hydrolysates. J Food Sci 2004;69:C615–22.10.1111/j.1365-2621.2004.tb09909.xSearch in Google Scholar
31. Kristinsson HG, Rasco BA. Fish protein hydrolysates: production, biochemical, and functional properties. Crit Rev Food Sci Nutr 2000;40:43–81.10.1080/10408690091189266Search in Google Scholar PubMed
32. Nurul AG, Sarbon NM. Effects of pH on functional, rheological and structural properties of eel (Monopterus sp.) skin gelatin compared to bovine gelatin. Int Food Res J 2015;22:572–83.Search in Google Scholar
33. Chi CF, Cao ZH, Wang B, Hu FY, Li ZR, Zhang B. Antioxidant and functional properties of collagen hydrolysates from Spanish Mackerel skin as influenced by average molecular weight. Molecules 2014;19:11211–30.10.3390/molecules190811211Search in Google Scholar PubMed PubMed Central
©2019 Walter de Gruyter GmbH, Berlin/Boston
Articles in the same Issue
- Frontmatter
- Short Communication
- Acetone-water mixture is a competent solvent to extract phenolics and antioxidants from four organs of Eucalyptus camaldulensis
- Research Articles
- Proteases from Calotropis gigantea stem, leaf and calli as milk coagulant source
- A new method to quantify atmospheric Poaceae pollen DNA based on the trnT-F cpDNA region
- Expression of a functional recombinant vascular endothelial growth factor 165 (VEGF165) in Arabidopsis thaliana
- Computational exploration of antiviral activity of phytochemicals against NS2B/NS3 proteases from dengue virus
- Investigation of antioxidant, cytotoxic, tyrosinase inhibitory activities, and phenolic profiles of green, white, and black teas
- DFR and PAL gene transcription and their correlation with anthocyanin accumulation in Rhodomyrtus tomentosa (Aiton.) Hassk.
- Comparison of phenolic profiles and antioxidant activity of three Ornithogalum L. species
- Increasing the fermentation efficiency of Lactobacillus paracasei ssp. paracasei MIUG BL6 in a rye flour sourdough
- Determination of chemical composition, antibacterial and antioxidant properties of products obtained from carob and honey locust
- Chitinolytic Bacillus subtilis Ege-B-1.19 as a biocontrol agent against mycotoxigenic and phytopathogenic fungi
- Recycling fish skin for utilization in food industry as an effective emulsifier and foam stabilizing agent
- A novel, thermotolerant, extracellular PHB depolymerase producer Paenibacillus alvei PHB28 for bioremediation of biodegradable plastics
- Post-transcriptional regulation of miRNA-15a and miRNA-15b on VEGFR gene and deer antler cell proliferation
- Comparison of pendimethalin binding properties of serum albumins from various mammalian species
- Crocin (active constituent of saffron) improves CCl4-induced liver damage by modulating oxidative stress in rats
- Time dependent change of ethanol consumption biomarkers, ethyl glucuronide and ethyl sulphate, after single dose ethanol intake
- GC-MS analysis and biological activities of Thymus vulgaris and Mentha arvensis essential oil
- Immobilization and some application of α-amylase purified from Rhizoctonia solani AG-4 strain ZB-34
- Letter to the Editor
- Molecular crosstalk between Hog1 and calcium/CaM signaling