The use of six sigma methodology to evaluate the analytical performances of clinical chemistry analyzers
-
Özlem Gülbahar
 ,
Murat Kocabıyık
,
Murat Kocabıyık

Abstract
Introduction
In our study, we aimed to evaluate the analytical process performances of the biochemistry tests in the analysis systems that were widely used in the clinical laboratories by using the six-sigma methodology.
Methods
The analytical performances of four different analytical platforms (Beckman Coulter-Olympus AU2700, Abbott-Architect C8000, Roche-Cobas 8000, and Siemens-ADVIA 2400) running 18 biochemical tests (urea, creatinine, uric acid, total bilirubin, AST, ALT, ALP, LDH, HDL-C, Ca2+, cholesterol, TG, glucose, total protein, albumin, Na+, K+, and Cl−) were evaluated. Biases and CV were obtained from internal quality control programs. The performance of each instrument was assessed using the σ scale; the benchmark performance was <3 σ (improvement needed); “world-class” quality was six sigma.
Results
The parameters that have σ≥6 which means in world class are HDL-C and ALP in all four systems, while only Na+ has σ<3 which point out the need to develop. Similarities and differences were found between systems for analytical process sigma values of all tests except these.
Discussion and conclusion
To improvement and monitoring of the analytical process performance as a part of total quality of a clinical laboratory to provide continuous improving, sigma levels can be used as it is a reliable method.
Özet
Giriş ve amaç
Çalışmamızda, klinik laboratuvarlarda en çok kullanılan biyokimya testlerine ait analiz sistemlerinin analitik süreç performanslarını altı sigma metodolojisi kullanarak değerlendirmeyi amaçladık.
Yöntem ve gereçler
Çalışmada, benzer kapasiteye sahip farklı klinik laboratuvarlarda çalışılan 18 biyokimya testi için (üre, kreatinin, urik asit, total bilirubin, AST, ALT, ALP, LDH, HDL-C, Ca2+, kolesterol, TG, glukoz, total protein, albumin, Na+, K+, Cl−) 4 farklı sistemin (Beckman Coulter-Olympus AU2700, Abbott-Architect C8000, Roche-Cobas 8000 and Siemens- ADVIA 2400) analitik süreç performansları aynı anda değerlendirildi. Sigma düzeyleri hesaplanırken bias ve %CV için internal kalite kontrol programları kullanıldı. Analitik süreç performansı six sigma metodolojisi kullanılarak σ skalası temelinde değerlendirildi. Sigma düzeyi ≥6 olan parametrelerin analitik süreç performansının “dünya klasında” kaliteye sahip olduğu, σ<3 olan parametrelerin analitik süreç performansının ise “geliştirilmesi gereken” kalitede olduğu kabul edildi.
Bulgular
Dört sistemde de σ≥6 olan testler HDL-C ve ALP iken, σ<3 olan tek test Na+ olarak tespit edildi. Diğer testlerin analitik süreç sigma düzeylerinde sistemler arasında benzerlikler ve farklılıklar mevcuttu.
Tartişma ve sonuç
Klinik laboratuvarların toplam kalitesinin parçası olan analitik performasın değerlendirilmesi, geliştirilmesi ve takip edilmesinde güvenilir bir yöntem olan sigma metodolojisi kullanılabilir.
Introduction
Medical errors can gravely compromise patient outcomes [1]. In a similar vein, laboratory errors significantly impact patient safety [2]. The number of such errors actually reported is only a small percentage of the real number, and the consequences (in terms of patient outcomes) are probably worse than currently described [3]. Six sigma methodology can be used to measure errors, identify processes that need to be improved (thus, contributing to total quality management), and continuously monitor quality [4], [5]. In all projects and process improvements with six sigma tools, the road map that should be followed is expressed as: “define, measure, analyze, improve and control stages” (DMAIC) [3]. As a result, when the sigma value of the analyzed process is low, the error sources can be established by investigating the causes. Thus, contributing to the enhancement of process, quality can be ensured by determining correction and improvements for the error sources. Then, sigma values are measured again and continuous improvement efforts are performed. Total quality improvement of the laboratory can be ensured with this methodology by using these different processes separately to provide a holistic perspective as a means of DMAIC approach. Consequently, the six-sigma methodology improves quality, reduces errors and costs, and satisfies customer expectations [5]. Six sigma which aims to improve assay quality is a quality management procedure by determining inaccurate and/or imprecise tests. Thereby, proper quality monitoring strategies will be conducted out to assess the performance of laboratory assays [6]. Quality is reflected by a single number embracing traditional parameters: the allowable total error (TEa), precision, and bias [7]. Six sigma methodology seeks to control the results of each one of all processes to within six standard deviations, corresponding to 3.4 defects per million (DPM) opportunities. A laboratory is accepted as world-class when the sigma level is six or more. If the sigma value is <3, the process is not trustworthy which means not proper for routine production [8]. Sigma evaluation is valid, reliable, easy, and cheap.
The six-sigma method is used to assess the performance of clinical laboratories [9]. “Quality indicators” are evaluated using sigma metric methodology in the pre-analytical, analytical, and post-analytical phases [10]. Only a few studies have explored the sigma values of the analytical phase; however, the number of such studies is increasing [8], [11], [12]. Assays that are analytically robust and require minimal quality control (QC) rules are characterized by high sigma values; those exhibiting more variability (and that thus require more complex rules) can be identified because their sigma values are lower. Sigma metric methodology can be used to compare analytical process performances of analyzers, under certain conditions [7]. Another benefit of the methodology is that quality is monitored daily; a random drop in the sigma level of a test indicates the existence of an analytical problem [5].
Clinical laboratories are vulnerable to medical errors, because they are components of wider healthcare systems. Errors made in the analytical phase of testing have been greatly reduced (and now represent the smallest proportion of overall test errors), because of significant efforts made by both laboratories and the manufacturers of laboratory equipment and reagents [1]. However, errors seen in the analytical phase may cause significant consequences in the way of patient output. The quality of this phase like pre-analytic and post-analytic phase must be monitored carefully. In our study, we aim to determine the errors of the analytical phase of the total test process and parts that needs improvement using six sigma methodology for biochemical tests. Unlike prior studies, our goal was to evaluate the analytical process performances of four different analytical systems located in different laboratories.
Materials and methods
Six sigma methodology was used to evaluate the analytical process performances of four different biochemical analyzers running in four separate laboratories.
For this purpose internal quality control programmes of January 2014 were used. The laboratories where these systems located were in a similar capacity with approximately 30,000 tests a day, university and training and research hospital center laboratories.
Laboratory 1: Laboratory that use Abbott-Architect C 8000
Laboratory 2: Laboratory that use Beckman-Coulter Olympus AU2700
Laboratory 3: Laboratory that use Roche-Cobas 8000
Laboratory 4: Laboratory that use Siemens-Advia 2400
Eighteen clinical chemistry tests performed on serum samples were evaluated (for Level 1 and 2); the tests were cholesterol, triglycerides, HDL-C, total protein, K+, creatinine, Ca2+, albumin, glucose, uric acid, ALP, Na+, AST, Cl−, LDH, BUN, total bilirubin, and ALT.
Sigma values were determined by using six sigma methodology in evaluating the analytical process performance.
Sigma (σ) values were calculated as follows:
σ=(TEa%–bias%)/CV%
TEa: allowable total error
CV: coefficient of variation
The TEa values of biochemical parameters were those of the national Clinical Laboratories Improvement Act (CLIA) [13]. The levels of imprecision (the CVs %) were gauged using internal QC data. Inaccuracy (the bias %) was calculated by reference to the differences in the average levels measured by each analyzer when compared to those given by manufacturers in internal QC document. Each laboratory was using the internal quality control samples provided by the otoanalyzer firms. Lot numbers were not changed during the study. The method of each test was traceble to the reference method. The traceability of each test is checked according to the test/calibration information sheets from the manufacturers.
Performances of the analytical process was assessed using the sigma system; the minimum acceptable performance was three σ and world-class quality was reflected by a 6-σ score [14].
The sigma values were categorized as:
σ≥6:“World class or excellent”
3≤σ<6: “Good” [9]., and
Results
The sigma values for each test are shown in Figures and Tables.
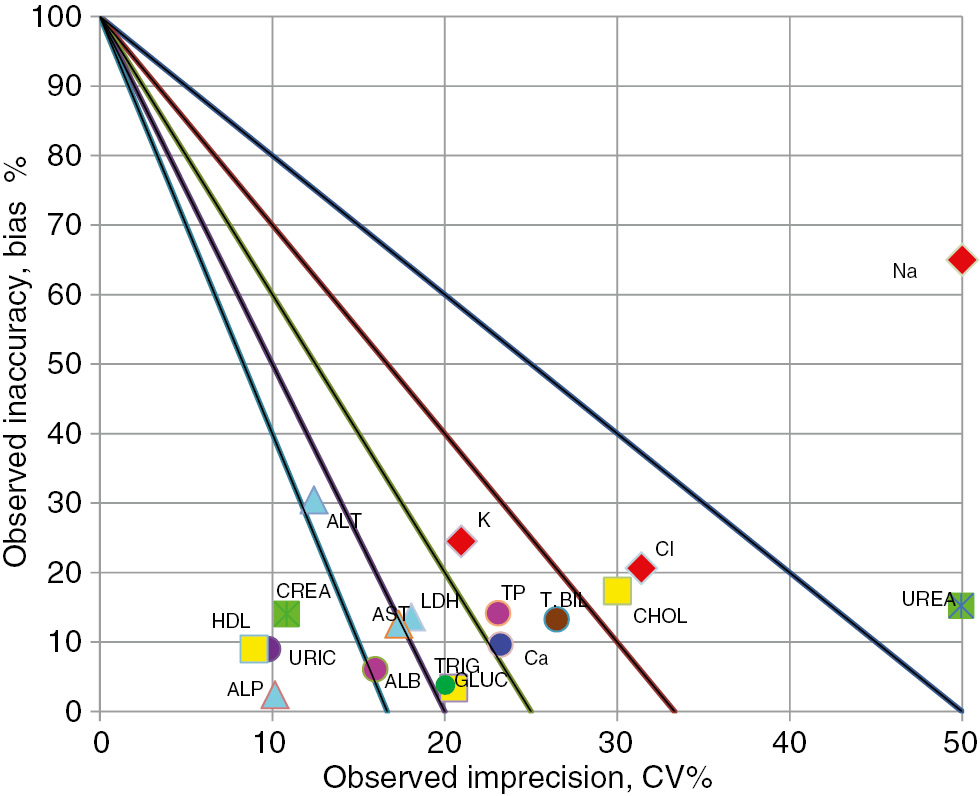
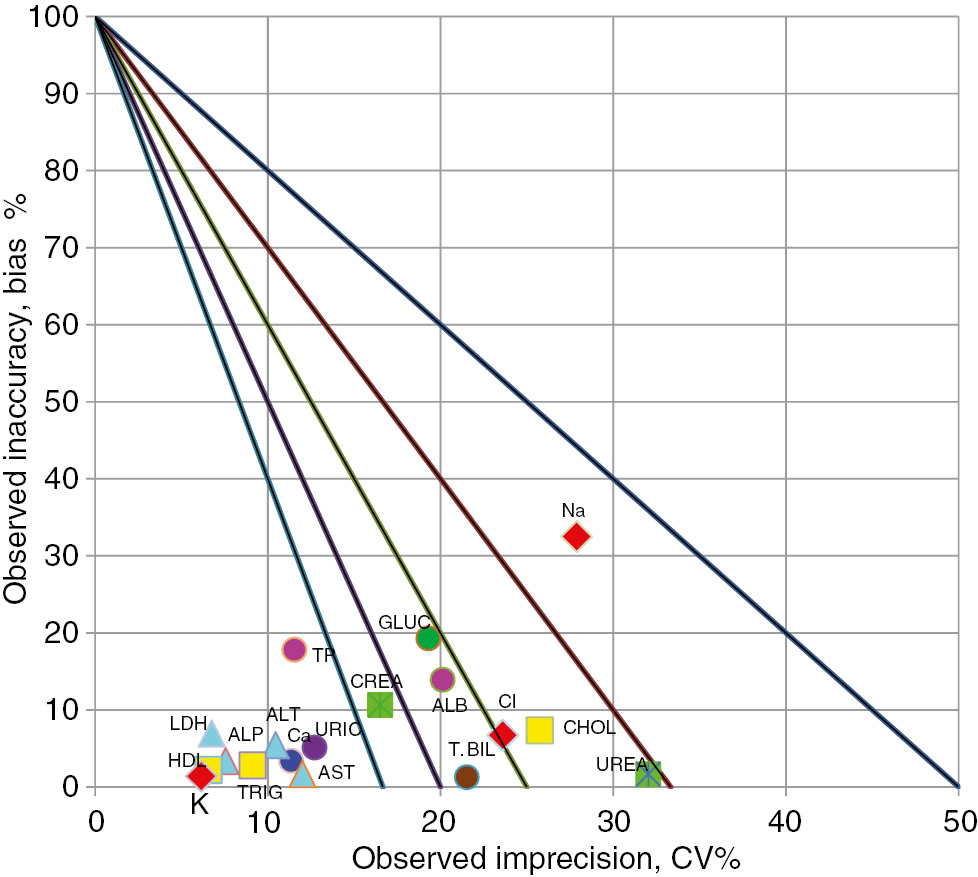
Sigma values ≥6 were associated with seven tests (creatinine, cholesterol, TG, HDL-C, total protein, Ca2+, and K+) and values <3 were associated with six tests (BUN, total bilirubin, AST, ALT, LDH, and Cl−) performed at Level 1 in laboratory 1 (Abbott-Architect C8000 instrument) (Figure 1, Table 1). Sigma values ≥6 were associated with six tests (creatinine, uric acid, ALP, LDH, TG, and HDL-C) and values <3 were associated with five tests (glucose, ALT, total bilirubin, Na+, and Cl−) performed at Level 2 (Figure 2, Table 2).

Sigma levels on normalized sigma metric chart for biochemical tests for Abbott Architect C8000 (Level 1).
Results of level 1 sigma metric values of analytic systems.
| Sigma values | Abbott Architect C8000 | Beckman Culter Olympus AU2700 | Roche Cobas 8000 | Siemens Advia 2400 |
|---|---|---|---|---|
| <3 | AST, Cl, LDH, UREA, T. BIL, ALT | Cl, UREA, Na | Na | UREA, Cl, Ca, ALT, Na |
| 3≤x<6 | ALB, GLUC, URIC, ALP, Na | K, TP, LDH, TRIG, ALB, CHOL, GLUC | CREA, T. BIL, ALB, Cl, GLUC, CHOL, UREA | T. BIL, TP, AST, CREA, ALB, URIC, CHOL, ALP, GLUC |
| ≥6 | CHOL, TRIG, HDL, TP, K, CREA, Ca | URİC, T. BIL, ALP, HDL, CREA, Ca, ALT, AST | K,HDL, LDH, ALP, TRIG, ALT, Ca, AST, URIC, TP | K, LDH, HDL, TRIG |

Sigma levels on normalized sigma metric chart for biochemical tests for Abbott Architect C8000 (Level 2).
Results of level 2 sigma metric values of analytic systems.
| Sigma values | Abbott Architect C8000 | Beckman Coulter Olympus AU2700 | Roche Cobas 8000 | Siemens Advia 2400 |
|---|---|---|---|---|
| <3 | GLUC, ALT, T. BIL, Cl, Na | CHOL, Cl, UREA, Na | Na, UREA | UREA, Cl, Na, Ca |
| 3≤x<6 | CHOL, ALB, Ca, TP, K, UREA, AST | ALB, ALT, AST, LDH, TRIG, Ca, GLUC, TP, K, T. BIL | T. BIL, ALB, CHOL, Ca, GLUC, Cl | TRIG, HDL, AST, URIC, CREA, ALT, K, ALB, GLUC, CHOL, TP |
| ≥6 | ALP, TRIG, URIC, LDH, CREA, HDL | HDL, ALP, URICİ CREA | HDL, ALP, ALT, LDH, K, TRIG, AST, CREA, URIC, TP | LDH, T. BIL, ALP |
Sigma values ≥6 were associated with eight tests (creatinine, uric acid, total bilirubin, AST, ALT, ALP, HDL-C, and Ca2+) and values <3 were associated with three tests (BUN, Na+, Cl−) performed at Level 1 in laboratory 2 (Beckman Olympus AU2700 instrument) (Figure 3, Table 1). Sigma values ≥6 were associated with four tests (creatinine, uric acid, ALP, and HDL-C) and values <3 were associated with four tests (BUN, Na+, Cl−, and cholesterol) performed at Level 2 (Figure 4, Table 2).

Sigma levels on normalized sigma metric chart for biochemical tests for Beckman Coulter Olympus AU2700 (Level 1).
Sigma levels on normalized sigma metric chart for biochemical tests for Beckman Coulter Olympus AU2700 (Level2).
Sigma values ≥6 were associated with 10 tests (uric acid, AST, ALT, ALP, TG, HDL-C, total protein, LDH, Ca2+, and K+) and a value <3 was associated with 1 test (Na+) performed at Level 1 in laboratory 3 (Roche-Cobas 8000 instrument) (Figure 5, Table 1). Sigma values ≥6 were associated with 10 tests (creatinine, uric acid, ALP, LDH, HDL-C, ALT, K+, TG, AST, and total protein) and values <3 were associated with 2 tests (BUN and Na+) performed at Level 2 (Figure 6, Table 2).
Sigma levels on normalized sigma metric chart for biochemical tests for Roche Cobas 8000 (Level 1).

Sigma levels on normalized sigma metric chart for biochemical tests for Roche Cobas 8000 (Level 2).
Sigma values ≥6 were associated with four tests (TG, HDL-C, LDH, and K+) and values <3 were associated with five tests (BUN, ALT, Ca2+, Na+, and Cl−) performed at Level 1 in laboratory 4 (Siemens-ADVIA 2400 instrument) (Figure 7, Table 1). Sigma values ≥6 were associated with three tests (ALP, LDH, and total bilirubin) and values <3 were associated with four tests (BUN, Na+, Cl−, and Ca2+) performed at Level 2 (Figure 8, Table 2).

Sigma levels on normalized sigma metric chart for biochemical tests for Siemens Advia 2400 (Level 1).

Sigma levels on normalized sigma metric chart for biochemical tests for Siemens Advia 2400 (Level 2).
The parameters that have σ≥6 which means in world class are HDL-C (for level 1) and ALP (for level 2) in all four systems, while only Na+ (for level 2) has σ<3 which point out the need to develop. Similarities and differences were found between systems for analytical process sigma values of all tests except these (Figures and Tables).
Discussion
To reduce laboratory errors, approaches that have been successful in industry, such as the six sigma method, may be valuable. This methodology is effective, and has been used by industry for many years. The methodology may be used to reduce errors in clinical laboratories [1]. The old paradigm pertaining to laboratory errors can be summarized as follows: if a medical error is made, people have caused it and the “solution” is to blame and shame. Today, this is being replaced by a new concept: failures in systems cause medical errors, and systematic process management improves patient safety by eliminating hazards [16]. Various methods, including QC and quality assurance (QA), which have been applied to prevent medical errors and eliminate the patient safety problems caused by the laboratories alone are not adequate. Besides, implementation of sigma methodologies with these methods will provide a constant improvement on laboratory quality. Use of the six sigma scale has shown that substantial improvements in laboratory workflows are required [16]. Sigma values calculated using EZ Rules software (Westgard QC Inc., Madison, WI, USA) define QC rules ensuring that patient data are accurate and false reports minimized. Assays with lower sigma values must be improved; the traditional rule (a result is acceptable if it is within ±2 standard deviations of the real result) is not sufficient for each test. More rigorous quality control rules for those with low sigma value should be applied and monitored more frequently.
Clinical laboratories have expended great effort (more so than other medical sectors) to reduce errors [1]. Today, laboratories measure the error rates of pre-analytical, analytical, and post-analytical processes, identifying areas where improvements are essential [6], [7], [8], [9], [10]. The sigma values of analytical systems used in our clinical laboratories (Figures 3 and 4) sometimes attain world-class standards (for Level 1 tests: measures of creatinine, uric acid, total bilirubin, AST, ALT, ALP, HDL-C, and Ca2+ levels; for Level 2 tests: measures of creatinine, uric acid, ALP, and HDL-C levels). Some assays require improvement (at Level 1; measures of urea, Na+, and Cl levels; at Level 2: measures of urea, Na+, Cl−, and cholesterol levels). The creatinine, uric acid, ALP, and HDL-C assays were of world-class quality at both levels. Singh et al. evaluated an AU400 instrument, and found that the sigma values for assay of seven biochemical parameters agreed with ours; our sigma values for five parameters exceeded theirs; and only their sigma value for TG estimation was greater than ours. When pathological levels of biochemical parameters were compared, the sigma values for seven biochemical parameters again conformed to our values; four of our sigma values exceeded theirs, and only their sigma values for TG and AST levels exceeded ours [8]. Ultimately, most test results were in agreement. However, it should be emphasized that, even when machines from the same manufacturer are compared, some tests are associated with different sigma values. Such differences may be explained by differences in equipment or models, the choice of the reference bias used to calculate sigma values, variations in laboratory conditions, the chosen QC criteria, and the use of kits differing in lot number. It is important to emphasize that, even if identical equipment is used, analytical quality (and therefore the sigma values) may vary among laboratories. Thus, each laboratory must calculate its own sigma values, and make improvements if necessary. In short, sigma values can be used to create QC rules that improve laboratory quality. If a sigma value is high, fewer analytical errors are made, and fewer questionable test results are reported. In turn, fewer acceptable test results are falsely rejected or not reported. Thus, laboratory efficiency increases and costs are reduced by a reduction in QC procedures, re-runs, and work-arounds. A high-quality cost-efficient laboratory is the result [7].
When the sigma values of the Abbott-Architect system included in the present study (Figures 1 and 2) were compared to those reported in a previous work, in which an advanced model from the same manufacturer was included [7], six Level 1 tests were in the same sigma class as ours, whereas nine tests had lower sigma values in our study. In terms of Level 2 data, six tests were in the same sigma class in both studies, whereas eight tests had lower sigma values in our study. Although the studies were identical in terms of the TEa criteria chosen, and the CV and bias calculation methods used, several suggestions may be advanced as to why certain tests were assigned to different sigma classes in the two studies: newer platforms with higher processing capacities may yield more accurate results; laboratory conditions may have varied; the QC criteria may have differed; and the kit lots employed may not have been identical.
Few studies have explored the sigma values of the analytical phase; however, the number of such studies is increasing. Afrifa et al. calculated sigma values for analytical phases differing from those of the four systems that we studied. Their method of calculation was similar, but yielded higher sigma values (the only sigma<3 was that associated with the TG assay) [6]. We found that the sigma values for all our four systems were much higher than those of the cited work and conclude that our study had a lower error rate.
When we compared the sigma values of our analytical system (running a Beckman AU2700 instrument) with those of the other three analytical systems, some similarities were evident (Tables 1 and 2). For example, at Level 1, the HDL-C sigma values – and, at Level 2, the ALP sigma values – of all four systems were world-class (σ≥6). Thus, the Level 1 HDL-C and Level 2 ALP tests are analytically robust, and do not require rigid QC regardless of the platform employed. The Na+ Level 2 tests of all systems need improvement (σ<3). Hence, realignment of QC programs, the use of more control samples, and more complex rules for evaluation of Na+ test results, are required. It is certainly true that not only analytical performance should be evaluated when defining QC rules; both the clinical importance of the test data and the influence of the test findings on clinical decision-making are also relevant. Sigma values for both levels of Albumin were found in the same group (3≤σ<6) for four analytical systems. For Creatinine, Level 1 sigma values were world class quality (σ≥6) in 2 analytic systems, although it was observed that they could not reach this level in the two other systems (3≤σ<6). Level 1 sigma value of AST was world class quality in one analytical system (σ≥6), whereas it was discrepantly found to be <3 in another system (σ<3, the group in need of improvement). Similarities and differences were also present in sigma levels of other tests. The cause of these differences in the sigma levels is the difference in bias and CV values of the tests in the analytical systems. All the systematic (inaccuracy) and random (impresicion) errors affecting the bias and CV values in the formula used to calculate the sigma level will affect the result. For example, taking precautions such as more frequent calibration to reduce bias, or avoiding the causes of random errors by training employees to reduce CV make it possible to reach better sigma levels. However, it is difficult to distinguish where from the problem derives. Investigations for the cause such as fishbone analysis can be performed to find the error source. Regular monitoring of the sigma level which is an easy and reliable method will allow incessant detection and correction of the laboratory errors and taking measure for fewer errors. Consequently, each laboratory should try to reduce the analytical error rates by following their own sigma level.
In addition, many diagnostic companies helped to decrease error rates to the current sigma values [2]. The sigma values calculated by the laboratory specialists must be shared with producers as this can contribute to the analytical performances.
A limitation of our study is not using the same quality control materials and procedures. The sigma values of the analytic process performance of each laboratory system are determined based on the reproducibility rates which have been identified per internal quality control procedures by using different control materials. Therefore, our study can be defined as situation determination other than analytical comparison research. Consequently, our study can be considered as a small multicenter harmonization study.
Conclusion
To reduce laboratory errors, and thus to improve patient safety, the six sigma methodology has been utilized as a part of total quality system. We are the first to evaluate the analytical process performances of four different systems; we conclude that the sigma values of analytic process performances of biochemical tests exhibit both similarities and differences. These are explained by variations in: the analytical performances of the systems used; the laboratory conditions; the commercial kits; and the quality criteria set by specialist. It is essential that all laboratories should calculate their sigma values, evaluate analytical quality, and make improvements if needed. According to the sigma value, laboratories can determine the tests whose analytical performance need to be improved and can contribute to improving the quality by applying stricter internal quality control procedures. Application of six sigma methodology is easy, quick, and reliable, allowing evaluation and improvement of analytical processes. However, care is needed when interpreting sigma values used to evaluate analytical process performance. Sigma values may vary dramatically when TEa targets, biases, and CV calculation methods change, even when identical equipment is employed. The important thing is the determination of the test which needs to be improved according to the sigma level and reevaluation of the sigma level after the improvement activities such as implementing more stringent quality control procedures. Thus, the continuous improvement of the laboratory quality and eventually more reliable patient results will be provided.
In conclusion, it is possible to evaluate analytical process performances using the easy, cheap, quick, and reliable six sigma metrics, which also identifies errors (that must be eliminated) that compromise patient safety.
Acknowledgments
We would like to express our gratitude to Prof. Dr. Muhittin Serdar for his valuable contribution to the figures.
Conflict of interest: The authors have no conflict of interest.
References
1. Stankovic AK. The laboratory is a key partner in assuring patient safety. Clin Lab Med 2004;24:1023–35.10.1016/j.cll.2004.05.017Suche in Google Scholar PubMed
2. Stankovic AK, Romeo P. The rol of in vitro diagnostic companies in reducing laboratory error. Clin Chem Lab Med 2007;45:781–8.10.1515/CCLM.2007.175Suche in Google Scholar
3. Abdurrahman C. Six sigma and laboratory consultation. Clin Chem Lab Med 2007;45:121–3.10.1515/CCLM.2007.023Suche in Google Scholar
4. Diler A, Süleyman D. Laboratuvar tıbbında altı-sigma kalite yönetimi. Turk J Biochem 2005;30:272–8.Suche in Google Scholar
5. Gras JM, Philippe M. Application of the six sigma concept in clinical laboratories: a review. ClinChem Lab Med 2007;45:789–96.10.1515/CCLM.2007.135Suche in Google Scholar PubMed
6. Justice A, Seth AG, William KB, Richard KD, Samuel EB, Samuel A, et al. Application of sigma metrics for the assessment of quality control in clinical chemistry laboratory in Ghana: a pilot study. Nigeria Med J 2015;56:54–8.10.4103/0300-1652.149172Suche in Google Scholar PubMed PubMed Central
7. Hens K, Berth M, Armbruster D, Westgard S. Sigma metrics used to assess analytical quality of clinical chemistry assays: importance of the allowable total error (TEa) target. Clin Chem Lab Med 2014;52:973–80.10.1515/cclm-2013-1090Suche in Google Scholar PubMed
8. Bhawna S, Binita G, Vinod KG, Ranjna C, Venkatesan M. Application of sigma metrics for the assessment of quality assurance in clinical biochemistry laboratory in India: a pilot study. Ind J Clin Biochem 2011;26:131–5.10.1007/s12291-010-0083-1Suche in Google Scholar PubMed PubMed Central
9. Zhang C, Zhao H, Wang J, Zeng J, Wang Z. The application of six sigma techniques in the evaluation of enzyme measurement produces in China. Clin Lab 2015;61:461–5.10.1016/j.cll.2015.02.006Suche in Google Scholar PubMed PubMed Central
10. Llopis MA, Trujillo G, Llovet MI, Tarrés E, Ibarz M, Biosca C, et al. Qualityindicatorsandspecificationsforkeyanalytical-extranalyticalprocesses in theclinicallaboratory. Five years’ experience using the Six Sigma concept. Clin Chem Lab Med 2011;49:463–70.10.1515/CCLM.2011.067Suche in Google Scholar PubMed
11. Nanda SK, Ray L. Quantitative application of sigma metrics in medical biochemistry. J ClinDiagn Res 2013;7:2689–91.10.7860/JCDR/2013/7292.3700Suche in Google Scholar PubMed PubMed Central
12. Diler A, Selahattin S, Hülya A, Gamze Y. Klinik laboratuvarlarda toplam laboratuvar performansının değerlendirilmesi: normalizeOPSpec Grafikleri, altı sigma ve hasta test sonuçları. Turk J Biochem 2005;30:296–305.Suche in Google Scholar
13. CLIA requirements for analytical quality. Available at: http://www.westgard.com/clia.htm. Accessed: Oct 2016.Suche in Google Scholar
14. Westgard JO, Westgard SA. The quality of laboratory testing today an assessment of a σ metrics for analytic quality using performance data from proficiency testing surveys and the CLIA criteria for acceptable performance. Am J Clin Pathol 2006;125:343–54.10.1309/V50H4FRVVWX12C79Suche in Google Scholar
15. Nevalainen D, Berte L, Kraft C, Leigh E, Picaso L, Morgan T. Evaluating laboratory performance on quality indicators with the six sigma scale. Arch Pathol Lab Med 2000;124:516–9.10.5858/2000-124-0516-ELPOQISuche in Google Scholar PubMed
16. Berte LM. Patient safety: getting there from here—quality management is the best patient safety program. Clin Leadersh Manag Rev 2004;18:311–5.Suche in Google Scholar
©2016 Walter de Gruyter GmbH, Berlin/Boston
Artikel in diesem Heft
- Frontmatter
- Research Articles
- The use of six sigma methodology to evaluate the analytical performances of clinical chemistry analyzers
- Evaluation of clinical chemistry tests in emergency laboratory by sigma metrics
- Neutrophil gelatinase associated lipocalin, an early biomarker for diagnosis of acute kidney injury after percutaneous coronary intervention
- Increased serum levels of spectrin degradation products in patients with schizophrenia
- Concentrations of circulating adiponectin and adipocyte-fatty acid binding protein in patients with three-vessel coronary artery disease: a comparison with coronary lesion complexity as characterized by syntax score
- Effects of aerobic plus explosive power exercises on bone remodeling and bone mineral density in young men
- Evaluation of serum 25-hidroxy vitamin D and zinc levels in asthmatic patients
- Effects of alprazolam and haloperidol on thyroglobulin, antithyroglobulin, anti thyroid peroxidase and TSH in Rat
- Evaluation of laboratory parameters in the diagnosis of acute appendicitis
- Assessment of macroprolactinemia inpatients with prolactinoma
- Evaluation of vascular endothelial growth factor levels in rheumatoid arthritis patients, with and without joint swelling; a comparison with erythrocyte sedimentation rate, C-reactive protein, rheumatoid factor and anti-cyclic citruillnated protein
- Fibroblast growth factor-23 concentrations in polycystic ovary syndrome
- Opinion Papers
- Evaluation of H-800/FUS-100 automatic urine analyzer performance
- Determining knowledge of the nursing students about biochemistry laboratory samples
- Letter to the Editor
- Response to Letter to the Editor, “Some errors in the measurement of neutrophil-to-lymphocyte ratio”
- Short Communication
- How to decrease the rejection rates: reasons of sample rejection and solutions