The development and measurement properties of the Dutch version of the fear-avoidance components scale (FACS-D) in persons with chronic musculoskeletal pain
-
Liesbet De Baets

 ,
Abner Sergooris
,
Randy Neblett
,
Thomas Matheve
,
Abner Sergooris
,
Randy Neblett
,
Thomas Matheve

Abstract
Objectives
The Fear-Avoidance Components Scale (FACS) is a recently developed patient-reported instrument assessing different constructs related to the fear-avoidance model of pain. The aim was to translate the original English FACS into Dutch (FACS-D) and assess its measurement properties in persons with chronic musculoskeletal pain.
Methods
The original English FACS (20 item-scale, range: 0–100) was translated in Dutch through standard forward-backward translation methodology. The FACS-D’s measurement properties were evaluated in 224 persons with chronic musculoskeletal pain. Internal consistency, test-retest reliability and measurement error were assessed with the Cronbach’s alpha coefficient (α), intraclass correlation coefficient (ICC), and standard error of measurement (SEM). Construct validity was assessed through inter-item correlation analyses, exploratory factor analysis, association with other fear-avoidance-related constructs, and hypothesis testing.
Results
Internal consistency, test-retest reliability and hypotheses testing were good (α=0.92; ICC=0.92, CI 0.80–0.96; 7/8 hypotheses confirmed). Similar to the original FACS and other translated versions, a two-factor model best fit the data. However, the item distribution differed from other versions. One factor represented “pain-related cognitions and emotions” and a second factor represented “avoidance behaviour.” In contrast to the original FACS, low inter-item correlations for item 12 were found. The FACS-D was more strongly associated with fear-avoidance-related constructs of pain severity, perceived disability, feelings of injustice, and depressive/anxiety symptoms than the other fear-avoidance-related scales studied here.
Conclusions
The FACS-D demonstrated good reliability and construct validity, suggesting that it may be a useful measure for Dutch-speaking healthcare providers. Two clinically relevant factors, with a different item distribution than the original FACS, were identified: one covering items on pain-related cognitions and emotions, and one covering items on avoidance behaviour. The stronger association between FACS-D and fear-avoidance related constructs suggests that the FACS-D may be more effective in evaluating the cognitive, emotional and behavioural constructs of pain-related fear-avoidance than other similar measures.
Introduction
Musculoskeletal pain is the leading cause of disability worldwide [1]. Dysfunctional pain-related cognitive, emotional and behavioural factors are known contributors to pain severity, disability, and physical performance in musculoskeletal pain conditions, and can lead to poor treatment outcomes [2], [3], [4], [5], [6], [7], [8], [9], [10], [11]. The identification of factors underlying the transition from acute to chronic pain and disability is essential to optimize treatment [12].
After a tissue injury or a painful experience, and in line with natural healing processes, a normal recovery trajectory involves a gradual increase in movement and use of one’s affected body parts, and motivation to re-engage in valued activities, until pre-morbid levels of function have been achieved [13]. Although it is appropriate to reduce activity and avoid painful activities during the acute stage of injury, persisting activity avoidance will likely lead to negative consequences. According to the fear-avoidance model of pain [13], [14], [15], a subgroup of injured patients gets stuck in unhelpful beliefs concerning pain. Interpreting pain as threatening and worrying about pain can initiate maladaptive coping behaviours, hypervigilance of pain symptoms, and avoidance of activities of daily living, which can result in physical deconditioning, functional impairments, and sustained pain-related disability [13], [14], [15]. High levels of fear-avoidance have been found to predict the transition from subacute to chronic low back pain, and low levels of fear-avoidance have been found to predict recovery after chronic disabling low back pain [10, 11]. Furthermore, it is known that a subset of persons in pain adopt a victim role (e.g., persons after a work injury can blame their employer for the injury or blame the workers compensation insurance company for not providing sufficient treatment) which further promotes activity avoidance and disability [16].
Pain-related cognitions, emotions, and avoidance behaviours are typically assessed with patient-reported instruments, including the Fear-Avoidance Beliefs Questionnaire (FABQ) [17], Pain and Anxiety Symptoms Scale (PASS) [18], and Tampa Scale for Kinesiophobia (TSK) [19]. However, these instruments have been criticized for limited construct validity, lack of item specificity (e.g., not differentiating between fear of movement and avoidance behaviour; not specifying reasons for avoidance), and for missing important components of the current fear-avoidance model of pain [20, 21]. To note, none of the above-mentioned scales assesses different domains of pain-related avoidance behaviour, like avoidance based on fear of (re)injury, fear of increased pain, fear of functional loss or actual increased pain (without fear) [22]. The Fear-Avoidance Components Scale (FACS) was developed in 2015 within a framework of the current fear-avoidance model in an attempt to overcome the limitations of previous fear-avoidance-related scales and to more effectively assess all important cognitive, emotional and behavioural constructs of pain-related fear-avoidance [23, 24]. It includes adapted items from the FABQ [17], PASS [18], TSK [19], the Pain Catastrophizing Scale (PCS) [25], and the Injustice Experience Questionnaire (IEQ) [16]. It also includes new items on unrepresented concepts that were not found in these previously published scales, including types of activities that one avoids and the reasons for avoidance. The original English FACS, and other translated versions have demonstrated appropriate measurement properties [23, 24, 26], [27], [28]. The FACS has been shown to be responsive to treatment (i.e., FACS scores improved in chronic musculoskeletal pain patients after completing an interdisciplinary functional restoration treatment program) [24], and FACS outcomes have predicted work-return outcomes [24].
Because the FACS offers a comprehensive measure of fear-avoidance-related components in one scale, and assesses the ‘what’ and ‘why’ of avoidance behavior in more detail than former scales, the FACS has potential benefit for Dutch speaking researchers, healthcare providers and persons with musculoskeletal pain. We aimed to translate the FACS into Dutch (FACS-D), and investigate its measurement properties in patients with chronic musculoskeletal pain, with specific attention towards gaining additional insights about the FACS-D in comparison to the original English FACS.
Methods
Medical ethics
The study was approved by the ethical review committees of Jessa Hospital (B243201836858) and Hasselt University (18.61/reva18.02).
Translation and cross-cultural adaptation
The original English FACS items can be found in Appendix S1, and all known language versions of the FACS can also be found at https://www.pridedallas.com/questionnaires/.
The cross-cultural adaptation process was performed in accordance to the guidelines of Beaton et al. [29]. This process consisted of five stages, i.e., 1. initial translation, 2. synthesis, 3. back translation, 4. review and consensus and 5. field test of the prefinal version (face validity). Details are described in Appendix S2 (Part A).
Measurement properties
Participants
Eligibility criteria for participation in this cross-sectional study were: (a) musculoskeletal pain for at least 3 months, defined as low back, neck, shoulder, hip or knee pain as primary pain complaints; (b) between 18 and 80 years of age; (c) no current or past surgical treatment for the current pain complaint; (d) Dutch language as mother tongue; (e) no previous (<6 months) or currently ongoing psychotherapy or physiotherapy for the pain complaint. Exclusion criteria were: (a) pain from a non-musculoskeletal origin (e.g., tumour), (b) suffering from a neurological disease (e.g., stroke or multiple sclerosis) or (c) cognitive impairments.
Eligible participants were recruited via social media and from different settings, including the multidisciplinary pain centre, the orthopaedic department, and the Physical and Rehabilitation Medicine department of Ziekenhuis Oost-Limburg and Jessa Hospital, and local physiotherapist practices. Recruitment started in December 2018 and ended in December 2020. Eligibility criteria were assessed by a member of the research team based on the medical file and/or information provided by each participant. The study’s purpose was explained in detail by a member of the research team and after agreeing to participate, each participant signed an informed consent form.
Procedure
In addition to the FACS-D, all participants completed a battery of sociodemographic information and patient-reported questionnaires which assessed pain intensity and other pain-related constructs (e.g., perceived disability, fear avoidance beliefs, pain catastrophizing, general anxiety and depression and perceived injustice).
For reliability assessment, 35 participants were asked to complete the FACS-D a second time approximately one-week later.
Patient-reported clinical data
Sociodemographic information
Participants were asked to indicate their age, sex, height, weight, work status, and duration of the primary pain complaint.
Fear-avoidance components scale – Dutch version (FACS-D)
Fear-avoidance was assessed by the FACS-D, which is a 20-item questionnaire. Each item is scored on a 6-point Likert scale, resulting in scores ranging from zero (“completely disagree”) to five (“completely agree”). There is a maximum total score of 100, with higher scores indicating more fear-avoidance. Five severity levels have been proposed: subclinical (0–20), mild (21–40), moderate (41–60), severe (61–80), and extreme (81–100) [23].
Numeric pain rating scale (NPRS)
The average pain intensity over the last week was assessed by the Numeric Pain Rating Scale (NPRS), an 11-point scale ranging from zero (“no pain”) to ten (“worst possible pain”) [30]. The NPRS has appropriate measurement properties in patients with musculoskeletal pain [31, 32].
Fear-avoidance beliefs questionnaire (FABQ)
Fear-avoidance beliefs were assessed with the FABQ-physical activity subscale [33]. Each item is scored on a 7-point Likert scale with a score ranging from zero (“completely disagree”) to six (“completely agree”). Higher scores indicate higher levels of fear avoidance beliefs, with a maximum total score of 24 for the FABQ-physical activity subscale. Measurement properties of the FABQ are sufficient in patients with chronic musculoskeletal pain [17, 34, 35].
Tampa scale for kinesiophobia (TSK)
Pain-related fear of movement and (re)injury was assessed with the 17-item version of the TSK [19]. Each item is scored on a 4-point Likert Scale, ranging from one (“strongly disagree”) to four (“strongly agree”). The total score ranges between 17 and 68, with higher values reflecting greater fear of movement. Measurement properties of the TSK are sufficient in patients with chronic musculoskeletal pain [34], [35], [36], [37], [38].
Pain catastrophizing scale (PCS)
Negative thoughts and feelings when experiencing pain were assessed with the PCS, consisting of 13-items [25]. Each item is scored from zero (“not at all”) to four (“all the time”). Its total score ranges between 0 and 52, with a higher total score indicating higher levels of pain catastrophizing. Acceptable validity and reliability results of the PCS in musculoskeletal patients have been reported [39, 40].
Hospital anxiety and depression scale (HADS)
The HADS is a 14-item questionnaire evaluating symptoms of anxiety and depression without involving physical complaints [41]. One subscale covers symptoms of anxiety (HADS-A), the other symptoms of depression (HADS-D). Each item is scored from zero (“not applicable”) to three (“certainly applicable”). The maximum score on each subscale is 21, with higher values indicating more severe anxiety/depression symptoms. Both the anxiety and depression subscales have good psychometric properties in musculoskeletal pain populations [42].
Injustice experience questionnaire (IEQ)
Perceived injustice was measured with the Injustice Experience Questionnaire (IEQ) [16]. The IEQ consists of 12 items, each item is scored from zero (“not at all”) to four (“all the time”). The total score ranges between 0 and 48, with higher total scores reflecting higher levels of perceived injustice. The validity of the IEQ is sufficient in patients with musculoskeletal pain [16].
Perceived disability questionnaires
Perceived disability was assessed with specific disability questionnaires per pain location. The Oswestry Disability Index (ODI) [43], Neck Disability Index (NDI) [44], Disabilities of the Arm, Shoulder and Hand questionnaire (DASH) [45, 46], Hip dysfunction and Osteoarthritis Outcome Score (HOOS) [47, 48] and Knee dysfunction and Osteoarthritis Outcome Score (KOOS) [49] were used to assess perceived disability in persons with low back, neck, shoulder, hip and knee pain, respectively. All of these scales range from 0 to 100. For the ODI, NDI and DASH, a higher score indicates more disability. For the HOOS and KOOS, a higher score indicates lower disability. The psychometric properties of these scales are acceptable for their respective problem (i.e., low back pain, neck pain, shoulder pain, hip pain, knee pain) [43], [44], [45], [46, 49].
Statistical analysis
Statistical Package for Social Sciences (SPSS) version 27 (IBM corporation, 2020) was used [50]. The level of significance was set at p<0.05. Analyses were performed according to the recommendations of De Vet et al. (2011) and Ellis (2013) [51, 52].
To assess internal consistency, Cronbach’s alpha (α) and lambda 2 (λ2) were calculated [53]. Internal consistency was considered sufficient when structural validity was sufficient and Cronbach’s alpha was ≥0.70 and ≤0.95 for each subscale [54, 55]. The absolute agreement intraclass-correlation coefficient (ICC) was calculated to assess test-retest reliability. An ICC ≥0.70 was needed for test-retest reliability to be considered sufficient [54, 55]. To evaluate measurement error, the standard error of measurement (SEM) and smallest detectable change (SDC) were calculated using the following formulas:
Structural validity was first assessed by calculating an inter-item correlation matrix, followed by an exploratory factor analysis. Principal axis factoring was used as a method of factor extraction and Varimax was selected as a method of factor rotation. The following criteria were used to determine the number of factors to be extracted: Eigenvalues >1.0; Catell’s scree plot inflection point; and cumulative explained variance >50%. Parallel analysis was carried out as well [56], which is considered to be a more accurate method for determining the appropriate number of factors to retain [57]. Factors with an Eigenvalue larger than the corresponding Eigenvalue from a randomly generated correlation matrix were retained.
Hypothesis testing was performed with regard to the assessment of construct validity. A priori hypotheses were formulated and tested with Pearson’s or Spearman’s correlation coefficients [54, 55]. Correlation coefficients of 0–0.3 were considered very weak, 0.3–0.5 weak, 0.5–0.7 moderate, 0.7–0.9 high, 0.9–1.0 very high [58]. Construct validity was considered sufficient if at least six of the following hypotheses (75%) were confirmed [54, 55]:
Hypotheses 1–4: Since adapted items of the FABQ, TSK, PCS and IEQ were used in the FACS′ development process, we expected these patient-reported instruments to have at least moderate correlations with the FACS-D (r≥0.5).
Hypothesis 6: Because a weak correlation has been reported between pain intensity and fear-avoidance beliefs [61], at least a weak correlation was expected between the NPRS and the FACS-D (r≥0.3).
Hypotheses 7–8: Because a weak correlation has been reported between fear-avoidance beliefs and depressive symptoms [17], at least a weak correlation was expected between the anxiety and depression subscale of the HADS and the FACS-D (r≥0.3).
Additionally, because the FACS-D purports to capture more fear-avoidance-related dimensions than current fear-avoidance-related scales, we investigated whether the FACS-D had higher correlations than the TSK, FABQ-PA, and PCS with measures of perceived disability, pain intensity, HADS-A, HADS-D and IEQ.
Results
Participants
Two hundred twenty-four individuals with chronic musculoskeletal pain participated in this study. The mean age (SD) of the total participant sample was 48.6 (SD=16.0) years, and the mean pain duration was 26.3 (SD=40.3) months. Details on the participants’ characteristics per pain location can be found in Table 1.
Participants’ characteristics.
| Low back pain (n=56) | Neck pain (n=24) | Hip pain (n=47) | Knee pain (n=17) | Shoulder pain (n=80) | |
|---|---|---|---|---|---|
| Age (year), mean (SD) | 42.7 (16.6) | 43.0 (14.6) | 51.5 (17.0) | 52.1 (18.1) | 51.9 (13.3) |
| Sex (female), n (%) | 31 (55%) | 20 (83%) | 35 (75%) | 11 (65%) | 51 (64%) |
| Work status, n (%) | |||||
|
23 (43%) | 16 (67%) | 22 (47%) | 7 (41%) | 33 (41%) |
|
12 (22%) | 3 (13%) | 6 (13%) | 1 (6%) | 18 (23%) |
|
6 (11%) | 2 (8%) | 12 (26%) | 5 (29%) | 20 (25%) |
|
9 (17%) | 2 (8%) | 6 (13%) | 3 (18%) | 3 (4%) |
|
4 (8%) | 1 (4%) | 1 (2%) | 1 (6%) | 6 (8%) |
| Pain duration (m), mean (SD); range | 42.0 (65.9); 3–355 | 18.1 (17.7); 3–72 | 23.6 (21.3); 3–96 | 36.1 (46.0); 5–167 | 17.6 (20.5); 3–87 |
-
n, number of participants; y, years; SD, standard deviation; m, months.
Translation and cross-cultural adaptation
The outline of the translation and cross-cultural adaptation process can be found in Appendix S2 (Part B). The final FACS-D is presented in Appendix S3.
Patient-reported outcome measures
Outcomes for the patient-reported instruments are reported in Table 2. FACS-D scores ranged from zero to 87/100, with a mean score of 22.00, 34.00 and 51.75 at the 25th, 50th and 75th percentiles, respectively. The distribution of the FACS-D scores in the total sample is presented in Figure 1. Subjects were organized into FACS severity subgroups based on recommended score ranges [23, 24]. The distribution of the participants into FACS severity subgroups (number and percentage of participants) was as follows: 49 subclinical (22%), 84 mild (38%), 58 moderate (25%), 31 severe (14%) and 2 extreme (1%) [23, 24].
Outcomes (presented as mean (SD); range) for patient-reported instruments.
| Total sample (n=224) | Low back pain (n=56) | Neck pain (n=24) | Hip pain (n=47) | Knee pain (n=17) | Shoulder pain (n=80) | |
|---|---|---|---|---|---|---|
| FACS-D (0–100) | 37.5 (20.0); 0–87 | 37.4 (20.3); 5–75 | 29.9 (16.5); 0–65 | 45.2 (23.0); 8–87 | 34.0 (22.3); 9–80 | 36.0 (17.2); 3–77 |
| NPRS (0–10) | 5.0 (2.3) | 4.9 (2.1) | 4.5 (1.6) | 5.7 (2.5) | 4.8 (2.3) | 5.0 (2.4) |
| ODI (0–100) | – | 22.0 (13.9); 2–50 | – | – | – | – |
| NDI (0–100) | – | – | 22.7 (11.1); 8–56 | – | – | – |
| HOOS (0–100) | – | – | – | 48.6 (22.0); 13–91 | – | – |
| KOOS (0–100) | – | – | – | – | 59.9 (18.9); 20–91 | – |
| DASH (0–100) | – | – | – | – | – | 36.7 (17.7); 8–87 |
| FABQ-PA (0–24) | 13.2 (5.4); 0–24 | 12.3 (5.5); 1–24 | 10.2 (5.4); 0–20 | 13.3 (5.4); 4–22 | 13.3 (6.5); 4–24 | 14.7 (4.7); 0–24 |
| TSK-17 (17–68) | 36.2 (8.1); 17–56 | 36.6 (8.0); 18–52 | 31.6 (6.6); 21–46 | 38.7 (8.2); 23–56 | 37.4 (9.8); 24–54 | 35.5 (7.6); 17–56 |
| PCS (0–52) | 15.6 (10.9); 0–49 | 18.9 (10.5); 1–49 | 11.29 (9.3); 0–34 | 18.7 (12.5); 0–48 | 17.6 (14.2); 0–45 | 12.5 (8.4); 0–38 |
| HADS-A (0–21) | 5.7 (4.2); 0–19 | 6.6 (4.4); 0–15 | 6.3 (3.6); 2–14 | 5.7 (5.2); 0–19 | 4.6 (3.4); 0–11 | 5.2 (3.6); 0–14 |
| HADS-D (0–21) | 4.0 (3.8): 0–19 | 4.8 (4.2); 0–15 | 3.8 (3.4); 0–10 | 4.5 (4.4); 0–19 | 2.7 (3.1); 0–9 | 3.7 (3.2); 0–13 |
| HADS (0–42) | 9.7 (7.4); 0–35 | 11.3 (7.8); 0–27 | 10.1 (6.2); 3–24 | 10.1 (9.2); 1–35 | 7.3 (6.1); 1–19 | 8.8 (6.3); 0–25 |
| IEQ (0–48) | 8.7 (9.6); 0–46 | 11.5 (11.0); 0–44 | 5.8 (7.0); 0–24 | 10.2 (10.3); 0–37 | 8.8 (14.1); 0–46 | 6.6 (6.6); 0–31 |
-
n, number of participants; SD, standard deviation; FACS, fear-avoidance components scale; NPRS, numeric pain rating scale; ODI, oswestry disability index; NDI, neck disability index; HOOS, hip osteoarthritis outcome scale; KOOS, knee osteoarthritis outcome scale; DASH, disability of the arm, shoulder and hand questionnaire; FABQ-PA, fear avoidance beliefs questionnaire physical activity subscale; TSK, Tampa scale for kinesiophobia; PCS, pain catastrophizing scale; HADS, hospital anxiety and depression scale; IEQ, injustice experience questionnaire.
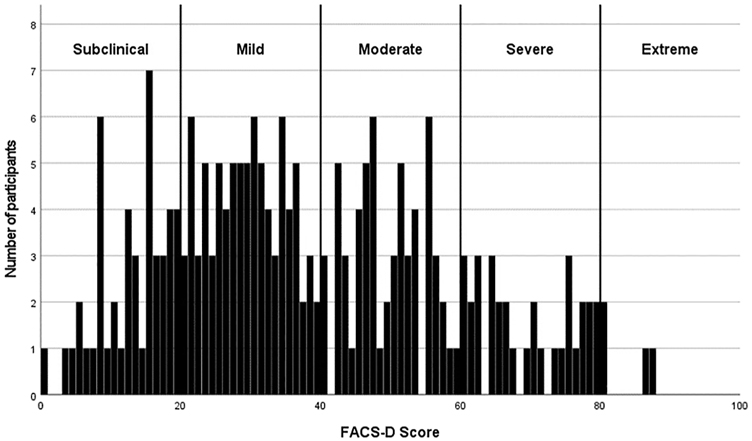
Distribution of total scores of the Dutch version of the fear avoidance component scale (FACS-D).
Structural validity
The inter-item correlation matrix of the total group indicated a correlation of <0.2 between item 12 and 15 other items. Item 10 had a correlation of <0.2 with four other items. Item 1 and item 15 had a correlation of <0.2 with 3 other items. The other items correlated >0.2 with at least 18 out of 19 items. Exploratory factor analysis was performed on the total group of participants. Four factors with an Eigenvalue >1 were found, explaining 40.2, 11.0, 6.4 and 5.3% of the variance, respectively. The cumulative percentage of variance indicated that more than 50% of the variance was explained following the second factor (51.1%). Also, the scree plot showed that after the second factor, the slope flattened substantially (Figure 2). Therefore, both the eigenvalues and the scree plot indicated a 2-factor model.
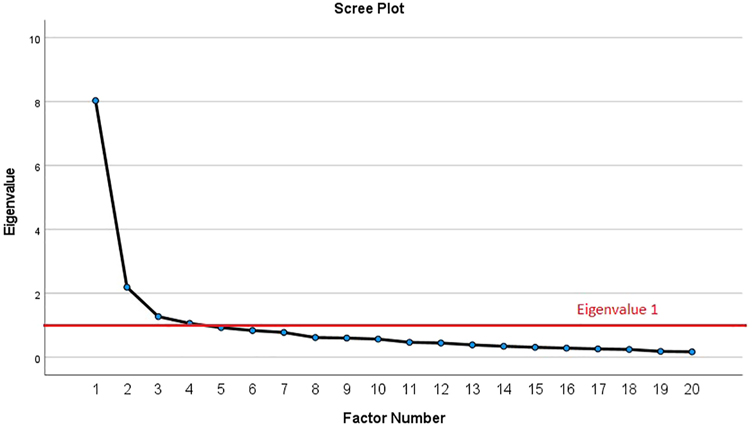
Scree plot for exploratory factor analysis of FACS-D.
Through parallel analysis [62], it was found that the first two eigenvalues were larger than their corresponding random eigenvalue, suggesting that two factors should be retained. After repeating the principle axis factoring with a two-factor model with Varimax rotation, the factor loadings illustrated in Table 3 appeared. Only item 12 showed a factor loading <0.32, which is considered as a feasible cut-off point [63]. Items in Factor one (items 2–4, 6–10 and 12–14) represented “pain-related cognitions and emotions.” Items in Factor two (items 1, 5, 11, and 15–20), represented “avoidance behaviour.” When applying the same statistics on the FACS-D, excluding item 12, similar results were found.
Factor loadings for the two-factor model of the FACS-D.
| Item | Factor 1 | Factor 2 |
|---|---|---|
| #2 | 0.659 | 0.317 |
| #3 | 0.624 | 0.256 |
| #4 | 0.730 | 0.345 |
| #6 | 0.526 | 0.242 |
| #7 | 0.726 | 0.202 |
| #8 | 0.670 | 0.162 |
| #9 | 0.735 | 0.274 |
| #10 | 0.536 | 0.157 |
| #13 | 0.622 | 0.190 |
| #14 | 0.696 | 0.269 |
| #12 | 0.280 | |
| #1 | 0.140 | 0.629 |
| #5 | 0.244 | 0.623 |
| #11 | 0.210 | 0.656 |
| #15 | 0.192 | 0.663 |
| #16 | 0.233 | 0.711 |
| #17 | 0.335 | 0.440 |
| #18 | 0.280 | 0.640 |
| #19 | 0.299 | 0.540 |
| #20 | 0.168 | 0.796 |
-
Extraction method: Principal axis factoring. Factor loadings <0.32 are in bold.
Measurement properties
Lambda 2 was 0.89 for factor 1 and 0.90 for factor 2, Cronbach’s alpha was 0.88 for factor 1 and 0.90 for factor 2. The ICC (95% confidence interval) was 0.92 (0.80–0.96), indicating very good reliability. A SEM of 5.6 points and an SDC of 15.5 points were calculated.
Hypotheses testing
Spearman correlation coefficients were calculated among the patient-reported instruments (Table 4). Seven of the eight a priori formulated hypotheses were confirmed, indicating sufficient construct validity. In accordance to the hypotheses, the FACS-D showed moderate relationships with the TSK, PCS, and IEQ; weak relationships with the HADS-D, HADS-A and NPRS; and moderate to high relationships with the ODI, NDI, KOOS, HOOS and DASH. The FABQ-PA showed a weak relationship with the FACS-D, which did not match the corresponding hypothesis. Interestingly, the FACS-D showed mostly higher correlations with measures of perceived disability, pain intensity, HADS-A, HADS-D and IEQ than the other fear-avoidance scales (TSK, FABQ-PA, PCS) (Appendix S4).
Spearman correlation coefficients (95% CI) between FACS-D and other patient-reported instruments.
| Instrument | n | FACS-D | TSK-17 | FABQ-PA | PCS |
|---|---|---|---|---|---|
| ODI | 56 | 0.70a (0.53, 0.81) | 0.55a (0.32, 0.71) | 0.24 (−0.04, 0.48) | 0.60a (0.39, 0.75) |
| NDI | 24 | 0.53b (0.11, 0.79) | 0.21 (−0.27, 0.61) | 0.07 (−0.40, 0.51) | 0.31 (−0.16, 0.66) |
| DASH | 80 | 0.57a (0.39, 0.70) | 0.54a (0.35, 0.68) | 0.46a (0.26, 0.62) | 0.44a (0.23, 0.60) |
| HOOS | 47 | −0.73a (−0.85, −0.56) | −0.62a (−0.77, −0.40) | −0.41a (−0.64, −0.14) | −0.47a (−0.67, −0.21) |
| KOOS | 17 | −0.59b (−0.84, −0.14) | −0.45 (−0.77, −0.06) | −0.55b (−0.82, −0.08) | −0.54b (−0.82, −0.06) |
| FABQ-PA | 224 | 0.49a (0.38, 0.58) | – | – | – |
| TSK-17 | 224 | 0.64a (0.57, 0.73) | – | – | – |
| PCS | 224 | 0.59a (0.50, 0.67) | – | – | – |
| IEQ | 224 | 0.69a (0.60, 0.75) | 0.55a (0.44, 0.64) | 0.31a (0.19, 0.43) | 0.59a (0.49, 0.67) |
| HADS-A | 224 | 0.37a (0.24, 0.48) | 0.21a (0.07, 0.33) | 0.14b (0.00, 0.27) | 0.39a (0.27, 0.50) |
| HADS-D | 224 | 0.48a (0.37, 0.58) | 0.37a (0.25, 0.48) | 0.29a (0.16, 0.41) | 0.35a (0.23, 0.47) |
| NPRS | 224 | 0.41a (0.29, 0.51) | 0.30a (0.17, 0.42) | 0.16a (0.03, 0.29) | 0.33a (0.20, 0.45) |
-
aCorrelation is significant at the 0.01 level(2-tailed); bCorrelation is significant at the 0.05 level(2-tailed). Correlations coefficients not confirming corresponding hypothesis are underlined. CI, confidence interval; NPRS, numeric pain rating scale; ODI, oswestry disability index; NDI, neck disability index; HOOS, hip osteoarthritis outcome scale; KOOS, knee osteoarthritis outcome scale; DASH, disability of the arm, shoulder and hand questionnaire; FABQ-PA, fear avoidance beliefs questionnaire physical activity subscale; TSK, Tampa scale for kinesiophobia; PCS, pain catastrophizing scale; HADS, hospital anxiety and depression scale; IEQ, injustice experience questionnaire.
Discussion
The FACS claims to offer a more comprehensive assessment of fear-avoidance than previous fear-avoidance-related instruments that were used in the present study (i.e., TSK, FABQ-PA, and PCS). The FACS-D was more strongly associated with fear-avoidance-related constructs of pain intensity, perceived disability, feelings of injustice, and depressive/anxiety symptoms than these other fear-avoidance-related scales. These results suggest that the FACS-D may be more effective in evaluating the cognitive, emotional and behavioural constructs of pain-related fear-avoidance.
In addition, a key finding emerged from the exploratory factor analysis. Though the English [24], Spanish [27], Serbian [26], and Dutch FACS have all been determined to be two-dimensional scales, the item distribution of the FACS-D was found to be different than these previous versions. FACS-D factor one (items 2–4, 6–10 and 13–14) represents “pain-related cognitions and emotions” and factor two (item 1,5,11 and 15–20) represents “avoidance behaviour,” including the types of activities that are avoided. We believe the item distribution of the two factors in the FACS-D provide more face validity than the two-factor solution found in the English, Spanish, and Serbian versions [24, 26, 27]. It is assumed that the differences in the item distribution between the different translated versions may be due to slight differences in the assessed population, rather than due to the cross-cultural translation process, since this was done in a rigorous manner following the guidelines of Beaton [29], and face validity was considered appropriate (Appendix S2 Part A).
The internal consistency of the FACS-D was found to be very high. However, item 12 (“It is someone else’s fault that I have this painful medical condition”), which is related to the concept of perceived injustice, had low correlations with multiple other items, low factor loading for the two-factor model, and was unable to differentiate participants with high fear-avoidance from participants with low fear-avoidance (i.e., item 12 was scored zero by 78% of the participants and one by another 12%). This finding suggested that item #12 was not useful for the current study sample. It should be noted that almost all participants in the original psychometric evaluation study of the English FACS were being treated for chronic pain conditions that developed from work-related injuries [24]. It is likely that many subjects in this population might have held feelings of blame towards their employer, colleagues or the workers compensation insurance company. In fact, factor loadings for item 12 in the English version were reported to be 0.488 for factor one and 0.103 for factor two [24]. In contrast, no subjects in the present study presented with pain related to a work-related injury, motor vehicle accident, unsuccessful surgery, etc. which would likely have generated feelings of blame. Results of the present study suggest that the usefulness of item 12 is dependent on the population under investigation, i.e., item 12 may only be useful when feelings of blame towards someone else are likely. This result is in line with the results of the Spanish and Serbian studies [26, 27].
The FACS-D showed sufficient internal consistency, test-retest reliability and construct validity. Internal consistency has been found to be sufficient in all the other language versions of the FACS [23, 26, 27], with similar Cronbach’s alpha values as the FACS-D. Also the values for test-retest reliability found by Bid et al. (2020), Knezevic et al. (2018), and Neblett et al. (2016) were sufficient and nearly equal to the value in the current study [23, 26, 28]. Regarding the SEMs and SDCs, the results indicated that the minimum amount of change in a patient’s score that ensures the change is not the result of measurement error is 15.5/100 points on the FACS-D. Results regarding the association between the FACS-D and other self-reported outcomes were similar to the reported associations of Knezevic et al. (2018) and Bid et al. (2020). The correlation coefficients reported by Knezevic et al. (2018) between the FACS and ODI and between the FACS and pain intensity were very close to the correlation coefficients found in the current study. Bid et al. (2020) reported similar correlation coefficients between the FACS and pain intensity and between the FACS and perceived level of disability, though they used the Roland-Morris Disability Questionnaire instead of the ODI or NDI, as in the present study [64]. One previous study reported a somewhat higher moderate correlation between the FACS and FABQ total scores [64]. However, when looking at the correlation between their FABQ-PA score and the FACS, they also found a weak correlation of 0.32 (p<0.001), which is lower that the weak (approaching moderate) correlation of 0.49 (p<0.05) between the FABQ-PA and FACS-D reported in the present study.
As with other similar studies, several considerations should be made. Importantly, we did not include a behavioural movement assessment in our protocol. It is known that other fear-avoidance-related measures (e.g., TSK) have not been shown to consistently predict actual avoidance behaviour in people with nonspecific low back pain [65], and are only very weakly associated with it in musculoskeletal conditions in general [5, 66]. However, higher FACS severity scores have been shown to be associated with worse lifting performance in subjects with chronic musculoskeletal pain [24]. Therefore, it is of high interest to study whether the identified ‘activity avoidance’ dimension of the FACS-D would be able to predict actual avoidance behaviour. Concerning test-retest reliability and measurement error, the test setting was not completely similar between the test sessions, since the retest was completed at home. However, a potential recall bias was minimized by applying an appropriate time interval between the two test periods. We specifically chose to exclude patients who received physiotherapy for their current pain within the previous 6 months since it is known that treatments like pain neuroscience education can influence fear-avoidance but do not necessarily have an immediate impact on pain or disability [67, 68]. Therefore, if these patients would not have been excluded, it is possible that correlations between the FACS-D and pain or disability measures may have been lower. This implies that current results only apply to these patients who did not receive physiotherapy. Responsiveness, defined as “the ability of a patient-reported instrument to detect change over time in the construct to be measured” [69], was also not investigated in this study, and should be considered in future studies. Studies should also focus on performing a confirmatory factor analyses for the two-factor model of the FACS-D within a new sample and with a representation of the fit indices. Another topic of investigation could be the development of a short version of the FACS. Items that do not perform well should be deleted, potentially resulting in better measurement properties and less time needed to complete the FACS.
Conclusions
The FACS-D demonstrated adequate measurement properties for assessing fear-avoidance in Dutch speaking patients with chronic musculoskeletal pain. Two clinically relevant factors, with a different item distribution than the original FACS, were identified. Factor one represented “pain-related cognitions and emotions” and factor two “avoidance behaviour.” The stronger association between FACS-D and fear-avoidance related constructs suggests that the FACS-D may be more effective in evaluating the cognitive, emotional and behavioural constructs of pain-related fear-avoidance than the other fear-avoidance-related scales studied here.
-
Research funding: None to declare.
-
Author contributions: All authors have accepted responsibility for the entire content of this manuscript and approved its submission.
-
Competing interests: The authors report no conflicts of interest.
-
Informed consent: Informed consent has been obtained from all individuals included in this study.
-
Ethical approval: Research involving human subjects complied with all relevant national regulations, institutional policies and is in accordance with the tenets of the Helsinki Declaration (as amended in 2013), and has been approved by the ethical committee of Jessa Hospital (18.61/reva18.02).
References
1. Rice, AS, Smith, BH, Blyth, FM. Pain and the global burden of disease. Pain 2016;157:791–6. https://doi.org/10.1097/j.pain.0000000000000454.Search in Google Scholar PubMed
2. Bletterman, AN, de Geest-Vrolijk, ME, Vriezekolk, JE, Nijhuis-van der Sanden, MW, van Meeteren, NL, Hoogeboom, TJ. Preoperative psychosocial factors predicting patient’s functional recovery after total knee or total hip arthroplasty: a systematic review. Clin Rehabil 2018;32:512–25. https://doi.org/10.1177/0269215517730669.Search in Google Scholar PubMed
3. Baets, LD, Matheve, T, Meeus, M, Struyf, F, Timmermans, A. The influence of cognitions, emotions and behavioral factors on treatment outcomes in musculoskeletal shoulder pain: a systematic review. Clin Rehabil 2019;33:980–91. https://doi.org/10.1177/0269215519831056.Search in Google Scholar PubMed
4. Luque-Suarez, A, Falla, D, Morales-Asencio, JM, Martinez-Calderon, J. Is kinesiophobia and pain catastrophising at baseline associated with chronic pain and disability in whiplash-associated disorders? A systematic review. Br J Sports Med 2020;54:892–7. https://doi.org/10.1136/bjsports-2018-099569.Search in Google Scholar PubMed
5. Christe, G, Crombez, G, Edd, S, Opsommer, E, Jolles, BM, Favre, J. Relationship between psychological factors and spinal motor behaviour in low back pain: a systematic review and meta-analysis. Pain 2021;162:672–86. https://doi.org/10.1097/j.pain.0000000000002065.Search in Google Scholar PubMed
6. Wertli, MM, Burgstaller, JM, Weiser, S, Steurer, J, Kofmehl, R, Held, U. Influence of catastrophizing on treatment outcome in patients with nonspecific low back pain: a systematic review. Spine 2014;39:263–73. https://doi.org/10.1097/brs.0000000000000110.Search in Google Scholar
7. Wertli, MM, Rasmussen-Barr, E, Weiser, S, Bachmann, LM, Brunner, F. The role of fear avoidance beliefs as a prognostic factor for outcome in patients with nonspecific low back pain: a systematic review. Spine J 2014;14:816–36. https://doi.org/10.1016/j.spinee.2013.09.036.Search in Google Scholar PubMed
8. Ortego, G, Villafañe, JH, Doménech-García, V, Berjano, P, Bertozzi, L, Herrero, P. Is there a relationship between psychological stress or anxiety and chronic nonspecific neck-arm pain in adults? A systematic review and meta-analysis. J Psychosom Res 2016;90:70–81. https://doi.org/10.1016/j.jpsychores.2016.09.006.Search in Google Scholar PubMed
9. Alhowimel, A, AlOtaibi, M, Radford, K, Coulson, N. Psychosocial factors associated with change in pain and disability outcomes in chronic low back pain patients treated by physiotherapist: a systematic review. SAGE Open Med 2018;6: 2050312118757387. https://doi.org/10.1177/2050312118757387.Search in Google Scholar PubMed PubMed Central
10. Heymans, MW, van Buuren, S, Knol, DL, Anema, JR, van Mechelen, W, de Vet, HC. The prognosis of chronic low back pain is determined by changes in pain and disability in the initial period. Spine J 2010;10:847–56. https://doi.org/10.1016/j.spinee.2010.06.005.Search in Google Scholar PubMed
11. Chou, R, Shekelle, P. Will this patient develop persistent disabling low back pain? JAMA 2010;303:1295–302. https://doi.org/10.1001/jama.2010.344.Search in Google Scholar PubMed
12. Diatchenko, L, Fillingim, RB, Smith, SB, Maixner, W. The phenotypic and genetic signatures of common musculoskeletal pain conditions. Nat Rev Rheumatol 2013;9:340–50. https://doi.org/10.1038/nrrheum.2013.43.Search in Google Scholar PubMed PubMed Central
13. Vlaeyen, JW, Crombez, G, Linton, SJ. The fear-avoidance model of pain. Pain 2016;157:1588–9. https://doi.org/10.1097/j.pain.0000000000000574.Search in Google Scholar PubMed
14. Crombez, G, Eccleston, C, Van Damme, S, Vlaeyen, JW, Karoly, P. Fear-avoidance model of chronic pain: the next generation. Clin J Pain 2012;28:475–83. https://doi.org/10.1097/AJP.0b013e3182385392.Search in Google Scholar PubMed
15. Meulders, A. From fear of movement-related pain and avoidance to chronic pain disability: a state-of-the-art review. Curr Opin Behav Sci 2019;26:130–6. https://doi.org/10.1016/j.cobeha.2018.12.007.Search in Google Scholar
16. Sullivan, MJ, Adams, H, Horan, S, Maher, D, Boland, D, Gross, R. The role of perceived injustice in the experience of chronic pain and disability: scale development and validation. J Occup Rehabil 2008;18:249–61. https://doi.org/10.1007/s10926-008-9140-5.Search in Google Scholar PubMed
17. Waddell, G, Newton, M, Henderson, I, Somerville, D, Main, CJ. A fear-avoidance beliefs questionnaire (FABQ) and the role of fear-avoidance beliefs in chronic low back pain and disability. Pain 1993;52:157–68. https://doi.org/10.1016/0304-3959(93)90127-b.Search in Google Scholar
18. McCracken, LM, Zayfert, C, Gross, RT. The pain anxiety symptoms scale: development and validation of a scale to measure fear of pain. Pain 1992;50:67–73. https://doi.org/10.1016/0304-3959(92)90113-p.Search in Google Scholar
19. Miller, RP, Kori, SH, Todd, DD. The Tampa scale: a measure of kinisophobia. Clin J Pain 1991;7:51. https://doi.org/10.1097/00002508-199103000-00053.Search in Google Scholar
20. Lundberg, M, Grimby-Ekman, A, Verbunt, J, Simmonds, MJ. Pain-related fear: a critical review of the related measures. Pain Res Treat 2011;2011:494196. https://doi.org/10.1155/2011/494196.Search in Google Scholar PubMed PubMed Central
21. Pincus, T, Smeets, RJ, Simmonds, MJ, Sullivan, MJ. The fear avoidance model disentangled: improving the clinical utility of the fear avoidance model. Clin J Pain 2010;26:739–46. https://doi.org/10.1097/AJP.0b013e3181f15d45.Search in Google Scholar PubMed
22. Rainville, J, Smeets, RJ, Bendix, T, Tveito, TH, Poiraudeau, S, Indahl, AJ. Fear-avoidance beliefs and pain avoidance in low back pain: translating research into clinical practice. Spine J 2011;11:895–903. https://doi.org/10.1016/j.spinee.2011.08.006.Search in Google Scholar PubMed
23. Neblett, R, Mayer, TG, Hartzell, MM, Williams, MJ, Gatchel, RJ. The fear-avoidance components scale (FACS): development and psychometric evaluation of a new measure of pain-related fear avoidance. Pain Pract 2016;16:435–50. https://doi.org/10.1111/papr.12333.Search in Google Scholar PubMed
24. Neblett, R, Mayer, TG, Williams, MJ, Asih, S, Cuesta-Vargas, AI, Hartzell, MM, et al.. The fear-avoidance components scale (FACS): responsiveness to functional restoration treatment in a chronic musculoskeletal pain disorder (CMPD) population. Clin J Pain 2017;33:1088–99. https://doi.org/10.1097/ajp.0000000000000501.Search in Google Scholar
25. Sullivan, MJ, Bishop, SR, Pivik, J. The pain catastrophizing scale: development and validation. Psychol Assess 1995;7:524–32. https://doi.org/10.1037/1040-3590.7.4.524.Search in Google Scholar
26. Knezevic, A, Neblett, R, Gatchel, RJ, Jeremic-Knezevic, M, Bugarski-Ignjatovic, V, Tomasevic-Todorovic, S, et al.. Psychometric validation of the Serbian version of the fear avoidance component scale (FACS). PLoS One 2018;13:e0204311. https://doi.org/10.1371/journal.pone.0204311.Search in Google Scholar PubMed PubMed Central
27. Cuesta-Vargas, AI, Neblett, R, Gatchel, RJ, Roldán-Jiménez, C. Cross-cultural adaptation and validity of the Spanish fear-avoidance components scale and clinical implications in primary care. BMC Fam Pract 2020;21:44. https://doi.org/10.1186/s12875-020-01116-x.Search in Google Scholar PubMed PubMed Central
28. Bid, D, Neblett, R, Alagappan, T, Patel, C, Patel, K, Patel, R, et al.. Cross-cultural adaptation, reliability, and validity of the Gujarati fear-avoidance components scale. Physiother – J Indian Assoc Physiother 2020;14:98–107. https://doi.org/10.4103/pjiap.Pjiap_35_19.Search in Google Scholar
29. Beaton, DE, Bombardier, C, Guillemin, F, Ferraz, MB. Guidelines for the process of cross-cultural adaptation of self-report measures. Spine 2000;25:3186–91. https://doi.org/10.1097/00007632-200012150-00014.Search in Google Scholar PubMed
30. Jensen, MP, Karoly, P, Braver, S. The measurement of clinical pain intensity: a comparison of six methods. Pain 1986;27:117–26. https://doi.org/10.1016/0304-3959(86)90228-9.Search in Google Scholar PubMed
31. Young, IA, Dunning, J, Butts, R, Mourad, F, Cleland, JA. Reliability, construct validity, and responsiveness of the neck disability index and numeric pain rating scale in patients with mechanical neck pain without upper extremity symptoms. Physiother Theory Pract 2019;35:1328–35. https://doi.org/10.1080/09593985.2018.1471763.Search in Google Scholar PubMed
32. Cleland, JA, Childs, JD, Whitman, JM. Psychometric properties of the neck disability index and numeric pain rating scale in patients with mechanical neck pain. Arch Phys Med Rehabil 2008;89:69–74. https://doi.org/10.1016/j.apmr.2007.08.126.Search in Google Scholar PubMed
33. Vendrig, A, Deutsz, P, Vink, I. Nederlandse vertaling en bewerking van de fear avoidance beliefs questionnaire. J Pain 1998;18:11–5.Search in Google Scholar
34. Cleland, JA, Fritz, JM, Childs, JD. Psychometric properties of the fear-avoidance beliefs questionnaire and Tampa scale of kinesiophobia in patients with neck pain. Am J Phys Med Rehabil 2008;87:109–17. https://doi.org/10.1097/PHM.0b013e31815b61f1.Search in Google Scholar PubMed
35. George, SZ, Valencia, C, Beneciuk, JM. A psychometric investigation of fear-avoidance model measures in patients with chronic low back pain. J Orthop Sports Phys Ther 2010;40:197–205. https://doi.org/10.2519/jospt.2010.3298.Search in Google Scholar PubMed
36. Goubert, L, Crombez, G, Van Damme, S, Vlaeyen, JW, Bijttebier, P, Roelofs, J. Confirmatory factor analysis of the Tampa scale for kinesiophobia: invariant two-factor model across low back pain patients and fibromyalgia patients. Clin J Pain 2004;20:103–10. https://doi.org/10.1097/00002508-200403000-00007.Search in Google Scholar PubMed
37. Goubert, L, Crombez, G, Vlaeyen, J, Van Damme, S, van den broeck, A, Houdenhove, V. De Tampa Schaal voor kinesiofobie: psychometrische karakteristieken en normering. Gedrag Gezond 2000;28:54–62.Search in Google Scholar
38. French, DJ, France, CR, Vigneau, F, French, JA, Evans, RT. Fear of movement/(re)injury in chronic pain: a psychometric assessment of the original English version of the Tampa scale for kinesiophobia (TSK). Pain 2007;127:42–51. https://doi.org/10.1016/j.pain.2006.07.016.Search in Google Scholar PubMed
39. Crombez, G, Vlaeyen, JW, Heuts, PH, Lysens, R. Pain-related fear is more disabling than pain itself: evidence on the role of pain-related fear in chronic back pain disability. Pain 1999;80:329–39. https://doi.org/10.1016/s0304-3959(98)00229-2.Search in Google Scholar PubMed
40. McWilliams, LA, Kowal, J, Wilson, KG. Development and evaluation of short forms of the pain catastrophizing scale and the pain self-efficacy questionnaire. Eur J Pain 2015;19:1342–9. https://doi.org/10.1002/ejp.665.Search in Google Scholar PubMed
41. Zigmond, AS, Snaith, RP. The hospital anxiety and depression scale. Acta Psychiatr Scand 1983;67:361–70. https://doi.org/10.1111/j.1600-0447.1983.tb09716.x.Search in Google Scholar PubMed
42. Turk, DC, Dworkin, RH, Trudeau, JJ, Benson, C, Biondi, DM, Katz, NP, et al.. Validation of the hospital anxiety and depression scale in patients with acute low back pain. J Pain 2015;16:1012–21. https://doi.org/10.1016/j.jpain.2015.07.001.Search in Google Scholar PubMed
43. van Hooff, ML, Spruit, M, Fairbank, JC, van Limbeek, J, Jacobs, WC. The oswestry disability index (version 2.1a): validation of a dutch language version. Spine 2015;40:E83–90. https://doi.org/10.1097/brs.0000000000000683.Search in Google Scholar
44. Köke, AJ, Heuts, PH, Vlaeyen, JW, Weber, WE. Meetinstrumenten chronische pijn. Deel 1: functionele status. Pijn Kennis Centrum; 1996:52–4 pp. Available from: https://docplayer.nl/3596201-Meetinstrumentenchronische-pijn.html.Search in Google Scholar
45. Hudak, PL, Amadio, PC, Bombardier, C. Development of an upper extremity outcome measure: the DASH (disabilities of the arm, shoulder and hand) [corrected]. The upper extremity collaborative group (UECG). Am J Ind Med 1996;29:602–8. https://doi.org/10.1002/(sici)1097-0274(199606)29:6<602::Aid-ajim4>3.0.Co;2-l.10.1002/(SICI)1097-0274(199606)29:6<602::AID-AJIM4>3.0.CO;2-LSearch in Google Scholar
46. Beaton, DE, Katz, JN, Fossel, AH, Wright, JG, Tarasuk, V, Bombardier, C. Measuring the whole or the parts? Validity, reliability, and responsiveness of the disabilities of the arm, shoulder and hand outcome measure in different regions of the upper extremity. J Hand Ther 2001;14:128–46. https://doi.org/10.1016/S0894-1130%2801%2980043-0.10.1016/S0894-1130(01)80043-0Search in Google Scholar
47. Klässbo, M, Larsson, E, Mannevik, E. Hip disability and osteoarthritis outcome score. An extension of the western ontario and McMaster universities osteoarthritis index. Scand J Rheumatol 2003;32:46–51. https://doi.org/10.1080/03009740310000409.Search in Google Scholar
48. Nilsdotter, AK, Lohmander, LS, Klässbo, M, Roos, EM. Hip disability and osteoarthritis outcome score (HOOS)-validity and responsiveness in total hip replacement. BMC Muscoskel Disord 2003;4:10. https://doi.org/10.1186/1471-2474-4-10.Search in Google Scholar
49. Collins, NJ, Misra, D, Felson, DT, Crossley, KM, Roos, EM. Measures of knee function: international knee documentation committee (IKDC) subjective knee evaluation form, knee injury and osteoarthritis outcome score (KOOS), knee injury and osteoarthritis outcome score physical function short form (KOOS-PS), knee outcome survey activities of daily living scale (KOS-ADL), lysholm knee scoring scale, oxford knee score (OKS), western ontario and McMaster universities osteoarthritis index (WOMAC), activity rating scale (ARS), and tegner activity score (TAS). Arthritis Care Res 2011;63(11 Suppl):S208–28. https://doi.org/10.1002/acr.20632.Search in Google Scholar
50. Arbuckle, JL. Amos (version 23.0) [computer program]. Chicago, IL: IBM SPSS; 2014.Search in Google Scholar
51. de Vet, HCW, Terwee, CB, Mokkink, LB, Knol, DL. Measurement in medicine: a practical guide. Practical guides to biostatistics and epidemiology. New York, USA: Cambridge University Press; 2011.10.1017/CBO9780511996214Search in Google Scholar
52. Ellis, JL. Statistiek voor de psychologie: factoranalyse en itemanalyse. Meppel, The Netherlands: Boom Lemma; 2013.Search in Google Scholar
53. Sijtsma, K. On the use, the misuse, and the very limited usefulness of Cronbach’s alpha. Psychometrika 2009;74:107–20. https://doi.org/10.1007/s11336-008-9101-0.Search in Google Scholar
54. Prinsen, CA, Vohra, S, Rose, MR, Boers, M, Tugwell, P, Clarke, M, et al.. How to select outcome measurement instruments for outcomes included in a “core outcome set” – a practical guideline. Trials 2016;17:449. https://doi.org/10.1186/s13063-016-1555-2.Search in Google Scholar
55. Terwee, CB, Bot, SD, de Boer, MR, van der Windt, DA, Knol, DL, Dekker, J, et al.. Quality criteria were proposed for measurement properties of health status questionnaires. J Clin Epidemiol 2007;60:34–42. https://doi.org/10.1016/j.jclinepi.2006.03.012.Search in Google Scholar
56. Horn, JL. A rationale and test for the number of factors in factor analysis. Psychometrika 1965;30:179–85. https://doi.org/10.1007/bf02289447.Search in Google Scholar PubMed
57. Zwick, WR, Velicer, WF. Factors influencing four rules for determining the number of components to retain. Multivariate Behav Res 1982;17:253–69. https://doi.org/10.1207/s15327906mbr1702_5.Search in Google Scholar PubMed
58. Rumsey, DJ. Statistics for dummies: Wiley; 2016. Available from: https://books.google.be/books?id=76o6DAAAQBAJ.Search in Google Scholar
59. Zale, EL, Lange, KL, Fields, SA, Ditre, JW. The relation between pain-related fear and disability: a meta-analysis. J Pain 2013;14:1019–30. https://doi.org/10.1016/j.jpain.2013.05.005.Search in Google Scholar PubMed PubMed Central
60. Alamam, DM, Leaver, A, Alsobayel, HI, Moloney, N, Lin, J, Mackey, MG. Low back pain-related disability is associated with pain-related beliefs across divergent non-English-speaking populations: systematic review and meta-analysis. Pain Med 2021;22:2974–89. https://doi.org/10.1093/pm/pnaa430.Search in Google Scholar PubMed
61. Kroska, EB. A meta-analysis of fear-avoidance and pain intensity: the paradox of chronic pain. Scand J Pain 2016;13:43–58. https://doi.org/10.1016/j.sjpain.2016.06.011.Search in Google Scholar PubMed
62. Vivek, PH, Singh, SN, Mishra, S, Donavan, DT. Parallel analysis engine to aid in determining number of factors to retain using R [Computer Program]; 2017. Available from: https://analytics.gonzaga.edu/parallelengine/.Search in Google Scholar
63. Tabachnick, B, Fidell, LS. Using multivariate statistics. London, UK: Allyn & Bacon; 2001.Search in Google Scholar
64. Roland, M, Fairbank, J. The roland-morris disability questionnaire and the oswestry disability questionnaire. Spine 2000;25:3115–24. https://doi.org/10.1097/00007632-200012150-00006.Search in Google Scholar PubMed
65. Matheve, T, Baets, LD, Bogaerts, K, Timmermans, A. Lumbar range of motion in chronic low back pain is predicted by task-specific, but not by general measures of pain-related fear. Eur J Pain 2019;23:1171–84. https://doi.org/10.1002/ejp.1384.Search in Google Scholar PubMed
66. Baets, LD, Matheve, T, Timmermans, A. The association between fear of movement, pain catastrophizing, pain anxiety, and protective motor behavior in persons with peripheral joint conditions of a musculoskeletal origin: a systematic review. Am J Phys Med Rehabil 2020;99:941–9. https://doi.org/10.1097/phm.0000000000001455.Search in Google Scholar PubMed
67. Malfliet, A, Kregel, J, Meeus, M, Roussel, N, Danneels, L, Cagnie, B, et al.. Blended-learning pain neuroscience education for people with chronic spinal pain: randomized controlled multicenter trial. Phys Ther 2018;98:357–68. https://doi.org/10.1093/ptj/pzx092.Search in Google Scholar PubMed
68. Amer-Cuenca, JJ, Pecos-Martín, D, Martínez-Merinero, P, Lluch Girbés, E, Nijs, J, Meeus, M, et al.. How much is needed? Comparison of the effectiveness of different pain education dosages in patients with fibromyalgia. Pain Med 2020;21:782–93. https://doi.org/10.1093/pm/pnz069.Search in Google Scholar PubMed
69. Mokkink, LB, Terwee, CB, Patrick, DL, Alonso, J, Stratford, PW, Knol, DL, et al.. The COSMIN study reached international consensus on taxonomy, terminology, and definitions of measurement properties for health-related patient-reported outcomes. J Clin Epidemiol 2010;63:737–45. https://doi.org/10.1016/j.jclinepi.2010.02.006.Search in Google Scholar PubMed
Supplementary Material
The online version of this article offers supplementary material (https://doi.org/10.1515/sjpain-2022-0046).
© 2022 Walter de Gruyter GmbH, Berlin/Boston
Articles in the same Issue
- Frontmatter
- Editorial Comment
- Chronic pain and health inequalities: why we need to act
- Systematic Reviews
- Resilience as a protective factor in face of pain symptomatology, disability and psychological outcomes in adult chronic pain populations: a scoping review
- Is intravenous magnesium sulphate a suitable adjuvant in postoperative pain management? – A critical and systematic review of methodology in randomized controlled trials
- Topical Review
- Pain assessment 3 × 3: a clinical reasoning framework for healthcare professionals
- Clinical Pain Researches
- The treatment lottery of chronic back pain? A case series at a multidisciplinary pain centre
- Parameters of anger as related to sensory-affective components of pain
- Loneliness in patients with somatic symptom disorder
- The development and measurement properties of the Dutch version of the fear-avoidance components scale (FACS-D) in persons with chronic musculoskeletal pain
- Observational Studies
- Can interoceptive sensitivity provide information on the difference in the perceptual mechanisms of recurrent and chronic pain? Part I. A retrospective clinical study related to multidimensional pain assessment
- Distress intolerance and pain catastrophizing as mediating variables in PTSD and chronic noncancer pain comorbidity
- Stress-induced headache in the general working population is moderated by the NRCAM rs2300043 genotype
- Does poor sleep quality lead to increased low back pain the following day?
- “I had already tried that before going to the doctor” – exploring adolescents’ with knee pain perspectives on ‘wait and see’ as a management strategy in primary care; a study with brief semi-structured qualitative interviews
- Problematic opioid use among osteoarthritis patients with chronic post-operative pain after joint replacement: analyses from the BISCUITS study
- Worst pain intensity and opioid intake during the early postoperative period were not associated with moderate-severe pain 12 months after total knee arthroplasty – a longitudinal study
- Original Experimentals
- How gender affects the decoding of facial expressions of pain
- A simple, bed-side tool to assess evoked pressure pain intensity
- Effects of psychosocial stress and performance feedback on pain processing and its correlation with subjective and neuroendocrine parameters
- Participatory research: a Priority Setting Partnership for chronic musculoskeletal pain in Denmark
- Educational Case Report
- Hypophosphatasia as a plausible cause of vitamin B6 associated mouth pain: a case-report
- Short Communications
- Pain “chronification”: what is the problem with this model?
- Korsakoff syndrome and altered pain perception: a search of underlying neural mechanisms