Consumption and climate change: Why we say one thing but do another in the face of our greatest threat
-
 and
and

Abstract
There is clear evidence that human beings have contributed to climate change through their patterns of consumption, and, it could be argued that, since we are part of the problem then we must be part of the solution. The apparently good news is that people report that they have very positive attitudes to environmentally-friendly products and they also consistently say that they are prepared to adapt their behavior to ameliorate the effects of climate change. However, numerous studies have found little behavior change on the part of consumers. This study investigates this critical issue experimentally. It does this by exploring whether self-reported attitudes to low carbon products, or alternatively implicit attitudes to such products (measured using an associative task and not requiring self-report), predict consumer choice of products varying on a range of dimensions including environmental consequences, in an experimental context where time for selection was also systematically varied. We found firstly, in line with previous research, that human beings have explicit and implicit attitudes that are not correlated. Secondly, in terms of brand choice, we found that consumers are particularly sensitive to both brand information and value in their selection of products, particularly under time pressure. Organic/eco brands are, however, much less favoured, especially under any time pressure, where processes that are more automatic prevail. Thirdly, color-coded carbon footprint information can influence choice even under time pressure but only for those consumers with a strong positive implicit attitude to carbon footprint. The conclusions from this research are that humans beings may well have a “divided self” when it comes to the environment and climate change, and this underlying “dissociation” in attitude (implicit versus explicit) might be critical to their behavior as consumers. This concept of the“divided self” may help us understand why relatively little has changed thus far with regard to more sustainable consumption, but might open up new lines of enquiry about how we might attempt to promote more sustainable consumption in the future.
1 Introduction
Climate change represents the greatest threat that we, as a species, have faced. The scientific evidence for climate change and its likely effects is overwhelming. Indeed, despite what critics like the Global Warming Policy Foundation say, it is rare to see such a scientific consensus on anything (see Stocker et al. 2014). According to the Stern Review, which reported a decade or so ago, “Climate change threatens the basic elements of life for people around the world.” Stern’s review continued: “A rise in global temperature will have: severe and widespread impacts, major risks to global food production, and more extreme fluctuations in weather, including droughts, flooding and storms.” However, Stern (2006) also made another critical point: “Human activities are a major driver of this rapid change in our climate... particularly patterns of consumption and energy use, driven by consumer demand for higher standards of living.” In other words, we as consumers are playing a major role in the creation of this problem. Clearly, if we are part of the problem, then we must be part of the solution. This point has not been lost on agencies like the United Nations, selected governments around the world, NGO’s and many leading multinationals, indeed the very same multinationals that have made it their mission to promote (and then satisfy) this increasing consumer demand.
Take Unilever, for example, one of the top ten global companies in terms of both turnover and reach. This company reports an annual turnover of around £40 billion with its products sold in 190 countries across the globe (Unilever Sustainable Living Plan 2013). It proudly boasts that 2 billion times a day, a consumer somewhere on the globe uses one of their products. The Key Performance Indicators (KPI) of this enormous company are, not surprisingly, primarily financial – they are currently aiming for 5 % growth per year. However, they do recognize the essential dilemma that they (and we) are all facing. In their “Sustainable Living Plan” they say that “We are living in a world where temperatures are rising; water is scarce, energy expensive, food supplies uncertain and the gap between rich and poor increasing” (Unilever Sustainable Living Plan 2013: 1). Their conclusion is that “Business must be part of the solution. Sustainable, equitable growth is the only acceptable business model” and that “in order to live within the natural limits of the planet we will have to decouple growth from environmental impact.” Therefore, they have another KPI, which is not about finance, but about the environment. As a company, they aim to “halve the greenhouse gas impact of our products across the lifecycle by 2020” (2013: 16). In pursuit of this goal, they have reduced greenhouse gas emissions from their manufacturing chain and reduced deforestation. They have opted for more environmentally friendly sourcing of raw materials. They have doubled their use of renewable energy and produced concentrated liquids and powders. They have reduced greenhouse gas emissions from transport and reduced greenhouse gas emissions from refrigeration. They have also reduced employee travel. So what effect did all of these initiatives have on their environmental impact? Their report solemnly concluded: “Our greenhouse gas footprint impact per consumer has.... increased by around 5 % since 2010” (2013: 16). Their inevitable conclusion was that “We have made good progress in those areas under our control but... the big challenges are those areas not under our direct control like.... consumer behavior.”
It would seem that the problem essentially is us, in terms of how we behave and what we do. It is our behavior with respect to these good environmental products (in terms of our patterns of usage and our generation of waste, our fondness for refrigeration, the length of the showers we choose to take, our use of energy, etc.) that is the problem, and why we choose the environmentally unfriendly alternatives in the first place. We just do not seem to be responding appropriately to this global issue. But why might this be?
There is a multiplicity of possible reasons. The effects of climate change are (unfortunately from some points of view) less personal than other looming disasters, and will primarily affect future generations (Hansen et al. 2013). Climate change cannot be reversed immediately and we know that delayed contingent reinforcement and punishment is highly problematic for behavior change (see Skinner 1938). Climate change also requires a “global response,” but because it is a global issue (Walker and King 2008), involving many different countries, we can expect a diffusion of responsibility, and “social loafing” on an international scale, essentially leaving the solution to others. It also seems that quite simple experiences can occasion quite significant shifts of responsibility at the level of the individual (Beattie et al. 2011). For example, when experimental participants in the UK watched sections of the film An Inconvenient Truth highlighting China’s industrialization and its dirty power stations, then they were significantly more likely to agree to statements like “It is the responsibility of other countries, not the UK, to reduce climate change” and “Climate change is a problem to be solved by future generations.” This all happened because they had been briefly reminded of China’s huge coal reserves and its use of old technology in coal-burning technology (see also Beattie 2010: 221; Beattie, 2013a). Uncertainty about the time course of climate change undoubtedly also plays an important role in our inertia, with powerful lobbies behind this uncertainty (according to the BBC 2015, the US fossil fuel giants, the Koch Brothers, are spending $900 million a year on advertising to promote their counter-arguments about climate change). This is all rather similar to the “uncertainty” that was generated about the relationship between smoking and lung cancer by the tobacco industry between the 1950s and 1980s (Conway and Oreskes 2010).
Then again, climate change is complicated; it requires an understanding of basic physics to understand the mechanisms underpinning it (without a very high degree of simplification). The public even find some of the proposed solutions too complicated in terms of the physics involved. Take carbon labeling, for example, which is the practice of communicating the greenhouse gas (GHG) emissions associated with the life cycle of a product or service. This process of enhancing product information to promote more sustainable consumption has been stressed in a variety of top-level policy reports (see Upham et al. 2011). These include UN Agenda 21 United Nations (1992), the EU Sustainable Consumption and Production Action Plan (Commission of the European Communities 2008), the UK Sustainable Development Report (Department for Environment, Food, and Rural Affairs 2005), and the United States Environmental Protection Agency (1998). However, Upham et al. (2011) tested the public’s reaction to carbon labeling in a series of focus groups and found that they had genuine difficulty in understanding how a gas (or gases) could even be expressed in terms of its mass (260g of carbon etc.), which, of course, is the essence of carbon labeling. They also had severe difficulty in linking the emission figures to their environmental impact.
Then there is the emotional valence of “global warming” (Beattie 2010), which sounds almost benign. At the opposite extreme, with climate change we probably have something, which is too catastrophic to contemplate. In order to maintain some degree of psychological stability in the face of this threat and to remain relatively optimistic about the future, people may well avoid contemplating climate change whenever and wherever possible (Ehrenreich 2009a, 2009b). We may even subconsciously avoid seeing images connected with climate change as we do with other sorts of negative images (Isaacowitz 2005, 2006; see also Beattie and McGuire 2012).
Thus, for a myriad of reasons, it is clearly going to be difficult to get the public to change their behavior in the light of this particular threat. However, some have maintained a degree of optimism despite all of this, and they have argued that it may be difficult to promote major behavioral change, but it is not impossible. These proponents of behavior change suggest that in order to do this successfully we have to “read” people better and to design better initiatives, which build on these underlying psychological insights. The first step, they say, is to “read the mind” of the consumer (although they may not use these exact words) in order to ascertain which sections of society (or indeed all of it) are ready for change. In order to do this, they say, we must access the underlying attitudes of the public to climate change and sustainable living. An attitude is classically defined as “a mental and neural state of readiness organised through experience, exerting a directive or dynamic influence upon the individual’s response to all objects and situations with which it is related” (Allport 1935: 810). This “mind reading” might seem to be very difficult, but an extraordinary number of influential people and organizations think it is possible, and even relatively easy (you just have to ask the public to report their attitudes in carefully constructed surveys).
Take, for example, the arguments of Leahy (2007), the then CEO of Tesco (the multinational supermarket chain), when he announced a call to arms to tackle the problem of climate change. His message was simple. He said that “The green movement must become a mass movement in green consumption.” In order to achieve this goal Leahy argued that “we must empower everyone – not just the enlightened or the affluent.” He believed that the market was ready for this green consumer “revolution,” and his proposed solution was to break down the barriers of price and information. In other words, he was arguing, from a marketing and business point of view, that we must make green choices affordable and give the consumer the right information to make informed decisions to produce a “revolutionary” change in patterns of consumption. He then did some mind reading when he suggested that “Customers want to do more in the fight against climate change if only we can make it easier and more affordable,” and pointed to numerous market research surveys, which seemed to support his conclusion. Various surveys had reported that “70 % of people agree that if there is no change in the world, we will soon experience a major environmental crisis” and “78 % of people say that they are prepared to change their behavior to help limit climate change” (see Downing and Ballantyne 2007). These sorts of findings are very consistent across time. Thus, the British Social Attitudes survey (2012) revealed that 76 % of people “believe climate change is happening and that humans are, at least partly, responsible.” More recently, the Department of Energy and Climate Change (2015) in the UK found that 66 % of people “reported feeling very or fairly concerned about climate change,” based on a survey of nearly 2000 face-to-face home interviews.
So Leahy was basing his planned initiative, which was the carbon labeling of Tesco products, on the reading of consumer minds (“they were prepared to change their behavior,” etc.). Similarly, the UK government, in the guise of the Department of Environment, Food and Rural Affairs (DEFRA), started from the assumption that “Policy action needs to be rooted in understanding and awareness of consumer behavior” (2008: 22). They argued that we must focus on people’s ability to act and people’s willingness to act, and then they too engaged in mind reading. “Many people are willing to do more to limit their environmental impact, they have a much lower level of understanding about what they can do and what would make a difference” (2008: 28). Having read the mind of the consumer, and assessed the “mental and neural state of readiness” in Allport’s words (identifying “a positive underlying attitude to the environment” in this case), they then carried out various segmentation analyses of the public at large. These analyses were used to segment the population into identifiable groups with different socio-economic profiles, consumer habits and patterns of media consumption, and various campaigns were then planned aimed at each of the segments. However, few of these social marketing campaigns had the intended outcomes (see Corner and Randall 2011).
We would like to suggest a very simple hypothesis for this failure: we want to argue that it is more difficult than it might appear to read the minds of consumers because consumers do not have a mind; they have two. There is mounting evidence that people have two distinct cognitive systems each with its own properties and mode of operation, with one of these systems not open to introspection (Kahneman 2011). Kahneman calls these systems System 1 (the fast, automatic, and largely unconscious system) and System 2 (the slower, more deliberate, reflective, and conscious system). This could be the reason why many initiatives aimed at behavioral adaptation to climate change have failed. They have made the wrong basic assumptions about human beings.
This hypothesis could help explain a number of things. Consider first one of the core problems in the attitude-behavior literature. Why do people report positive attitudes about the environment, but then do very little to ameliorate the effects of their own lifestyle on the environment – the so-called “value-action” gap? This “value-action” gap emerges repeatedly in the research literature in the area of consumption in a range of countries. For example, Aertsens et al. (2009) noted:
While most consumers hold positive attitudes towards organic food (Magnusson et al. 2001; Saba and Messina 2003; Kihlberg and Risvik 2007), the proportion of consumers purchasing organic food on a regular basis remains low, with market shares of organic products in European countries, varying from below one percent in some Southern, Central and Eastern European countries to over 5% (Sahota 2009; Padel et al. 2009).
(Aertsens et al. 2009: 1140)
Similarly the Swedish researchers Roos and Tjarnemo (2011) wrote “While a large proportion of the population has positive attitudes towards caring for the environment, these positive attitudes are not always translated into actual behavior. Sales of organic food products are low” (2011: 983). Vermeir and Verbeke (2006) say that “initiatives like sustainable organic food, product free from child labor, legally logged wood, and fair-trade products often have market shares of less than 1 %” (MacGillivray 2000). This is at least partly due to the attitude-behavior gap: attitudes alone are often a poor predictor of behavioral intention or market place behavior (Kraus 1995; Ajzen 2001).
There are clearly different ways of attempting to resolve this “value-action” gap. You could assume that you have a good measure of underlying attitude but what you need to do is to add other psychological components into the model, like subjective norms (beliefs about how others will behave) and perceived behavioral control (whether you think that your behavior will make a difference) in an attempt to boost its predictive power (Ajzen and Fishbein 1980; Ajzen 1985, 1991). Alternatively, you can consider other economic, marketing or commercial features of products (like price, quality, convenience, and brand familiarity, see Vermeir and Verbeke 2006: 171) that may impact on consumer choice and factor those into the model in an interactive way.
However, there is, of course, another possibility, which is that perhaps we have been measuring attitudes incorrectly in the first place, or the wrong sort of attitudes. Indeed one might question whether our “mental and neural state of readiness” is open to introspection, and whether we could ever hope to report it accurately in surveys. Allport himself seemed to show some awareness of this in his classic 1935 volume. He wrote “The meagreness with which attitudes are represented in consciousness resulted in a tendency to regard them as manifestations of brain activity or of the unconscious mind. The persistence of attitudes which are totally unconscious was demonstrated by Muller and Pilzecker (1900)” (Allport 1935: 801). He clearly did not rule out the concept of the unconscious attitude but chose to focus exclusively on the measurement of attitudes with self-report questionnaires. One of the authors has argued elsewhere (Beattie 2013b) that his reasons for this particular focus were both academic and highly personal. Academically, he had been clearly impressed by Likert’s early research on the measurement of racial attitudes using objective self-reports (the observable data that the new science of psychology craved). However, at a more personal level, it is clear from Allport’s autobiography that he was appalled by Freud’s attempt to psychoanalyze him on his visit to Vienna in 1920. Allport told Freud a story about a boy on the tram he had just observed who was obsessed with dirt: Freud with his “kindly therapeutic eyes” then asked Allport whether he was the little boy in the story. Allport later argued that “psychoanalytic excess” (what Freud, in his view, was culpable of that afternoon in Vienna) must be avoided at all costs and that we should not delve too deeply into the human psyche without first considering more manifest motives. Allport’s legacy, both academic and personal, then defined attitude measurement in psychology, and related disciplines, for many decades to come.
However, interest in “the meagreness with which attitudes are represented in consciousness,” in other words “implicit cognition” and “implicit attitudes,” has been growing in the past few years, and this could lead us to think very differently about the “value-action” gap. This research might one day tell us that the “value-action” gap does not actually exist because we have been discussing and factoring in the wrong measure of “value” in the first place.
In an international bestseller, the Nobel laureate and behavioral economist Daniel Kahneman (2011) has made a very convincing case for the central role of these implicit and automatic processes in everyday life. Take a very simple example, imagine looking at an angry face – as quickly as you recognize the gender of the person or the color of their hair, you have decoded the facial expression. This is System 1 thinking – it is automatic, unconscious, and fast. A multiplication task, on the other hand, is much slower and more deliberate; it requires effort and is conscious. This is System 2 thinking in Kahneman’s terminology. In everyday life, System 1 is always active, dealing with many of the routine aspects of everyday life. Kahneman characterizes System 1 as a “workaholic” and System 2 as sometimes “a bit lazy” (“harsh... but not unfair,” according to Kahneman 2011: 46). System 1 often jumps rapidly to conclusions, but System 2 does not always check the validity of the conclusions, even when it would be relatively easy to do so. The two systems work on different principles. System 1 works on the principle of associative activation –“ideas that have been evoked trigger many other ideas, in a spreading cascade of activity in your brain. The essential feature of this complex set of mental events is its coherence. Each element is connected, and each supports and strengthens the others” (Kahneman 2011: 51). System 2 uses more propositional and logical reasoning.
Kahneman uses the example of “bananas – vomit” to show how System 1 works in terms of spreading activation. Our minds automatically assume a causal connection between the two words, producing within us an emotional response, and changing the state of our memory so that we are now more likely to recognize and respond to objects and concepts associated with sickness and nausea. We are, for example, more likely to complete the frame “s-ck” as “sick” rather than as “sock” or “suck,” having been unconsciously primed with the paired concepts of “bananas” and “vomit,” all because of the associative “machine” underpinning System 1 thinking. Kahneman argues that as human beings we do not necessarily understand the causes and operations of our own cognitions and behavior because of this fundamental division in our cognitive processes.
When we think of ourselves, we identify with System 2, the conscious, reasoning self that has beliefs, makes choices, and decides what to think about and what to do. Although System 2 believes itself to be where the action is, the automatic System 1... is effortlessly originating impressions and feelings that are the main sources of the explicit beliefs and deliberate choices of System 2.
(Kahneman 2011: 21)
Greenwald (1990) has considered the accumulated effects of all of this associative activation for attitudes, our “mental and neural state of readiness,” and argued that we may well have implicit attitudes formed on such basic processes that are not available to introspection and are indeed unconscious. We may believe that we have a positive attitude to bananas because we think that they are healthy and nutritious, but our associative experiences may provide us with a very different implicit attitude to them (and Seligman 1970, famously demonstrated that you only need a small number of negative experiences to make this happen). The problem with this theorizing about implicit attitudes was that we had no way to access implicit attitudes or measure them reliably, until Greenwald developed a reaction time based task to measure associative connections called the Implicit Association Test or IAT (Greenwald et al. 1998). The basic premise is that when participants categorize items into two sets of paired concepts, then if the paired concepts are strongly associated, participants should be able to categorize the items faster, and with fewer errors, than if they are not strongly associated.
In some domains, consciously reported explicit attitudes and implicit attitudes measured through speed of association are correlated (although the size of the correlation does vary), but in other domains, there seems to be little or no correlation between the two measures and this has led Greenwald and Nosek (2008) to suggest that explicit and implicit attitudes can be “dissociated.” When it comes to climate change, there appears to be no significant correlation between explicit and implicit measures, here in terms of attitude to carbon footprint (Beattie and Sale 2009). Some argue that this is not that surprising and that explicit and implicit attitudes reflect the two very different information-processing systems described by Kahneman and others with different processes of acquisition. Implicit attitudes are based on a slow-learning associative system whereas explicit attitudes are based on a fast learning system, which uses higher-level logic and symbolic representations (Sloman 1996). Rydell et al. (2006) have also shown that you can change implicit and explicit attitudes with different sorts of information. Consciously accessible verbal information about a target changes the explicit attitude towards that target, whereas subliminally presented primes, “reflecting the progressive accretion of attitude object-evaluation pairings,” changes the implicit attitude towards them. You can even change implicit and explicit attitudes in opposite directions by using associative information below the level of conscious awareness to change implicit attitudes, and consciously processed verbal material (in opposition to this) to change explicit attitudes.
So what are the possible implications of this “divided self,” of not having one but two underlying types of attitude, for behavior in general, and more specifically for consumer behavior in the context of the threat of climate change? Both types of attitude can be relevant for behavior, but under different sets of circumstances and this is what the empirical research seems to suggest. Self-report attitudes may predict behavior under certain situations, especially when people have the motivation and the opportunity to deliberate before making a behavioral choice (Fazio et al. 1995), but they are less good at predicting spontaneous behavior under time pressure (Friese et al. 2006; Beattie 2010; Beattie and Sale 2011), or when consumers are under any sort of cognitive or emotional load (Gibson 2008; Hofman et al. 2007). Unfortunately, time pressure, cognitive load, and the absence of any opportunity to deliberate, characterizes much of everyday supermarket shopping (Beattie and Sale 2011). Supermarket shopping is rarely found to be a slow, deliberate, reflective process; the shopper passes about 300 brands per minute (Rundh 2007) and each individual choice is often quick and automatic (Zeithaml 2008). In such contexts, unconsciously held implicit attitudes might be a better predictor of actual consumer behavior than explicit attitudes, where an implicit attitude is defined as “the introspectively unidentified... trace of past experience that mediates R [where R is the response – the favourable or unfavourable feeling, thought, or action towards the social object]” (Greenwald and Banaji 1995: 5). In other words, habitual consumer behavior without much opportunity or motivation to deliberate might be driven by processes not open to introspection and therefore not picked up by self-report measures. They require a different sort of measure. In the words of Greenwald and Banaji (1995: 5) “Investigations of implicit cognition require indirect measures, which neither inform the subject of what is being assessed nor request self-report concerning it.”
The concept of implicit attitude gives us a different way of thinking about the motivational basis for human action and could be a critical element in the fight against climate change. Implicit, rather than explicit attitudes may well be underpinning everyday habitual consumer behaviors. Such behaviors may be “sticky,” in sociological jargon (Downing and Ballantyne 2007) because attempts to change attitudes and behavior just focus on certain types of message, ignoring the associative networks of the implicit system. Recently, we have been investigating how implicit attitudes relate to how we process information relevant to climate change, assuming that the processing of relevant information is the starting point of the whole process of behavioral change. There are many persuasive messages available about climate change, but what happens if people do not see these sorts of messages (Beattie et al. 2011)? In one study (Beattie and McGuire, 2012) we attempted to determine how eye movements towards or away from iconic images of environmental damage and climate change were affected by explicit versus implicit attitudes. We did this by projecting slides onto a computer screen, each slide containing three images, one positive image of nature, one negative image of climate change and environmental damage, and one neutral image (things like pictures of cups, plates and other everyday objects). We found that people do not focus inordinately on the negative images of environmental damage when there are other positive images and neutral images available. They usually look less than 40 % of the time at the negative images. However, very importantly those with strong positive implicit attitudes to carbon footprint were significantly more likely to focus on the negative images of environmental damage and climate change than the positive images. We also found that this even occurs in the first 200 ms of viewing the slide. Those with a positive implicit attitude to low carbon footprint products looked more at the negative images of climate change and environmental damage in the first 200 ms compared with those with less strong positive implicit attitudes to low carbon footprint products. Measures of explicit attitude did not, however, predict patterns of eye movement towards the negative images in this way. It would seem that those who have strong implicit pro-low carbon attitudes are primed to attend to these sorts of images, whereas those with strong explicit attitudes are not (they actually look less).
More recently, Beattie and McGuire (2015) considered the relationship between explicit and implicit attitudes and visual fixation of carbon labels on products. They found that there was no significant relationship between how positive the explicit attitude to carbon footprint was and the overall amount of attention devoted to the carbon label and no effect was found either with our measure of implicit attitude. However, there was a significant statistical association between our measure of implicit attitude and the target of the first fixation. Those individuals with the most positive implicit attitude were more likely to fixate first on the carbon footprint information (rather than “energy” or “price”) compared with those with a more negative implicit attitude. Those with the most positive implicit attitude had a mean of 7.0 first fixations on carbon footprint (out of a possible 16) whereas those with the least positive implicit attitude had a mean of 4.5 first fixations on carbon footprint. This association did not, however, occur with explicit attitude. Those with the most positive explicit scores had a mean of 5.3 first fixations on carbon footprint whereas those with more negative explicit attitudes had a mean of 6.5 first fixations on carbon footprint. This difference was both in the wrong direction and non-significant. So again we find evidence that measures of implicit attitude, but not measures of explicit attitude, predict patterns of unconscious eye movements.
Of course, these studies are about visual attention rather than choice but it is the actual behavioral choices that people make, rather than merely what people notice, that is the critical issue when it comes to climate change. However, one domain where we have explored actual choice is that of racial bias in recruitment. In this research, we showed that, although the vast majority of people report having no preferences either way in terms of race or ethnicity (they report essentially “neutral” attitudes), when implicit bias is measured through the IAT, focusing on the associative connections between the target categories (Black/White) and the attribute categories (good/bad), the majority of participants seem to have an implicit pro-White bias. The White participants had a strong pro-White bias. Furthermore, implicit bias measured in the IAT predicted shortlisting decisions in a recruitment task in a way that explicitly reported attitude did not. The fact that the vacancies in this study were all from that most liberal of institutions, a university make the results even more striking (See Beattie 2013b; Beattie et al. 2013; Beattie and Johnson 2012).
This research opens up the possibility that we may have implicit attitudes at odds with what we report (and indeed at odds with how we think about ourselves), which can nevertheless influence our everyday decisions. So the question remains, to what extent do these implicit attitudes predict consumer choice (given the importance of consumption to climate change)? In a very simple study, Beattie and Sale (2011) had found that when participants were asked to select either a high carbon or low carbon goody bag at the end of an experiment, those with a strong pro-low carbon implicit attitude were more likely to select the low carbon goody bag, but only under time pressure. Very similar results had been reported by Friese et al. (2006) who also found that implicit attitude predicted the choice of a gift (a “generic” gift versus a “branded” gift) for taking part in the experiment, but again only under time pressure. These results are interesting, but of course, tell us very little about how people will behave in a richer consumer choice situation for a number of reasons. Firstly, in terms of what might be called broad ecological considerations, consumer products are characterized by a number of different dimensions (brand, value, taste, health features, environmental implications etc.), all operating simultaneously, which could impact on consumer choice at both the associative and more rational levels. Advertising, of course, is used to build brands (be they well-known brands, luxury brands, organic or eco brands, or value brands) in an associative manner (Aaker and Biel 2013). Thus, when it comes to consumer choice under time pressure, even when System 1 might be more active, these other associations might swamp any implicit associations to do with our attitudes to carbon footprint. Secondly, in terms of experimental considerations, in both Friese et al. (2006), and Beattie and Sale (2011), the choice of the reward was left until the very end of the experiment. At this point, it might have been apparent to participants that the experiment was measuring attitudes to certain attributes of products, and might have produced some demand characteristics about what was or was not appropriate behavior (although this does not explain why explicit attitudes did not predict this choice).
Of course, notwithstanding these points, both studies did suggest that time pressure is a critical variable in this domain, and that implicit attitudes might be more predictive of behavior when time is not freely available and when there is little opportunity to deliberate. This may have particular relevance for consumer choice especially in supermarkets where so much of everyday shopping occurs in advanced Western societies. These kinds of considerations formed the basis for the present study, where we study consumer choice of brands as a function of both time and as a function of both implicit and explicit attitude. Our aim is to investigate what sorts of factors determine choice, and whether the “divided self” of human beings (at least in terms of System 1 and System 2 thinking) has any relevance for our culture of consumption and our ability to adapt to the threat of climate change. Here, we also experimentally investigate whether carbon footprint information has any effect on consumer choice. There is recent evidence from Finland that it can influence consumer choice at least on meat products (Koistinen et al. 2013). In Australia there is evidence that carbon labelling, particularly using color-coded carbon footprints (with a green footprint denoting “below average carbon emissions” and black denoting “above average”) can influence actual shopping behavior, but the effects are not particularly large (high carbon decreasing by 6 %; low carbon increasing by 4 %), unless paired with price. But how would carbon label interact with the other information labels on products (see Gadema and Oglethorpe 2011)? And would it relate in any way to our measures of explicit or implicit attitude? Further, can we find any evidence of “dissociation” in these attitudes towards carbon footprint, which may help explain the relative inaction of the consumer towards climate change so far?
2 Method
2.1 Participants
Fifty participants were recruited to take part in this experiment (19 male and 31 female). The mean age of participants was 27.7 ranging from 18 to 67. Participants included staff and students from Edge Hill And University (n=34), and members of the public (n=16). Each participant received £5.00 for taking part in the experiment. Ethical approval was obtained from the Edge Hill University Research Ethics Committee (UREC). Participants were informed about the test procedure and told that they could withdraw at any point during the experiment and that their data could be removed from the study and destroyed at any point up to three weeks after they had taken part in the experiment (no participant asked for their data to be removed and destroyed).
2.2 Stimuli
Ten products were selected for this study. These were everyday products, which would be central to any family weekly shop. The products chosen were breakfast cereal (bran flakes), bread, cheese, coffee, fabric conditioner, ice cream, orange juice, soup, toilet roll, and washing up liquid. These products have a variety of information labels on the front of the products. The number of these informational labels does vary from product to product, and depend to a certain extent on the price and brand of the product, with the more expensive products having either more information labels or more of their surface area covered by image, logo or icon. For example, the Sharpham Park Morning Multi Flakes (as sold in the UK) is an expensive brand of cereal (a “luxury” brand in our jargon). It retails at £2.99 (compared with £1.38 for a supermarket’s own brand, in other words more than double the price). It contains the following information:
Name of product (“Morning Multi Flakes”).
Image of product.
Name of brand (“Sharpham Park”).
Source of product (“British Grown Grains”).
Health relevant information (“naturally high in fibre...”).
Product description (“Deliciously crispy, light multigrain rice flakes...”).
More product description (“No wheat grains”).
Nutritional information.
Size/weight of product (“375 grams”) (see Figure 1).

Sharpham Park Morning Multi Flakes.
On the other hand, the cheapest (bran flakes) breakfast cereal – the Asda “chosen by you” brand (retailing at £1.38) contains the following information:
Name of product (“Bran Flakes”)
Image of product
Name of brand (“Asda Chosen by you”)
Health relevant information (“Bran enriched wheat flakes, fortified with vitamins....”) (see Figure 2).

Asda “chosen by you” Bran Flakes.
In the case of the washing up liquid, “Town Talk Polish Co ltd” is a luxury brand that retails in the UK at £4.15, which compares with 80p for the supermarket’s own brand. It contains the following information, covering a significant surface area of the product:
Name of product (“Washing up liquid”)
Name of brand (“Town Talk 1895 Polish Co ltd”)
Image of a man with a top hat doing the dishes
Product description (“Superior”)
Scent of product (“basil and lime”) (see Figure 3)

Town Talk Polish Co ltd washing up liquid.
The cheapest washing up liquid used in this study, the “Tesco” own brand contains the following information:
Product description (“Original”)
Name of brand (“Tesco”)
Name of product (“Washing up liquid”)
Image of a white casserole dish surrounded by bubbles (see Figure 4)

Tesco’s own brand washing up liquid.
For each product we selected four variations – luxury (the most expensive), well-known brand (brands like Heinz, Kellogg’s, Hovis, etc.), value (the cheapest alternative, invariably the supermarket’s own brand), and organic/eco (identified as either “organic” or “eco” on the product itself). So, for example, in the case of the bread, the luxury brand selected was “Burgen” the well-known brand was “Hovis,” the value brand selected was “Tesco,” and the organic/eco brand was “Cranks” (see Figure 5).

An example of the images selected for bread.
The price of each product was then superimposed onto the image of the product; price was always represented in white numbers on a black circular background. The positioning of the price sticker was always in the same position across the four individual products in that set (but did vary from set to set). So for example, in the case of cheese, the price sticker was superimposed on the bottom left-hand corner of the product. When it came to bread, in each case the sticker was superimposed on the top right-hand corner. The prices superimposed on the images of the products were always the actual prices. The luxury brands were always the highest in price, then organic/eco, then the well-known brands, followed by the value brands. All of the original details on the product remained the same and were not altered in any way, rather information was only ever added to them.
As well as the addition of price information, the carbon footprint value for each item was also superimposed onto the front of each product. Our intention for carbon footprint was to manipulate carbon footprint information in order to test experimentally its effects on consumer choice. The question was-could carbon footprint information influence consumer decision making? This is a very important theoretical and practical issue for many businesses concerned with climate change. A core consideration was to vary carbon footprint in a systematic way by beginning with the actual carbon footprint of the product (derived from a variety of sources from both government and commercial databases) and then recalculating three additional values using this as the baseline in order to generate two high and two low carbon footprint values. For example, in the case of “soup” we started with 186 grams CO2 for a standard can of “generic” soup. This was represented with “186 g” on a black footprint and assigned arbitrarily to the value version of the product. This figure was then halved to generate a lower carbon footprint value (93 g CO2). This was represented with a “93 g” on a green carbon footprint and assigned arbitrarily to the well-known brand version of the soup. Then 10 % was subtracted from this value to generate the lowest carbon footprint value. This was represented with “84 g” also on a green background. Finally, 10 % was added to the starting value which generated the highest carbon footprint value (here represented by “205 g” on a black background). This was arbitrarily assigned to the organic/eco brand of the soup. In the case of the other products, the high and low values were assigned arbitrarily to the different versions of the products (luxury, well-known brand, value, and organic/eco) with the only constraint being that each of the ten products had to have an equal number of high and low carbon footprint labels attached (five of each in the final tally). The images of the various products complete with the added carbon footprints and price stickers were then placed on a white background and laminated, creating a series of flash cards (see Figure 6). There were 40 flash cards in total.

An example of the “Heinz Classic Cream of Tomato Soup” with a price sticker at the bottom right corner and a low carbon footprint in the top left corner.
It is important to emphasize that these stimuli were very different to those used by Beattie and McGuire (2015). In this previous study the “products” had only rudimentary information and did not really approximate the richness of real, heavily-branded, and marketed consumer products. Here, we have a very different scenario in that we have used images of real products where the items have much more detailed information to compete with carbon footprint, which is representative of items found in the supermarket. The question is – would carbon footprint information impact significantly on the actual choice of products in competition with these other features like luxury, well-known brand, value, and organic/eco?
The effects of time pressure and no time pressure on product choice was also an important aspect of the design of this experiment. Under no time pressure participants were given as much time as they needed to make the selection of an item and under time pressure they were told to choose an item as quickly as they could. The average time spent choosing a product under time pressure was 2.7 seconds (with a range from 1.2 to 5.5 seconds) as opposed to 7.3 seconds (range from 2.0 to 27.8 seconds) under no time pressure. The time spent choosing under time pressure was significantly shorter (Wilcoxon Matched-Pairs Signed-Ranks Test, T=0, n=49, p < 0.001, two-tailed test).
2.3 Attitude measures
In order to determine participants’ explicit attitudes towards high carbon footprint and low carbon footprint, participants completed a computerized Likert scale (see Figure 7) and a Feeling Thermometer (see Figure 8). In the case of the Feeling Thermometer, participants rated how “warm” or “cold” they felt towards “high carbon” and then how “warm” or “cold” they felt towards “low carbon” where 1=very cold, 3=neutral, and 5=very warm. In order to calculate a Thermometer Difference (TD) score, the high carbon footprint score is subtracted from the low carbon score. Thus, a TD score can range from –4 to +4, with a negative TD score indicating that the participant report a preference for high carbon footprint compared to low carbon footprint and a positive TD score indicating that they report a preference for low carbon footprint compared to high carbon footprint. A more extreme number represents a stronger preference on this measure. For example, “1” would represent a mild preference for low carbon footprint, whereas “4” represents a very strong preference for low carbon footprint.

A computerized version of the Likert scale measuring participants’ attitudes to carbon footprint.

A computerized version of the Feeling Thermometer scale measuring participants’ attitudes towards high and low carbon footprint products.
2.4 Implicit Association Test (IAT)
Participants were also asked to complete a “carbon footprint” Implicit Association Test or IAT (Beattie 2010; Beattie and Sale 2009, Beattie and McGuire 2012, 2015). This particular version of the IAT is designed to test people’s implicit attitudes to the target categories (high/low carbon) by measuring the associative connection between these and the attribute categories (good/bad). Thus, participants who associate low carbon footprint products with “good” and high carbon footprint products with “bad” should respond slower on trials where the pairs are “good”/“high carbon footprint” and “bad”/“low carbon footprint” and faster on trials where the pairs are “good”/“low carbon footprint” and “bad”/“high carbon footprint.” The converse should be true for participants who associate low carbon footprint products with bad and high carbon footprint products with good.
The operation of the test is as follows – exemplars from the high/low carbon footprint or good/bad categories (e. g., images of an energy efficient light bulb, a pizza, local vegetables or words like “happy,” “sad,” “glorious,” “nasty,” etc.) appear in the middle of the screen. Participants have to sort these exemplars into their respective categories as quickly as possible (these categories appear at the top left- and right-hand corners of the computer screen). To sort exemplars into the left-hand category, participants press z (on the left-hand side of the keyboard) and to sort exemplars into the right-hand category participants press m (on the right-hand side of the keyboard). In blocks 1, 2, and 5 participants sort into single categories (e. g., “high carbon” versus “low carbon” for the images of pizza, etc.; “good” versus “bad” for the words like “happy,” “sad,” etc.) to allow them to familiarize themselves with the task. In blocks 3,4,6 and 7 participants have to assign the exemplars into conjoined categories (“high carbon footprint or good” versus “low carbon or bad,” etc.).
The computerized versions of the seven trials are shown in Figures 9–15. This is what the participants actually saw on the computer screen in our IAT.
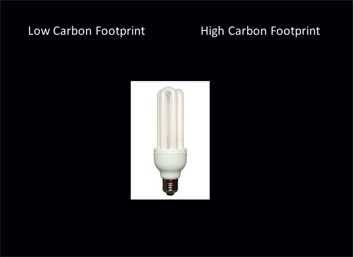
Block 1: low versus high carbon footprint.

Block 2: good versus bad.

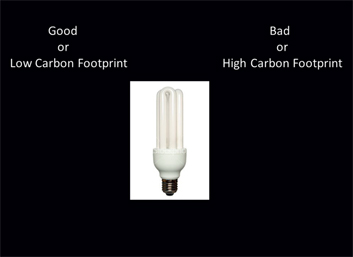
Block 3: good or high carbon footprints versus bad or low carbon footprint.

Block 4: good or high carbon footprint versus bad or low carbon footprint.
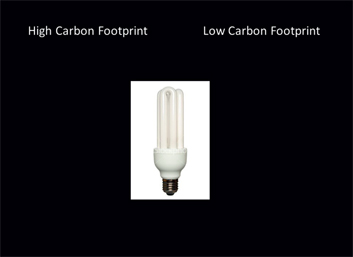
Block 5: high versus low carbon footprint.
Block 6: good or low carbon footprint versus bad or high carbon footprint.

Block 7: good or low carbon footprint versus bad or high carbon footprint.
IAT effect scores (D scores) were computed using the revised scoring algorithm devised by Greenwald et al. (2003). Using this algorithm, researchers:
Exclude trials where latencies are above 10,000 ms.
Exclude trials where over 10 % of trials had latencies lower than 300 ms.
Calculate mean response latencies for Blocks 3 and 4, and Blocks 6 and 7.
Calculate the difference score for Blocks 3 and 4, and Blocks 6 and 7.
Divide the two difference means by their standard deviations.
Average the scores to compute the D score for each participant.
There was no specific time penalty for errors in this version of the IAT. If participants made a mistake then they had to press the correct key before moving on and this additional step represented the time penalty.
The D score reflects the difference in latencies during the critical trials. D score effect sizes are similar to Cohen’s d (Cohen 1988) and usually take the form of small, medium, and large values of greater than 0.2 (slight preference), 0.5 (medium preference), and 0.8 (strong preference), respectively. Positive IAT effect scores reflect a preference for low carbon footprint products, negative effect scores reflect a preference for high carbon footprint products. D scores between –0.2 and + 0.2 are considered neutral.
2.5 Shopping task
A total of 40 flash cards were laid out on a table. There were 10 different products (bran flakes, bread, cheese, coffee, fabric conditioner, ice cream, orange juice, soup, toilet roll, and washing up liquid) with four different brand variations of each (luxury brand, well-known brand, value brand, and organic/eco brand). The four different brands for each product were laid out in a row. The particular order within the row was changed for each new participant. Each participant was asked to select a choice of items under a number of shopping conditions that included shopping alone under time pressure (“Imagine yourself shopping alone in a supermarket – you are in a real hurry”) and shopping alone but with no time pressure (“Imagine yourself shopping alone in a supermarket-you are shopping with plenty of time on your hands”). Each condition was randomized between participants to control for possible order effects. Participants had to select 10 products in total. Once they had chosen their first product, they were then asked to select the next and so on. All choices were timed on a stop-watch. The order in which they had to choose the products was randomized across both conditions. Each participant was asked to complete the shopping task for all products under one condition before moving on to the next condition.
3 Results
3.1 Consumer choice and brand with no time pressure: Descriptive statistics
The first analysis focused on the relationship between brand and consumer choice under no time pressure. It was immediately apparent that the brand chosen most frequently under no time pressure was the well-known brand (38.0 % of all selections) followed by the value brand (32.4 %), followed by the organic/eco brand with 17.0 % and lastly the luxury brand at 12.6 %.
There was, however, considerable variation from product to product (see Table 1). So for example, when it came to products like soup (Heinz), toilet roll (Andrex), and fabric conditioner (Lenor) the well-known brands were chosen in over 50 % of all occasions, and these well-known brands dominated consumer choice. However, in other cases the well-known brands were not chosen so frequently. So, for example, in the case of coffee, the well-known brand (Lavazza) was chosen only in 18 % of cases; in the case or orange juice the well-known brand (Princes) was chosen in only 24 % of cases. Value brands seemed to be selected more frequently when it came to washing-up liquid (62 %) and bran flakes (52 %). Organic/eco brands were selected most frequently when it came to coffee (32 %) and ice cream (24 %), but note that the well-known (in the case of the ice cream) and value brands (in the case of the coffee) are still selected more frequently when it came to these products. Luxury brands were selected most frequently when it came to orange juice (32 %) and ice cream (28 %). In both these cases these were the top selection (see Table 1).
Brand choice across all products under no time pressure (percentage choice).
| Luxury (%) | Well-known brand (%) | Value (%) | Organic/eco (%) | |
|---|---|---|---|---|
| Bran Flakes | 0 | 26 | 52 | 22 |
| Bread | 10 | 44 | 28 | 18 |
| Cheese | 2 | 44 | 36 | 18 |
| Coffee | 14 | 18 | 36 | 32 |
| Fabric Conditioner | 20 | 56 | 12 | 12 |
| Ice cream | 28 | 26 | 22 | 24 |
| Orange Juice | 32 | 24 | 30 | 14 |
| Soup | 16 | 58 | 14 | 12 |
| Toilet roll | 4 | 58 | 32 | 6 |
| Washing up liquid | 0 | 26 | 62 | 12 |
| Mean | 12.6 | 38.0 | 32.4 | 17.0 |
3.2 Consumer choice under time pressure: Descriptive statistics
Interestingly, under time pressure, the well-known brands became even more popular. Well-known brands were now selected in 42.8 % of all cases compared to 38.0 % under no time pressure. Value brands were selected 31.4 % of the time, followed by luxury brands with 15.4 % and lastly organic/eco with 10.4 %.
These findings reveal a number of things. Firstly, it hints at the power of advertising for those brands that have become well-known (Hovis, Kellogg’s, Heinz etc.), in that these brands are immediately recognizable and accessible under time pressure and when consumers are under time pressure, then the more likely they are to choose something they instantly recognize (Jenson and Drozdenko 2008). The well-known brand of soup was selected most frequently of all products (74 %) and the same for toilet roll (58 %). See Table 2. Secondly, it demonstrates that the organic/eco brand drops to fourth place under time pressure (10.4 %), which is lower than the luxury brand (15.4 %). However, without time pressure, the organic/eco brand is selected more frequently (17.0 %) than the luxury brand (12.6 %). This would seem to suggest that when we change the temporal context of consumer choice, it does influence consumer behavior and that the organic/eco brand becomes more popular when there is more time for consideration (see Table 2).
Brand choice across all products under time pressure (percentage choice).
| Luxury (%) | Well-known brand (%) | Value (%) | Organic/eco (%) | |
|---|---|---|---|---|
| Bran Flakes | 0 | 48 | 42 | 10 |
| Bread | 8 | 44 | 34 | 14 |
| Cheese | 2 | 56 | 30 | 12 |
| Coffee | 24 | 20 | 40 | 16 |
| Fabric Conditioner | 26 | 42 | 18 | 14 |
| Ice cream | 44 | 16 | 20 | 20 |
| Orange Juice | 34 | 38 | 24 | 4 |
| Soup | 12 | 74 | 14 | 0 |
| Toilet roll | 2 | 58 | 38 | 2 |
| Washing up liquid | 2 | 32 | 54 | 12 |
| Mean | 15.4 | 42.8 | 31.4 | 10.4 |
3.3 Consumer choice: Inferential statistics
Statistical analyses focused on the relationship between time pressure and brand choice (see Table 3). The first analysis considered the relationship between choice of organic/eco brand versus the well-known brand under both time pressure and no time pressure following our observations above. Under time pressure, the well-known brands were chosen more frequently, whereas the organic/eco brands were chosen less frequently under time pressure and this difference in distribution was significant, χ2(1, N=50)=9.25, p < 0.01, two-tailed test.
Brand choice under no time pressure (No TP) and time pressure (TP).
| No TP | TP | |
|---|---|---|
| Organic/eco | 85 | 52 |
| Well-known brand | 190 | 214 |
| Luxury | 63 | 77 |
| Value | 162 | 157 |
The next comparison considered choice of organic/eco brands versus luxury brands under time pressure and no time pressure, as shown in Table 3. The analysis suggests that the organic/eco brands were less likely to be chosen under time pressure compared to the luxury brands, which were more likely to be chosen under time pressure, χ2(1, N=50)=8.03, p < 0.01, two tailed test. In other words, under time pressure, consumers are significantly more likely to choose luxury brands and significantly less likely to choose organic/eco brands.
A number of the statistical comparisons, however, revealed no significant differences in terms of the comparisons made. So, for example, both organic/eco brands and value brands are less likely to be chosen under time pressure in a similar pattern to each other, with no significant difference in underlying distribution, χ2(1, N=50)=4.89, n.s. See Table 3.
Similarly, when well-known brands and luxury brands were compared, under time pressure and no time pressure, the participants were more likely to choose both the well-known brands and the luxury brands under time pressure in a very similar pattern and again there was no significant difference, χ2(1, N=50)=0.17, n.s. See Table 3.
Next, we compared value brands and well-known brands under time pressure and no time pressure. Although the value brands were more likely to be chosen under no time pressure, the well-known brands were more likely to be chosen under time pressure. The differences in terms of absolute numbers under the two conditions were not that large and the difference failed to reach significance, χ2(1, N=50)=1.01, n.s. See Table 3.
Similarly, when the choice of value brands and luxury brands were compared under time pressure and no time pressure, it was found that the luxury brands were more likely to be chosen under time pressure, but again, the differences in quantitative terms were not that great and the overall difference failed to reach significance, χ2(1, N=50)=1.34, n.s. See Table 3.
3.4 Does carbon footprint influence consumer choice?
The mean carbon footprint of each consumer choice is laid out in Table 4. “HH” represents the product with the highest carbon footprint assigned (starting value plus 10 %), “H” represents the product with a high carbon footprint (the starting value), “L” represents the low carbon footprint product (half the starting value), and “LL” represents the lowest carbon footprint (0.5 of the starting value minus 10 %).
Mean number of high and low carbon items chosen by each of the 50 participants under no time pressure/ time pressure.
| No time pressure | Time pressure | |||||||
|---|---|---|---|---|---|---|---|---|
| HH | H | L | LL | HH | H | L | LL | |
| Mean | 1.98 | 2.20 | 3.10 | 2.72 | 2.16 | 2.28 | 2.98 | 2.58 |
From Table 4 it should be clear that the carbon footprint of the products did influence consumer choice. Table 4 shows that when there is no time pressure, our experimental participants chose low carbon items a mean of 3.10 times, very low carbon items a mean of 2.72 times, high carbon items a mean of 2.20 times and very high carbon items a mean of 1.98 times. In other words, they seem to prefer low as opposed to high carbon items (of course, signalled by the green footprint superimposed on the product).
Nonparametric analyses revealed that the preference for low carbon items over high carbon items was significant – with either the full set (“HH+H” versus “LL+L”) compared (Wilcoxon Matched-Pairs Signed-Ranks Test, z=–3.322, n=39, p < 0.001, two-tailed), or focusing just on the less extreme categories items (“H” versus “L”), z=–2.833, n=44, p < 0.004, two-tailed. It was also significant focusing just on the more extreme category items (“HH” versus “LL”), z=–2.422, n=42, p < 0.05, two-tailed. However, the differences within the category for the low carbon items (“L”) versus the very low carbon items (“LL”) were not significant (z=–1.212, n=44, n.s.), neither was the choice of high carbon items (“H”) versus the very high carbon items (‘HH’), z=–0.812, n=43, n.s.
When the participants were under time pressure, they chose low carbon items a mean of 2.98 times and very low carbon items a mean of 2.58 times, high carbon items a mean of 2.28 times and very high carbon items a mean of 2.16 times. Again, nonparametric analyses revealed that the preference for low carbon items over high carbon items was significant – comparing the full set (“HH+H” versus “LL+L”), z=–2.630, n=38, p < 0.05, two-tailed). The difference was also significant focusing on the less extreme categories items (“H” versus “L”), z=–2.362, n=40, p < 0.05, two-tailed. However, when it came to the more extreme category items (“HH” versus “LL”) the preference for low carbon was not significant, z=–1.317, n=52, n.s. When comparing the preference for the low carbon items (“L”) versus the very low carbon items (“LL”) this was not significant, z=–1.563, n=40, n.s., neither was the choice of high carbon items (“H”) versus the very high carbon items (“HH”), z=–0.657, n=49, n.s.
3.5 Do measures of explicit and implicit attitudes to carbon footprint relate to one another?
Next we discuss the mean Likert scores, Thermometer Difference (TD) scores, and D scores for the sample. The mean Likert score was 3.6, which is approximately midway between neutral and a moderate preference for low carbon, translating to a slight preference for low carbon. The mean TD score was 1.2, which also represents a slight preference for low carbon. The D score was 0.99, which represents a strong pro-low carbon preference for this particular set of high and low carbon items and for this particular sample. It is immediately apparent that on both explicit and implicit measures our participants emerge as pro-low carbon.
However, a Pearson product-moment correlation revealed that there was no significant correlation between the explicit and implicit measures – Likert and D scores, r(50)=0.016, n.s., or the TD and D scores, r(50)=0.198, n.s. This again suggests that explicit and implicit measures are “dissociated” in this domain. Interestingly, the Likert and TD scores also did not correlate, r(50)=0.056, n.s., which suggests that self-reported attitudes (“I strongly prefer products with a low carbon footprint to a high carbon footprint,” etc.), do not necessarily correlate with participants’ reports of how “warm” or “cold” they felt towards low/high carbon products.
3.6 Does carbon footprint influence consumer choice?
The next question is whether these various measures of explicit and implicit attitudes predict choice of low or high carbon products when information about carbon label is included but with all of the competing marketing information also included. The statistical comparisons here consider the number of choices of low carbon products (either “L” or “LL”) of that set of participants who score strongly pro-low carbon footprint on the various measures. In the case of the Likert scale, this set consists of those scoring “5” (“I strongly prefer products with a low carbon footprint to a high carbon footprint”). Using this criterion, 20 % of the sample is identified as having a strong explicit attitude to low carbon. In the case of the Thermometer Difference measure, we employed a criterion of +4. This criterion identifies 26 % of the sample and represents the maximum difference between feeling warm about low carbon and feeling cold about high carbon. In the case of the IAT, the criterion we use is what has become the norm in the literature for identifying a strong implicit bias and that is “greater than or equal to 0.8.” It should be stressed that this is an arbitrary criterion (Blanton and Jaccard 2008; Blanton et al. 2007, 2015) and here identifies 52 % of the sample, in other words, a much higher proportion than either of the other two criteria used for the explicit measures. The logic of our next analysis is as follows: the focus will be on a possible trend in selecting low carbon items for those who fall within the set of a strong pro-low carbon attitude. We compare this with any trend in the residual sample that does not have a strong pro-low carbon attitude. If both groups come out with a significant trend towards low carbon this would simply reflect that this was a general bias towards selecting low carbon items by the overall sample. However, if those with a strong positive attitude to low carbon had a significant bias towards selecting low carbon items and this trend was not significant for those with a less strong attitude, then we would suggest that this reflects some meaningful properties of that attitudinal measure for predicting behavior. We carried out separate analyses when the choice was made not under time pressure and under time pressure.
Table 5 shows the behavioral choices of those with a strong pro-low carbon attitude (measured by the Likert scale) under no time pressure. Table 6 shows the behavioral choices of those with weaker pro-low carbon attitudes (again measured by the Likert scale). In both cases, the results are significant and represent a trend in both groups towards low carbon choices. Therefore, this particular attitudinal measure (the Likert scale) does not discriminate in terms of actual behavior those with a strong pro-low carbon attitude and those with a weaker attitude.
The relationship between strong pro-low carbon explicit attitude (Likert scale) and behavioural choice under no time pressure.
| No time pressure | Number of low carbon choices (L or LL) | Number of high carbon choices (H or HH) | Outcome of statistical test |
|---|---|---|---|
| Observed frequency | 67 | 33 | χ2 (1)=11.56, p < 0.01, two-tailed. |
| Expected frequency (under the null hypothesis that choice is not affected by carbon footprint information) | 50 | 50 |
The relationship between weaker pro-low carbon explicit attitude (Likert scale) and behavioural choice under no time pressure.
| No time pressure | Number of low carbon choices (L or LL) | Number of high carbon choices (H or HH) | Outcome of statistical test |
|---|---|---|---|
| Observed frequency | 224 | 176 | χ2 (1)=5.76, p < 0.02, two-tailed. |
| Expected frequency (under the null hypothesis) | 200 | 200 |
In Tables 7 and 8, the same comparisons are made when the participants are under time pressure. What is striking from Table 7 is that those with a strong pro-low carbon attitude, as identified by the Likert scale, do not display a significant trend towards selecting low carbon items, but those with a weaker attitude (according to this scale) do. In other words, both under no time pressure and under time pressure, this attitudinal measure would seem to have little discriminatory power for predicting actual behavior.
The relationship between strong pro-low carbon explicit attitude (Likert scale) and behavioural choice under time pressure.
| Time pressure | Number of low carbon choices (L or LL) | Number of high carbon choices (H or HH) | Outcome of statistical test |
|---|---|---|---|
| Observed frequency | 51 | 49 | χ2 (1)=0.04, n.s. |
| Expected frequency (under the null hypothesis) | 50 | 50 |
The relationship between weaker pro-low carbon explicit attitude (Likert scale) and behavioural choice under time pressure.
| Time pressure | Number of low carbon choices (L or LL) | Number of high carbon choices (H or HH) | Outcome of statistical test |
|---|---|---|---|
| Observed frequency | 227 | 173 | χ2 (1)=7.29, p < 0.01, two-tailed. |
| Expected frequency (under the null hypothesis) | 200 | 200 |
In the case of the Thermometer Difference, we see a very similar pattern. With no time pressure comparisons, there is an inherent trend towards choosing low carbon items and this is true for those with a strong pro-low carbon attitude as measured by the TD and those with a weaker pro-low carbon attitude. Hence, the TD does not discriminate the behavioral choice of the two groups.
In the case of the time pressure, the results were significant, but in the opposite direction to that predicted – only those with the weaker pro-low carbon attitudes were significantly more likely to choose low carbon products. See Tables 9–12.
The relationship between strong pro-low carbon explicit attitude (TD) and behavioural choice under no time pressure.
| No time pressure | Number of low carbon choices (L or LL) | Number of high carbon choices (H or HH) | Outcome of statistical test |
|---|---|---|---|
| Observed frequency | 79 | 51 | χ2 (1)=6.02, p < 0.02, two-tailed. |
| Expected frequency (under the null hypothesis) | 65 | 65 |
The relationship between weaker pro-low carbon explicit attitude (TD) and behavioural choice under no time pressure.
| No time pressure | Number of low carbon choices (L or LL) | Number of high carbon choices (H or HH) | Outcome of statistical test |
|---|---|---|---|
| Observed frequency | 291 | 79 | χ2 (1)=121.5, p < 0.001, two-tailed. |
| Expected frequency (under the null hypothesis) | 185 | 185 |
The relationship between strong pro-low carbon explicit attitude and behavioural choice (TD) under time pressure.
| Time pressure | Number of low carbon choices (L or LL) | Number of high carbon choices (H or HH) | Outcome of statistical test |
|---|---|---|---|
| Observed frequency | 74 | 56 | χ2 (1)=2.49, n.s. |
| Expected frequency (under the null hypothesis) | 65 | 65 |
The relationship between non strong pro-low carbon explicit attitude and behavioural choice (TD) under time pressure.
| Time pressure | Number of low carbon choices (L or LL) | Number of high carbon choices (H or HH) | Outcome of statistical test |
|---|---|---|---|
| Observed frequency | 207 | 163 | χ2 (1)=5.23, p < 0.05, two-tailed. |
| Expected frequency (under the null hypothesis) | 185 | 185 |
In the case of the analyses using the IAT, an important difference does emerge. Under no time pressure, both groups (strong and weaker pro-low carbon implicit attitude) show a significant trend towards choosing low carbon items. However, under time pressure the strong pro-low carbon group does show a significant tendency to selecting low carbon items; the weaker pro-low carbon group does not show a significant tendency in this regard. In other words, when participants/consumers are under time pressure (as they are in many everyday consumer situation) those with a strong implicit attitude to low carbon are more likely to shop in a sustainable way. From a statistical point of view this is interesting because the group identified on the basis of the normative measure of strong implicit attitude (0.8 and above) was larger and therefore less selective, and less extreme, than the strong group identified by either of the other two measures. This makes the present result potentially more interesting (Tables 13–16).
The relationship between strong pro-low carbon implicit attitude (IAT) and behavioural choice under no time pressure.
| No time pressure | Number of low carbon choices (L or LL) | Number of high carbon choices (H or HH) | Outcome of statistical test |
|---|---|---|---|
| Observed frequency | 154 | 106 | χ2 (1)=8.86, p < 0.01, two-tailed. |
| Expected frequency (under the null hypothesis) | 130 | 130 |
The relationship between weaker pro-low carbon implicit attitude (IAT) and behavioural choice under no time pressure.
| No time pressure | Number of low carbon choices (L or LL) | Number of high carbon choices (H or HH) | Outcome of statistical test |
|---|---|---|---|
| Observed frequency | 137 | 103 | χ2 (1)=4.82, p < 0.05, two-tailed. |
| Expected frequency (under the null hypothesis) | 120 | 120 |
The relationship between strong pro-low carbon implicit attitude (IAT) and behavioural choice under time pressure.
| Time pressure | Number of low carbon choices (L or LL) | Number of high carbon choices (H or HH) | Outcome of statistical test |
|---|---|---|---|
| Observed frequency | 150 | 110 | χ2 (1)=6.16, p < 0.02, two-tailed. |
| Expected frequency (under the null hypothesis) | 130 | 130 |
The relationship between weaker pro-low carbon implicit attitude (IAT) and behavioural choice under time pressure.
| Time pressure | Number of low carbon choices (L or LL) | Number of high carbon choices(H or HH) | Outcome of statistical test |
|---|---|---|---|
| Observed frequency | 128 | 112 | χ2 (1)=1.06, n.s. |
| Expected frequency (under the null hypothesis) | 120 | 120 |
3.7 Do either explicit or implicit attitudes to low carbon products predict the choice of organic or eco brands?
In the last section, we could see that carbon footprint not only influenced consumer choice, but also that attitude to low carbon (either self-reported or implicit) seemed to impact on that choice. One important theoretical question is how general the behavioral impact of such underlying attitudes might be. We only measured attitude to low and high carbon products but would this measure also predict the choice of organic or eco products? It is important to remember that we randomly assigned carbon footprint to our range of products. Although there may be a relationship between carbon footprint and organic/eco products in the world beyond the laboratory, this would not have been the case in this particular experimental context, where these two variables were randomly manipulated by the experimenters.
Tables 17–20 show how both implicit and explicit attitudes relate to the choice of organic/eco products under conditions of no time pressure or time pressure. These results are interesting. The first analysis (Table 17) shows that of the 26 participants with a strong pro-low carbon implicit attitude, 22 of them chose one or more organic/eco products, only four of these participants did not choose organic/eco products, when there was no time pressure. This contrasts with a much more even split (13/11) for those with a weaker pro-low carbon implicit attitude. In other words, when our participants as “consumers” had time to make their selection, this act of choice of organic/eco products was significantly affected by their underlying implicit attitude. This did not occur when our participants were under time pressure (see Table 18).
The relationship between implicit attitude to low carbon and choice of organic/eco products under no time pressure.
| No. of participants with strong pro-low carbon implicit attitude | No. of participants with weaker pro-low carbon implicit attitude | Outcome of statistical test | |
|---|---|---|---|
| One or more organic/eco choices | 22 | 13 | χ 2 (1)=5.51, p < 0.02, two-tailed. |
| No organic/eco choices | 4 | 11 |
The relationship between implicit attitude to low carbon and choice of organic/eco products under time pressure.
| No. of participants with strong pro-low carbon implicit attitude | No. of participants with weaker pro-low carbon implicit attitude | Outcome of statistical test | |
|---|---|---|---|
| One or more organic/eco choices | 12 | 9 | χ 2 (1)=0.40, n.s. |
| No organic/eco choices | 14 | 15 |
Our measure of explicit attitude to low carbon also significantly predicted the choice of organic/eco products, but again only when the choice was not made under time pressure. It must be remembered that our operational definition of a strong pro-low carbon explicit attitude was more extreme in terms of where it lands on the underlying distribution of scores than the implicit criterion, and uniquely identifies just 10 individuals but every single one of them chose an organic/eco product when not under time pressure. This was not the case for those with a weaker pro-low carbon explicit attitude (see Table 19). However, when the choices were made under time pressure those with a strong pro-low carbon explicit attitude still preferred organic/eco products, whereas the majority of those with a weaker attitude here chose no organic/eco products. However, this difference failed to reach significance (see Table 20). In other words, those who hold the strongest attitude to low carbon products (either implicit or explicit) have a significant tendency to choose organic/eco products, but only when they are not under time pressure, suggesting that they may need more time to process the label and/or reflect on the nature of their choice.
The relationship between explicit attitude to low carbon and choice of organic/eco products under no time pressure.
| No. of participants with strong pro-low carbon explicit attitude (5 on Likert scale) | No. of participants with weaker pro-low carbon explicit attitude (4 or less, Likert) | Outcome of statistical test | |
|---|---|---|---|
| One or more organic/eco choices | 10 | 25 | Fisher’s Exact Probability Test, p < 0.05, two-tailed test. |
| No organic/eco choices | 0 | 15 |
The relationship between explicit attitude to low carbon and choice of organic/eco products under time pressure.
| No. of participants with strong pro-low carbon explicit attitude (5 on Likert scale) | No. of participants with weaker pro-low carbon explicit attitude (4 or less, Likert) | Outcome of statistical test | |
|---|---|---|---|
| One or more organic/eco choices | 7 | 14 | Fisher’s Exact Probability Test, n.s. |
| No organic/eco choices | 3 | 26 |
4 Discussion
This study attempted to uncover some of the core psychological factors underpinning consumer choice on the assumption that the behavior of consumers is particularly relevant to issues to do with climate change and the reduction of greenhouse gas emissions. Indeed, consumer behavior would appear to be one of the major obstacles on the road to reducing greenhouse gas emissions. The multinational Unilever, for example, has introduced a number of (very expensive) major initiatives in the last few years to reduce the environmental impact of their goods, but found (rather vexingly) that their greenhouse gas footprint impact per consumer had “... increased by around 5 % since 2010” (Unilever Sustainable Living Plan 2013: 16). Consumer behavior seems to have been responsible for this unanticipated increase, rather than decrease, in carbon footprint associated with Unilever products.
The experimental study reported here attempted to answer a number of basic psychological questions. Firstly, what brand aspects of products (well-known brand, value brand, luxury brand, organic/eco brand, etc.) predict consumer choice? In addition, what are the implications of time pressure on such choices, given that under increasing time pressure there is less opportunity for deliberation and reflection? Secondly, do measures of explicit or implicit attitude towards carbon footprint impact on patterns of choice when environmental information is available? What, for example, happens if carbon footprint is added to products? Will this influence consumer choice when this particular type of environmental information has to compete with all of the other information that is available on products and how does time pressure impact on any of these relationships?
In this behavioral choice study, it was immediately apparent that we, as consumers, are very sensitive to both brand information and value in our selection of products. The brands chosen most frequently under no time pressure were the well-known brands – Heinz, Kellogg’s, Hovis, etc. (chosen in 38.0 % of all selections, with four alternatives to choose from) followed by the value brand (32.4 %). Significantly, further down the list were the organic/eco brands with 17.0 % and lastly the luxury brands at 12.6 %. However, when behavioral choice is made under time pressure, this trend became even more pronounced and the well-known brands were selected even more frequently (pointing to the power of advertising for promoting brand recognition). Well-known brands were now chosen in 42.8 % of all cases and value brands 31.4 % of the time (down slightly). Organic/eco brands were now in fourth and last place with only 10.4 % of selections.
This time dimension (so characteristic of much supermarket shopping) had a statistically significant effect on consumer choice in terms of the selection of well-known brands compared to organic/eco brands. Under time pressure, consumers were also significantly more likely to choose luxury brands and significantly less likely to choose organic/eco brands. Given the social and temporal aspects of much supermarket shopping, often characterized by significant time pressure, this is not an optimistic conclusion regarding environmentally sensitive choices.
It must be remembered that carbon footprint information was represented in a very obvious visual way on our products with color-coded footprints (green for below average, black for above average) and they were represented on the front of products rather than on the backs (see Beattie et al. 2010). This study found that when carbon footprint is represented in this way it can influence consumer choice. Our participants were guided by these color-coded carbon footprints but not by the numerical values of carbon footprint, representing the gradations of high and low carbon, within the color-coded footprint. There was no statistical difference between the two levels of high carbon footprint that were added to our products, or the two levels of low carbon footprint that were added. Given that most countries have not introduced color-coded carbon footprint but have instead opted for numerical values on a plain background, this might well explain why these campaigns have so far been relatively unsuccessful in promoting behavioral change and the selection of the low carbon alternatives (see Beattie 2010, 2012).
The next question was whether these various measures of explicit and implicit attitudes predicted choices of low or high carbon products when information about carbon footprint is included on real products, with all of the competing marketing information included. In the case of the explicit measure (the Likert scale), both under no time pressure and under time pressure, this attitudinal measure had little discriminatory power for predicting actual behavior. When not under time pressure, both groups (strong and weak pro-low carbon attitude) showed a low carbon bias in terms of behavioral choice. When under time pressure, the weak explicit attitude group did display a low carbon preference; the strong group did not, which, of course, was exactly the opposite of what was predicted. In the case of the implicit measure, however, the results were different in one very important regard. Under no time pressure, both groups (strong and weak pro-low carbon implicit attitude) displayed a significant bias towards choosing low carbon items (as was the case with the explicit group). However, under time pressure, the strong pro-low carbon implicit group did show a significant tendency to select low carbon items; the weak pro-low carbon implicit group did not show a significant tendency here. In other words, when participants/consumers are under time pressure those with a strong implicit attitude to low carbon are more likely to shop in a sustainable way. Both measures of attitude to low carbon (explicit and implicit) also significantly predicted the choice of organic/eco products, but only when the choice was not made under time pressure, suggesting that consumers may need more time to process the label and/or reflect on the nature of their choice in order to have an effect.
In conclusion, these results hint at some of the most basic variables that affect consumer choice and, in addition, point towards the attitudinal measures that may help us predict consumer behavior that is more sustainable. Organic/eco brands are clearly not the first choice option for consumers, particularly under time pressure. Some individuals, however, with a strong positive attitude towards low carbon are more sensitive to these brands and to carbon footprint information. In the case of implicit attitudes, measured using the IAT, one might say that it is extraordinary that a simple reaction time measure, which simply computes the response time in a categorization task, can predict anything at all in a separate domain. However, the simple measure predicts the choice of low carbon items under time pressure, and even predicts the choice of organic/eco products (at least when there is more time for the consumer to reflect). The advantage of this simple measure is that participants do not seem quite so able to distort it for reasons of social desirability, in order to appear greener than they really are, (see Steffens 2004). Therefore, it may provide us with a simple diagnostic tool to test the public’s actual readiness to go green, in the fight against climate change, and this could turn out to be very important indeed. One could imagine redoing the segmentation analyses of DEFRA and other leading organizations where one attempted to profile the population in terms of both explicit and implicit attitudes rather than relying merely on what people say. This would be quite radical.
Of course, the research also raises some very general issues about whether or not consumers are dissociated in a number of respects, and whether two separate systems of unconscious/implicit and conscious/explicit attitudes really do exist (see Gawronski et al. 2006; Rydell et al. 2006). This is by no means universally accepted in the psychological literature; indeed it is currently the subject of much quite heated debate (see Blanton and Jaccard 2006; Blanton et al. 2007, 2009 for a critique of this position and Greenwald et al. 2006; McConnell and Leibold 2009; and Ziegert and Hanges 2009 for some rebuttals). However, it would seem that in some domains, this notion of implicit attitudes, deriving from various associative connections and operating unconsciously alongside our more reflective attitudes (and indeed conflicting with them on occasion), might have some credibility (Beattie 2013; Kahneman 2011). Such a view, after all, might not surprise those psychologists who worked in the 1930’s alongside some of the major tobacco companies to promote smoking (subliminally) through the association of smoking with societal success, social acceptance, and confidence. It might not even have surprised Gordon Allport in his early work on racism and “the inner conflict” (Allport 1954/1979). It is certainly an idea worth exploring further in the domain of consumption and climate change. If we really do have a “divided self,” when it comes to our underlying attitudes towards the environment, then this could be critical in the battle against climate change. After all, most of us say that we know that we need to adapt our behavior as consumers in the light of climate change, but then actually do nothing. Until we start to promote low carbon products and low carbon lifestyles in a way that impinges on our automatic, unconscious system, little may indeed change in this regard. We cannot leave choice of low carbon products solely to reason and reflection, it could be far too late. As Kahneman (2011) himself has noted, System 2 (the system of reason and reflection) can be very lazy indeed; it leaves a great deal to System 1, and System 1 is currently prioritizing well-known brands and value brands over those with the right environmental properties. System 1, in the domain of consumption, is directing us to choose those things that we have been taught to value – big brands (and status) and economical brands (and money) rather than environmental brands. This needs to change. Let us continue to write (and read) the editorials in the quality newspapers about climate change and what we must all do. But at the same time let us think about how to promote low carbon lifestyles as something to do with a new sort of societal status, fun, sexy, necessary, caring, cooperative, clever, perceptive, confident, a must have, the next big thing, a new revolution, in a way that System 1 might notice. Moreover, if we have to borrow from the years of (chilling) success of the tobacco industry in promoting smoking, and learn from the way they used associative networks, to promote products, then so be it. At least, we will then know that it was good for something.
References
Aaker, David A., & Alexander L. Biel. 2013. Brand equity & advertising: Advertising’s role in building strong brands. London: Psychology Press.10.4324/9781315799537Search in Google Scholar
Aertsens, Joris, Wim Verbeke, Koen Mondelaers & Guido Van Huylenbroeck. 2009. Personal determinants of organic food consumption: A review. British Food Journal 111. 1140–1167.10.1108/00070700910992961Search in Google Scholar
Ajzen, Icek. 1985. From intentions to actions: A theory of planned behavior. In J. Kuhl & J. Beckman (eds.), Action-control: From cognition to behavior, 11–39. Berlin: Springer.10.1007/978-3-642-69746-3_2Search in Google Scholar
Ajzen, Icek. 1991. The theory of planned behavior. Organizational Behavior and Human Decision Processes 50. 179–211.10.1016/0749-5978(91)90020-TSearch in Google Scholar
Ajzen, Icek. 2001. Nature and operation of attitudes. Annual Review of Psychology 52. 27–58.10.1146/annurev.psych.52.1.27Search in Google Scholar
Ajzen, Icek. & Martin Fishbein. 1980. Understanding attitudes and predicting social behavior. London: Prentice Hall.Search in Google Scholar
Allport, Gordon W. 1935. Attitudes. In C. Murchison (ed.), Handbook of social psychology, 798–844. Worcester, MA: Clark University Press.Search in Google Scholar
Allport, Gordon W. 1954 [1979]. The Nature of Prejudice. Cambridge, MA: Addison Wesley.Search in Google Scholar
Beattie, Geoffrey. 2010. Why aren’t we saving the planet? A psychologist’s perspective. London: Routledge.10.4324/9780203840078Search in Google Scholar
Beattie, Geoffrey. 2012. Psychological effectiveness of carbon labelling. Nature Climate Change 2. 214–217.10.1038/nclimate1468Search in Google Scholar
Beattie, Geoffrey. 2013a. Making an action film: Do films such as Al Gore’s An Inconvenient Truth really make any difference to how we think and feel about climate change? Nature Climate Change 1. 372–374.10.1038/nclimate1257Search in Google Scholar
Beattie, Geoffrey. 2013b. Our racist heart? An exploration of unconscious prejudice in everyday life. London: Routledge10.4324/9780203100912Search in Google Scholar
Beattie, Geoffrey, Doron Cohen & Laura McGuire. 2013. An exploration of possible unconscious ethnic biases in higher education: The role of implicit attitudes on selection for university posts. Semiotica 197(1/4). 171–201.10.1515/sem-2013-0087Search in Google Scholar
Beattie, Geoffrey & Patrick Johnson. 2012. Possible unconscious bias in recruitment and promotion and the need to promote equality. Perspectives: Policy and Practice in Higher Education 16. 7–13.10.1080/13603108.2011.611833Search in Google Scholar
Beattie, Geoffrey, Laura McGuire & Laura Sale. 2010. Do we actually look at the carbon footprint of a product in the initial few seconds? An experimental analysis of unconscious eye movements. International Journal of Environmental, Cultural, Economic & Social Sustainability 6. 47–65.10.18848/1832-2077/CGP/v06i01/54719Search in Google Scholar
Beattie, Geoffrey & Laura McGuire. 2012. See no evil? Only implicit attitudes predict unconscious eye movements towards images of climate change. International Journal of Environmental, Cultural, Economic and Social Sustainability 6. 47–65.10.1515/sem-2012-0066Search in Google Scholar
Beattie, Geoffrey & Laura McGuire. 2015. Harnessing the unconscious mind of the consumer: How implicit attitudes predict pre-conscious visual attention to carbon footprint information on products. Semiotica 204(1/4). 253–290.10.1515/sem-2014-0079Search in Google Scholar
Beattie, Geoffrey & Laura Sale. 2009. Explicit and implicit attitudes to low and high carbon footprint products. International Journal of Environmental, Cultural, Economic and Social Sustainability 5. 191–206.10.18848/1832-2077/CGP/v05i04/54652Search in Google Scholar
Beattie, Geoffrey & Laura Sale. 2011. Shopping to save the planet? Implicit rather than explicit attitudes predict low carbon footprint consumer choice. International Journal of Environmental, Cultural, Economic and Social Sustainability 7. 211–232.10.18848/1832-2077/CGP/v07i04/54948Search in Google Scholar
Beattie, Geoffrey, Laura Sale & Laura McGuire. 2011. An inconvenient truth? Can a film really affect psychological mood and our explicit attitudes towards climate change? Semiotica 187. 105–125.10.1515/semi.2011.066Search in Google Scholar
Blanton, Hart & James Jaccard. 2006. Arbitrary metrics in psychology. American Psychologist 61. 27–41.10.1037/0003-066X.61.1.27Search in Google Scholar
Blanton, Hart, James Jaccard & Christopher Burrows. 2015. Implications of the implicit association test D-transformation for psychological assessment. Assessment 22. 429–440.10.1177/1073191114551382Search in Google Scholar
Blanton, Hart, James Jaccard, Charlene Christie & Patricia M. Gonzales. 2007. Plausible assumptions, questionable assumptions and post hoc rationalizations: Will the real IAT, please stand up? Journal of Experimental Social Psychology 43. 399–409.10.1016/j.jesp.2006.10.019Search in Google Scholar
Blanton, Hart & James Jaccard. 2008. Unconscious racism: A concept in pursuit of a measure. Annual Review of Sociology 34. 277–297.10.1146/annurev.soc.33.040406.131632Search in Google Scholar
Blanton, Hart, James Jaccard, Jonathon Klick, Barbara Mellers, Gregory Mitchell & Philip Tetlock. 2009. Strong claims and weak evidence: Reassessing the predictive validity of the IAT. Journal of Applied Psychology 94. 567–582.10.1037/a0014665Search in Google Scholar
British Social Attitudes Survey. 2012. British Social Attitudes survey 2012: Public satisfaction with the NHS and its services. http://www.kingsfund.org.uk/projects/bsa-survey-2012 (accessed 1 July 2015).Search in Google Scholar
Cohen, Jacob. 1988. Statistical power analysis for the behavioral sciences. Hillside, NJ: Erlbaum.Search in Google Scholar
Corner, Adam & Alex Randall. 2011. Selling climate change? The limitations of social marketing as a strategy for climate change public engagement. Global Environmental Change 21. 1005–1014.10.1016/j.gloenvcha.2011.05.002Search in Google Scholar
Commission of the European Communities. 2008. EU Sustainable Consumption and Production Action Plan. http://eur-lex.europa.eu/LexUriServ/LexUriServ.do?uri=COM:2008:0397:FIN:EN:PDF (accessed 1 July 2015).Search in Google Scholar
Conway, Erik & Naomi Oreskes. 2010. Merchants of doubt: How a handful of scientists obscured the truth on issues from tobacco smoke to global warming. New York: Bloomsbury.Search in Google Scholar
Department of Energy and Climate Change. 2015. Latest Documents. https://www.gov.uk/government/latest?departments%5B%5D=department-of-energy-climate-change (accessed 1 July 2015).Search in Google Scholar
Department for Environment, Food and Rural Affairs (Defra). 2005. UK Securing the future: UK sustainable development strategy. https://www.gov.uk/government/uploads/system/uploads/attachment_data/file/69412/pb10589-securing-the-future-050307.pdf (accessed 1 July 2015).Search in Google Scholar
Department for Environment, Food and Rural Affairs (Defra). 2008. Derived from Defra statistics. https://statistics.defra.gov.uk/esg/publications/amr/default.asp (accessed 21 July 2015).Search in Google Scholar
Downing, Phil & Joe Ballantyne. 2007. Tipping point or turning point: Social marketing and climate change. https://www.ipsos-mori.com/Assets/Docs/Publications/sri_tipping_point_or_turning_point_climate_change.pdf (accessed 5 August 2016).Search in Google Scholar
Ehrenreich, Barbara. 2009a. Bright-sided: How the relentless promotion of positive thinking has undermined America. New York: Metropolitan.Search in Google Scholar
Ehrenreich, Barbara. 2009b. Smile or die: How positive thinking fooled America and the world. London: Granta.Search in Google Scholar
Environmental Protection Agency (USA). 1998. Supplemental environmental projects policy. http://www.epa.gov/oppt/epp/pubs/wwlabel3.pdf (accessed 1 July 2015).Search in Google Scholar
Fazio, Russel H., Joni R. Jackson, Bridget C. Dunton & Carol J. Williams. 1995. Variability in automatic activation as an unobtrusive measure of racial attitudes: A bona fide pipeline? Journal of Personality and Social Psychology 69. 1013–1027.10.1037/0022-3514.69.6.1013Search in Google Scholar
Friese, Malte, Michaela Wänke & Henning Plessner. 2006. Implicit consumer preferences and their influence on product choice. Psychology & Marketing 23. 727–740.10.1002/mar.20126Search in Google Scholar
Gadema, Zaina & David Oglethorpe. 2011. The use and usefulness of carbon labelling food: a policy perspective from a survey of UK supermarket shoppers. Food Policy 36. 815–822.10.1016/j.foodpol.2011.08.001Search in Google Scholar
Gawronski, Bertram, Wilhelm Hofmann & Christopher J. Wilbur. 2006. Are “implicit” attitudes unconscious? Consciousness and Cognition 15. 485–499.10.1016/j.concog.2005.11.007Search in Google Scholar
Gibson, Bryan. 2008. Can evaluative conditioning change attitudes toward mature brands? New evidence from the Implicit Association Test. Journal of Consumer Research 35. 178–188.10.1086/527341Search in Google Scholar
Greenwald, Anthony G. 1990. What cognitive representations underlie attitudes? Bulletin of the Psychonomic Society 28. 254.10.3758/BF03334018Search in Google Scholar
Greenwald, Anthony G., Debbie E. McGhee & Jordan L. Schwartz. 1998. Measuring individual differences in implicit cognition: The implicit association test. Journal of Personality and Social Psychology 74. 1464–1480.10.1037/0022-3514.74.6.1464Search in Google Scholar
Greenwald, Anthony G., Brian A. Nosek & Nene Sriram. 2006. Consequential validity of the implicit association test: Comment on Blanton and Jaccard. American Psychologist 61. 56–61.10.1037/0003-066X.61.1.56Search in Google Scholar
Greenwald, Anthony G. & Mahzarin R. Banaji. 1995. Implicit social cognition: Attitudes, self-esteem, and stereotypes. Psychological Review 102. 4–27.10.1037/0033-295X.102.1.4Search in Google Scholar
Greenwald, Anthony G., & Brian A. Nosek. 2008. Attitudinal dissociation: What does it mean? In R. E. Petty, R. H. Fazio & P. Brinol (eds.), Attitudes: Insights from the new implicit measures, 65–82. Mahwah, NJ: Erlbaum.Search in Google Scholar
Greenwald, Anthony G., Brian A. Nosek & Mahzarin R. Banaji. 2003. Understanding and using the implicit association test: I. An improved scoring algorithm. Journal of Personality and Social Psychology 85. 197–216.10.1037/0022-3514.85.2.197Search in Google Scholar
Hansen, James, Pushker Kharecha, Makiko Sato, Valerie Masson-Delmotte, Frank Ackerman, David J. Beerling, Paul J. Hearty, Ove Hoegh-Guldberg, Shi-Ling Hsu, Camille Parmesan, Johan Rockstrom, Eelco J. Rohling, Jeffrey Sachs, Pete Smith, Konrad Steffen, Lise Van Suteren, Karina von Schuckmann, & James C. Zachos. 2013. Assessing “dangerous climate change”: Required reduction of carbon emissions to protect young people, future generations and nature. PLoS One 8. e81648.10.1371/journal.pone.0081648Search in Google Scholar
Hofmann, Wilhelm, Wolfgang W. Rauch & Bertram Gawronski. 2007. And deplete us not into temptation: Automatic attitudes, dietary restraint, and self-regulatory resources as determinants of eating behavior. Journal of Experimental Social Psychology 43. 497–504.10.1016/j.jesp.2006.05.004Search in Google Scholar
Isaacowitz, Derek M. 2005. The gaze of the optimist. Personality and Social Psychology Bulletin 31. 407–415.10.1037/e633872013-253Search in Google Scholar
Isaacowitz, Derek M. 2006. Motivated gaze: The view from the gazer. Psychological Science 15. 68–71.10.1111/j.0963-7214.2006.00409.xSearch in Google Scholar
Jensen, Marlene & Ronald Drozdenko. 2008. The changing price of brand loyalty under perceived time pressure. Journal of Product & Brand Management 17. 115–120.10.1108/10610420810864720Search in Google Scholar
Kahneman, Daniel. 2011. Thinking, fast and slow. London: Penguin.Search in Google Scholar
Kihlberg, Iwona & Einar Risvik. 2007. Consumers of organic foods – value segments and liking of bread. Food Quality and Preference 18. 471–481.10.1016/j.foodqual.2006.03.023Search in Google Scholar
Koistinen, Laura, Eija Pouta, Jaakko Heikkilä, Sari Forsman-Hugg, Jaana Kotro, Jarmo Mäkelä & Mari Niva. 2013. The impact of fat content, production methods and carbon footprint information on consumer preferences for minced meat. Food Quality and Preference 29. 126–136.10.1016/j.foodqual.2013.03.007Search in Google Scholar
Kraus, Stephen J. 1995. Attitudes and the prediction of behavior: A meta-analysis of the empirical literature. Personality and Social Psychology Bulletin 21. 58–75.10.1177/0146167295211007Search in Google Scholar
Leahy, Terry. 2007. Tesco, carbon and the consumer. http://149.6.127.57/index.asp?pageid=17&newsid=356. (accessed 15 August 2016).Search in Google Scholar
MacGillivray, Alex. 2000. The fair share: The growing market share of green and ethical products. London: New Economics Foundation.Search in Google Scholar
Magnusson, Maria K., Anne Arvola, Ulla-Kaisa Koivisto Hursti, Lars Åberg, & Per-Olow Sjödén. 2001. Attitudes towards organic foods among Swedish consumers. British Food Journal 103. 209–227.10.1108/00070700110386755Search in Google Scholar
McConnell, Allen R. & Jill M. Leibold. 2009. Weak criticisms and selective evidence: Reply to Blanton et al. (2009). Journal of Applied Psychology 94. 583–589.10.1037/a0014649Search in Google Scholar
Muller, Georg E. & Alfons Pilzecker. 1900. Expedmentelle beitrage zur lehre vom gedachtni. Zeitschrift Psychologie 1. 1–300.Search in Google Scholar
Padel, Susanne, Helena Röcklinsberg & Otto Schmid. 2009. The implementation of organic principles and values in the European Regulation for organic food. Food Policy 34. 245–251.10.1016/j.foodpol.2009.03.008Search in Google Scholar
Roos, Elin & Helene Tjarnemo. 2011. Challenges of carbon labelling of food products: A consumer research perspective. British Food Journal 113. 982–996.10.1108/00070701111153742Search in Google Scholar
Rundh, Bo. 2007. International marketing behavior amongst exporting firms. European Journal of Marketing 41. 181–198.10.1108/03090560710718175Search in Google Scholar
Rydell, Robert J., Allen R. McConnell, Diane M. Mackie, & Laura M. Strain. 2006. Of two minds: Forming and changing valence-inconsistent implicit and explicit attitudes. Psychological Science 17. 954–958.10.1111/j.1467-9280.2006.01811.xSearch in Google Scholar
Saba, Anna & Federico Messina. 2003. Attitudes towards organic foods and risk/benefit perception associated with pesticides. Food Quality and Preference 14. 637–645.10.1016/S0950-3293(02)00188-XSearch in Google Scholar
Sahota, Amarjit. 2009. The global market for organic food and drink. In H. Willer & L. Kilcher (eds.), The world of organic agriculture: Statistics and emerging trends. Bonn: FIBL-IFOAM Report.Search in Google Scholar
Seligman, Martin E. 1970. On the generality of the laws of learning. Psychological Review 77. 406–418.10.1037/h0029790Search in Google Scholar
Skinner, Burrhus F. 1938. The behavior of organisms: An experimental analysis. Oxford: Appleton-Century.Search in Google Scholar
Sloman, Steven A. 1996. The empirical case for two systems of reasoning. Psychological Bulletin 119. 3–22.10.1037/0033-2909.119.1.3Search in Google Scholar
Steffens, Melanie C. 2004. Is the implicit association test immune to faking? Experimental Psychology 51. 165–179.10.1027/1618-3169.51.3.165Search in Google Scholar
Stern, Nicholas H. 2006. Stern review: The economics of climate change. London: HM Treasury.10.1017/CBO9780511817434Search in Google Scholar
Stocker, Thomas F., Dahe Qin, Gian-Kasper Plattner, Melinda Tignor, Simon K. Allen, Judith Boschung & Pauline M. Midgley. 2014. IPCC, 2014: Climate Change 2014: The Physical Science Basis. Contribution of Working Group I to the Fifth Assessment Report of the Intergovernmental Panel on Climate Change.Search in Google Scholar
Unilever. 2013. Unilever sustainability plan. http://www.unilever.com.tw/Images/slp_Unilever-Sustainable-Living-Plan-2013_tcm13–388693_tcm206–395956.pdf (accessed 1 July 2015).Search in Google Scholar
United Nations. 1992. Sustainable development 21. https://sustainabledevelopment.un.org/content/documents/Agenda21.pdf (accessed 1 July 2015).Search in Google Scholar
Upham, Paul, Leonie Dendler & Mercedes Bleda. 2011. Carbon labelling of grocery products: Public perceptions and potential emissions reductions. Journal of Cleaner Production 19. 348–355.10.1016/j.jclepro.2010.05.014Search in Google Scholar
Vermeir, Iris & Wim Verbeke. 2006. Sustainable food consumption: Exploring the consumer “attitude–behavioral intention” gap. Journal of Agricultural and Environmental Ethics 19. 169–194.10.1007/s10806-005-5485-3Search in Google Scholar
Walker, Gabrielle & David King. 2008. The hot topic: What we can do about global warming. London: Bloomsbury.Search in Google Scholar
Zeithaml, Valarie A. 2008. Consumer perceptions of price, quality and value: A means-end model and synthesis of evidence. Journal of Marketing 52. 2–22.10.1177/002224298805200302Search in Google Scholar
Ziegert, Jonathan C., & Paul J. Hanges. 2009. Strong rebuttal for weak criticisms: Reply to Blanton et al. (2009). Journal of Applied Psychology 94. 590–597.10.1037/a0014661Search in Google Scholar
©2016 by De Gruyter Mouton
Articles in the same Issue
- Frontmatter
- A meta-theoretical approach to the history and theory of semiotics
- La possibilité d’une étude sémiotique des transhumanités: Une lecture d’un film La Créature céleste, bouddha robot coréen
- Non-anthropogenic mind and complexes of cultural codes
- Vygotsky, Bakhtin, Lotman: Towards a theory of communication in the horizon of the other
- Les deux barricades: Complexité sémiotique et objectivation des faits de style dans un extrait des Misérables
- The structural properties of the anagram in poetry
- Rethinking the Peircean trichotomy of icon, index, and symbol
- Toward an embodied account of double-voiced discourse: The critical role of imagery and affect in Bakhtin’s dialogic imagination
- The rhetoric of love and self-narrativesin the cinema image: A Peircean approach
- Nature and culture in visual communication: Japanese variations on Ludus Naturae
- Semiotics and education, semioethic perspectives
- Towards a teleo-semiotic theory of individuation
- Dialogue, responsibility and literary writing: Mikhail Bakhtin and his Circle
- Becoming a commercial semiotician
- Cross-political pan-commercialism in the postmodern age and proposed readjustment of semiotic practices
- Meaning-making across disparate realities: A new cognitive model for the personality-integrating response to fairy tales
- The rise and fall of metaphor: A study in meaning and meaninglessness
- Anthroposemiotics of literature: The cultural nature
- McLuhan’s war: Cartoons and decapitations
- Leadership as zero-institution
- Consumption and climate change: Why we say one thing but do another in the face of our greatest threat
- Semiotics of precision and imprecision
- Interrelations of codes in human semiotic systems
- A-voiding representation: Eräugnis and inscription in Celan