Numerical elastoplastic analysis of the shear stress distribution in the adhesive layer for single-lap joints
-
Yeliz Pekbey


Abstract
The purpose of this paper was to investigate the stress distribution of adhesive single-lap joint loaded in the elastic and elastoplastic range. The stress variation across the adhesive length was achieved both analytically and numerically. A two-dimensional finite element solution presented a detailed picture of the stress behavior in a single-lap joint loaded in the elastic and elastoplastic range. After the finite element results matched very well with results obtained from analytic solution in the elastic range, it was decided that adhesive plasticity needed to be added to the finite element models in order to make them as accurate as possible. The residual stresses after elastic-plastic loading were calculated. The results obtained from numerical analysis showed that the residual stress was important as the joint strength can be increased by residual stresses. In addition, the effect of the adhesive length, thickness of adhesive, and thickness of adherends on the shear distribution of the adhesive was examined numerically by using elastoplastic finite element method. The target was to change the geometry of the joint and study its effects on the stress distribution in the adhesive.
1 Introduction
Adhesive bonding technology has been increasingly used today in fields such as aeronautics, automotive, and civil engineering because of its favorable mechanical performance. When compared to traditional methods of joining, adhesive joints have the advantages of more uniform distribution of load, lighter weight, fewer sources of stress concentrations, and cost saving [1, 2]. In an adhesively bonded joint, the adhesive layer in the overlap region transmits the load from one adherend to another adherend. In addition to tension, bending moments also take place in the joint. There is the rotation of the adherends caused by the arm between the pull forces, which lead not only to shear stresses but also to peel stresses in the adhesive layer. Actually, 1) peel stresses first arise due to differential transverse displacement of the adherend, and 2) this interacts with the rotation of the joint. Because the substrates are not rigid, they stretch more near their loaded end. The shear stress is not uniform and the shear stress peaks at the overlap ends where the differential substrate extension is greatest. In highly stressed regions, plastic deformation of both adhesive and adherend may occur. Stress concentrations at the interface, which may become infinite for particular geometries, are due to material mismatch and geometry of the corner. The stresses that occur at the interfaces of the adherends are important in the design of bonded joints. In the design of bonded joints, the strength of joints is affected by several parameters such as joint geometry, joint configuration, adhesive and adherend mechanical properties, and type of load. The stress distribution in the joints needed to use the full potential of materials should be known so that the appropriate configuration can be selected for a variety of applications. Stress concentrations should be minimal with the suitable configuration. In this way, the performance of the joints can be improved.
In the past 65–70 years, many studies about stress analysis and mathematical modeling have been done on adhesive lap joints [3–10]. The solution is performed either analytically or by numerical methods due to the complexity of the mathematical model. The first approach was suggested by Volkersen [11], who considered only shear deformation of the adhesive and axial deformation of the adherends. However, Volkersen’s solution does not consider the adherend bending and shear deformations. Later, Goland and Reissner [12] considered the effect of the adherend bending leading to peel stress in the adhesive. Goland and Reissner expanded Volkersen’s work by including the effects of the bending moment applied to the joint under tensile loading.
There are several analytical methods for the calculation of stress distributions in adhesively bonded joints [13–16]. However, the implementation and use of analytical models is difficult because of complex nonlinear functions of material properties and geometry [17]. This has resulted in a wide range of solutions developed, each with different assumptions and simplifications [18]. Da Silva et al. [19, 20] and Banea and da Silva [13] made an extensive literature review on existing analytical models for both single- and double-lap joints to assist the designer to choose the right model for a particular application. These studies [13, 19, 20] examined almost all analytical models for adhesively bonded joints. They have also achieved many numerical investigations such as the finite element method about adhesively bonded joints. Many authors were interested in the study of parameters affecting stress distribution [13, 20–27]. In this subject, He [28] carried out an extensive literature review on existing finite element analysis of adhesively bonded joints.
In the literature, there is less study about an elastoplastic solution of single-lap joints. Elastoplastic stress analysis is an important solution because the joint strength can be increased by residual stresses after elastic-plastic loading. Yang et al. [29], Lee and Kim [30], and Sayman [31] carried out elastic-plastic models of adhesively bonded single-lap composite joints.
The objective of this investigation is to extend elastoplastic stress in the adhesively bonded single-lap joints. In this study, the behavior of adhesively bonded single-lap joints with similar materials was investigated under elastic and elastoplastic loading range. The analysis considered the stress variation across the adhesive length. First, the elastic shear stresses were analytically described. Then, the finite element solution was obtained and its accuracy was confirmed by comparison with an analytical solution. Furthermore, the finite element solutions were expanded to present a detailed picture of the stress behavior in a single-lap joint loaded in the elastoplastic range.
The stress distribution within the adhesive layer is a function of geometry. These differences alter the load capacity of the joint due to stress concentrations. In this study, the effect of the adhesive length and thickness of adherends and adhesive on the shear distribution of the adhesive were also examined. The target was to change the geometry of the joint and study the effects on the stress distribution of both the adherends and the adhesive. The residual stresses were calculated for different overlap length and adhesive and adherend thickness.
2 Problem definition
The initial configuration of the scope of study is the typical bonded single-lap joint. Two similar adherends of uniform thickness are bonded by an adhesive of uniform thickness ta and shear modulus of adhesive Ga. The upper and lower adherends have thickness tu and tl, respectively. The geometry of the joint used for modeling is shown in Figure 1.
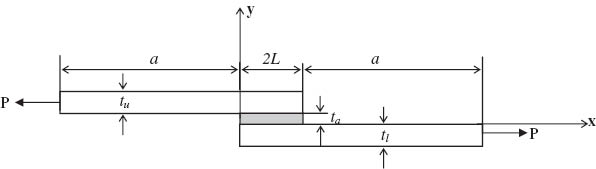
Geometry of single-lap Joint (a=50 mm).
Three main cases were investigated for an elastic and elastoplastic analysis. One case examined the effect of the overlap length on the shear stress distribution. The second and third cases studied the effect of different thicknesses of adherends and adhesive, respectively. Stress variation across the adhesive length was obtained for all cases.
The target was to change the geometry of the joint and study the effects on the stress distribution of adhesive. For this purpose, the adhesive length (overlap length) was taken as 2L=20, 22.5, and 25 mm [limited variation: 22.5+-2.5 mm (about 10%)]. The adherends were a+2L mm long and the length of a was taken as constant (a=50 mm). The thickness of adherends was changed as tu=tl=1.8, 2.4, and 3 mm. The effect of adhesive thickness was analyzed by varying the adhesive thickness as ta=0.14, 0.16, and 0.18 mm [again, limited variation: 0.16+-0.02 (12.5%)]. Table 1 shows the cases examined in this study.
Single-lap joint dimensions (mm).
| Overlap length | Adherend thickness | Adhesive thickness | |||
|---|---|---|---|---|---|
| 2L | tu=tl | ta1 | ta2 | ta3 | |
| A1–A3 | 20 | 1.8 | 0.14 | 0.16 | 0.18 |
| B1–B3 | 20 | 2.4 | 0.14 | 0.16 | 0.18 |
| C1–C3 | 20 | 3 | 0.14 | 0.16 | 0.18 |
| D1–D3 | 22.5 | 1.8 | 0.14 | 0.16 | 0.18 |
| E1–E3 | 22.5 | 2.4 | 0.14 | 0.16 | 0.18 |
| F1–F3 | 22.5 | 3 | 0.14 | 0.16 | 0.18 |
| G1–G3 | 25 | 1.8 | 0.14 | 0.16 | 0.18 |
| H1–H3 | 25 | 2.4 | 0.14 | 0.16 | 0.18 |
| I1–I3 | 25 | 3 | 0.14 | 0.16 | 0.18 |
The only externally applied load was the in-plane force per unit width, P. The load applied was taken as 420 N, which produced the plastic deformations for an elastoplastic analysis.
The properties of the adhesive used in this study are listed in Table 2. Because the adhesive was assumed to be a continuous, homogeneous isotropic with elastoplastic behavior, the plasticity constants K and n are taken as 82 MPa and 0.625, respectively. As seen in this table, the value of the yield point of the adhesive is σy=35 MPa. Similarly, the mechanical properties of the adherends are given in Table 3. The mechanical properties of adherends, which are composed of glass fiber epoxy composite layers, are shown in Table 3. The adherends are supposed to be continuous and homogeneous with orthotropic linear elastic behavior. Furthermore, the composite adherends have 0° fiber orientation.
Adhesive mechanical properties.
| E (MPa) | υ | σy (MPa) | K (MPa) | N |
|---|---|---|---|---|
| 4230 | 0.35 | 35 | 82 | 0.625 |
Adherends’ mechanical properties.
| E1 (GPa) | E2 (GPa) | G12 (GPa) | υ12 |
|---|---|---|---|
| 33.0 | 10.5 | 4.8 | 0.27 |
3 Elastic analysis of a single-lap joint
In this section, a stress equation for the single lap joint subjected to in-plane tensile load was derived through an analytical solution. In the elastic solution, shear stresses were supposed to be uniform through the adhesive thickness (z direction), the longitudinal stress in the adherends was not changed through the thickness of the adhesive, and the adherends were not deformed due to transverse shear. The thickness small enough to be acceptable for bending effect was negligible [27, 31].
From the static equilibrium of an infinitesimal element shown in Figure 2, longitudinal force equilibrium can be written following the equation:
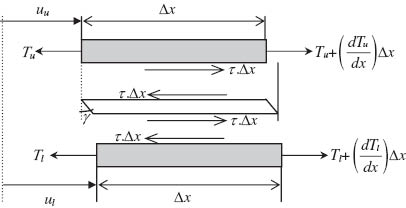
The free-body diagram of single-lap joint.
where Tu and Tl show longitudinal tension (per unit width) in the upper and lower adherends, respectively. τ is the shear stress in the adhesive layer. The rotations of the outer adherends are not considered because of possible bending [27, 31]. Therefore, the stress can be given following the expression:
where uu and ul are the upper and lower displacements and ta is the thickness of the adhesive layer. Taking the derivative with respect to x in the above equation,
By using Eqs. (1)–(3), for the elastic region, the following well-known governing equation is valid:
where
The solution of the differential equation can be written as
where the integration constants C1 and C2 can be obtained by using the following boundary conditions:
As a result, the shear stress in the adhesive layer can be written in the following form [27, 31]:
In this study, the shear stresses for the single-lap joint were calculated using the above analytical solution in elastic region for each coordinate of adhesive length.
4 Elastoplastic analysis of a single-lap joint
The total strain increment consists of the sum the elastic and plastic strain increments in the plastic region:
The incremental form of Eq. (9) is defined as follows:
where dλ is defined in Prandtl-Reuss equations.
Ludwik equation can be written in exponential form as follows:
where K and n are defined as the plasticity constants.
If the plasticity constant n is used, the analytical solution may not be solved. Therefore, Ludwik equation may be taken as bilinear form. For the bilinear solution, when the plasticity constant n value is taken as 1, derivation of Eq. (12) is written as follows:
when the von Mises criterion is used, Eq. (13) is written as
Eq. (11) is now in the following form:
After some mathematical manipulations, the following differential equation is obtained:
where c and λp are defined as follows:
Finally, the shear stress τ in the adhesive ply can be obtained as follows:
In this study, the plasticity constant K was taken as 82 MPa. The solution was performed for P=420 N, which produces the plastic deformations.
5 Numerical analysis
A stress equation for the single-lap joint subjected to in-plane tensile load was derived through a numerical solution. A two-dimensional finite element analysis was implemented on a single-lap joint by using ANSYS 12 software. First, the adhesive behavior was examined in elastic range. The model was confirmed provided that the stress distribution in the adhesive agrees with the theory. Note that this is valid as far as the elastic modulus ratio Eadherend/Eadhesive is high enough (see [15]). Then, the shear stresses in the adhesive were obtained by assuming elastoplastic adhesive behavior.
In this study, the two-dimensional finite element analysis of adhesively single-lap joints was achieved by using conventional plane stress elements. Both adherend and adhesive used plane element PLANE182, which was defined by four nodes having two degrees of freedom at each node: translations in the nodal x and y directions. The finite element mesh for the overlap zone is shown in Figure 3 with boundary conditions. Roller support was used for neglecting the influence of the bending moment due to the adherends being noncollinear.
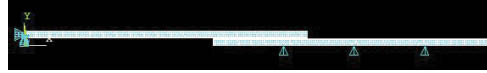
The boundary conditions of single-lap joints.
A three-dimensional solution was not completely necessary because the stresses do not vary across the width of the joint. A two-dimensional plane element model was composed to try and capture the accuracy of a solid model without the large computer processing time. When this approach was followed, very fine meshes were required, particularly in the adhesive layer. In order to obtain a reasonable accuracy, the finer mesh was composed and the solutions were carried out for different element ratios. In this way, a change in shear stress distribution was observed with the mesh refinement. Mesh refinement was performed by changing both adhesive and adherend element ratios.
Table 4 shows adherend and adhesive element ratios used for finer mesh. In this study, element ratios of adherends and adhesive were changed to obtain accurate stress value. The number of nodes and elements depending on element ratios are also given in Table 4 for adhesive length of 2L=25 mm, adhesive thickness of ta=0.14 mm, and adherend thickness of tu=1.8 mm.
Number of nodes and elements for 2L=25 mm, tu=1.8 mm, ta=0.14 mm.
| Adherend element ratio | Adhesive element ratio | Number of nodes | Number of elements |
|---|---|---|---|
| Different adherend element ratios and constant adhesive element ratio | |||
| 0.10 | 0.020 | 30,055 | 28,761 |
| 0.20 | 0.020 | 8276 | 7625 |
| 0.30 | 0.020 | 4030 | 3594 |
| 0.40 | 0.020 | 2652 | 2321 |
| Different adhesive element ratios and constant adherend element ratio | |||
| 0.40 | 0.020 | 2652 | 2321 |
| 0.40 | 0.025 | 2588 | 2258 |
| 0.40 | 0.030 | 2524 | 2195 |
| 0.40 | 0.035 | 2460 | 2132 |
| Different adherend and adhesive element ratios | |||
| 0.10 | 0.005 | 34,851 | 33,536 |
| 0.20 | 0.010 | 9158 | 8500 |
| 0.30 | 0.015 | 3556 | 3118 |
| 0.40 | 0.020 | 2652 | 2321 |
The baseline model, the simple single-lap joint in Figure 1, was relatively long and thin such that the mesh for the entire model was very difficult to display. Therefore, only regions that were characteristic for this kind of problem were displayed (regions A and B, Figure 4).
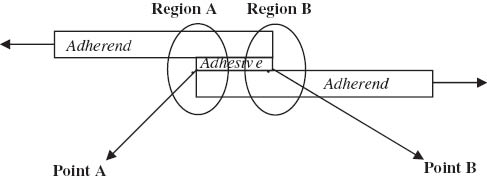
Stress singularity regions.
Figure 5 displays the mesh model of the stress singularity regions. This mesh model was generated so that adherend element ratio and adhesive element ratio was taken as 0.40 and 0.020 mm, respectively.
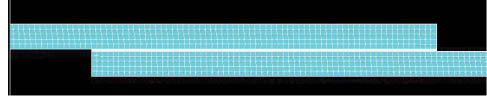
Mesh model of the stress singularity regions.
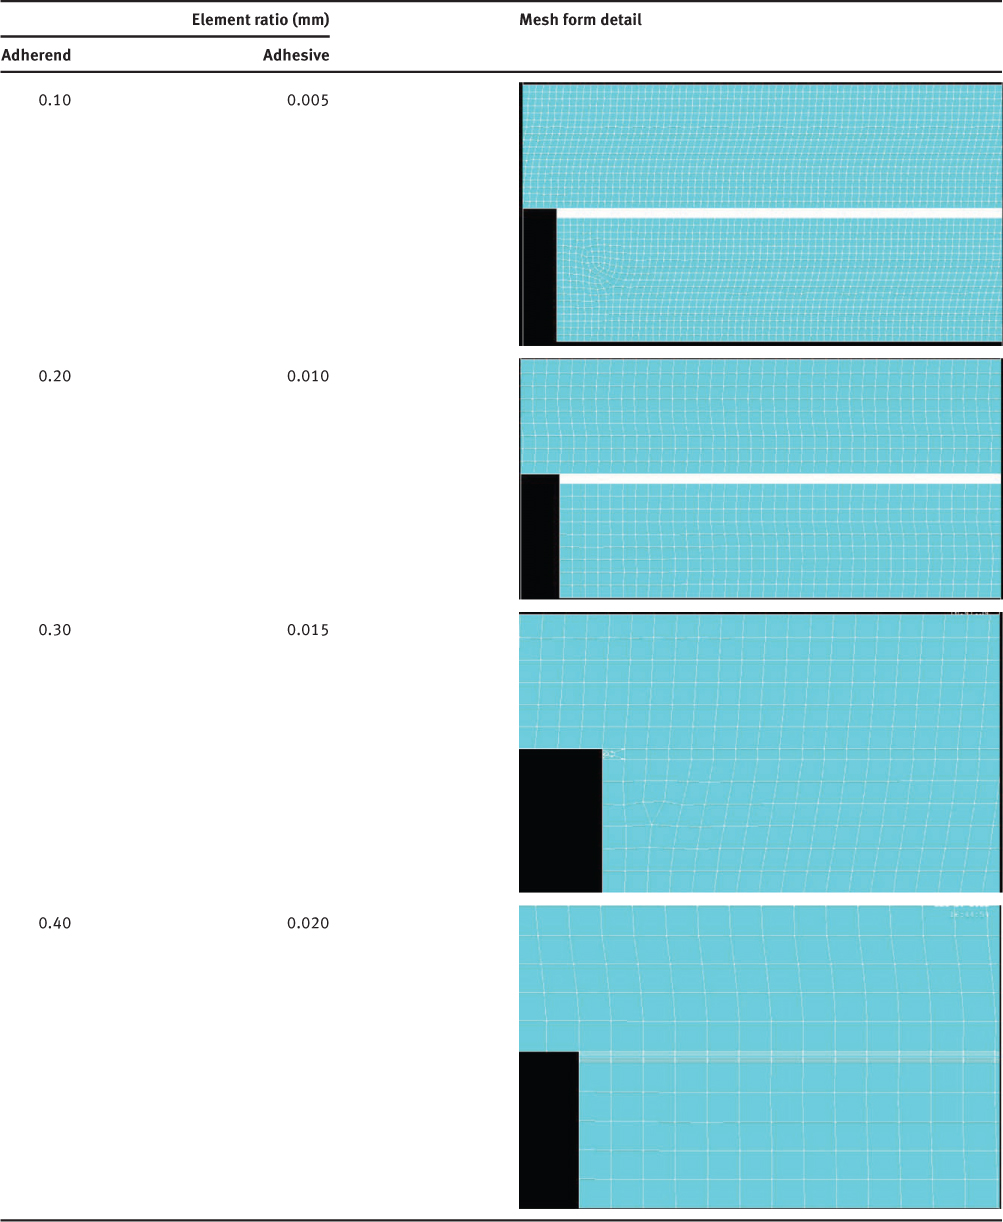
One way to account for this singularity was to use an extremely fine mesh in this area. Table 5 shows the mesh detail for stress singularity region A for different element ratios of adherends.
Mesh detail for stress singularity region A with different element ratios.
The mesh detail in Figure 5 was composed by taking adherend and adhesive element ratios of 0.40 and 0.020 mm, respectively. Furthermore, the mesh model was composed of 2652 nodes and 2321 elements.
5.1 Adhesive behavior in elastoplastic range
In order to analyze the behavior of the single-lap joint with different adhesive length and adherend and adhesive thickness, the finite element analysis was performed in two steps: First, the stresses in the adhesive were assumed to stay in the elastic range. The finite element results matched very well with analytical results in the elastic region. The general trend of the stresses was a good fit with the general trend of the theory and was found to be sufficient for this analysis. Therefore, it was decided that adhesive plasticity needed to be added to the finite element models in order to make them as accurate as possible. Second, the shear stress in the adhesive was calculated in the elastoplastic range.
When the yield stress was reached, the adhesive material properties became nonlinear. The actual stress distribution was affected by this nonlinear behavior. Therefore, it needed elastoplastic analysis. Further, because adhesives are so ductile, the adherends may be plastically deformed before the adhesive fails. For this reason, adhesive and adherend plasticity require to be considered as well. In this study, plasticity in the adherends was not considered because of the lack of yielding under loading. Only plasticity in the adhesive was taken into account.
The von Mises criterion was used as the yield criterion for the adhesive.
6 Results and discussion
In the finite element solution, the mesh was refined in the overlap bond area to obtain the correct stress state in the adhesive. Table 6 shows the shear stresses under elastoplastic loading in stress singularity regions (points A and B) for different adherend and adhesive element ratios. Similarly, the shear stresses under elastoplastic loading through the adhesive length are given in Table 7 for overlap length of 25 mm and adhesive and adherend thickness of 0.14 and 1.8 mm, respectively.
The shear stresses under elastoplastic loading for singularity points (2L=25 mm, tu=1.8 mm, ta=0.14 mm).
| Element ratios (mm) | Shear stress (MPa) | ||
|---|---|---|---|
| Adherend | Adhesive | Point A | Point B |
| 0.10 | 0.020 | -21.377 | -25.587 |
| 0.20 | 0.020 | -23.998 | -24.578 |
| 0.30 | 0.020 | -24.606 | -24.047 |
| 0.40 | 0.020 | -24.787 | -23.731 |
| 0.40 | 0.025 | -24.692 | -23.755 |
| 0.40 | 0.030 | -24.575 | -23.778 |
| 0.40 | 0.035 | -24.418 | -23.776 |
| 0.10 | 0.005 | -22.132 | -25.287 |
| 0.20 | 0.010 | -24.754 | -24.551 |
The plastic shear stresses (MPa) for different element ratios for 2L=25 mm, tu=1.8 mm, ta=0.14 mm.
| Element ratios (mm) | Adhesive coordinates (mm) | |||||||||||
|---|---|---|---|---|---|---|---|---|---|---|---|---|
| Adherend | Adhesive | 0 | 2.5 | 5 | 7.5 | 10 | 12.5 | 15 | 17.5 | 20 | 22.5 | 25 |
| 0.10 | 0.020 | -21.377 | -22.423 | -21.377 | -17.019 | -8.703 | -6.604 | -8.664 | -17.167 | -20.927 | -21.447 | -25.587 |
| 0.20 | 0.020 | -23.998 | -22.349 | -20.762 | -16.461 | -8.702 | -6.606 | -8.662 | -17.968 | -20.906 | -22.680 | -24.578 |
| 0.30 | 0.020 | -24.606 | -22.298 | -20.715 | -17.598 | -8.486 | -6.591 | -8.968 | -17.880 | -21.063 | -22.687 | -24.047 |
| 0.40 | 0.020 | -24.787 | -22.250 | -20.639 | -17.034 | -8.152 | -6.584 | -8.764 | -17.386 | -21.069 | -22.683 | -23.731 |
| 0.40 | 0.025 | -24.692 | -22.260 | -20.647 | -17.031 | -8.152 | -6.584 | -8.764 | -17.411 | -21.069 | -22.687 | -23.755 |
| 0.40 | 0.030 | -24.575 | -22.275 | -20.659 | -17.068 | -8.154 | -6.584 | -8.763 | -18.797 | -21.072 | -22.693 | -23.778 |
| 0.40 | 0.035 | -24.418 | -22.283 | -20.684 | -16.785 | -8.085 | -6.525 | -8.685 | -16.809 | -21.061 | -22.689 | -23.776 |
| 0.10 | 0.005 | -22.132 | -22.394 | -20.752 | -17.027 | -8.718 | -6.615 | -8.6761 | -17.406 | -21.004 | -22.591 | -25.287 |
| 0.20 | 0.010 | -24.754 | -22.345 | -20.724 | -16.478 | -8.694 | -6.599 | -8.653 | -17.893 | -21.005 | -22.650 | -24.551 |
As can be seen from Tables 6 and 7, although the number of nodes and elements are different for element ratios, it is noticed that the values of elastoplastic shear stresses along the overlap length are very close to each other. However, the computer processing time according to element ratios was very difficult and especially long in the small element ratios for adhesive and adherend. More elements of the model were generated; the computer processing time was significantly increased. For this reason, the degree of mesh refinement was limited for other cases. It was selected as 0.40 mm in the adherends and 0.020 mm in the adhesive to generate the mesh for all cases.
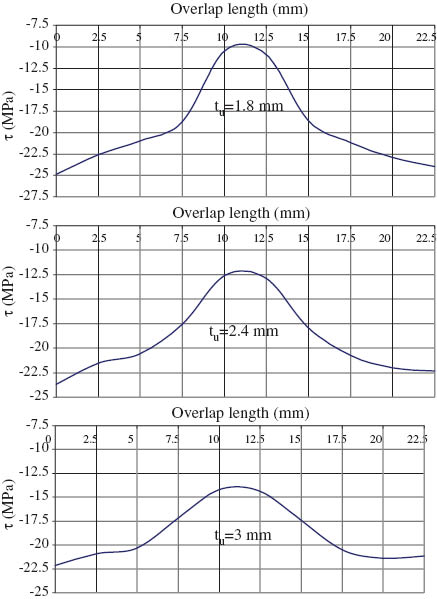
The stress distribution of the finite element model under elastoplastic loading along the adhesive-lower adherend interface (overlap line, y=0) is presented. The stress distribution along the adhesive length in different sections (toward the longitudinal axis direction) is shown in Figures 6–8. The stress at the region near the end of the lap zone was increased. The maximum shear stress in the elastoplastic model is about -24.787 MPa for adherend thickness of tu=1.8 mm. It can also be noticed that the shear stress in origin of the adhesive decreases if the adherend thickness decreases. In Figures 7 and 8, the same tendency can also be seen for adhesive length of 2L=22.5 and 25 mm for adhesive thickness of ta=0.14 mm. The maximum shear stresses in the elastoplastic model for adhesive length of 2L=25 mm were about -23.717 and -23.622 MPa for adhesive thickness of ta=0.14 and 0.18 mm, respectively. Again, in these cases, the maximum shear stresses in the elastoplastic model occurred for adherend thickness of 1.8 mm.
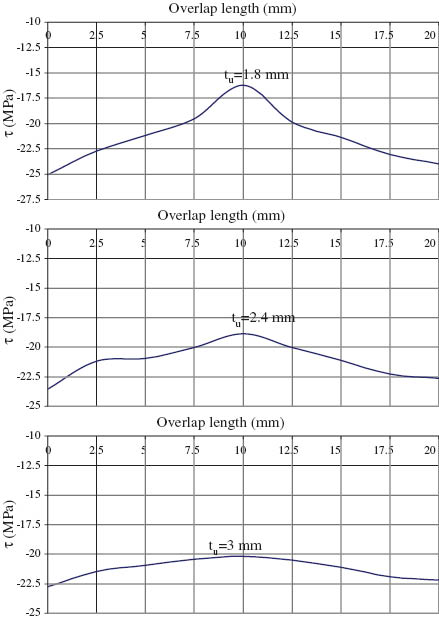
Shear stress distribution under elastoplastic loading for adhesive length of 2L=20 mm and adhesive thickness of ta=0.14 mm.
Shear stress distribution under elastoplastic loading for adhesive length of 2L=22.5 mm and adhesive thickness of ta=0.14 mm.
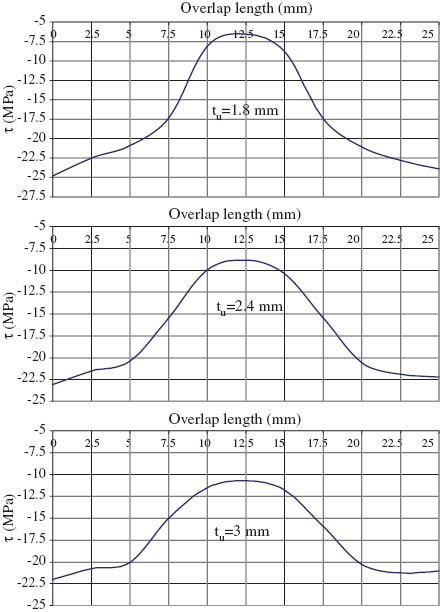
Shear stress distribution under elastoplastic loading for adhesive length of 2L=25 mm and adhesive thickness of ta=0.14 mm.
Table 8 displays the maximum shear stress in the elastoplastic model for all examined cases. As can be seen from Table 8, the highest shear stresses in the elastoplastic model were found for adhesive length of 2L=20 mm, adherend thickness tu=1.8 mm, and adhesive thickness ta=0.14 mm.
The maximum shear stress in the elastoplastic model.
| Overlap length, 2L (mm) | Adherend thickness, tu=tl (mm) | Adhesive thickness, ta1, ta2, ta3 (mm) | Shear stress (MPa) | |
|---|---|---|---|---|
| A1–A3 | 20 | 1.8 | 0.14 | -25.068 |
| 0.16 | -24.525 | |||
| 0.18 | -24.055 | |||
| B1–B3 | 20 | 2.4 | 0.14 | -23.537 |
| 0.16 | -23.192 | |||
| 0.18 | -22.883 | |||
| C1–C3 | 20 | 3 | 0.14 | -22.772 |
| 0.16 | -22.507 | |||
| 0.18 | -21.959 | |||
| D1–D3 | 22.5 | 1.8 | 0.14 | -24.855 |
| 0.16 | -24.289 | |||
| 0.18 | -23.791 | |||
| E1–E3 | 22.5 | 2.4 | 0.14 | -23.712 |
| 0.16 | -22.740 | |||
| 0.18 | -22.345 | |||
| F1–F3 | 22.5 | 3 | 0.14 | -22.143 |
| 0.16 | -21.785 | |||
| 0.18 | -21.593 | |||
| G1–G3 | 25 | 1.8 | 0.14 | -24.787 |
| 0.16 | -23.717 | |||
| 0.18 | -23.622 | |||
| H1–H3 | 25 | 2.4 | 0.14 | -23.052 |
| 0.16 | -22.615 | |||
| 0.18 | -22.213 | |||
| I1–I3 | 25 | 3 | 0.14 | -21.980 |
| 0.16 | -21.683 | |||
| 0.18 | -21.554 |
As shown in Table 8, the stress distribution was concentrated at the ends of the overlap. The maximum shear stress at the edge of adhesive were obtained for the case of between A1 and I1 compared to those of specimens A2, 3 and I2, 3. Also, note that the stress behavior is not symmetric along the right and left interfaces for the finite element cases. This is because differential shearing is more pronounced near the loaded edge. This edge corresponds to the side from which the adherend extends.
Figures 9–11 show the variation of residual shear stress (y=0) of adhesive with adhesive length of 2L=20, 22.5, and 25 mm for different adhesive thicknesses. The residual stresses were calculated by subtracting the shear stress distribution under elastoplastic loading from the shear stress distribution under elastic loading.
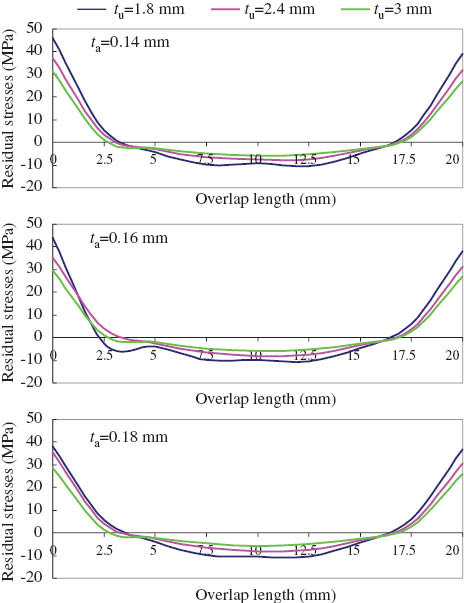
Effect of adherends’ thickness on the residual shear stress for adhesive length of 2L=20 mm with different adhesive thickness.
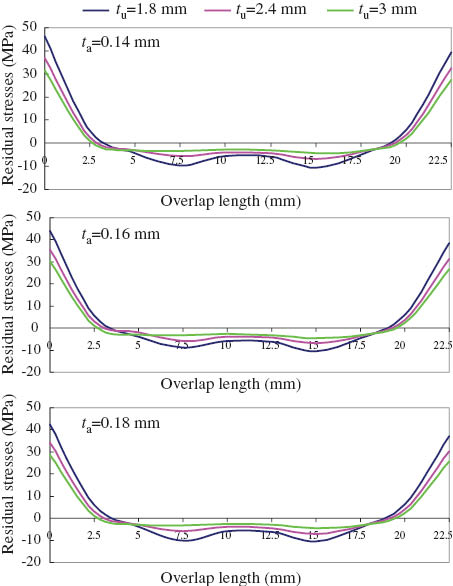
Effect of adherends’ thickness on the residual shear stress for adhesive length of 2L=22.5 mm with different adhesive thickness.
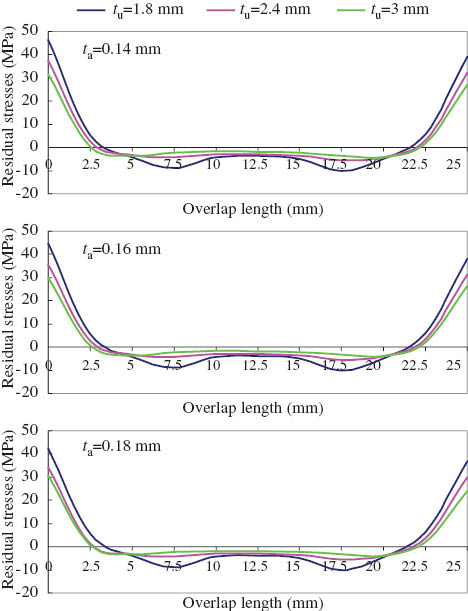
Effect of adherends’ thickness on the residual shear stress for adhesive length of 2L=25 mm with different adhesive thickness.
The influence of adherend thickness on the residual shear stresses can be seen for adhesive thickness ta=0.14, 0.16, and 0.18 mm in Figures 9–11. It can be seen that the maximum residual stress is viewed on the edge of the adhesive and the residual shear stresses decrease near the center of the adhesive. Furthermore, an increase of the adhesive thickness causes a reduction in the residual shear stress. Therefore, the adhesive thickness can be optimized because the adhesive thickness varies according to the assembled materials.
The residual shear stress versus adhesive length is shown in Figures 12–14 for the constant adhesive thickness of 0.14, 0.16, and 0.18 mm with variable overlap lengths (2L=20, 22.5, and 25 mm). The influence of adhesive length on the residual shear stresses can be seen for adherend thickness of tu=1.8, 2.4, and 3 mm in Figures 12–14. It can be seen that the shear stress decreases with increasing adhesive thickness for constant overlap length. Furthermore, the shear stress decreases with increasing adhesive length for constant adherend and adhesive thickness.
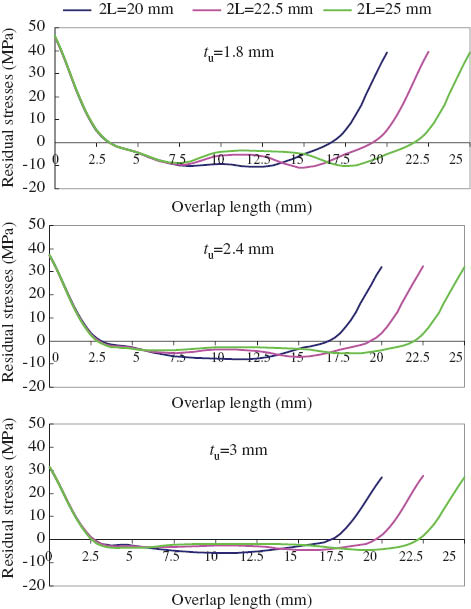
Effect of adhesive length on the residual shear stress for adhesive thickness of ta=0.14 mm with different adherend thickness.
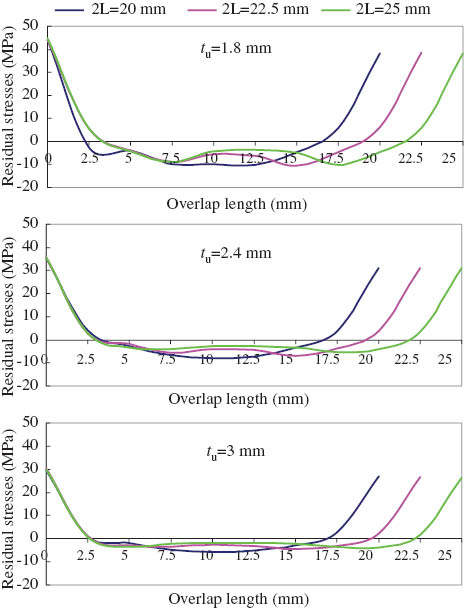
Effect of adhesive length on the residual shear stress for adhesive thickness of ta=0.16 mm with different adherend thickness.
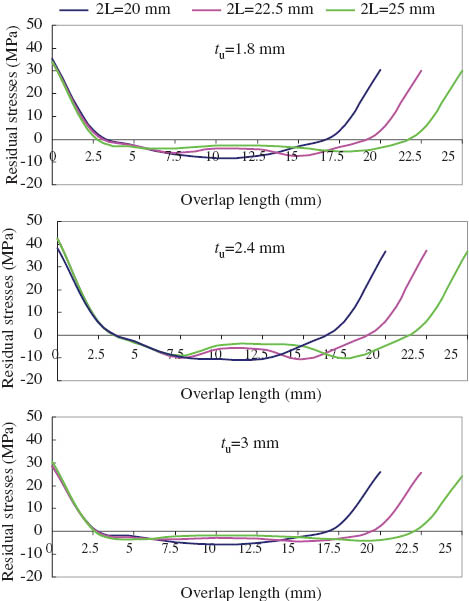
Effect of adhesive length on the residual shear stress for adhesive thickness of ta=0.18 mm with different adherend thickness.
In general, maximum stresses at the ends of the overlap are reduced by increasing the joint stiffness, increasing the adherend thickness, or increasing the adhesive thickness.
7 Conclusions
Numerical analyses were conducted on composite bonded joints in elastic and elastoplastic ranges. The effect of the adhesive length (2L), adhesive thickness (ta), and adherend thickness (tu=tl) on the shear stress distribution through adhesive was investigated.
The results obtained in this study allowed us to understand the following conclusions:
The shear stresses have a maximum value on both ends of the adhesive. The shear stress decreases in the middle of the adhesive. In addition, the stress distribution is not symmetric along the right and left interfaces for the finite element cases. This is because differential shearing is more pronounced near the loaded edge. This edge corresponds to the side from which the adherend extends.
Theoretical predictions show that with all other factors kept constant, the shear strength of a single-lap joint increases with increasing adhesive thickness due to rigidity. Moreover, as the thickness of adherend increases, the joint shear strength increases. It is obvious that the adhesive thickness has an important effect on the joint strength.
The increase in overlap length decreases the shear strength; if the length of the adhesive decreases the residual shear stress increases. The shear stress at the center of adhesive is reduced.
The decrease in thickness of adhesive causes an increment in the residual shear stress.
If the adhesive thickness decreases, the residual stress increases. Thus, the thickness of the adhesive must be optimized to avoid the behavior of the adhesive as weak mechanical resistance.
The results showed that the residual stress of the adhesive was important because the joint strength can be increased by residual stresses after elastic-plastic loading.
References
[1] Madani K, Boukhoulda BF, Touzain S, Feaugas X. In Comptes Rendus des JNC 16, Toulouse: France, 2009.Search in Google Scholar
[2] Ribeiro FL, Borges L, d’Almeida JRM. Int. J. Adhes. Adhes. 2011, 31, 331–337.Search in Google Scholar
[3] Tsai MY, Oplinger DW, Morton J. Int. J. Solids Struct. 1998, 35, 1163–1185.Search in Google Scholar
[4] Khalili SMR, Khalili S, Pirouzhashemi MR, Shokuhfar A, Mittal RK. Int. J. Adhes. Adhes. 2008, 28, 411–418.Search in Google Scholar
[5] Ouinas D, Bachir Bouiadjra B, Achour T, Benderdouche N. Mater. Des. 2010, 31, 4356–4362.Search in Google Scholar
[6] Pereira AM, Ferreira JM, Antunes FV, Bártolo PJ. J. Mater. Process. Technol. 2010, 210, 610–617.Search in Google Scholar
[7] da Costa Mattos HS, Sampaio EM, Monteiro AH. Int. J. Adhes. Adhes. 2011, 31, 446–454.Search in Google Scholar
[8] Stapleton SE, Waas AM, Arnold SM. Int. J. Adhes. Adhes. 2012, 35, 36–49.Search in Google Scholar
[9] Neto JABP, Campilho RDSG, da Silva LFM. Int. J. Adhes. Adhes. 2012, 37, 96–101.Search in Google Scholar
[10] Mokhtari M, Madani K, Belhouari M, Touzain S, Feaugas X, Ratwani M. Mater. Des. 2013, 44, 633–639.Search in Google Scholar
[11] Volkersen O. Luftfahrtforschung 1938, 15, 41.10.2307/475710Search in Google Scholar
[12] Goland M, Reissner E. J. Appl. Mech. 1944, 11, A17–A27.Search in Google Scholar
[13] Banea MD, da Silva LFM. Proc. Inst. Mech. Eng., Part L 2009, 223, 1–19.Search in Google Scholar
[14] Zou GP, Shahin K, Taheri F. Compos. Struct. 2004, 65, 499–510.Search in Google Scholar
[15] Goglio L, Rossetto M. Int. J. Adhes. Adhes. 2011, 31, 301–314.Search in Google Scholar
[16] Zhao B, Lu ZH, Lu Y-N. Int. J. Adhes. Adhes. 2011, 31, 434–445.Search in Google Scholar
[17] Rodríguez RQ, Paivaa WP, Solleroa P, Albuquerque EL, Rodrigues MB. Mecánica Computacional XXIX, 7557–7569.Search in Google Scholar
[18] Chen F, Qiao P. Int. J. Adhes. Adhes. 2012, 36, 44–55.Search in Google Scholar
[19] da Silva LFM, das Neves PJC, Adams RD, Spelt JK. Int. J. Adhes. Adhes. 2009, 29, 319–330.Search in Google Scholar
[20] da Silva LFM, das Neves PJC, Adams RD, Spelt JK. Int. J. Adhes. Adhes. 2009, 331–341.10.1016/j.ijadhadh.2008.06.007Search in Google Scholar
[21] Campilho RDSG, Banea MD, Pinto AMG, da Silva LFM, de Jesus AMP. Int. J. Adhes. Adhes. 2011, 31, 363–372.Search in Google Scholar
[22] Mustapha F, Sim NW, Shahrjerdi A. Int. J. Phys. Sci. 2011, 6, 5153–5165.Search in Google Scholar
[23] Hua Y, Gu L, Trogdon M. Int. J. Adhes. Adhes. 2012, 38, 25–30.Search in Google Scholar
[24] Xu W, Wei Y. Int. J. Adhes. Adhes. 2012, 34, 80–92.Search in Google Scholar
[25] Anyfantis KN,Tsouvalis NG. Int. J. Adhes. Adhes. 2013, 41, 41–49.Search in Google Scholar
[26] Anyfantis KN. Compos. Struct. 2012, 94, 2632–2639.Search in Google Scholar
[27] Her S-C. Compos. Struct. 1999, 47, 673–678.Search in Google Scholar
[28] He X. Int. J. Adhes. Adhes. 2011, 31, 248–264.Search in Google Scholar
[29] Yang C, Huang H, Tomblin JS, Sun W. J. Compos. Mater. 2004, 38, 293–309.Search in Google Scholar
[30] Lee J, Kim H. J. Adhes. 2007, 83, 837–870.Search in Google Scholar
[31] Sayman O. Composites: Part B 2012, 43, 204–209.10.1016/j.compositesb.2011.08.006Search in Google Scholar
©2014 by Walter de Gruyter Berlin Boston
This article is distributed under the terms of the Creative Commons Attribution Non-Commercial License, which permits unrestricted non-commercial use, distribution, and reproduction in any medium, provided the original work is properly cited.
Articles in the same Issue
- Frontmatter
- Original articles
- Microstructures and physical properties of laser amorphous reinforced composite coatings
- The thermal resistance, flame retardance, and smoke control mechanism of nano MH/GF/NBR composite material
- The effect of sodium hydroxide treatment and fiber length on the tensile property of coir fiber-reinforced epoxy composites
- Evaluation of morphological characteristics and mechanical performance of Rockforce mineral fiber- and glass fiber-reinforced polyamide-6 composites
- Synthesis of superabsorbent resin with the properties of temperature tolerant, salt tolerant, and water absorbency deferred
- A study on tribological characterization of Al-Cu-Mg-B composites subjected to mechanical wear
- Microstructure and wear behavior of TiAl3 matrix self-lubricating composites by addition of fluoride solid lubricants
- Mechanical properties of Ni-nano-Al2O3 composite coatings on AISI 304 stainless steel by pulsed electrodeposition
- Improvement of Khorasan mortar with fly ash for restoration of historical buildings
- Combined effect of waste colemanite and silica fume on properties of cement mortar
- Effect of heat treatment temperature on ground pumice activation in geopolymer composites
- Stress intensity factor analysis of epoxy/SWCNTs based on global-local multiscale method
- Numerical elastoplastic analysis of the shear stress distribution in the adhesive layer for single-lap joints
- Analysis of three-layer composite plates with a new higher-order layerwise formulation
- Ceramic-polytetrafluoroethylene composite material-based miniaturized split-ring patch antenna
- Prediction of the influence of processing parameters on synthesis of Al2024-B4C composite powders in a planetary mill using an artificial neural network
- Different method to make laminates by shear thickening fluid
- Thermal control design for an automated fiber placement machine
- Estimate of cutting forces and surface roughness in end milling of glass fiber reinforced plastic composites using fuzzy logic system
- Electrical discharge machining of Al-TiB2 with a low-frequency vibrating tool
- Vibration behavior of a radially functionally graded annular disc with variable geometry
- Buckling behaviors of the impacted composite plates