Geopolymer ferrocement panels under flexural loading
-
Mohana Rajendran
 and
Nagan Soundarapandian
and
Nagan Soundarapandian

Abstract
Efforts are needed to develop innovative and environmental friendly materials in order to reduce greenhouse gas emissions. An experimental investigation on the flexural behavior of thin cementless composite panels reinforced with welded rectangular wire mesh and chicken mesh with varying number of mesh layers as well as varying concentration of alkaline solution is presented. A total of 30 panels have been tested under flexural loading. The size of the panel is 1000 mm (length)×200 mm (width)×25/35 mm (thickness). The parameters studied in this investigation include varying the concentration of NaOH (8, 10, 12, 14 m) and thickness of composite panels. In this work, cement is replaced by geopolymer mix to bind the ferrocement skeletal framework and its flexural behavior is studied. It is concluded that the first crack and ultimate loads increase with the increase in the thickness of the element and the concentration of alkaline solution. From the studies, it is observed that the load-carrying capacities, energy absorption, and deformation at ultimate load are high in the case of geopolymer ferrocement element. Further, it is observed that there is reduction in crack width, and increase in number of cracks in the case of geopolymer ferrocement indicates delay in crack growth.
1 Introduction
Extensive consumption of natural sources, production of massive amounts of industrial wastes, and environmental pollution require new solutions for a more sustainable development. The use of modern-day cement contributes to 2 billion tonnes of carbon dioxide (CO2) annually into the atmosphere, which makes it the third largest man-made source of CO2. The production of cement is responsible for the production of 1 ton of CO2 per ton of cement produced, and the cement manufacturing industry is causative to contribution of 7% of global CO2 emission, which is one of the greenhouse gases that causes climate change due to global warming. Besides, production of cement is energy intensive and is only succeeding to steel and aluminum production [1]. Meanwhile, the growth of the coal-fired power plant industry produces flue gases from hydrocarbon combustion that generates extensive particulate emissions such as fly ash and bottom ash as waste products. These solid waste ashes from coal-fired boilers have previously been dumped into landfills that contribute to the subsequent environmental contamination. Hence, green demands are raised for alternative ways to utilize the ashes to mitigate further environmental pollution by copious uncontrolled disposal of the coal ashes into the landfills [2].
Although the use of portland cement is still unavoidable in the foreseeable future, many efforts are being made to reduce the use of portland cement in the concrete industry. These efforts include the utilization of supplementary cementing materials such as fly ash, silica fume, granulated furnace slag, rice husk ash, and metakaolin, and finding alternative binders to portland cement. Efforts have therefore been made to promote the use of pozzolans by complete replacement of cement that can be achieved using geopolymer technology. Recently, another form of cementitious materials using silicon and aluminum activated in a high-alkali solution was developed. This material is usually based on fly ash as a source material and is termed geopolymer or alkali-activated fly ash cement.
The term geopolymer was first applied by Davidovits [3] to alkali aluminosilicate binders formed by the alkali silicate activation of aluminosilicate materials. Geopolymers are amorphous to semicrystalline equivalents of certain zeolitic materials with excellent properties such as high fire and erosion resistance and high-strength materials. The most used alkaline activators are a mixture of sodium or potassium hydroxide (NaOH, KOH) with sodium water glass or potassium water glass. The activator solution used in this work is NaOH and sodium water glass, and the concentration of NaOH solution that can be used is in the range of 8–14 m [4–6]. In recent years, geopolymers have been extensively investigated due to their excellent characteristics including fire resistance, high compressive strength, and immobilization of hazardous, toxic, and radioactive wastes [1, 7–11]. Prefabricated floor is used in the construction industry as an alternative system to overcome the formwork problems (cost and delay in construction) in addition to getting better quality control. The prefabricated elements made of reinforced concrete are very heavy and difficult to transport, to place in position, and to construct. Alternatively, thin ferrocement panels are being used in floor construction for low-cost housing due to their low cost and good structural performance [12]. Ferrocement is suitable for low-cost roofing, precast units. and manhole covers. It is used for the construction of domes, vaults, grid surfaces, and folded plates. It can be used for making water tanks, boats, and silos. Ferrocement is the best alternative to concrete and steel. Generally, ferrocement shells range from 10 to 25 mm in thickness and the reinforcement consists of layers of steel mesh, usually with steel reinforcing bars sandwiched midway between. The resulting shell or panel of mesh is impregnated with a very rich (high ratio of cement to sand) portland cement mortar. The application of ferrocement panels/members has been found attractive due to these reasons: (i) Its basic raw materials are available in most countries; (ii) it can be fabricated into almost any shape; (iii) it is more durable than most woods and cheaper than imported steel; (iv) the skills for ferrocement construction can be easily acquired; and (v) ferrocement construction is less capital-intensive but more labor-intensive [13, 14].
Ferrocement is a type of thin-wall reinforced concrete commonly constructed of hydraulic cement mortar reinforced with closely spaced layers of continuous and relatively small size wire mesh, which may be made of metallic or other suitable materials [15]. Because ferrocement possesses certain unique properties, such as high tensile strength-to-weight ratio, superior cracking behavior, light weight, moldability to any shape, and certain advantages such as utilization of only locally available materials and semiskilled labor/workmanship, it has been considered to be an attractive material and a material of good promise and potential by the construction industry, especially in developing countries. It has wide-ranging applications, such as in the manufacture of boats and/barges; prefabricated housing units; biogas structures; silos and tanks, and recently in the repair and strengthening of structures.
Ferrocement is a highly versatile construction material and possesses high performance characteristic, especially in cracking, strength, ductility, and impact resistance, as its reinforcement is uniformly distributed in the longitudinal and transverse directions and closely spaced through the thickness of the section [16]. Because ferrocement lends itself to precasting, hence, precast ferrocement elements can be prepared to meet the strength and serviceability conditions. There is an ample scope for mass production and standardization together with economy in construction.
The objective of this work is to develop a novel low-cost composite material by geopolymer and ferrocement (FC) technology together and determine the strength of the prefabricated geopolymer ferrocement (GF) elements by varying the alkaline concentration from 8 m to 14 m. In the current scenario, new construction material and technology have to be developed to enhance easy fabrication, reducing the self-weight of material and eliminating greenhouse gas production by the cement industry. Taking this into consideration, works are done on GF elements for its strength, stability and applicability.
2 Materials and methods
2.1 Materials used
The following materials are employed in this work: ordinary portland cement (53 grade), fine aggregate (sand), pozzolan (low-calcium fly ash), alkaline activator (NaOH+sodium silicate), chicken mesh with hexagonal opening, and weld mesh with rectangular grid opening.
Ordinary Portland cement was used to produce a control mix mortar in this paper. The physical properties of the cement obtained from the tests conducted as per relevant IS 4031 (Part 4 and 5)-1988 [17] are shown in Table 1.
Physical properties of cement.
| SI no. | Physical property | Tested values | Reference code |
|---|---|---|---|
| 1 | Specific gravity | 3.15 | Le-Chatelier flask IS 1727-1967 |
| 2 | Standard consistency (%) | 32 | IS 4031-1988 part 4 |
| 3 | Setting time (min) | ||
| Initial | 45 | IS 4031-1988 part 5 | |
| Final | 255 | IS 4031-1988 part 5 | |
| 4 | Compressive strength (28 days) (MPa) | 54.5 | – |
The fine aggregate used is ordinary river sand passed through sieve no. 8 (2.36 mm) with a specific gravity of 2.72, dry density of 1.6 g/cm3, and having a fineness modulus of 2.56.
The pozzolan used here is the low-calcium fly ash of class F obtained from the Tuticorin thermal power plant. The chemical composition of the fly ash, as determined by X-ray fluorescence analysis is given in Table 2.
Chemical composition of fly ash.
| Composition | SiO2 | Al2O3 | Fe2O3 | CaO | Na2O | K2O | TiO2 | SO3 | MgO |
|---|---|---|---|---|---|---|---|---|---|
| Mass (%) | 65.43 | 20.67 | 6.18 | 1.26 | – | – | – | Trace | 0.82 |
Geopolymer is a combination of the following compounds: pozzolan (fly ash), activator solution (silicates of sodium), alkali powder (hydroxides of sodium), a high-range water-reducing lignosulfonated normal super plasticizer, and distilled water.
In this research, analytical grade NaOH in pellet form (NaOH with 98% purity) and sodium silicate solutions (14.7% Na2O, 29.4% SiO2, and 55.9% water by mass) were used as the alkaline activators. In order to avoid the effect of unknown contaminants in the mixing water, the NaOH pellets were dissolved in distilled water. The activator solution was prepared at least 1 day prior to its use. To improve the workability of fresh mortar, commercially available naphthalene-based super plasticizer was used. The constituents of geopolymer mortar are shown in Figure 1.

Composition of geopolymer mortar.
Wire woven chicken meshes (Figure 2) with a hexagonal opening of size 12 mm and wire thickness of 0.72 mm (20 gauge) are used. Machine-welded weld mesh (Figure 3) having a rectangular grid opening of size 76.2 mm×38.1 mm, with a thickness of 2.45 mm in the transverse direction and 3.45 mm in the longitudinal direction are used. Ultimate strength values of weld mesh and chicken mesh are 440 and 270 N/mm2 as per ASTM A 185 [18].
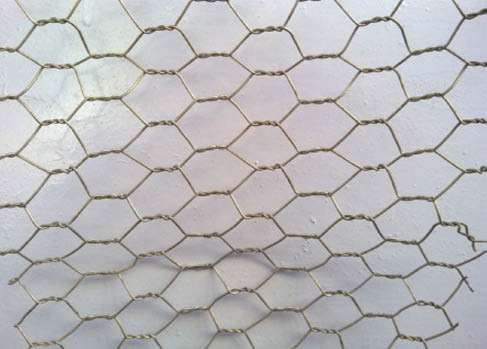
Chicken mesh.

Weld mesh.
2.2 Volume fraction of reinforcement
When the same square or rectangular wire mesh is used throughout the depth of an FC element then the volume fraction of reinforcement can be calculated from Eq. (1) [19]:
where Vr is the volume fraction of reinforcement, N is the number of layers of mesh, π=3.14, dw is the diameter of mesh wire, h is the thickness of FC element, Dl is the distance center to center between longitudinal wires, and Dt is the distance center to center between transverse wires.
For other types of mesh (hexagonal or chicken wire, expandable metal, fiber-reinforced plastic, or irregular meshes) Eq. (2) [19] is recommended to be used.
where Vr is the volume fraction of reinforcement, N is the number of layers of mesh, wr is the unit weight of reinforcing mesh, h is the thickness of FC element, and δr is the density of reinforcement material.
2.3 Method of specimen preparation
Thirty FC panels (10 series, three in each series), each of size 1000 mm×200 mm×25 mm and 35-mm thickness (Figure 4), were cast in steel molds with cement mortar (8, 10, 12, and 14 m), geopolymer mortar reinforced with four layers of chicken mesh and one layer of weld mesh, which were tied firmly together for volume fractions of 1.8% and 1.3%.

Rectangular panel mold, 25/35-mm thickness.
The molds were made in a form such that each of the four side walls and the base of the formwork were detachable so that the mold could be easily separated from the cast element after its initial setting. The contact surfaces of the steel molds to the mortar were greased before casting the specimens to ease the demolding process. A minimum cover of 5 mm on all sides was maintained when placing the reinforcement inside the mold, and a cover block was used to maintain a 5-mm cover at the base. Indelible ink markings were made on the inside of the formwork and on all its sides to indicate levels of different volume fractions and different molar concentrations during casting.
Ordinary portland cement and river sand passing through No. 8 (2.38 mm) sieve and having a fineness modulus of 2.72 were used for casting. The geopolymer mortar used in this study is composed of low-calcium fly ash and alkaline solution composed of NaOH and sodium silicate combinations. NaOH is mixed with deionized water at a required concentration and kept for at least 24 h prior to casting. All geopolymer mortar specimens were made with sand-to-geopolymer ratio in equal proportion. The hydroxide-to-silicate ratio is kept constant as 1:1 Table 3. The fly ash and fine aggregate were dry mixed together in a mixer machine for 5 min, followed by the addition of activator solution containing hydroxide and silicate to the mixture, and mixed for another 10 min. The mixing was carried out at a room temperature of approximately 25–30°C (Figure 5).
Mortar mix details.
| Specimen | Cement | 8 m | 10 m | 12 m | 14 m |
|---|---|---|---|---|---|
| No. of specimens | 3 | 3 | 3 | 3 | 3 |
| Cement (kg) | 18.94 | – | – | – | – |
| Sand (kg) | 18.94 | 18.94 | 18.94 | 18.94 | 18.94 |
| Fly ash (kg) | – | 14.15 | 14.15 | 14.15 | 14.15 |
| NaOH (kg) | – | 2.29 | 2.29 | 2.29 | 2.29 |
| Sodium silicate (kg) | – | 2.29 | 2.29 | 2.29 | 2.29 |
| Water (kg) | 5.682 | – | – | 0.14 | 0.283 |
| Super plasticizer (kg) | 0.37 | 0.14 | 0.283 | 0.35 | 0.42 |

Mixing of mortar.
Ordinary mesh obtained from the market was cut to obtain the required number of layers of desired size and orientation. The reinforcement was provided with a combination of chicken mesh and weld mesh. Chicken mesh with 12-mm hexagonal opening and gauge 20 were used. Weld mesh of rectangular opening of size 76.2 mm×38.1 mm was placed in such a way that the longer dimension was placed in the lengthwise direction of the panels. The reinforcements were tied firmly together in specified layers for various volume fractions. The geopolymer mortar was spread at the base of the mold, and on this base layer the mesh layers were laid. The molds were placed on the vibrating table and the mortar was spread evenly until the thickness of the panels was completely filled without voids (Figure 6). In each casting, three GF panels along with three mortar cubes of size 70.6 mm×70.6 mm×70.6 mm were cast to test the characteristic strength of the mortar mix (Figure 7). All these geopolymer mortars and GF specimens were heat cured for 48 h at 75°C in a heat curing chamber (Figure 8).

Specimen under table vibration.

Cube mold.

Heat-curing chamber under operation mode.
For all the FC specimens, the water-to-cement ratio of 0.3 and equal proportion of sand and cement (in order to compare with the geopolymer specimen) were taken by weight. The required amount of sand and cement was mixed dry in a mixer and then the required quantity of water and super plasticizer were added gradually while the mix was continuously stirred.
Similarly, FC panels were prepared by using cement mortar instead of geopolymer mortar in the mold. The specimens were air-dried for 24 h for initial setting and then immersed in water for curing. The specimens were removed from water after 28 days and were air-dried until the test was performed.
2.4 Testing of specimens
Two-point loading was used to conduct flexure tests. The bed of the testing machine is provided with two steel rollers on which the specimen is to be supported, and these rollers are mounted in such a way that the distance from center to center is 600 mm. The load is applied through two similar rollers mounted at the third point of the supporting span that is 200 mm center to center. The load is divided equally between the two loading rollers, and all rollers are mounted in such a manner that the load is applied axially and without subjecting the specimen to any torsional stress or restraints. For this experiment, the manual operating system was used and the readings were taken at an interval of 0.1 kN. The deflections were measured with the dial gauges having at least a count of 0.01 mm at the midsection of the element. Figure 9 shows the typical flexural test setup of GF panel. Before testing, all the elements were painted white so that the cracks could be easily observed and clearly photographed. The load was applied in a vertically upward direction by means of an electric jack. The load application was continued until the deflection became excessive (not exceeding 30 mm). The deflections were measured for each interval of load increment. On each day of testing, 70.6-mm mortar cubes of the respective mortar mix were also tested on the Universal testing machine to record the characteristic compressive strength of the specimen. The crack patterns were monitored and crack width was measured by using a microscope. The load at first crack, the maximum load, and corresponding deflections were also recorded. Table 4 shows the test results of all the tested specimens and Figure 10 shows a typical failure of a test specimen. After testing, the panels were removed from the test setup and both top and bottom sides were examined to investigate the sustained damage, such as yielding of reinforcement and cracking pattern at the bottom face.
Flexural test results of GF panels.
| Specimen ID | Vr (%) | Ductility factor μ | Stiffness (N /mm) | Energy absorption (×106 J) |
|---|---|---|---|---|
| FC25 | 1.8 | 1.5 | 617.28 | 9.48 |
| 8 m GF25 | 1.52 | 628.75 | 9.88 | |
| 10 m GF25 | 1.53 | 704.08 | 12.19 | |
| 12 m GF25 | 1.57 | 709.09 | 14.58 | |
| 14 m GF25 | 1.58 | 724.19 | 16.39 | |
| FC35 | 1.3 | 1.32 | 683.33 | 14.89 |
| 8 m GF35 | 1.36 | 712.24 | 15.76 | |
| 10 m GF35 | 1.38 | 718.51 | 17.48 | |
| 12 m GF35 | 1.40 | 780.00 | 19.67 | |
| 14 mGF35 | 1.45 | 791.26 | 22.29 |

Flexure test setup.

Typical failure of the specimen.
3 Results and discussion
The results obtained from the experimental investigations are tabulated in tables and the comparisons are presented in the form of graphs.
3.1 Compressive strength of different specimens
The testing of 70.6-mm mortar cubes of the respective mortar mix to record the characteristic compressive strength of the specimen is shown in Table 5 and Figure 11. Figure 11 illustrates the effect of NaOH concentration on the compressive strength of mortar and demonstrates that the compressive strength of geopolymer mortar increases with the increase in the concentration of NaOH. The compressive strength of geopolymer specimens increases as NaOH concentration in the aqueous phase increases from 8 m to 14 m. The NaOH concentration in the aqueous phase of the geopolymeric system acts on the dissolution process as well as on the bonding of solid particles in the final structure. The use of high concentration of NaOH leads to greater dissolution of the initial solid materials and increases geopolymerization reaction, and hence, higher compressive strength is achieved [20, 21]. The increment of sample strength is believed to be mainly due to the increase in Na ions and water molecules, which are the basic ingredients for geopolymerization that enhances the dissolution and reaction of the geopolymer mortars that eventually increases the final compressive strength. The percentage increase in compressive strength compared to the control specimen for 8, 10, 12, and 14 m geopolymer mortars is 9.015%, 36.09%, 58.95%, and 83.43%, respectively.

Compressive strength relationships.
Compressive strength.
| Sample no. | Specimen | Compressive strength (MPa) |
|---|---|---|
| 1 | Cement | 32.72 |
| 2 | 8 m | 35.67 |
| 3 | 10 m | 44.53 |
| 4 | 12 m | 52.01 |
| 5 | 14 m | 60.02 |
3.2 Load-deflection characteristics
Deflection characteristics have been considered as essential criteria in the design of FC structures by practitioners. Deflection in FC is normally caused by the magnitude of loading it carries and also due to time-dependent factors such as shrinkage and creep [22]. One of the main advantages of having meshed reinforcement in FC is that the deflections due to shrinkage are significantly reduced by the presence of uniformly distributed mesh. From Figure 12A–E, the behavior of GF panels can be characterized by three distinct stages. Stage I can be designated as precracking of the specimen, wherein all the materials are elastic and the load-deflection curve is linear with the applied load. In this stage, the load is carried by the geopolymer matrix. Cracking load can be predicted by using the linear elastic theory. Stage II can be designated as multiple cracking of the specimen wherein more cracks occur after cracking of the geopolymer matrix. During this stage, a transfer of load from mortar to the wire mesh takes place. The wire mesh elongates under additional load, transferring the load back to the mortar matrix, forming new cracks. The final stage is named as failure of the specimen wherein there is widening of existing cracks with the increase of load. In this stage, the load is predominantly carried by the mesh. The specimen undergoes more deflection, and cracks can extend deep through the depth of the geopolymer matrix, reaching the top surface of the specimen.

Load vs. mid-span deflection curve of (A) FC panels, (B) 8 m GF panels, (C) 10 m GF panels, (D) 12 m GF panels, and (E) 14 m GF panels.
3.2.1 Displacement ductility
The ability of a member to deform without a significant loss of its strength is known as ductility. One of the methods of quantifying ductility is by using the ductility factor (displacement ductility index) as defined by the ratio of ultimate deflection to the deflection at yielding of tensile reinforcement. The percentage increase in ductility factor compared to control specimen for 25-mm thickness, 8, 10, 12, and 14 m GF specimens is 1.3%, 2%, 4.67%, 5.33% and 3.03%, 4.5%, 6.06%, 9.8% for 35-mm thick 8, 10, 12, and 14 GF specimens, respectively. The ductility of GF specimen increases with increase in thickness of the specimens and molarity of NaOH.
3.2.2 Energy absorption capacity
The percentage increase in energy absorption compared to control specimen for 25-mm thickness 8, 10, 12, and 14 m GF specimens is 4.22%, 28.58%, 53.79%, 72.89% and 6.83%, 28.80%, 41.55%, 64.80% for 35-mm thickness 8, 10, 12, and 14 m GF specimens, respectively.
3.2.3 Stiffness
The percentage increase in stiffness compared to control specimen for 25-mm thickness 8, 10, 12, and 14 m GF specimens is 1.85%, 14.06%, 14.7%, 17.28% and 4.23%, 5.14%,14.14%, 15.79% for 35-mm thickness 8, 10, 12, and 14 m GF specimens, respectively.
3.3 Cracking behavior
The failure of specimens results from the yielding of wire mesh reinforcement followed by the crushing of mortar. Initially, fine flexural cracks appeared at the bottom of the specimen. With further increase in the load, regularly spaced vertical cracks were observed, and they extended from the bottom of the specimen toward the top. The load was increased up to the ultimate stage and cracking pattern is observed. It was observed that the number of cracks formed in all specimens depended on the volume fraction of reinforcement. Also from the observations it is understood that a higher volume fraction of reinforcement provides a better crack control mechanism by the formation of a large number of well-distributed cracks. Table 6 presents the details of measured average crack width, number of cracks, and average crack spacing.
Cracking behavior.
| Specimen ID | Vr (%) | Average crack width (mm) | Average crack spacing (mm) | Number of cracks |
|---|---|---|---|---|
| FC25 | 1.8 | 0.33 | 41.45 | 3 |
| 8 m GF25 | 0.31 | 39.89 | 3 | |
| 10 m GF25 | 0.30 | 28.32 | 4 | |
| 12 m GF25 | 0.28 | 25.6 | 4 | |
| 14 m GF25 | 0.25 | 22.87 | 6 | |
| FC35 | 1.3 | 0.28 | 22.0 | 5 |
| 8 m GF35 | 0.25 | 20.8 | 4 | |
| 10 m GF35 | 0.23 | 19.2 | 6 | |
| 12 m GF35 | 0.2 | 18.17 | 8 | |
| 14 m GF35 | 0.18 | 16.93 | 9 |
3.3.1 Crack width
The variation of average crack width with various molar concentrations and thickness of the specimens is shown in Table 6. Average crack width is primarily a function of tensile strain in the extreme layer of mesh and it is found to decrease with an increase in the molar concentration of NaOH and thickness of the specimens. Lowest maximum crack width is observed in the case of 14 m GF panels. The above phenomenon is due to the role of the mesh in holding the matrix together and offering resistance for widening of the crack in the matrix. In the GF panels, spacing of tensile cracks was observed to be closer and crack width smaller, which indicates that the crack-arresting mechanism is better and distributed through the entire thickness than the FC panels.
3.3.2 Crack spacing
The highest number of cracks developed at failure was observed for 14 m GF panels followed by 12 m GF, 10 m GF, 8 m GF, and FC. Due to the large number of cracks developed, GF panels of 14 m GF exhibited the lowest magnitude of average crack spacing followed by a test panel 12 m GF, 10 m GF, 8 m GF, and FC (Table 6). This indicated that the bond strength and the degree of interaction between the steel reinforcements and the mortar matrix are the highest for test panel 14 m GF followed by 12 m GF, 10 m GF, 8 m GF, and FC. The high bond strength of 14 m GF, 12 m GF, 10 m GF, and 8 m GF as compared to control FC panels can be attributed to the high compressive strength and flexural strength of the mortar mixes. The high bond strength of steel reinforcements in mortar matrices 14, 12, 10, and 8 m enabled the transfer of the tensile stress induced at the mid-span to a larger extent of the adjacent mortar matrices. Therefore, a higher number of cracks with smaller widths and crack spacing were formed on the test panels [23].
3.3.3 Crack pattern of GF panels and failure mode
Failures of tested GF panels were observed to occur when the extreme layer of steel mesh failed under tensile stress. No spalling of the mortar matrix was observed for any tested GF panels. A major continuous crack joining the bottom and top fibers was observed to be present on all tested panels. From Figure 13A, large numbers of closely spaced cracks were observed to be developed on test panels 12 m GF. Meanwhile, the relatively smaller number of cracks with larger intercrack spacings were detected on FC panels (Figure 13B). Only flexural cracks were observed on all tested GF and FC panels at ultimate failure. Hence, it can be concluded that all the tested panels failed in pure bending.

Cracking behavior of (A) 35-mm-thick 12 m GF panels and (B) 35-mm-thick FC panels with five layers of wire mesh.
4 Conclusions
This work represents the results of a research study on the effect of using geopolymer as a substitute for ordinary portland cement in FC panels. Geopolymer specimens are tested for compressive strength, load deflection, cracking behavior for different molar concentrations, and different thicknesses, and the following conclusions are arrived at.
The initial cracking load and ultimate load of the specimens in flexural testing increase with increasing molarity.
The cracking behavior of the various specimen shows that the cracking region and the cracking space are less in the geopolymer specimens and large number of cracks compared with the control specimens.
Compared with the control specimen, the compressive strength of the geopolymer specimens also increases with increase in the molarity of the NaOH solution.
The percentage increase in compressive strength compared to control cement mortar specimen for 8, 10, 12, and 14 m geopolymer mortars is 9.015%, 36.09%, 58.95%, and 83.43%, respectively.
Increase in the thickness and molarity concentration in the GF panels increased the load-carrying capacity, ductility, energy absorption, and stiffness of the element and decreased the crack width and crack spacing.
All the tested panels failed in pure bending.
The percentage increase in stiffness compared to control specimen for 25-mm thickness 8, 10, 12, and 14 m GF specimens are 1.85%,14.06%,14.7%,17.28% and 4.23%, 5.14%, 14.14%, 15.79% for 35-mm thickness 8, 10, 12, and 14 m GF specimens, respectively.
The percentage increase in ductility factor compared to control specimen for 25-mm thickness 8, 10, 12, and 14 m GF specimens is 1.3%, 2%, 4.67%, 5.33% and 3.03%, 4.5%, 6.06%, 9.8% for 35-mm thickness 8, 10, 12, and 14 m GF specimens, respectively.
The percentage increase in energy absorption compared to control specimen for 25-mm thickness 8, 10, 12, and 14 m GF specimens is 4.22%, 28.58%, 53.79%, 72.89% and 6.83%, 28.80%, 41.55%, 64.80% for 35-mm thickness 8, 10, 12, and 14 m GF specimens, respectively.
Acknowledgments
The authors express their gratitude to the management of Thiagarajar College of Engineering and to the department for facilitating this work.
References
[1] Hardjito D, Cheak CC, Lee ICH. Mod. Appl. Sci. 2008, 2, 3–11.Search in Google Scholar
[2] Malhotra VM. ACI Concr. Int. 2002, 24, 22.Search in Google Scholar
[3] Davidovits J. World Resour. Rev. 1994, 6, 263–278.Search in Google Scholar
[4] Hardjito D, Wallah SE, Sumajouw DMJ, Rangan BV. ACI Mater. J. 2004, 10, 467–472.Search in Google Scholar
[5] Chindaprasirt P, Chareerat T, Hatanaka S, Cao T. J. Mater. Civ. Eng. 2011, 23, 264–270.Search in Google Scholar
[6] Sathonsaowaphak A, Chindaprasit P, Pimraksa K. J. Hazard. Mater. 2009, 168, 44–50.Search in Google Scholar
[7] Comrie DC, Kriven WM. Ceram. Trans. 2003, 153, 211–225.Search in Google Scholar
[8] Davidovits J. J. Therm. Anal. 1991, 37, 1633–1656.Search in Google Scholar
[9] Chindaprasit P, Jaturapitakkul C, Rattanasak U, Chalee W. Waste Management 2009, 29, 539–543.10.1016/j.wasman.2008.06.023Search in Google Scholar PubMed
[10] Yousef RI, El-Eswed B, Alshaaer M, Khalili F, Khoury H. J. Hazard. Mater. 2009, 165, 379–387.Search in Google Scholar
[11] Zhang YJ, Li S, Xu DL, Wang BQ, Xu GM, Yang DF, Wang N, Liu HC, Wang YC. J. Mater. Sci. 2009, 45, 1189–1192.Search in Google Scholar
[12] Prakhya KVG, Rahul T, Adidam SR. J. Ferrocement 1988, 18, 405–411.Search in Google Scholar
[13] Chandrasekhar Rao T, Gunneswara Rao TD, Ramana Rao NV. Int. J. Mech. Solids 2008, 3, 195–203.Search in Google Scholar
[14] Abdullah, Takiguchi K, Nishimura K, Hori S. Transactions of the 17th Conference on Structural Mechanics in Reactor Technology (SMIRT), Prague, Czech Republic, August 17–22, 2003, pp. 4–7.Search in Google Scholar
[15] ACI Committee 549R-97, State-of-the art report on ferrocement, AC1 Committee 549.Search in Google Scholar
[16] Thanoon WA, Yardim Y, Jaafar MS, Noorzaei J. Constr. Build. Mater. 2010, 24, 2224–2230.Search in Google Scholar
[17] IS 4031 (Part 4 and 5)-1988. Methods of physical test for hydraulic cement. Bureau of Indian Standards (BIS): New Delhi, 1988.Search in Google Scholar
[18] ASTM A185. Standard specification for steel welded wire fabric, plain for concrete reinforcement. ASTM International: PA, USA, 2007.Search in Google Scholar
[19] Ferrocement Model Code, reported by Internal Ferrocement Society (IFS) Committee 10, published by Asian Institute of Technology (AIT), International Ferrocement Information Centre (IFIC): Bangkok, Thailand, 2001.Search in Google Scholar
[20] Panias D, Giannopoulou IP, Perraki T. Colloids Surf. A: Physicochemical and Engineering Aspects 2007, 301, 246–254.10.1016/j.colsurfa.2006.12.064Search in Google Scholar
[21] Temuujin J, Williams RP, van Riessen A. J. Mater. Process. Technol. 2009, 209, 5276–5280.Search in Google Scholar
[22] Ramli M, Tabassi AA. Composites Part B 2012, 43, 447–456.10.1016/j.compositesb.2011.11.058Search in Google Scholar
[23] Shannag MJ, Ziyyad T. Constr. Build. Mater. 2007, 21, 1198–1205.Search in Google Scholar
©2015 by De Gruyter
This article is distributed under the terms of the Creative Commons Attribution Non-Commercial License, which permits unrestricted non-commercial use, distribution, and reproduction in any medium, provided the original work is properly cited.
Articles in the same Issue
- Frontmatter
- Original articles
- Dielectric behaviors of carbon nanotube/silicone elastomer composites
- Investigation of damping and toughness properties of epoxy-based nanocomposite using different reinforcement mechanisms: polymeric alloying, nanofiber, nanolayered, and nanoparticulate materials
- Dielectric properties of various polymers (PVC, EVA, HDPE, and PP) reinforced with ground tire rubber (GTR)
- Research on vacuum brazing of W-Cu composite to stainless steel with Cu-Mn-Co brazing metal
- Production and wear property of electroless Ni-plated B4C-AstaloyCr-M composites
- Compressibility and solid-state sintering behavior of W-Cu composite powders
- Assessment of nano-TiO2 and class F fly ash effects on flexural fracture and microstructure of binary blended concrete
- Use of glass waste as mineral filler in hot mix asphalt
- Effect of latex powder and glass fibers on the performance of glazed hollow bead thermal insulation materials
- Experimental and finite element studies on buckling of skew plates under uniaxial compression
- Analytical and experimental investigation of tensile properties of cross-ply and angle-ply GFRP composite laminates
- Modeling of tensile and bending properties of biaxial weft knitted composites
- Research on design rules for composite laminate
- Individual humeral head replacement by C/C composite implants coated with hydroxyapatite via rotation plasma spraying
- Geopolymer ferrocement panels under flexural loading