What I Like! The Joint Impact of Attitude, Perceived Quality, and Experience on Brand Loyalty: Semi-Parametric Additive Mixed Modeling
-
T. Tim A. Höfling
 ,
Nadine Walter
,
Nadine Walter


Abstract
Several psychological brand performance indicators that predict a brand’s intermediate market share have been identified. So far, rating studies have exclusively investigated brand effects in terms of linear relationships, and their specific and possibly nonlinear interactions have yet to be examined in comparison. Hence, we investigated the relative importance of three well-established psychological performance indicators, attitude toward the brand, perceived quality, and brand experience, in predicting brand loyalty. A sample of 1,077 participants completed an online survey and rated subsets of 105 international brands from various product and service industries. Relations between attitude, perceived quality, and experience in predicting loyalty toward a brand were analyzed using semi-parametric additive mixed regression models. We replicated that all three predictors significantly impacted brand loyalty and revealed a pronounced nonlinear relationship between attitude and loyalty. The inclusion of nonlinear interactions between predictors improved model fit. In particular, the nonlinear interaction between perceived quality and attitude substantially impacted brand loyalty. In addition, these effects differ by type of industry, specifically fast-moving consumer goods, automotive, fashion, electronics, and finance/insurance. These findings draw attention to nonlinear patterns between specific psychological features of brands. Future research should address nonlinear effects and the specific interactions of other essential predictors of brand equity.
1 Introduction
Brands guide consumers’ decision-making and purchase behaviors as they stand symbolically for prior experiences with products or services of a particular brand (Achar et al. 2016; Mostafa and Kasamani 2020; Plassmann, Ramsøy, and Milosavljevic 2012). Accordingly, brands may help consumers efficiently recognize the manufacturer of a product, minimize risks of wrongly spending money, signal social group membership, and forecast the quality of a product (Keller 2003b). When evaluating brands, individuals use cognitive resources to process information, compare options, and judge the brand’s quality, reliability, and alignment with their values. This evaluation often involves recalling past experiences, analyzing marketing communication, and considering social influences, all of which require mental effort (Guo and Zhang 2020). The complexity of the decision, the number of choices available, and the level of personal involvement can increase the cognitive load (Wu, Shah, and Kardes 2020). As a result, individuals may rely on heuristics or mental shortcuts to conserve cognitive resources, such as choosing familiar brands or those with strong reputations, to simplify the decision-making process (Pohl et al. 2013). Hence, consumers’ knowledge about a brand and associated emotions help consumers make efficient decisions while saving resources. Furthermore, consumers’ expectations about a particular brand have a substantial psychological impact as they modulate consumption pleasure and trigger specific brand associations (McClure et al. 2004; Pina and Dias 2021; Shiv, Carmon, and Ariely 2005). Psychological assessments are essential indicators of a brand’s psychological equity related to an enterprise’s intermediate market share. While many aspects substantially impact psychological brand equity and brand value (Keller 2003a), research on the relative importance of different dimensions in increasing brand value is rare. Typically, linear relationships are assumed between predictors and explananda while utilizing only a small set of brand stimuli.
In the present study, we aim to compare the relative impact of three established brand performance indicators, i.e. attitude toward the brand, perceived quality of the brand, and brand experience, to predict a consumer’s loyalty toward a brand. Most importantly, we aim to explore potentially nonlinear relations among these predictors, including main and interaction effects. To increase the generalizability of the results and the ecological validity of the study, we collected data on a large set of international brands from a broad array of product or service industries through an online questionnaire. Correspondingly, the impact of the three brand dimensions (i.e. attitude towards the brand, perceived quality, brand experience) on brand loyalty is compared between five industries (i.e. fast-moving consumer goods, automotive, fashion and lifestyle, electronics, and finance/insurance), since previous studies have provided preliminary evidence that the specific relationship patterns between these brand performance indicators can vary by industry (Albaity and Rahman 2021; Erjavec, Dmitrović, and PovalejBržan 2016; Rafiq, Hussain, and Hussain 2020).
1.1 Relevant Brand Concepts
Consumer-based brand equity is conceptualized as multifaceted knowledge of a brand, which is the backbone of building strong brands and is a precursor of high customer loyalty and price premiums (He 2022; Keller 2003b; Oliveira et al. 2023). Traditional approaches to measuring brand equity focus on the consumer’s subjective evaluation of the brand (Keller 1993) and operationalize the brand knowledge based on multidimensional brand associations (Çifci et al. 2016; Cobb-Walgren, Ruble, and Donthu 1995; Heitmann et al. 2020; Hyun, Park, and Hong 2024; Sankaran and Chakraborty 2023; Tong and Hawley 2009; Washburn and Plank 2002; Yoo and Donthu 2001). Tasci (2021) reported in a meta-analysis with over 200 empirical brand equity studies that over 40 components were investigated in the past. Brand quality, as well as brand associations and brand image, cover the main components of brand research. In addition to the perceived quality of a brand, we utilized a global (brand attitude) and a differentiated (brand experience) operationalization to account for different aspects of the consumer’s brand associations. Furthermore, previous studies often used attitude toward a brand, perceived quality, and brand experience (i.e. affective, sensory, cognitive, and behavioral experiences) to forecast relevant outcome variables (Buil, Martínez, and de Chernatony 2013; Çifci et al. 2016; Hyun, Park, and Hong 2024; Pappu, Quester, and Cooksey 2005; Rodrigues and Martins 2016; Washburn and Plank 2002; Yoo and Donthu 2001). Hence, we used these established dimensions to predict loyalty toward familiar brands and explicitly modulated potentially nonlinear and industry-specific effects.
1.1.1 Brand Loyalty as Explanandum
Brand loyalty emphasizes the behavioral aspect as a commitment to consistently rebuy products or services of a specific brand in the future (Oliver 1999). According to this definition, brand loyalty has been measured by indicators such as repeat purchase frequency or relative volume of same-brand purchasing (Dawes, Graham, and Trinh 2021; Tasci 2021). Such behavioral loyalty can be approximated from an attitudinal perspective because a favorable attitude is required to achieve behavioral loyalty (Dandis and Al Haj Eid 2021; Day 1969; Dick and Basu 1994). Otherwise, the repurchase of a product is considered spurious loyalty since the repurchase might be only based on a convenient factor (e.g., availability of the product) but not on proper preference compared to competitors’ products (Tseng, Liao, and Jan 2004; Zhang and Zhang 2021). Accordingly, brand loyalty is conceptualized as repeat purchases under high involvement (Dawes, Graham, and Trinh 2021; Møller Jensen and Hansen 2006), and the relationship between the brand and the customer needs to be long-term (Omoregie et al. 2019). Hence, to classify true brand loyalty, attitudinal loyalty must exist, including a dispositional commitment toward the brand (Chaudhuri and Holbrook 2001), which served as an explanandum in the present study. There is also preliminary evidence that brand loyalty’s impact can vary between service industries (Erjavec, Dmitrović, and PovalejBržan 2016).
1.1.2 Brand Attitude as Explanans
Brand attitudes are defined as the consumer’s overall brand evaluation (Jiang, Ge, and Yao 2024; Keller 2003a; Mitchell and Olson 1981; Spears and Singh 2004). Brand attitudes have a strong history in branding and consumer behavior literature. Attitudes are a temporary evaluation at the moment of judgment (Feldman and Lynch 1988; He 2022) based on an emotional process (Ito and Cacioppo 2001). An affective and temporary attitude formation also seems more plausible for brands since consumers tend to avoid cognitive efforts (e.g., lack of ability and motivation), and contextual-driven factors (e.g., consumers’ goals and presentation characteristics) seem to play a significant role in the buying process (Argyriou and Melewar 2011).
When consumers come to an overall evaluation of a brand and form a favorable attitude toward it, it is likely that this also leads to an increase in attitudinal loyalty (Dandis and Al Haj Eid 2021; Keller 1993; Oliver 1999). Highly loyal consumers are also consistently more favorable in their attitudes toward the brand, demonstrating the interdependence between brand loyalty and attitude toward the brand (Hussain et al. 2024; Rubinson and Baldinger 1996). The direct impact of brand attitude on loyalty has been confirmed for two grocery products (i.e. shampoo and sweeteners (Chaudhuri 1999)). In addition, there is evidence that brand attitude positively influences brand loyalty in the fast-moving consumer goods industry (Rafiq, Hussain, and Hussain 2020; Rajumesh 2014). Correspondingly, a significant and robust positive relationship exists between brand attitude and brand loyalty in the cell phone industry (Kruger et al. 2013). Also, for finance (Albaity and Rahman 2021) and luxury fashion brands (Liu et al. 2012), the attitude has a crucial positive impact on loyal customers’ behavior. In summary, there is converging evidence of a positive relationship between brand attitude and brand loyalty, particularly for industries such as fast-moving consumer goods, electronics, and fashion.
1.1.3 Perceived Quality as Explanans
Perceived quality results from comparing consumer expectations with the actual performance of a product or service (Snoj, Pisnik Korda, and Mumel 2004; Tian et al. 2023). It is defined as the customer’s judgment of the superiority or excellence of a brand (Zeithaml 1988). Notably, perceived quality differs from actual quality. The actual quality is based on a measurable and verifiable supremacy of a specific feature or functionality of the product or service and can be compared to a predefined standard. Hence, it is evaluated using overall product benefit, function, durability, technology, and reliability (Garvin 1983; Munten and Vanhamme 2023). Perceived quality, in contrast, is the subjective reaction of consumers to products and is, therefore, a relativistic assessment that differs between individuals (Holbrook and Corfman 1985). It is primarily based on people’s expectations and their pre-knowledge. It is dissociable from the actual quality (Chi, Yeh, and Yang 2009; Tian et al. 2023): Consumers may lack sufficient information, time, or motivation to evaluate a product objectively, and hence, perceived quality is influenced not only by product-related factors but also by situational factors such as the purchase situation and time pressure or by individual attributes such as the educational level and personal risk-taking preference (Chi, Yeh, and Yang 2009).
The perceived quality of a brand is a consumer’s subjective judgment, and the consumer evaluates product or service quality from their previous experiences. Hence, perceived quality is considered a key predictor of brand loyalty (Darsono and Junaedi 2006). Customers form opinions about superiority or excellence by comparing actual performance with expected performance. Consumers form a preference and commitment toward the brand when this judgment results in a positive evaluation (Akoglu and Özbek 2022; Szymanski and Henard 2001). Some researchers see customer satisfaction as a mediator in the quality-loyalty relationship (Darsono and Junaedi 2006; Olsen 2002). At the same time, various authors also confirm a direct link between perceived quality and loyalty, for example, for photography services (Dabholkar, Shepherd, and Thorpe 2000) and the fashion industry (Erdoğmuş and Büdeyri-Turan 2012; Hyun, Park, and Hong 2024; Vazifehdoost and Negahdari 2018). Furthermore, a high perceived quality, especially service quality, enhances customer loyalty in the finance industry (Omoregie et al. 2019; Prasadh 2018). Apparently, in the latter sector, the effect of perceived quality is even higher on loyalty compared to satisfaction (Prasadh 2018). Lastly, customer loyalty is indirectly influenced by perceived quality in the electronics industry, as customer trust plays a significant mediating role (Marakanon and Panjakajornsak 2017). In summary, there is converging evidence of a positive relationship between perceived brand quality and brand loyalty, particularly in the finance, electronics, and fashion industries.
1.1.4 Brand Experience as Explanans
Brand experience conceptualizes consumption patterns that depend on multi-sensory and emotional aspects (Chieng et al. 2022; Hirschman and Holbrook 1982), accounting for the fact that decision-making relies on emotional aspects apart from strictly rational reasoning in general (Slovic et al. 2007) and specifically in consumer decisions (Bapat 2017; Chieng et al. 2022). Accordingly, experience marketing acknowledges that consumers are emotionally driven and aim to achieve sensual and pleasurable experiences through consumption (Cleff, Lin, and Walter 2014). Since products and services are becoming increasingly commoditized, the customer experiences created by brands matter strongly to the consumer (Pine and Gilmore 1998). Hence, brand experience is a multi-componential construct including internal consumer processes (i.e. sensations, feelings, and cognitions) and behavioral aspects elicited by brand-related stimuli like product design, packaging, and marketing communications such as advertisement (Hussain et al. 2024). Experiences also happen when consumers consume, search, and shop for products or services (Jung and Soo 2012; Massi, Piancatelli, and Vocino 2023). Brand experience is believed to have a more significant impact on shaping customer preferences than the attributes of a product or service (Lee, Hsiao, and Yang 2011; Zaltman 2003).
Brand experience that engages the customer’s senses and emotions can create a connection to the brand, leading to improved brand commitment, trust, and satisfaction, and, as a consequence, this leads to increased brand loyalty (Brakus, Schmitt, and Zarantonello 2009; Chattopadhyay and Laborie 2005; Choi, Ok, and Hyun 2017; Ding and Tseng 2015; Huang 2017; Hussain et al. 2024; Iglesias, Singh, and Batista-Foguet 2011; Jung and Soo 2012; Mostafa and Kasamani 2020; Nysveen and Pedersen 2014; Pina and Dias 2021; Ramaseshan and Stein 2014). This connection is validated in several product and service industries: Brand experience has a positive impact on brand satisfaction, trust, and loyalty for automotive brands (Sahin, Zehir, and Kitapçı 2011; Saragih et al. 2019). Brand experiences directly affect brand prestige, influencing attitudinal loyalty for coffeehouse customers (Choi, Ok, and Hyun 2017). It also impacts brand loyalty mediated by brand trust (Huang 2017) and brand commitment (Jung and Soo 2012). A recent study on the electronics industry, especially smartphones, confirms that brand experience positively affects brand loyalty (Mostafa and Kasamani 2020). Likewise, a positive relationship between brand experience and brand loyalty is found in the fashion and finance industries (Wulandari 2016). In summary, there is converging evidence of a positive relationship between brand experience and brand loyalty, particularly for automotive, electronics, fashion, and fast-moving consumer goods industries.
1.2 Overview and Aims
Psychological brand equity can be conceptualized as multifaceted knowledge of a brand and is thought to be the foundation for building and thriving strong brands. Specifically, there is converging evidence that perceived quality, attitude toward, and experience with the brand positively correlate with customers’ brand loyalty. However, the current scientific understanding of these relationships is limited due to two aspects: Existing literature exclusively assumed linear and non-interactive relationships between these predictors. Hence, it is unclear if attitude toward the brand, perceived quality of a brand, and brand experience show nonlinear and possibly interactive relations with brand loyalty. Furthermore, since most of the previous brand studies examined only a small number of brands and industries, the findings’ generalizability and ecological validity are limited due to the actual complexity of the real market and the relevance of dynamics between industries.
Accordingly, we aim to estimate the relative importance, linearity, and interaction of these predictors on brand loyalty. Hence, we compare main effect models, all two-way and the three-way interaction effects, to determine the best fitting predictive model for brand loyalty. We use semi-parametric additive mixed modeling as it allows both linear and possible nonlinear effects and determines nonlinearities within the main- and interaction effects between the three predictors and the loyalty toward a brand (Wood 2006; Wood, Scheipl, and Faraway 2013; Wood and Scheipl 2020). Furthermore, we investigate 105 brands from various product and service industries and report industry-specific effects for fast-moving consumer goods, automotive, fashion, electronics, and finance. To control for potentially interfering and confounding effects of relevant covariates, we additionally controlled our models for the impact of general brand involvement and gender*brand interactions. This is the first study that accounts for nonlinear and interaction effects in brand research in various industries.
2 Methods
2.1 Participants, Stimuli, and Study Design
A convenient sample of 1,077 German-speaking volunteers participated anonymously in the online survey (282 males). Age of the participants varied between 18 and 75 years (M = 27.3, SD = 9.3). 5 % of the participants were excluded a priori from analysis due to bad quality indices provided by the survey platform (e.g., high-speed and invariant answering behavior). At the beginning of the study, participants filled in a sociodemographic questionnaire including age and gender and rated their general brand involvement (Walsh, Mitchell, and Hennig-Thurau 2001). Afterward, each participant was shown a random subsample of eight brands assessed on various psychometrical scales (see Assessments and Measures). The brand logos of 105 internationally high-performing brands served as brand stimuli (Table 1). This set of brands covers a wide variety of service and product branches like fast-moving consumer goods (25 %), automotive (14 %), fashion and lifestyle (14 %), electronics (11 %), as well as finance and insurance (11 %). Each brand was presented to 81.7 participants on average. Participants needed approximately 15 min to complete the survey. Data for the study are permanently stored at https://osf.io/7ea85/?view_only=25c7083a1c804d87a7f0318cb56e90cf.
Overview of the brands included in the study and the frequency of participants who rated a brand and were familiar with a brand.
| Brand | Presented | Familiar | % | Brand | Presented | Familiar | % |
|---|---|---|---|---|---|---|---|
| Adidas | 84 | 84 | 100 % | Hyundai | 83 | 71 | 85.5 % |
| Coca Cola | 80 | 80 | 100 % | Zara | 87 | 74 | 85.1 % |
| H&M | 79 | 79 | 100 % | Heineken | 76 | 64 | 84.2 % |
| IKEA | 77 | 77 | 100 % | Panasonic | 80 | 67 | 83.8 % |
| McDonalds | 88 | 88 | 100 % | MTV | 73 | 61 | 83.6 % |
| Nike | 84 | 84 | 100 % | Nescafe | 64 | 53 | 82.9 % |
| Pepsi | 77 | 77 | 100 % | Intel | 71 | 58 | 81.7 % |
| Lego | 100 | 99 | 99.0 % | Visa Card | 82 | 67 | 81.7 % |
| BMW | 84 | 83 | 98.8 % | Prada | 78 | 63 | 80.8 % |
| VW | 84 | 83 | 98.8 % | Philips | 89 | 71 | 79.8 % |
| Disney | 79 | 78 | 98.7 % | Mastercard | 74 | 59 | 79.7 % |
| Ebay | 75 | 74 | 98.7 % | Kia | 85 | 66 | 77.6 % |
| Apple | 74 | 73 | 98.6 % | UPS | 93 | 72 | 77.4 % |
| 74 | 73 | 98.6 % | Harley Davidson | 82 | 60 | 73.2 % | |
| Langnese | 74 | 73 | 98.6 % | Huawai | 93 | 67 | 72.0 % |
| Mercedes Benz | 82 | 80 | 97.6 % | Smirnoff Vodka | 76 | 54 | 71.7 % |
| Samsung | 84 | 82 | 97.6 % | AXA | 67 | 47 | 70.1 % |
| Microsoft | 73 | 71 | 97.3 % | IBM | 84 | 58 | 69.0 % |
| 95 | 92 | 96.8 % | Ralph Lauren | 66 | 45 | 68.2 % | |
| Marlboro | 91 | 88 | 96.7 % | Landrover | 65 | 44 | 67.7 % |
| Porsche | 79 | 76 | 96.2 % | Budwiser | 84 | 52 | 61.9 % |
| DHL | 74 | 71 | 95.9 % | FedEx | 87 | 52 | 59.8 % |
| Pampers | 90 | 86 | 95.6 % | SAP | 72 | 43 | 59.7 % |
| Canon | 88 | 84 | 95.5 % | KFC | 86 | 49 | 57.0 % |
| Gilette | 85 | 81 | 95.3 % | American Express | 95 | 54 | 56.8 % |
| Sprite | 83 | 79 | 95.2 % | Moet | 81 | 46 | 56.8 % |
| Nestle | 80 | 76 | 95.0 % | Burberry | 67 | 38 | 56.7 % |
| Nissan | 78 | 74 | 94.9 % | Tesla | 70 | 38 | 54.3 % |
| Amazon | 78 | 74 | 94.5 % | Lenovo | 75 | 37 | 49.3 % |
| Paypal | 88 | 83 | 94.3 % | Tiffany | 80 | 37 | 46.3 % |
| Siemens | 95 | 89 | 93.7 % | John Deere | 79 | 36 | 45.6 % |
| Starbucks | 79 | 74 | 93.7 % | Hermes | 86 | 37 | 43.0 % |
| Ford | 94 | 88 | 93.6 % | Cartier | 77 | 33 | 42.9 % |
| L’Oreal | 91 | 85 | 93.4 % | Santander Bank | 91 | 39 | 42.9 % |
| Kellogs | 85 | 79 | 92.9 % | Corona | 84 | 35 | 41.7 % |
| Toyota | 85 | 79 | 92.9 % | HP Enterprise | 86 | 31 | 36.0 % |
| Sony | 81 | 75 | 92.6 % | Goldman Sachs | 80 | 27 | 33.8 % |
| Colgate | 79 | 73 | 92.4 % | Caterpillar | 88 | 29 | 33.0 % |
| Audi | 90 | 83 | 92.2 % | Johnnie Walker | 87 | 27 | 31.0 % |
| Shell | 71 | 64 | 90.1 % | HSBC | 99 | 28 | 28.3 % |
| Nintendo | 84 | 75 | 89.3 % | Johnson & Johnson | 72 | 20 | 27.8 % |
| Allianz | 79 | 70 | 88.6 % | Oracle | 74 | 18 | 24.3 % |
| Jack Daniels | 77 | 68 | 88.3 % | Discovery Chanel | 68 | 15 | 22.1 % |
| Victoria’s Secret | 76 | 67 | 88.2 % | Cisco | 88 | 19 | 21.6 % |
| Danone | 73 | 64 | 87.7 % | General Electric | 89 | 18 | 20.2 % |
| Luis Vuitton | 88 | 77 | 87.5 % | 3 M | 62 | 12 | 19.4 % |
| Honda | 78 | 68 | 87.2 % | Morgan Stanley | 72 | 13 | 18.1 % |
| HP | 86 | 75 | 87.2 % | J.P. Morgan | 101 | 17 | 16.8 % |
| Rolex | 92 | 80 | 87.0 % | Citi Bank | 84 | 11 | 13.1 % |
| Adobe | 73 | 63 | 86.3 % | Xerox | 81 | 10 | 12.3 % |
| Mini | 102 | 88 | 86.3 % | Thomas Reuters | 86 | 9 | 10.5 % |
| Gucci | 86 | 74 | 86.0 % | Accenture | 94 | 5 | 5.3 % |
| Dior | 84 | 72 | 85.7 % | Overall Means | 81.7 | 59.9 | 73.3 % |
2.2 Assessments and Measures
The measurement instruments compile existing psychological self-report scales, including constructs and items previously tested for reliability and validity. First, participants were asked whether they knew a particular brand on a dichotomous scale (“Yes” or “No”). All subsequentially presented items were rated on a unified seven-point Likert scale (Lissitz and Green 1975) with the poles “I don’t agree at all” (1) and “I agree completely” (7) to improve the reliability and comparability of the scales. Items were randomized in order between and within each scale. All rankings were translated into German utilizing back translation (see Appendix A for an overview of the items).
Perceived quality and brand loyalty constructs consisted of three items derived from various previous studies (Buil, de Chernatony, and Martínez 2008; Christodoulides, Cadogan, and Veloutsou 2015; Pappu, Quester, and Cooksey 2005; Yoo and Donthu 2001). The brand experience scale is based on Brakus, Schmitt, and Zarantonello (2009), with the four intercorrelated components sensory, affective, behavioral, and intellectual experiences. Various empirical studies have validated the scale (Cleff, Lin, and Walter 2014; Iglesias, Singh, and Batista-Foguet 2011; Nysveen and Pedersen 2014; Walter, Cleff, and Chu 2013; Zarantonello and Schmitt 2010). The brand attitude was based on existing scales (Berger and Mitchell 1989; Park et al. 2010). General brand involvement was measured by five items adapted from Walsh, Mitchell, and Hennig-Thurau (2001). We also collected one-item ratings of emotional valence and arousal for each brand on an exploratory basis, which were not reported in the present study.
2.3 Data Reduction and Semi-parametric Mixed Models
Questionnaire data of specific brands were included in the further analysis when subjects indicated that they knew the brand and when brand-related items were answered thoroughly. Across all subjects, data on 6,284 brands were included in the subsequent analyses (M = 59.9 participants per brand). Notably, brands varied in recognition rates and, as a consequence, in their influence within statistical modeling (see Table 1).
Items were averaged per scale, and Cronbach’s Alpha scores were reported to evaluate scale reliability by internal consistency. Inverted items of the brand experience scale were excluded because of poor measurement reliability. Spearman correlations between all relevant scales were calculated to determine descriptive relationship patterns.
We carried out semi-parametric additive mixed modeling as the main analysis to predict the loyalty toward brands with the function gamm included in the R-package “gamm4” (Wood and Scheipl 2020). To control potentially inferring effects of relevant covariates, we first developed a null model controlling general brand involvement (see Assessments and Measures) as well as gender and brand interactions as fixed factors and the participants as random factors (Model 0, see Appendix B for results). The latter approach allows for both linear and nonlinear effects. Such models can detect nonlinear effects in a data-driven way without using prior strict assumptions, such as linearity. Next, we calculated the main effects separately for attitude (Model 1A), quality (Model 1B), and experience (Model 1C), as well as a model including all three main effects (Model 1).
Furthermore, we estimated the two-way interactions (Model 2) and the three-way interaction (Model 3). In contrast to parametric linear models, we can estimate the interaction effects directly without including the (univariate) main effects additionally in the model. Using tensor products to merge the independent variables to bi- or trivariate effects, the dependent variable’s effects can be visually inspected. Visual inspections of the interaction effects for the fitted models were carried out with perspective and contour plots included in the R-Package “itsadug” (Van Rij et al. 2017). Significance testing against zero effects was integrated into the contour plots. Significance levels were always α = 0.05. AIC and BIC were utilized as model fit indices (Burnham and Anderson 2004). A large change in model fit was interpreted by an absolute difference of 10 for AIC and BIC. In addition, we report the adjusted pseudo R 2 to estimate the amount of explained variance and the adjusted maximum likelihood (REML).
3 Results
3.1 Reliability and Intercorrelations of the Brand Scales
Information regarding reliability and intercorrelations between scales can be obtained in Table 2. Cronbach’s alpha was excellent for attitude, quality, and experience (α ≥ 0.90), good for loyalty (α = 0.89), and acceptable for the brand involvement scale (α = 0.75). Spearman correlations revealed highly significant positive and mostly strong relationships between the four brand-specific scales.
Cronbach’s alpha (in brackets) and intercorrelations (spearman’s rho) as well as mean (M) and standard deviations (SD) for all scales.
| Scales | Loyalty | Attitude | Quality | Experience | M | SD |
|---|---|---|---|---|---|---|
| Loyalty | (0.89) | 0.72 | 0.56 | 0.52 | 2.97 | 1.77 |
| Attitude | (0.96) | 0.70 | 0.49 | 4.13 | 1.69 | |
| Quality | (0.90) | 0.43 | 4.61 | 1.46 | ||
| Experience | (0.90) | 3.21 | 1.46 |
-
All correlations are highly significant (p < 0.001).
3.2 Prediction of Brand Loyalty
We fitted seven relevant models to predict brand loyalty (see Table 3): The null model underlying all models controlling for gender*brand interactions and general brand involvement (Model 0), single main effects for brand experience (Model 1A), perceived quality (Model 1B), attitude (Model 1C) as well as an integrated model for the three main effects (Model 1), two-way interactions (Model 2) and the three-way interaction (Model 3).
Semi-parametric additive mixed models for all brands.
| Model | Model 0 | Model 1A | Model 1B | Model 1C | Model 1 | Model 2 | Model 3 |
|---|---|---|---|---|---|---|---|
| Attitude | 1,023.7 (5.8) <0.001 |
293.0 (5.4) <0.001 |
|||||
| Quality | 620.1 (5.2) <0.001 |
91.4 (2.8) <0.001 |
|||||
| Experience | 454.2 (4.7) <0.001 |
123.4 (3.5) <0.001 |
|||||
| Attitude* Quality |
105.7 (14.8) <0.001 |
||||||
| Attitude* Experience |
29.9 (7.2) <0.001 |
||||||
| Quality* Experience |
0.4 (4.7) 0.854 |
||||||
| Attitude* Quality* Experience |
43.5 (41.1) <0.001 |
||||||
|
|
|||||||
| df | 214 | 216 | 216 | 216 | 220 | 229 | 228 |
| R 2 adj | 0.273 | 0.465 | 0.515 | 0.622 | 0.664 | 0.672 | 0.674 |
| REML | 22,477 | 20,647 | 19,896 | 18,349 | 17,633 | 17,530 | 17,531 |
| AIC | 22,904 | 21,079 | 20,327 | 18,781 | 18,073 | 17,988 | 17,987 |
| BIC | 24,348 | 22,536 | 21,785 | 20,238 | 19,558 | 19,532 | 19,525 |
-
Model 0 (only controlling for general brand involvement and brand*gender interaction effects; see Appendix B for detailed results), Model 1 (main effects), Model 2 (two-way interactions), and Model 3 (three-way interactions). Values indicate specific effects on brand loyalty (F-values, adjusted degrees of freedom, p-values). Bold values indicate models with the best model fit.
The null model modulated the loyalty ratings (R 2 adj = 27.3 %) with a significant gender and brand involvement influence, indicating a generally higher reported loyalty of female and highly brand-involved participants. Furthermore, significant gender*brand interaction effects for 26 brands out of 105 brands can be reported, which justifies the inclusion of this interaction pattern as a covariate in the subsequent models (see Appendix B). Analysis of the single main effect models revealed a strictly monotonically increase between all three predictors (i.e. attitude, experience, and quality) and loyalty toward a brand (see Table 3). attitude predicts loyalty strongest (Model 1C), followed by quality (Model 1B), followed by experience (Model 1A). Interestingly, this pattern slightly changes if all three predictors are integrated into one model and effects are estimated simultaneously (Model 1). While attitude still showed the most substantial impact, in contrast to the single main effect models, experience showed a larger effect than quality. It is notable that in comparison to experience and quality, attitude showed a strong nonlinear impact on loyalty (see Figure 1). While a negative to neutral attitude only weakens loyalty, the effect is strongly increased from neutral to positive attitudes.
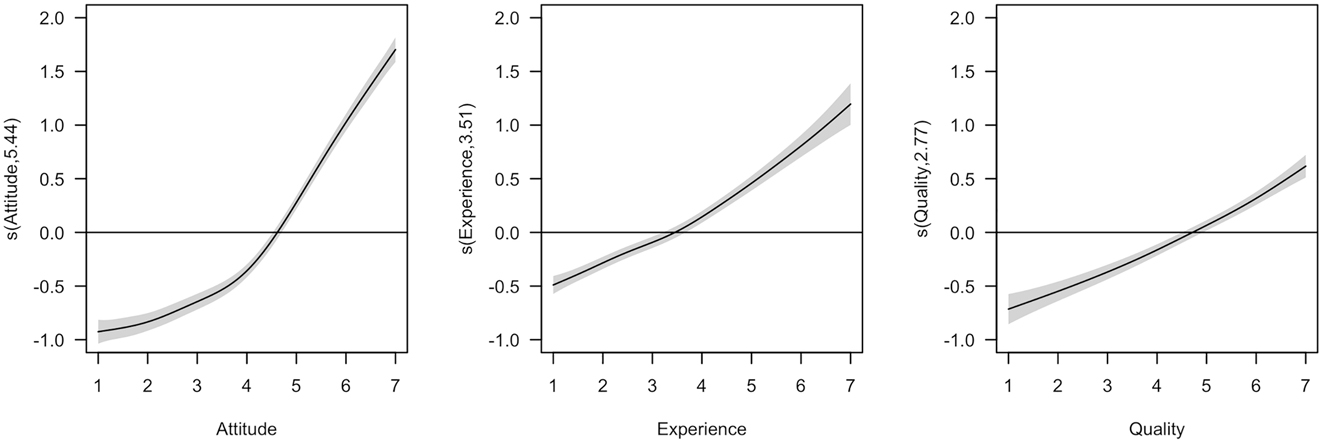
Fitted smooth effects of the main effect model. Note. The graphs show the estimated marginal effects of attitude, experience, and quality on brand loyalty. The effects are centered around zero. The shaded areas show 95 % pointwise confidence intervals. For example, s(attitude, 5.44) describes the impact of attitude on brand loyalty, and the value of 5.44 indicates the extent of non-linearity.
Next, we fitted a model including the two-way interaction effects (Model 2, see Table 3). The most substantial impact on loyalty stems from the attitude*quality interaction, which showed an increase in loyalty for both highly positive attitudes and high perceived quality and a decrease for negative attitudes and low quality (see Figure 2). Correspondingly, this effect was highly nonlinear. In addition, the interaction effect for attitude*experience modulated loyalty significantly. This effect is relatively planar and mainly driven by experience, increasing loyalty for high experience and decreasing low experience. This effect was even more pronounced for positive compared to negative attitudes. The quality*experience interaction did not modulate loyalty significantly.
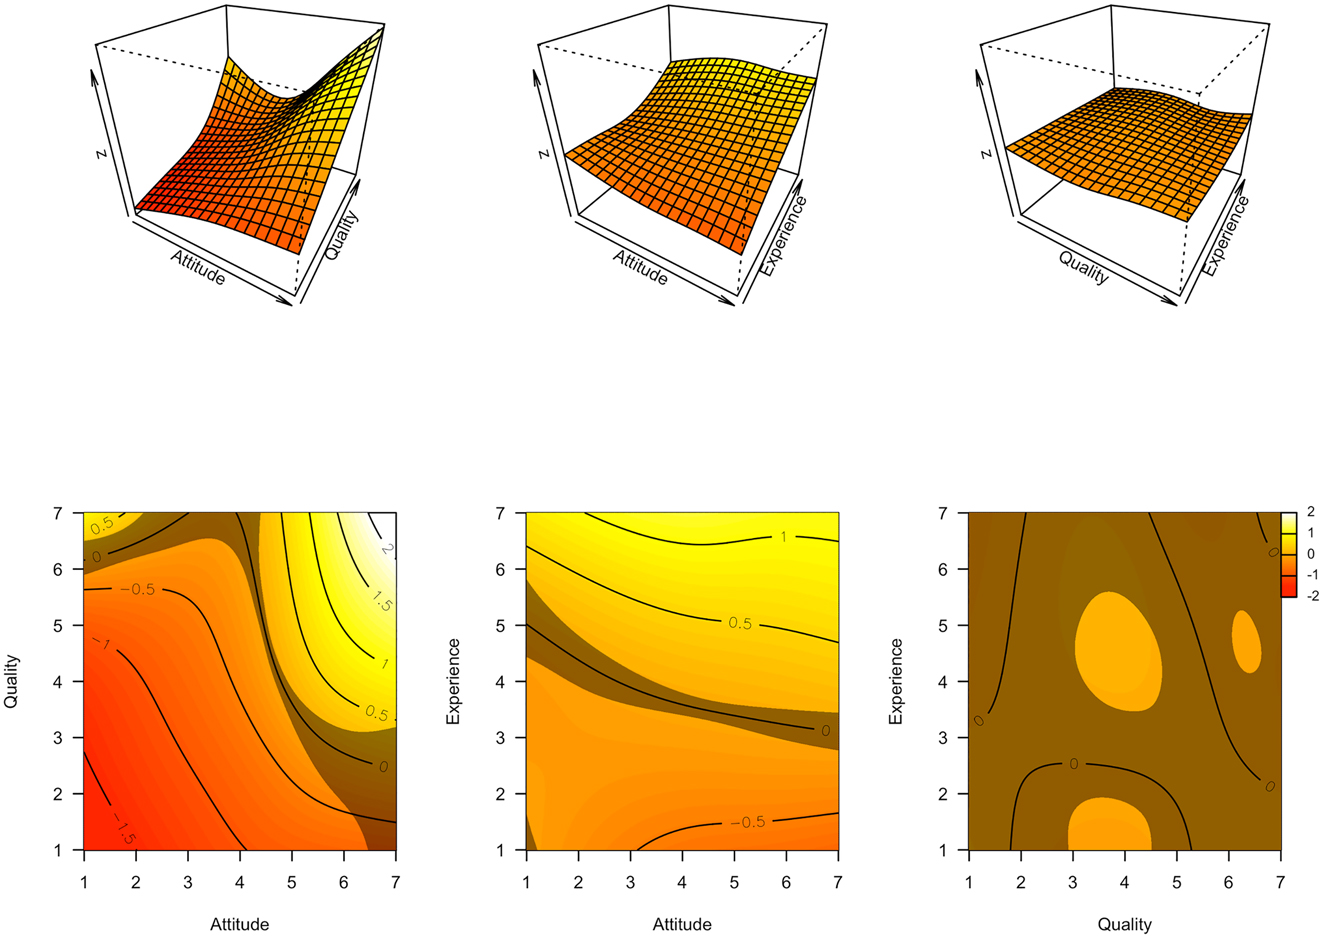
Fitted smooth effects of the two-way interaction effect model. Note. Three-dimensional (upper row) and two-dimensional (lower row) visualization of simultaneous partial interaction effects on brand loyalty for attitude*quality, attitude*experience, and quality*experience. The shaded areas in the two-dimensional visualization show significant differences from zero.
Finally, we fitted the model, including the three-way interaction effect (Model 3, see Table 3), which revealed a highly significant and nonlinear impact on loyalty. To resolve the three-way interaction, we inspected the two-way interaction effects between attitude and quality by holding experience constant for low experience, moderate experience, and high experience. As depicted in Figure 3, the interaction effect between attitude and quality on loyalty increases for increasing experience, i.e. the area with a significant increase in loyalty gets larger for higher experience, and inversely, the area with a significant decrease in loyalty gets smaller for the experience.
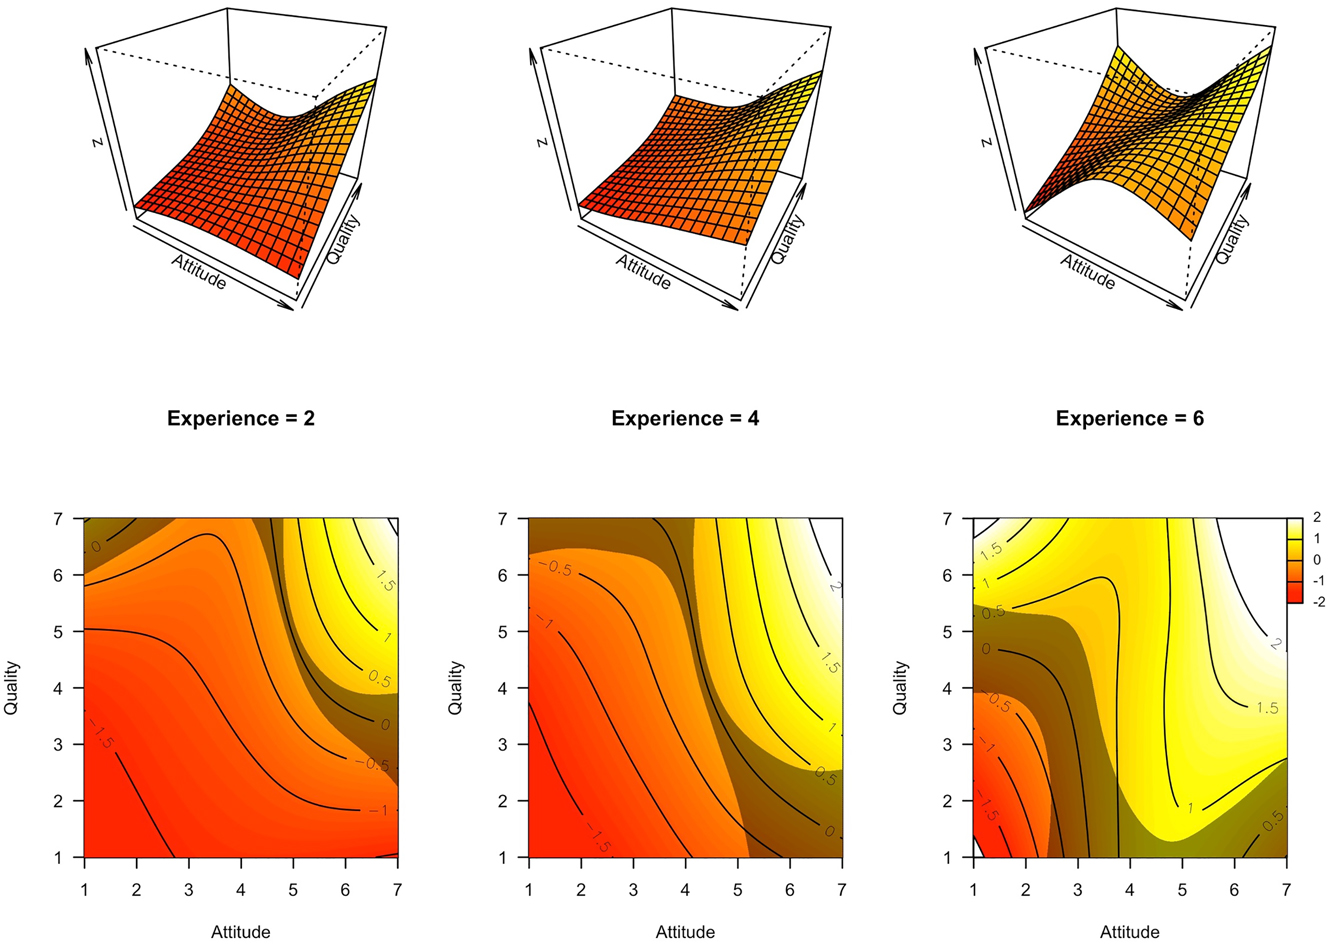
Fitted smooth effects of the three-way interaction effect model. Note. Three-dimensional and two-dimensional visualization of simultaneous partial interaction effects on brand loyalty for attitude*quality by holding experience constant regarding low experience (2), moderate experience (4), and high experience (6). The shaded areas in the two-dimensional visualization show significant differences from zero.
Comparing the fit of the three primary models (Model 1, Model 2, Model 3) regarding the fit indices listed in Table 3 (i.e. AIC, BIC, REML), we observed a vastly better fit for interaction-effect models (Model 2 and Model 3) compared with the main-effect model (Model 1). However, the three-way interaction model slightly increased model fit exclusively on BIC, penalizing complexity more than AIC and REML. R 2 adj was comparable between the three models, between 66.4 % and 67.4 % explained variance, showing a maximum difference of 1 %.
3.3 Prediction of Brand Loyalty by Industry
We separately applied the model-fitting rationale from our primary analysis to account for industry-specific effects on an experimental basis. Therefore, we grouped brands into five industries: Fast-moving consumer goods, automotive, fashion, electronics, and finance/insurance, covering approximately 81 % of all brand ratings. In Table 4, we report the fitted Model 0 (null model), Model 1 (main effects), Model 2 (two-way interaction effects), and Model 3 (three-way interaction effects).
Semi-parametric additive mixed models separately for industries.
| FMCG | Automotive | Fashion | Electronics | Finance & Insurance | |
|---|---|---|---|---|---|
| Observations | 1,670 | 1,080 | 945 | 851 | 513 |
|
|
|||||
| Null Model | |||||
|
|
|||||
| df | 54 | 34 | 34 | 28 | 28 |
| R 2(adj) | 0.263 | 0.144 | 0.248 | 0.101 | 0.281 |
| REML | 6,065 | 3,838 | 3,347 | 3,189 | 1824 |
| AIC | 6,173 | 3,906 | 3,415 | 3,245 | 1880 |
| BIC | 6,466 | 4,076 | 3,580 | 3,378 | 1999 |
|
|
|||||
| Model 1 – Main Effects | |||||
|
|
|||||
| Attitude | 120.1 (4.0) <0.001 |
54.9 (3.9) <0.001 |
84.0 (4.4) <0.001 |
63.4 (4.8) <0.001 |
23.5 (3.8) <0.001 |
| Quality | 36.0 (2.4) <0.001 |
6.1 (2.4) 0.001 |
2.4 (3.7) 0.034 |
4.2 (4.0) 0.002 |
19.2 (3.2) <0.001 |
| Experience | 62.2 (1.6) <0.001 |
40.2 (3.8) <0.001 |
18.0 (3.6) <0.001 |
76.3 (1.0) <0.001 |
27.9 (1.0) <0.001 |
|
|
|||||
| df | 60 | 40 | 40 | 34 | 34 |
| R 2(adj) | 0.689 | 0.586 | 0.647 | 0.635 | 0.681 |
| REML | 4,681 | 3,062 | 2,669 | 2,473 | 1,448 |
| AIC | 4,801 | 3,142 | 2,749 | 2,541 | 1,516 |
| BIC | 5,126 | 3,342 | 2,943 | 2,702 | 1,660 |
|
|
|||||
| Model 2 – Two-way Interaction Effects | |||||
|
|
|||||
| Attitude* Quality |
77.2 (7.9) <0.001 |
20.6 (9.1) <0.001 |
10.1 (9.4) <0.001 |
14.7 (13.0) <0.001 |
26.9 (10.3) <0.001 |
| Attitude* Experience |
35.1 (2.0) <0.001 |
23.2 (5.5) <0.001 |
3.7 (9.2) <0.001 |
8.1 (5.0) <0.001 |
12.8 (2.0) <0.001 |
| Quality* Experience |
0.9 (4.5) 0.509 |
4.5 (1.0) 0.033 |
0.3 (1.1) 0.657 |
0.5 (3.4) 0.746 |
1.9 (3.4) 0.127 |
|
|
|||||
| df | 69 | 49 | 49 | 43 | 43 |
| R 2(adj) | 0.701 | 0.590 | 0.650 | 0.650 | 0.697 |
| REML | 4,632 | 3,058 | 2,672 | 2,467 | 1,439 |
| AIC | 4,770 | 3,156 | 2,770 | 2,553 | 1,524 |
| BIC | 5,144 | 3,401 | 3,008 | 2,757 | 1707 |
|
|
|||||
| Model 3 – Three-way Interaction Effects | |||||
|
|
|||||
| Attitude* Quality* Experience |
52.6 (18.0) <0.001 |
15.6 (24.3) <0.001 |
11.0 (22.9) <0.001 |
16.1 (21.6) <0.001 |
12.4 (20.0) <0.001 |
|
|
|||||
| df | 68 | 48 | 48 | 42 | 42 |
| R 2(adj) | 0.701 | 0.594 | 0.651 | 0.651 | 0.696 |
| REML | 4,640 | 3,059 | 2,679 | 2,464 | 1,448 |
| AIC | 4,776 | 3,155 | 2,775 | 2,548 | 1,532 |
| BIC | 5,145 | 3,395 | 3,008 | 2,747 | 1710 |
-
Model 0 (only controlling for general brand involvement and brand*gender interactions), Model 1 (main effects), Model 2 (two-way interactions), and Model 3 (three-way interactions). Values indicate specific effects on brand loyalty (F-values, adjusted degrees of freedom, p-values).
The null model modulated the loyalty ratings with significant influences of gender and brand involvement, which was stronger for FMCG brands, fashion, and finance/insurance compared to automotive and electronics. Concerning the main effects model (Model 1), the findings of our primary analysis maintained that attitude primarily showed the most substantial results, followed by experience and quality. In particular, experience appeared to have a large impact on automotive brands. In comparison, quality had a large effect on FMCG and finance and insurance brands (see Figure 4). Regarding the two-way interaction models (Model 2), the results mainly replicate the findings from our primary analysis that a combination of high attitude and high quality is particularly favorable for brand loyalty for FMCG, automotive, and electronics brands (see Figure 5).
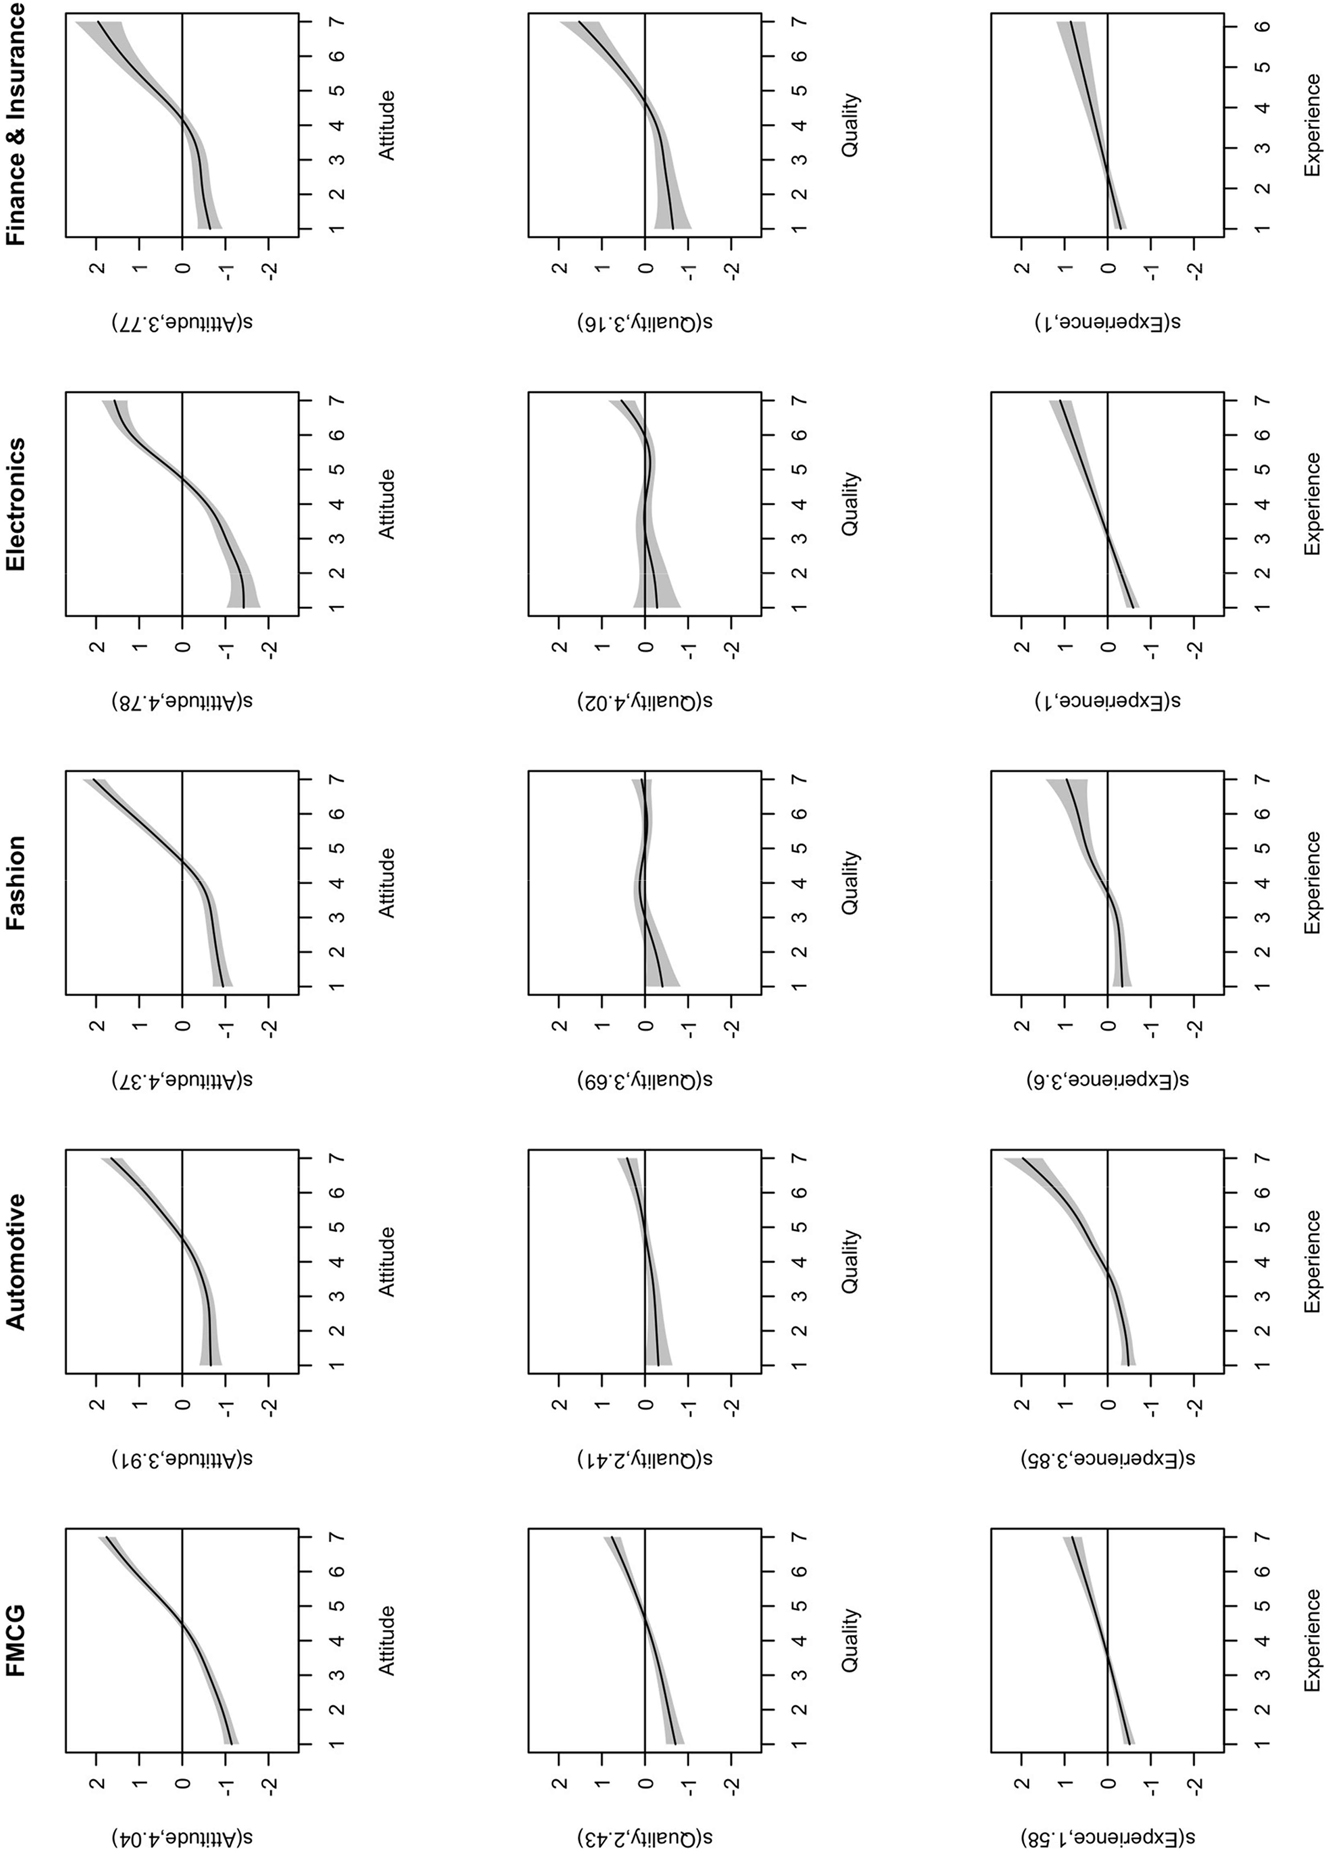
Fitted smooth effects of the main effect model separately for industries. Note. The graphs show the estimated marginal effects of attitude, quality, and experience on brand loyalty separately for different industries. The effects are centered around zero. The shaded areas show 95 % pointwise confidence intervals.
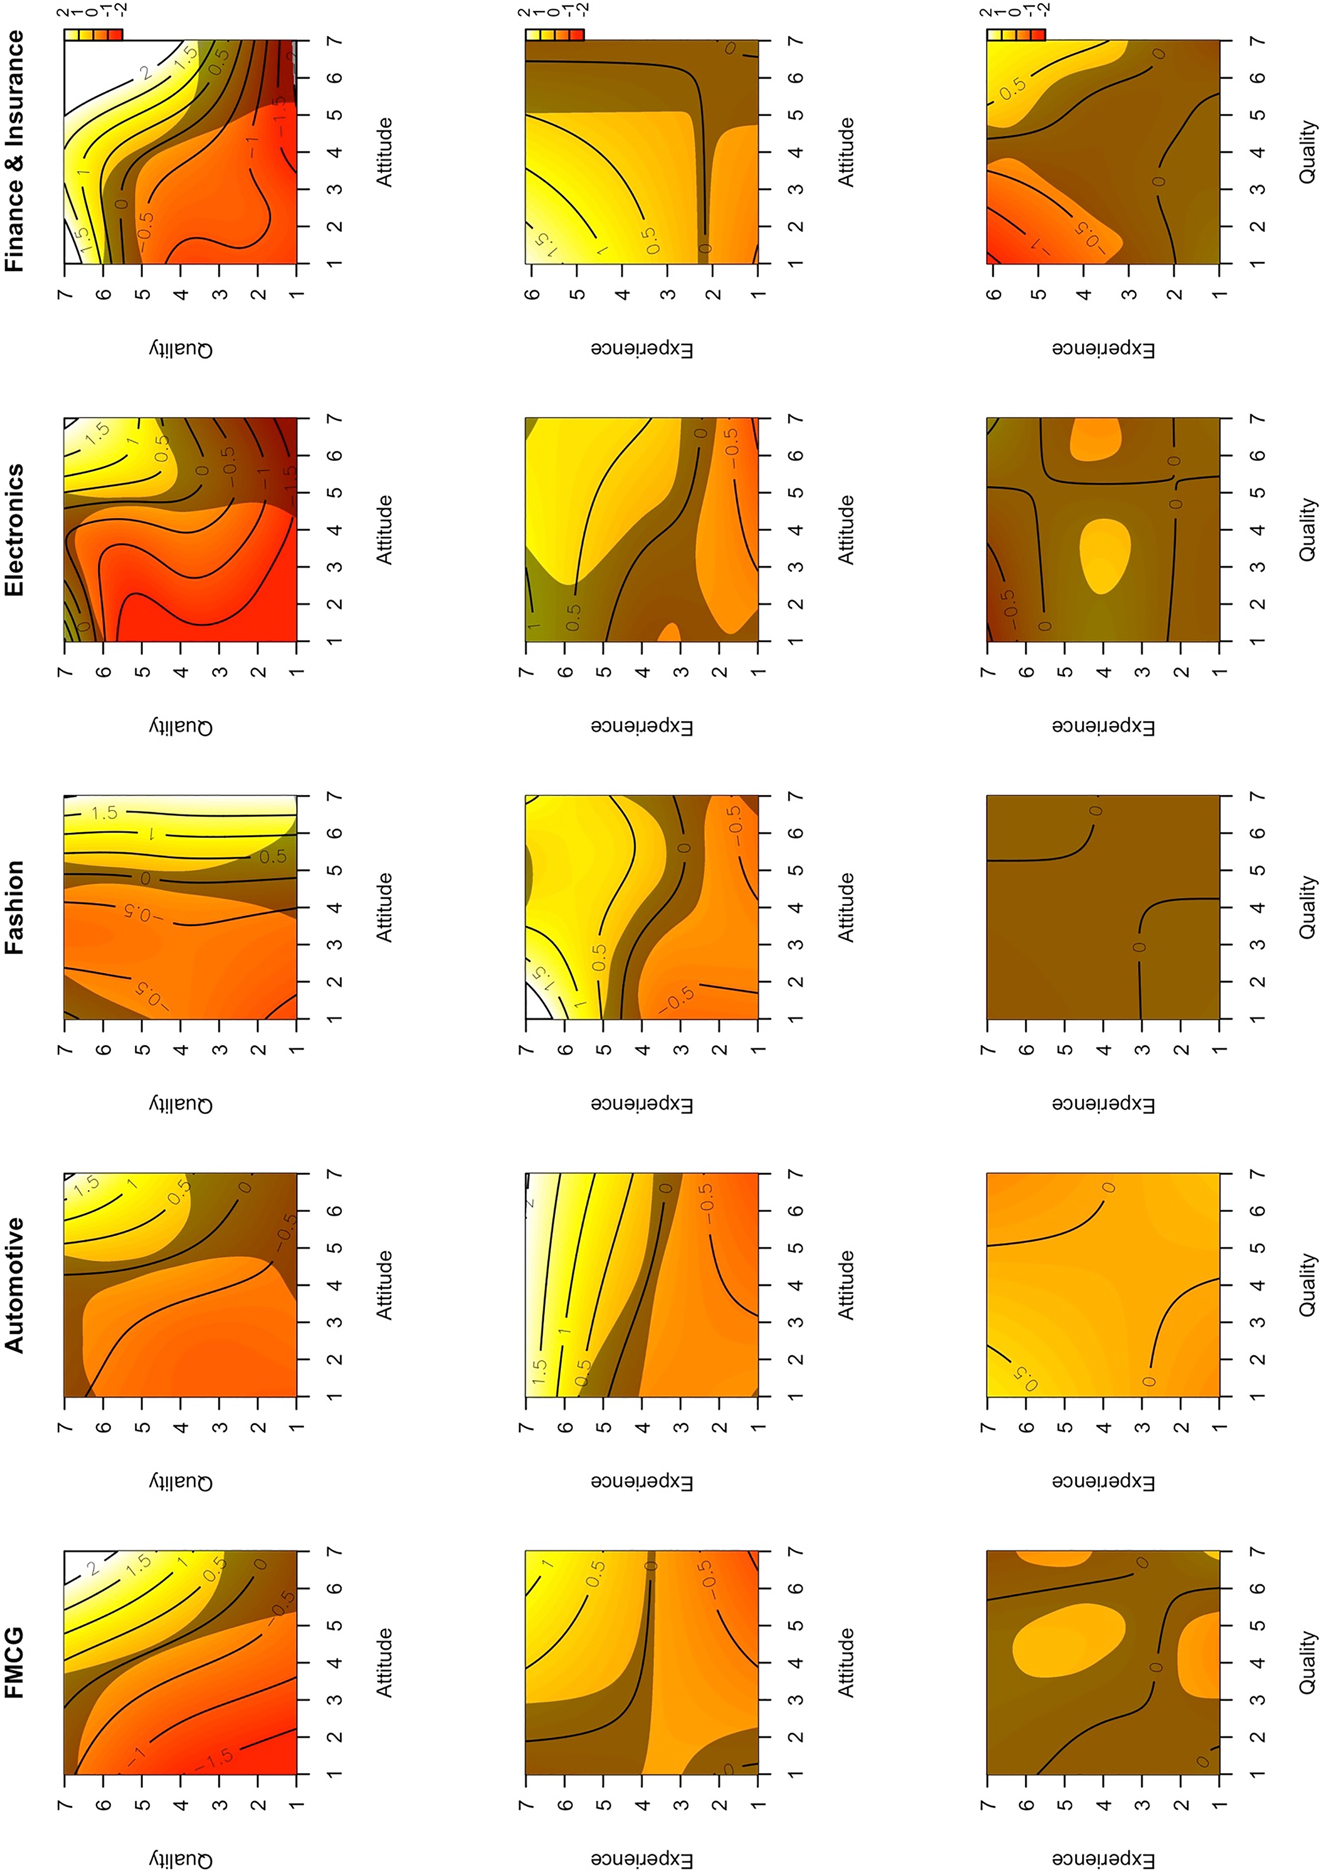
Fitted smooth effects of the two-way interaction effect models separately for industries. Note. Two-dimensional visualization of simultaneous partial interaction effects on brand loyalty for attitude*quality, attitude*experience, and quality*experience separately for different industries. The shaded areas show significant differences from zero.
Nevertheless, we observed important results regarding the interaction of the attitude*quality effect for the two remaining industries: First, there seems to be an overriding effect for attitude over quality for fashion brands. If participants stated a highly positive attitude toward a fashion brand, loyalty was consistently increased regardless of perceived quality. Second, there is an overriding effect of quality over attitude for finance and insurance brands. If participants stated a high quality toward a finance and insurance brand, loyalty was consistently increased regardless of attitude. However, the most substantial increase in loyalty can still be observed if positive attitudes and high quality are reported. In contrast to our general models, industry-specific models showed the best model fit for the main effect models. The industry-specific models, like our general models, show that the three-way interactions (see Figure 6) are similar to those of the two-way interaction models.
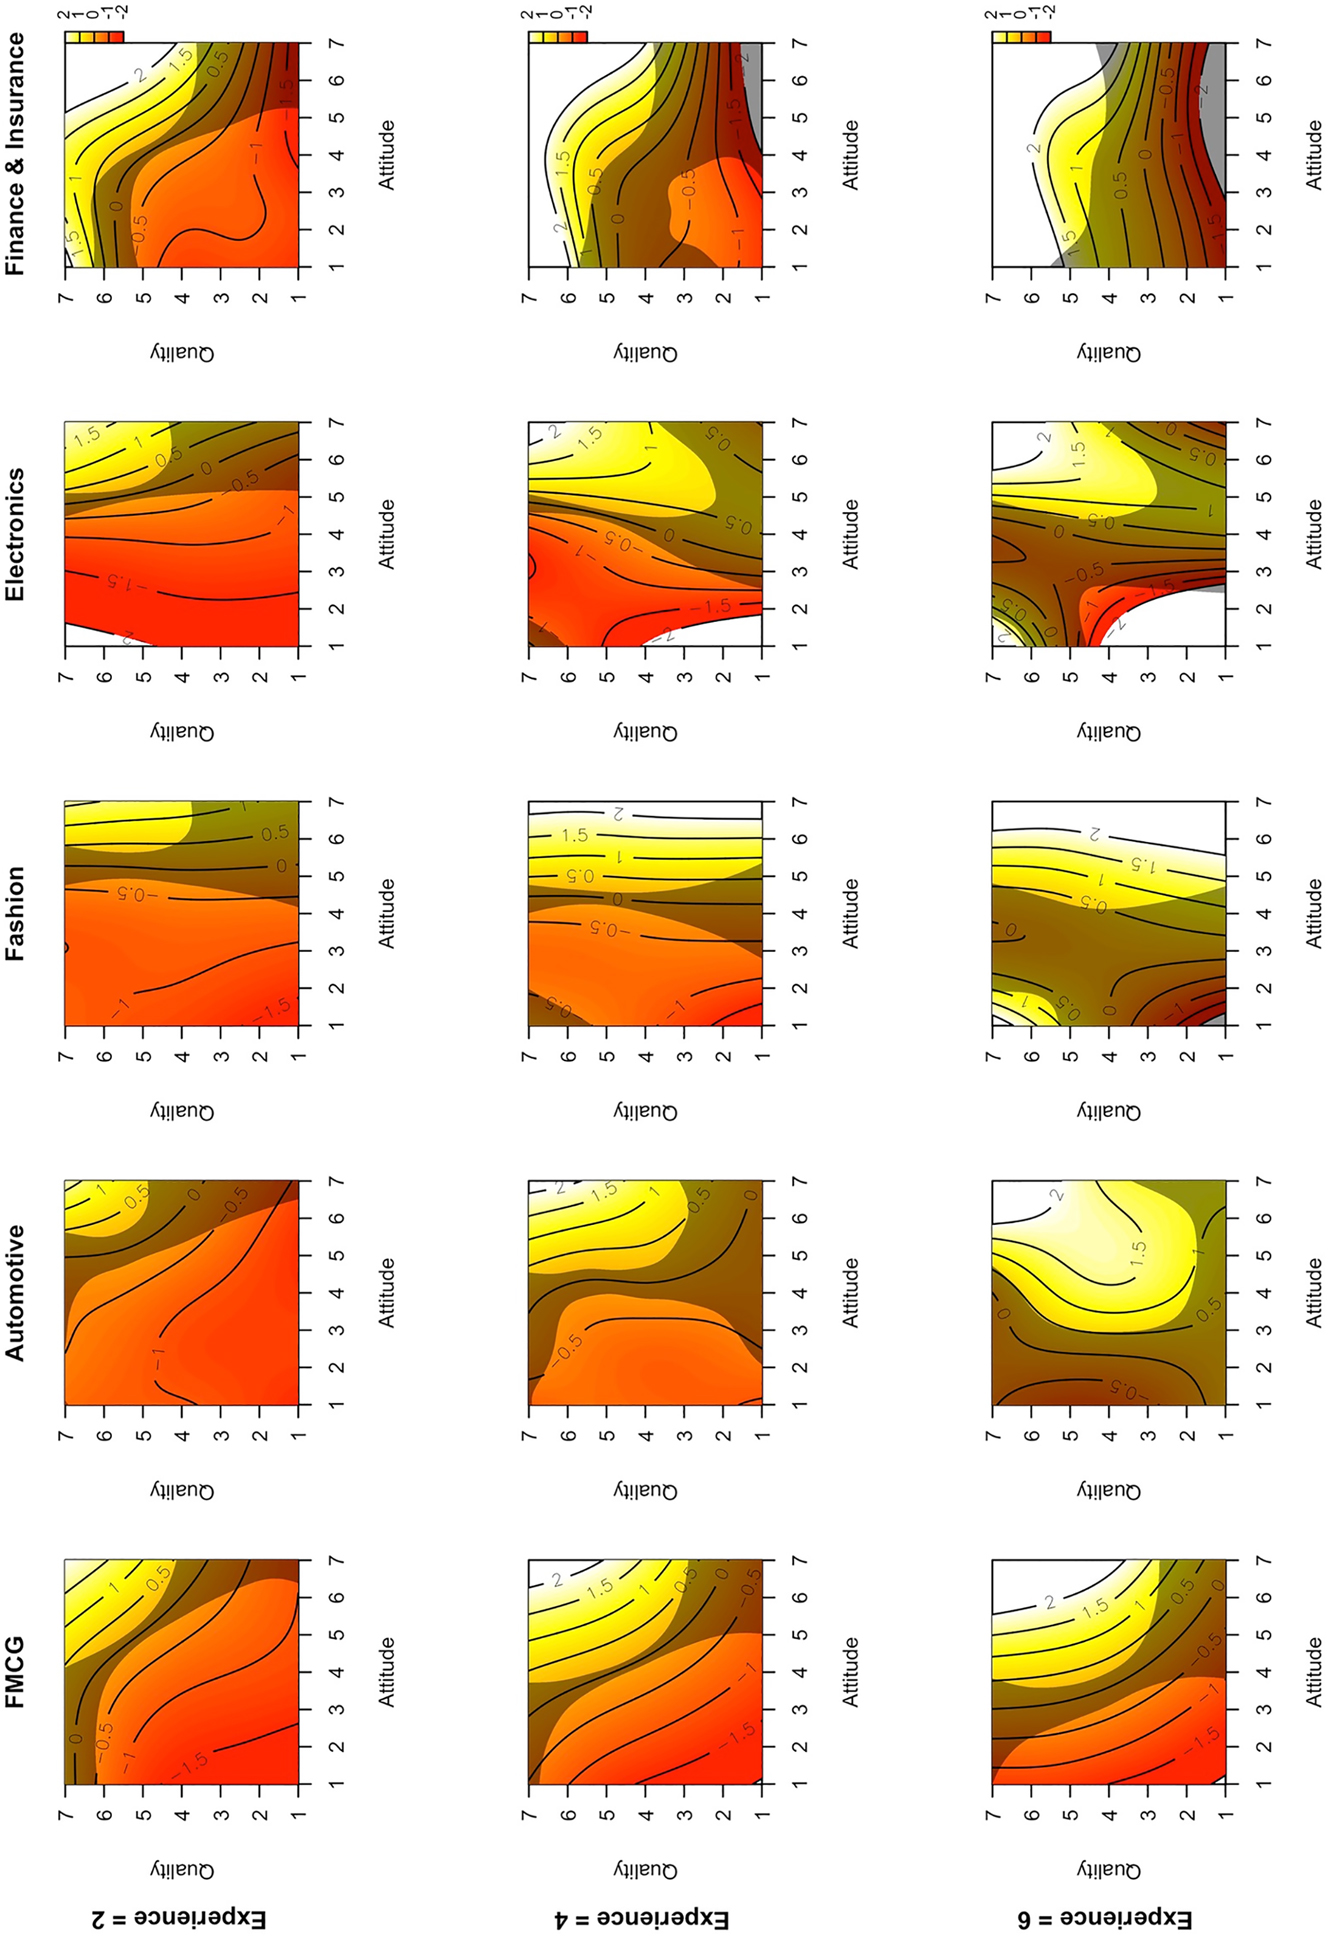
Fitted smooth effects of the three-way interaction effect model separately for industries. Note. Two-dimensional visualization of simultaneous partial interaction effects on brand loyalty for attitude*quality by holding experience constant regarding low experience (2), moderate experience (4), and high experience (6) separately for different industries. The shaded areas show significant differences from zero.
4 Discussion
In this study, we predicted consumers’ reported brand loyalty by attitude toward the brand, perceived quality of a brand, and brand experience using an advanced semi-parametric estimation approach. All three predictors were positively associated with brand loyalty, corresponding with previous findings regarding the impact of attitudes (Arghashi, Bozbay, and Karami 2021; Chaudhuri 1999; Hwang et al. 2022; Kim, Morris, and Swait 2008; Rubinson and Baldinger 1996), perceived quality (Akoglu and Özbek 2022; Buil, Martínez, and de Chernatony 2013; Çifci et al. 2016; Hyun, Park, and Hong 2024; Olsen 2002; Pappu, Quester, and Cooksey 2005; Yoo and Donthu 2001), and brand experience (Bae and Kim 2023; Brakus, Schmitt, and Zarantonello 2009; Huang 2017; Husain, Paul, and Koles 2022; Iglesias, Singh, and Batista-Foguet 2011; Pina and Dias 2021; Ramaseshan and Stein 2014). Our results show that attitude impacts brand loyalty strongest among all three predictors.
While our findings align with previous research, we extend the existing literature by a more data-driven linkage between psychological determinants of brand loyalty in terms of nonlinearity and interactions. Our results indicate that more than the most commonly used linearity assumption is needed to reveal the nonlinear and interactive relationships between brand loyalty and its determinants. Hence, a nonlinear interaction approach may better understand the genuine connections between consumers’ brand loyalty and psychological precursors. We found strong evidence for nonlinearities and demonstrated that substantial interaction effects exist between attitude, perceived quality, and experiences with a brand. Thus, it is essential to take potential nonlinear and interactive effects into account when uncovering the determinants of brand loyalty. For example, although attitude is the most potent predictor of brand loyalty, if brand experience and perceived quality are both high, there is always a positive impact on brand loyalty regardless of positive or negative attitudes toward the brand. Nevertheless, if the brand experience is high and the attitude is positive, perceived quality has no negative impact on brand loyalty, even if the perceived quality is poor. We also observed industry-specific effects that emphasize the crucial role of attitudes for fashion brands, perceived quality for finance/insurance brands, and brand experience for automotive brands. Such complex patterns in terms of linearity and interaction can only be revealed if researchers account for their data’s interactive and possibly nonlinear nature.
4.1 Limitations
Although our models showed clear and robust patterns, the findings are limited regarding the representativeness of our sample and, in particular, the impact of sociodemographic variables. As we used a convenient sampling method, our sample consisted mainly of female and relatively young participants residing in Germany. Hence, future studies need to replicate our findings with samples balanced in gender and age and for varying cultures to generalize our findings to other sociodemographic populations.
Although we observed interesting industry-specific effects, the clusters of brands were also not balanced regarding the number of brands per industry. Most importantly, they did not cover all relevant brands of a particular industry. The level of involvement in an industry or category could be a moderator for loyalty to brands of a specific sector. Hence, future studies should take a complete list of industry-specific brands and balance the number of industry-specific brands.
4.2 Outlook
Our findings demonstrate that attitudes, perceived quality, and brand experience predict brand loyalty. We also found that substantial differences regarding the relative impact of these predictors exist. Furthermore, we observed differences in linearity between them. However, other critical psychological aspects are considered to significantly impact brand loyalty, indicating a need for future investigation to reveal the relative importance, linearity aspects, and interaction effect patterns.
Besides the investigated dimensions of the present study, various other branding concepts are related to psychological brand equity. For example, brand affect is a brand’s potential to elicit a positive emotional response in the consumer due to its use (Sharawneh 2020). Since brand affect is an immediate and spontaneous reaction, it varies from attitude, which is a long-term evaluation of the brand and can show a more robust correspondence with the emotional component of the brand experience scale. Furthermore, attitudes are based on and share similar emotional processes with core affect (i.e. emotional valence). This is interesting because emotional valence lends itself to well-established experimental approaches (Gerdes 2010). Hence, future investigations of branding concepts and precursors of brand loyalty, in particular, may consider experimental methods to measure emotional responses in consumers more objectively, for example, with psychophysiological indicators of arousal (Höfling et al. 2020), electromyography (Höfling et al. 2021), or automatic facial coding (Büdenbender et al. 2023; Höfling et al. 2022; Küntzler, Höfling, and Alpers 2021), and could investigate the direct link between emotional responses toward advertisement and changes in brand evaluation (Höfling and Alpers 2023).
Brand attachment is also related to brand attitude and refers to an emotional attachment to a brand, which likely fosters a favorable attitude toward that brand (Chieng et al. 2022; Thomson, MacInnis, and Whan Park 2005). Brand love is a more recent concept that describes the degree of passionate, emotional attachment a satisfied consumer has for a particular brand (Carroll and Ahuvia 2006; Robertson et al. 2022). Brand likeability and brand love are also similar concepts to brand attachment. In this context, brand attitude is one core aspect of brand love (Batra, Ahuvia, and Bagozzi 2012) and probably is an essential component of other brand concepts. Brand likeability is seen as a precursor to brand love. Consumers first “like” a brand before they “love” it. Attractiveness, expertise, and credibility are also essential aspects strongly associated with the likeability of a brand (Nguyen, Melewar, and Chen 2013, 2015). Accordingly, likeability and attitude are also related since both demand evaluative processes.
Besides the importance of emotional aspects for branding constructs, other parts of brand relationships that rely on more cognitive processing must be considered in future studies to predict consumers’ brand loyalty (Khamitov, Wang (Shane), and Thomson 2019). For example, there is also evidence that, alongside perceived quality, a particular brand’s trustworthiness significantly impacts the loyalty of consumers (Akoglu and Özbek 2022; Erdem and Swait 2004). Finally, according to the brand equity model (Keller 2003a), there might be essential dimensions like the brand awareness or benefits of the consumption or usage of products and services of a particular brand that have not been addressed in the present study and should be investigated in future studies.
4.3 Managerial Implications
We demonstrated that an advanced semi-parametric additive mixed modeling approach is useful for brand research. Specifically, we reported a strongly non-linear function between attitude toward a brand and brand loyalty. In contrast, the perceived quality of and experience with the brand showed a relatively linear impact on loyalty. Hence, one important practical implication of this research is the specific relational pattern between attitude toward a brand and reported brand loyalty. Attitude shows a more substantial impact on loyalty for positive compared to negative attitudes, indicating a high relevance for brand positioning not to let customers’ attitudes fall below a neutral attitude toward a brand. Another important practical implication is regarding highly specific industry effects: The most substantial impact on brand loyalty is typically a combination of a highly positive attitude toward the brand and a high perceived quality, particularly for fast-moving consumer goods, automotive, and electronics. However, for fashion brands, attitude is more important than quality, and vice versa for finance/insurance brands, quality is more important than attitude. These innovative insights may inform practitioners about the importance of prioritizing brand positioning dimensions and the necessity of aligning branding strategies for specific product or service industries.
4.4 Conclusions
This is the first study that accounts for nonlinear and interaction effects in brand research in various industries. Specifically, attitudes toward the brand, perceived quality, and brand experience predicted consumers’ reported brand loyalty. We demonstrated that an advanced semiparametric estimation approach helps understand better the relationship patterns that impact brand loyalty. Our results show that attitude toward the brand is the strongest nonlinear predictor of brand loyalty. Furthermore, investigating relevant interactions revealed substantial industry-specific effects for fast-moving consumer goods, automotive, fashion, electronics, and finance. Such complex patterns would remain undetected if analysis exclusively relies on linear modeling approaches and can only be revealed if brand researchers account for the data’s interactive and possibly nonlinear nature.
-
Research ethics: According to the local ethics committee, we were not required to complete an ethical assessment before conducting this study. We obtained informed consent from our participants.
-
Conflict of interest: The authors have no competing interests to declare that are relevant to the content of this article.
-
Research funding: The publication of this manuscript was funded by the Ministry of Science, Research and the Arts Baden-Württemberg and the University of Mannheim.
References
Achar, C., J. So, N. Agrawal, and A. Duhachek. 2016. “What We Feel and Why We Buy: The Influence of Emotions on Consumer Decision-Making.” Current Opinion in Psychology 10: 166–70. https://doi.org/10.1016/j.copsyc.2016.01.009.Search in Google Scholar
Akoglu, H. E., and O. Özbek. 2022. “The Effect of Brand Experiences on Brand Loyalty through Perceived Quality and Brand Trust: A Study on Sports Consumers.” Asia Pacific Journal of Marketing and Logistics 34 (10): 2130–48. https://doi.org/10.1108/APJML-05-2021-0333.Search in Google Scholar
Albaity, M., and M. Rahman. 2021. “Customer Loyalty towards Islamic Banks: The Mediating Role of Trust and Attitude.” Sustainability 13 (19): 10758. https://doi.org/10.3390/su131910758.Search in Google Scholar
Arghashi, V., Z. Bozbay, and A. Karami. 2021. “An Integrated Model of Social Media Brand Love: Mediators of Brand Attitude and Consumer Satisfaction.” Journal of Relationship Marketing 20 (4): 319–48. https://doi.org/10.1080/15332667.2021.1933870.Search in Google Scholar
Argyriou, E., and T. C. Melewar. 2011. “Consumer Attitudes Revisited: A Review of Attitude Theory in Marketing Research.” International Journal of Management Reviews 13: 431–51. https://doi.org/10.1111/j.1468-2370.2011.00299.x.Search in Google Scholar
Bae, B. R., and S.-E. Kim. 2023. “Effect of Brand Experiences on Brand Loyalty Mediated by Brand Love: The Moderated Mediation Role of Brand Trust.” Asia Pacific Journal of Marketing and Logistics 35 (10): 2412–30. https://doi.org/10.1108/APJML-03-2022-0203.Search in Google Scholar
Bapat, D. 2017. “Impact of Brand Familiarity on Brands Experience Dimensions for Financial Services Brands.” International Journal of Bank Marketing 35 (4): 637–48. https://doi.org/10.1108/IJBM-05-2016-0066.Search in Google Scholar
Batra, R., A. Ahuvia, and R. P. Bagozzi. 2012. “Brand Love.” Journal of Marketing 76 (2): 1–16. https://doi.org/10.1509/jm.09.0339.Search in Google Scholar
Berger, I. E., and A. A. Mitchell. 1989. “The Effect of Advertising on Attitude Accessibility, Attitude Confidence, and the Attitude-Behavior Relationship.” Journal of Consumer Research 16 (3): 269–79. https://doi.org/10.1086/209213.Search in Google Scholar
Brakus, J. J., B. H. Schmitt, and L. Zarantonello. 2009. “Brand Experience: What Is it? How Is it Measured? Does it Affect Loyalty?” Journal of Marketing 73 (3): 52–68. https://doi.org/10.1509/jmkg.73.3.052.Search in Google Scholar
Büdenbender, B., T. T. A. Höfling, A. B. M. Gerdes, and G. W. Alpers. 2023. “Training Machine Learning Algorithms for Automatic Facial Coding: The Role of Emotional Facial Expressions’ Prototypicality.” PLoS One 18 (2): e0281309. https://doi.org/10.1371/journal.pone.0281309.Search in Google Scholar
Buil, I., L. de Chernatony, and E. Martínez. 2008. “A Cross‐national Validation of the Consumer‐based Brand Equity Scale.” Journal of Product & Brand Management 17 (6): 384–92. https://doi.org/10.1108/10610420810904121.Search in Google Scholar
Buil, I., E. Martínez, and L. de Chernatony. 2013. “The Influence of Brand Equity on Consumer Responses.” Journal of Consumer Marketing 30 (1): 62–74. https://doi.org/10.1108/07363761311290849.Search in Google Scholar
Burnham, K. P., and D. R. Anderson. 2004. “Multimodel Inference: Understanding AIC and BIC in Model Selection.” Sociological Methods & Research 33 (2): 261–304. https://doi.org/10.1177/0049124104268644.Search in Google Scholar
Carroll, B. A., and A. C. Ahuvia. 2006. “Some Antecedents and Outcomes of Brand Love.” Marketing Letters 17 (2): 79–89. https://doi.org/10.1007/s11002-006-4219-2.Search in Google Scholar
Chattopadhyay, A., and J.-L. Laborie. 2005. “Managing Brand Experience: The Market Contact AuditTM.” Journal of Advertising Research 45 (1): 9–16. https://doi.org/10.1017/S0021849905050129.Search in Google Scholar
Chaudhuri, A. 1999. “The Relationship of Brand Attitudes and Brand Performance: The Role of Brand Loyalty.” The Journal of Marketing Management 9 (3): 1–9.Search in Google Scholar
Chaudhuri, A., and M. B. Holbrook. 2001. “The Chain of Effects from Brand Trust and Brand Affect to Brand Performance: The Role of Brand Loyalty.” Journal of Marketing 65 (2): 81–93. https://doi.org/10.1509/jmkg.65.2.81.18255.Search in Google Scholar
Chi, D. H. K., D. H. R. Yeh, and Y. T. Yang. (2009). “The Impact of Brand Awareness on Consumer Purchase Intention: The Mediating Effect of Perceived Quality and Brand Loyalty.” The Journal of International Management Studies 4 (1): 135–44.Search in Google Scholar
Chieng, F., P. Sharma, R. P. Kingshott, and R. Roy. 2022. “Interactive Effects of Self-Congruity and Need for Uniqueness on Brand Loyalty via Brand Experience and Brand Attachment.” Journal of Product & Brand Management 31 (6): 870–85. https://doi.org/10.1108/JPBM-12-2020-3250.Search in Google Scholar
Choi, Y. G., C. M. Ok, and S. S. Hyun. 2017. “Relationships between Brand Experiences, Personality Traits, Prestige, Relationship Quality, and Loyalty: An Empirical Analysis of Coffeehouse Brands.” International Journal of Contemporary Hospitality Management 29 (4): 1185–202. https://doi.org/10.1108/IJCHM-11-2014-0601.Search in Google Scholar
Christodoulides, G., J. W. Cadogan, and C. Veloutsou. 2015. “Consumer-based Brand Equity Measurement: Lessons Learned from an International Study.” International Marketing Review 32 (3/4): 307–28. https://doi.org/10.1108/IMR-10-2013-0242.Search in Google Scholar
Çifci, S., Y. Ekinci, G. Whyatt, A. Japutra, S. Molinillo, and H. Siala. 2016. “A Cross Validation of Consumer-Based Brand Equity Models: Driving Customer Equity in Retail Brands.” Journal of Business Research 69 (9): 3740–7. https://doi.org/10.1016/j.jbusres.2015.12.066.Search in Google Scholar
Cleff, T., I. C. Lin, and N. Walter. 2014. “Can You Feel it? – the Effect of Brand Experience on Brand Equity.” The IUP Journal of Brand Management 11 (2): 7–27.Search in Google Scholar
Cobb-Walgren, C. J., C. A. Ruble, and N. Donthu. 1995. “Brand Equity, Brand Preference, and Purchase Intent.” Journal of Advertising 24 (3): 25–40. https://doi.org/10.1080/00913367.1995.10673481.Search in Google Scholar
Dabholkar, P. A., C. D. Shepherd, and D. I. Thorpe. 2000. “A Comprehensive Framework for Service Quality: An Investigation of Critical Conceptual and Measurement Issues through a Longitudinal Study.” Journal of Retailing 76 (2): 139–73. https://doi.org/10.1016/S0022-4359(00)00029-4.Search in Google Scholar
Dandis, A. O., and M. B. Al Haj Eid. 2021. “Customer Lifetime Value: Investigating the Factors Affecting Attitudinal and Behavioural Brand Loyalty.” The TQM Journal 34 (3): 476–93. https://doi.org/10.1108/TQM-12-2020-0311.Search in Google Scholar
Darsono, L. I., and C. M. Junaedi. 2006. “An Examination of Perceived Quality, Satisfaction, and Loyalty Relationship: Applicability of Comparative and Noncomparative Evaluation.” Gadjah Mada International Journal of Business 8 (3): 323. https://doi.org/10.22146/gamaijb.5612.Search in Google Scholar
Dawes, J. G., C. Graham, and G. Trinh. 2021. “The Long-Term Erosion of Repeat-Purchase Loyalty.” European Journal of Marketing 55 (3): 763–89. https://doi.org/10.1108/EJM-01-2018-0042.Search in Google Scholar
Day, G. S. 1969. “A Two-Dimensional Concept of Brand Loyalty.” Journal of Advertising Research 9 (3): 29–35.Search in Google Scholar
Dick, A. S., and K. Basu. 1994. “Customer Loyalty: Toward an Integrated Conceptual Framework.” Journal of the Academy of Marketing Science 22 (2): 99–113. https://doi.org/10.1177/0092070394222001.Search in Google Scholar
Ding, C. G., and T. H. Tseng. 2015. “On the Relationships Among Brand Experience, Hedonic Emotions, and Brand Equity.” European Journal of Marketing 49 (7/8): 994–1015. https://doi.org/10.1108/EJM-04-2013-0200.Search in Google Scholar
Erdem, T., and J. Swait. 2004. “Brand Credibility, Brand Consideration, and Choice.” Journal of Consumer Research 31 (1): 191–8. https://doi.org/10.1086/383434.Search in Google Scholar
Erdoğmuş, İ., and I. Büdeyri‐Turan. 2012. “The Role of Personality Congruence, Perceived Quality and Prestige on Ready‐to‐wear Brand Loyalty.” Journal of Fashion Marketing and Management: An International Journal 16 (4): 399–417. https://doi.org/10.1108/13612021211265818.Search in Google Scholar
Erjavec, H. Š., T. Dmitrović, and P. Povalej Bržan. 2016. “Drivers of Customer Satisfaction and Loyalty in Service Industries.” Journal of Business Economics and Management 17 (5): 810–23. https://doi.org/10.3846/16111699.2013.860614.Search in Google Scholar
Feldman, J. M., and J. G. Lynch. 1988. “Self-Generated Validity and Other Effects of Measurement on Belief, Attitude, Intention, and Behavior.” Journal of Applied Psychology 73 (3): 421–35. https://doi.org/10.1037//0021-9010.73.3.421.Search in Google Scholar
Garvin, D. A. 1983. “Quality on the Line.” Harvard Business Review 61: 64–75.Search in Google Scholar
Gerdes, A. 2010. “Brain Activations to Emotional Pictures Are Differentially Associated with Valence and Arousal Ratings.” Frontiers in Human Neuroscience 4: 175. https://doi.org/10.3389/fnhum.2010.00175.Search in Google Scholar
Guo, F., and X. Zhang. 2020. “The Impact of Brand History on Consumers’ Cognitive Process and Brand Attitude.” Journal of Neuroscience, Psychology, and Economics 13 (4): 191–203. https://doi.org/10.1037/npe0000136.Search in Google Scholar
He, Z. 2022. “Characterizing Brand Knowledge and Identification as Predictors of Consumer-Based Brand Equity: Mediating Role of Employee-Based Brand Equity.” Frontiers in Psychology 13: 858619. https://doi.org/10.3389/fpsyg.2022.858619.Search in Google Scholar
Heitmann, M., J. R. Landwehr, T. F. Schreiner, and H. J. Van Heerde. 2020. “Leveraging Brand Equity for Effective Visual Product Design.” Journal of Marketing Research 57 (2): 257–77. https://doi.org/10.1177/0022243720904004.Search in Google Scholar
Hirschman, E. C., and M. B. Holbrook. 1982. “Hedonic Consumption: Emerging Concepts, Methods and Propositions.” Journal of Marketing 46 (3): 92. https://doi.org/10.2307/1251707.Search in Google Scholar
Höfling, T. T. A., and G. W. Alpers. 2023. “Automatic Facial Coding Predicts Self-Report of Emotion, Advertisement and Brand Effects Elicited by Video Commercials.” Frontiers in Neuroscience 17: 1125983. https://doi.org/10.3389/fnins.2023.1125983.Search in Google Scholar
Höfling, T. T. A., A. B. M. Gerdes, U. Föhl, and G. W. Alpers. 2020. “Read My Face: Automatic Facial Coding versus Psychophysiological Indicators of Emotional Valence and Arousal.” Frontiers in Psychology 11: 1388. https://doi.org/10.3389/fpsyg.2020.01388.Search in Google Scholar
Höfling, T. T. A., G. W. Alpers, A. B. M. Gerdes, and U. Föhl. 2021. “Automatic Facial Coding versus Electromyography of Mimicked, Passive, and Inhibited Facial Response to Emotional Faces.” Cognition and Emotion 35 (5): 874–89. https://doi.org/10.1080/02699931.2021.1902786.Search in Google Scholar
Höfling, T. T. A., G. W. Alpers, B. Büdenbender, U. Föhl, and A. B. M. Gerdes. 2022. “What’s in a Face: Automatic Facial Coding of Untrained Study Participants Compared to Standardized Inventories.” PLoS One 17 (3): e0263863. https://doi.org/10.1371/journal.pone.0263863.Search in Google Scholar
Holbrook, M. B., and K. P. Corfman. 1985. “Quality and Value in the Consumption Experience: Phaedrus Rides Again.” Perceived Quality 31 (2): 31–57.Search in Google Scholar
Huang, C.-C. 2017. “The Impacts of Brand Experiences on Brand Loyalty: Mediators of Brand Love and Trust.” Management Decision 55 (5): 915–34. https://doi.org/10.1108/MD-10-2015-0465.Search in Google Scholar
Husain, R., J. Paul, and B. Koles. 2022. “The Role of Brand Experience, Brand Resonance and Brand Trust in Luxury Consumption.” Journal of Retailing and Consumer Services 66: 102895. https://doi.org/10.1016/j.jretconser.2021.102895.Search in Google Scholar
Hussain, K., M. S. Fayyaz, A. Shamim, A. Z. Abbasi, S. J. Malik, and M. F. Abid. 2024. “Attitude, Repurchase Intention and Brand Loyalty toward Halal Cosmetics.” Journal of Islamic Marketing 15 (2): 293–313. https://doi.org/10.1108/JIMA-08-2022-0210.Search in Google Scholar
Hwang, J., J. Abbas, K. Joo, S.-W. Choo, and S. S. Hyun. 2022. “The Effects of Types of Service Providers on Experience Economy, Brand Attitude, and Brand Loyalty in the Restaurant Industry.” International Journal of Environmental Research and Public Health 19 (6): 3430. https://doi.org/10.3390/ijerph19063430.Search in Google Scholar
Hyun, H., J. Park, and E. Hong. 2024. “Enhancing Brand Equity through Multidimensional Brand Authenticity in the Fashion Retailing.” Journal of Retailing and Consumer Services 78: 103712. https://doi.org/10.1016/j.jretconser.2024.103712.Search in Google Scholar
Iglesias, O., J. J. Singh, and J. M. Batista-Foguet. 2011. “The Role of Brand Experience and Affective Commitment in Determining Brand Loyalty.” Journal of Brand Management 18 (8): 570–82. https://doi.org/10.1057/bm.2010.58.Search in Google Scholar
Ito, T. A., and J. T. Cacioppo. 2001. “Affect and Attitudes: A Social Neuroscience Approach.” In Handbook of Affect and Social Cognition, 50–74. Mahwah, NJ: Lawrence Erlbaum Associates Publishers.Search in Google Scholar
Jiang, H., J. Ge, and J. Yao. 2024. “Effects of Brand Spokes-Characters with Personal and Historical Nostalgia on Brand Attitude: Evidence from Generation Z Consumers in China.” Asia Pacific Journal of Marketing and Logistics 36 (1): 185–205. https://doi.org/10.1108/APJML-11-2022-0944.Search in Google Scholar
Jung, H., and M. Soo. 2012. “The Effect of Brand Experience on Brand Relationship Quality.” Academy of Marketing Studies Journal 16 (1): 87–98.Search in Google Scholar
Keller, K. L. 1993. “Conceptualizing, Measuring, and Managing Customer-Based Brand Equity.” Journal of Marketing 57 (1): 1–22. https://doi.org/10.2307/1252054.Search in Google Scholar
Keller, K. L. 2003a. “Brand Synthesis: The Multidimensionality of Brand Knowledge.” Journal of Consumer Research 29 (4): 595–600. https://doi.org/10.1086/346254.Search in Google Scholar
Keller, K. L. 2003b. “Understanding Brands, Branding and Brand Equity.” Interactive Marketing 5 (1): 7–20. https://doi.org/10.1057/palgrave.im.4340213.Search in Google Scholar
Khamitov, M., X. Wang (Shane), and M. Thomson. 2019. “How Well Do Consumer-Brand Relationships Drive Customer Brand Loyalty? Generalizations from a Meta-Analysis of Brand Relationship Elasticities.” Journal of Consumer Research 46 (3): 435–59. https://doi.org/10.1093/jcr/ucz006.Search in Google Scholar
Kim, J., J. D. Morris, and J. Swait. 2008. “Antecedents of True Brand Loyalty.” Journal of Advertising 37 (2): 99–117. https://doi.org/10.2753/JOA0091-3367370208.Search in Google Scholar
Kruger, L.-M., S. W. Kühn, D. J. Petzer, and P. G. Mostert. 2013. “Investigating Brand Romance, Brand Attitude and Brand Loyalty in the Cellphone Industry.” Acta Commercii 13 (1): 1–10. https://doi.org/10.4102/ac.v13i1.178.Search in Google Scholar
Küntzler, T., T. T. A. Höfling, and G. W. Alpers. 2021. “Automatic Facial Expression Recognition in Standardized and Non-standardized Emotional Expressions.” Frontiers in Psychology 12: 627561. https://doi.org/10.3389/fpsyg.2021.627561.Search in Google Scholar
Lee, M. S., H. D. Hsiao, and M. F. Yang. 2011. “The Study of the Relationships Among Experiential Marketing, Service Quality, Customer Satisfaction and Customer Loyalty.” International Journal of Organizational Innovation 3 (2): 353–79.Search in Google Scholar
Lissitz, R. W., and S. B. Green. 1975. “Effect of the Number of Scale Points on Reliability: A Monte Carlo Approach.” Journal of Applied Psychology 60 (1): 10–3. https://doi.org/10.1037/h0076268.Search in Google Scholar
Liu, F., J. Li, D. Mizerski, and H. Soh. 2012. “Self‐congruity, Brand Attitude, and Brand Loyalty: A Study on Luxury Brands.” European Journal of Marketing 46 (7/8): 922–37. https://doi.org/10.1108/03090561211230098.Search in Google Scholar
Marakanon, L., and V. Panjakajornsak. 2017. “Perceived Quality, Perceived Risk and Customer Trust Affecting Customer Loyalty of Environmentally Friendly Electronics Products.” Kasetsart Journal of Social Sciences 38 (1): 24–30. https://doi.org/10.1016/j.kjss.2016.08.012.Search in Google Scholar
Massi, M., C. Piancatelli, and A. Vocino. 2023. “Authentic Omnichannel: Providing Consumers with a Seamless Brand Experience through Authenticity.” Psychology and Marketing 40 (7): 1280–98. https://doi.org/10.1002/mar.21815.Search in Google Scholar
McClure, S. M., J. Li, D. Tomlin, K. S. Cypert, L. M. Montague, and P. R. Montague. 2004. “Neural Correlates of Behavioral Preference for Culturally Familiar Drinks.” Neuron 44 (2): 379–87. https://doi.org/10.1016/j.neuron.2004.09.019.Search in Google Scholar
Mitchell, A. A., and J. C. Olson. 1981. “Are Product Attribute Beliefs the Only Mediator of Advertising Effects on Brand Attitude?” Journal of Marketing Research 18 (3): 318–32. https://doi.org/10.2307/3150973.Search in Google Scholar
Møller Jensen, J., and T. Hansen. 2006. “An Empirical Examination of Brand Loyalty.” Journal of Product & Brand Management 15 (7): 442–9. https://doi.org/10.1108/10610420610712829.Search in Google Scholar
Mostafa, R. B., and T. Kasamani. 2020. “Brand Experience and Brand Loyalty: Is it a Matter of Emotions?” Asia Pacific Journal of Marketing and Logistics 33 (4): 1033–51. https://doi.org/10.1108/APJML-11-2019-0669.Search in Google Scholar
Munten, P., and J. Vanhamme. 2023. “To Reduce Waste, Have it Repaired! the Quality Signaling Effect of Product Repairability.” Journal of Business Research 156: 113457. https://doi.org/10.1016/j.jbusres.2022.113457.Search in Google Scholar
Nguyen, B., T. C. Melewar, and J. Chen. 2013. “A Framework of Brand Likeability: An Exploratory Study of Likeability in Firm-Level Brands.” Journal of Strategic Marketing 21 (4): 368–90. https://doi.org/10.1080/0965254X.2013.790472.Search in Google Scholar
Nguyen, B., M. M. Choudhury, and T. C. Melewar. 2015. “An Integrated Model of Firms’ Brand Likeability: Antecedents and Consequences.” Journal of Strategic Marketing 23 (2): 122–40. https://doi.org/10.1080/0965254X.2014.914071.Search in Google Scholar
Nysveen, H., and P. E. Pedersen. 2014. “Influences of Cocreation on Brand Experience.” International Journal of Market Research 56 (6): 807–32. https://doi.org/10.2501/IJMR-2014-016.Search in Google Scholar
Oliveira, M. O. R. D., R. Heldt, C. S. Silveira, and F. B. Luce. 2023. “Brand Equity Chain and Brand Equity Measurement Approaches.” Marketing Intelligence & Planning 41 (4): 442–56. https://doi.org/10.1108/MIP-06-2022-0222.Search in Google Scholar
Oliver, R. L. 1999. “Whence Consumer Loyalty?” Journal of Marketing 63: 33–44. https://doi.org/10.2307/1252099.Search in Google Scholar
Olsen, S. O. 2002. “Comparative Evaluation and the Relationship between Quality, Satisfaction, and Repurchase Loyalty.” Journal of the Academy of Marketing Science 30 (3): 240–9. https://doi.org/10.1177/0092070302303005.Search in Google Scholar
Omoregie, O. K., J. A. Addae, S. Coffie, G. O. A. Ampong, and K. S. Ofori. 2019. “Factors Influencing Consumer Loyalty: Evidence from the Ghanaian Retail Banking Industry.” International Journal of Bank Marketing 37 (3): 798–820. https://doi.org/10.1108/IJBM-04-2018-0099.Search in Google Scholar
Pappu, R., P. G. Quester, and R. W. Cooksey. 2005. “Consumer-based Brand Equity: Improving the Measurement – Empirical Evidence.” Brand Management 14 (3): 143–54. https://doi.org/10.1108/10610420510601012.Search in Google Scholar
Park, C. W., D. J. Macinnis, J. Priester, A. B. Eisingerich, and D. Iacobucci. 2010. “Brand Attachment and Brand Attitude Strength: Conceptual and Empirical Differentiation of Two Critical Brand Equity Drivers.” Journal of Marketing 74 (6): 1–17. https://doi.org/10.1509/jmkg.74.6.1.Search in Google Scholar
Pina, R., and Á. Dias. 2021. “The Influence of Brand Experiences on Consumer-Based Brand Equity.” Journal of Brand Management 28 (2): 99–115. https://doi.org/10.1057/s41262-020-00215-5.Search in Google Scholar
Pine, B. J., and J. H. Gilmore. 1998. “Welcome to the Experience Economy.” Harvard Business Review 76 (4): 97–105.Search in Google Scholar
Plassmann, H., T. Z. Ramsøy, and M. Milosavljevic. 2012. “Branding the Brain: A Critical Review and Outlook.” Journal of Consumer Psychology 22 (1): 18–36. https://doi.org/10.1016/j.jcps.2011.11.010.Search in Google Scholar
Pohl, R. F., E. Erdfelder, B. E. Hilbig, L. Liebke, and D. Stahlberg. 2013. “Effort Reduction after Self-Control Depletion: The Role of Cognitive Resources in Use of Simple Heuristics.” Journal of Cognitive Psychology 25 (3): 267–76. https://doi.org/10.1080/20445911.2012.758101.Search in Google Scholar
Prasadh, R. R. 2018. “Examining the Roles of Perceived Quality and Customer Satisfaction as Predictors of Customer Loyalty in the Indian E-Banking Context.” Journal of Management Research 18 (3): 176–87.Search in Google Scholar
Rafiq, M. R., R. I. Hussain, and S. Hussain. 2020. “The Impact of Logo Shapes Redesign on Brand Loyalty and Repurchase Intentions through Brand Attitude.” International Review of Management and Marketing 10 (5): 117–26. https://doi.org/10.32479/irmm.10308.Search in Google Scholar
Rajumesh, S. 2014. “The Impact of Consumer Experience on Brand Loyalty: The Mediating Role of Brand Attitude.” International Journal of Management and Social Sciences Research 3 (1): 73–9.Search in Google Scholar
Ramaseshan, B., and A. Stein. 2014. “Connecting the Dots between Brand Experience and Brand Loyalty: The Mediating Role of Brand Personality and Brand Relationships.” Journal of Brand Management 21 (7–8): 664–83. https://doi.org/10.1057/bm.2014.23.Search in Google Scholar
Robertson, J., E. Botha, C. Ferreira, and L. Pitt. 2022. “How Deep Is Your Love? the Brand Love-Loyalty Matrix in Consumer-Brand Relationships.” Journal of Business Research 149: 651–62. https://doi.org/10.1016/j.jbusres.2022.05.058.Search in Google Scholar
Rodrigues, P., and F. V. Martins. 2016. “Perceptual and Behavioural Dimensions: Measuring Brand Equity Consumer Based.” Journal of Fashion Marketing and Management: An International Journal 20 (4): 507–19. https://doi.org/10.1108/JFMM-03-2016-0019.Search in Google Scholar
Rubinson, J., and A. L. Baldinger. 1996. “Brand Loyalty: The Link between Attitude and Behavior.” Journal of Advertising Research 36 (6): 24–34.10.1080/00218499.1996.12466634Search in Google Scholar
Sahin, A., C. Zehir, and H. Kitapçı. 2011. “The Effects of Brand Experiences, Trust and Satisfaction on Building Brand Loyalty; an Empirical Research on Global Brands.” Procedia - Social and Behavioral Sciences 24: 1288–301. https://doi.org/10.1016/j.sbspro.2011.09.143.Search in Google Scholar
Sankaran, R., and S. Chakraborty. 2023. “Measuring Consumer Perception of Overall Brand Equity Drivers for M-Payments.” International Journal of Bank Marketing 41 (1): 130–57. https://doi.org/10.1108/IJBM-03-2022-0113.Search in Google Scholar
Saragih, M. G., E. D. Surya, S. Rahayu, H. Harianto, R. Harahap, and S. Widodo. 2019. “Analysis of Brand Experience and Brand Satisfaction with Brand Loyalty through Brand Trust as A Variable Mediation.” Journal of International Conference Proceedings 2 (3): 139–48. https://doi.org/10.32535/jicp.v2i3.655.Search in Google Scholar
Sharawneh, T. 2020. “Social Media Marketing Activities and Brand Loyalty in the Telecommunication Industry: The Mediating Role of Brand Affect.” Journal of Innovations in Digital Marketing 1 (1): 1–10. https://doi.org/10.51300/jidm-2020-11.Search in Google Scholar
Shiv, B., Z. Carmon, and D. Ariely. 2005. “Placebo Effects of Marketing Actions: Consumers May Get what They Pay for.” Journal of Marketing Research 42 (4): 383–93. https://doi.org/10.1509/jmkr.2005.42.4.383.Search in Google Scholar
Slovic, P., M. L. Finucane, E. Peters, and D. G. MacGregor. 2007. “The Affect Heuristic.” European Journal of Operational Research 177 (3): 1333–52. https://doi.org/10.1016/j.ejor.2005.04.006.Search in Google Scholar
Snoj, B., A. Pisnik Korda, and D. Mumel. 2004. “The Relationships Among Perceived Quality, Perceived Risk and Perceived Product Value.” Journal of Product & Brand Management 13 (3): 156–67. https://doi.org/10.1108/10610420410538050.Search in Google Scholar
Spears, N., and S. N. Singh. 2004. “Measuring Attitude toward the Brand and Purchase Intentions.” Journal of Current Issues and Research in Advertising 26 (2): 53–66. https://doi.org/10.1080/10641734.2004.10505164.Search in Google Scholar
Szymanski, D. M., and D. H. Henard. 2001. “Customer Satisfaction: A Meta-Analysis of the Empirical Evidence.” Journal of the Academy of Marketing Science 29 (1): 16–35. https://doi.org/10.1177/0092070301291002.Search in Google Scholar
Tasci, A. D. A. 2021. “A Critical Review and Reconstruction of Perceptual Brand Equity.” International Journal of Contemporary Hospitality Management 33 (1): 166–98. https://doi.org/10.1108/IJCHM-03-2020-0186.Search in Google Scholar
Thomson, M., D. J. MacInnis, and C. Whan Park. 2005. “The Ties that Bind: Measuring the Strength of Consumers’ Emotional Attachments to Brands.” Journal of Consumer Psychology 15 (1): 77–91. https://doi.org/10.1207/s15327663jcp1501_10.Search in Google Scholar
Tian, Y., T. J. Chan, N. M. Suki, and M. A. Kasim. 2023. “Moderating Role of Perceived Trust and Perceived Service Quality on Consumers’ Use Behavior of Alipay E-Wallet System: The Perspectives of Technology Acceptance Model and Theory of Planned Behavior.” Human Behavior and Emerging Technologies 2023: 1–14. https://doi.org/10.1155/2023/5276406.Search in Google Scholar
Tong, X., and J. M. Hawley. 2009. “Measuring Customer‐based Brand Equity: Empirical Evidence from the Sportswear Market in China.” Journal of Product & Brand Management 18 (4): 262–71. https://doi.org/10.1108/10610420910972783.Search in Google Scholar
Tseng, Y. M., B. C. Liao, and Y. S. Jan. 2004. “The Study of Relation between Product Value, Brand Trust, Brand Affect and Brand Loyalty.” Journal of Business Administration 61 (3): 29–50.Search in Google Scholar
Van Rij, J., M. Wieling, R. H. Baayen, and H. Van Rijn. 2017. Itsadug: Interpreting Time Series and Autocorrelated Data Using GAMMs. R Package Version, 2.Search in Google Scholar
Vazifehdoost, H., and A. Negahdari. 2018. “Relationships of Brand Awareness, Brand Association and Perceived Quality with Brand Loyalty and Repurchase Intention.” Case Studies Journal 7 (1): 45–51.Search in Google Scholar
Walsh, G., V.-W. Mitchell, and T. Hennig-Thurau. 2001. “German Consumer Decision-Making Styles.” Journal of Consumer Affairs 35 (1): 73–95. https://doi.org/10.1111/j.1745-6606.2001.tb00103.x.Search in Google Scholar
Walter, N., T. Cleff, and G. Chu. 2013. “Brand Experiences Influence on Customer Satisfaction and Loyalty: A Mirage in Marketing Research?” International Journal of Management Research and Business Strategy 2 (1): 130–44.Search in Google Scholar
Washburn, J. H., and R. E. Plank. 2002. “Measuring Brand Equity: An Evaluation of a Consumer-Based Brand Equity Scale.” Journal of Marketing Theory and Practice 10 (1): 46–62. https://doi.org/10.1080/10696679.2002.11501909.Search in Google Scholar
Wood, S. N. 2006. “Low-Rank Scale-Invariant Tensor Product Smooths for Generalized Additive Mixed Models.” Biometrics 62 (4): 1025–36. https://doi.org/10.1111/j.1541-0420.2006.00574.x.Search in Google Scholar
Wood, S. N., and F. Scheipl. 2020. “Package ‘gamm4’.”Search in Google Scholar
Wood, S. N., F. Scheipl, and J. J. Faraway. 2013. “Straightforward Intermediate Rank Tensor Product Smoothing in Mixed Models.” Statistics and Computing 23 (3): 341–60. https://doi.org/10.1007/s11222-012-9314-z.Search in Google Scholar
Wu, R., E. D. Shah, and F. R. Kardes. 2020. ““The Struggle Isn’t Real”: How Need for Cognitive Closure Moderates Inferences from Disfluency.” Journal of Business Research 109: 585–94. https://doi.org/10.1016/j.jbusres.2019.03.042.Search in Google Scholar
Wulandari, N. 2016. “Brand Experience in Banking Industry:Direct and Indirect Relationship to Loyalty.” Expert Journal of Marketing 4 (1): 1–9.Search in Google Scholar
Yoo, B., and N. Donthu. 2001. “Developing and Validating a Multidimensional Consumer-Based Brand Equity Scale.” Journal of Business Research 52 (1): 1–14. https://doi.org/10.1016/S0148-2963(99)00098-3.Search in Google Scholar
Zaltman, G. 2003. How Customers Think: Essential Insights into the Mind of the Market. Boston, MA: Harvard Business Press.Search in Google Scholar
Zarantonello, L., and B. H. Schmitt. 2010. “Using the Brand Experience Scale to Profile Consumers and Predict Consumer Behaviour.” Journal of Brand Management 17 (7): 532–40. https://doi.org/10.1057/bm.2010.4.Search in Google Scholar
Zeithaml, V. A. 1988. “Consumer Perceptions of Price, Quality, and Value: A Means-End Model and Synthesis of Evidence.” Journal of Marketing 52 (3): 2–22. https://doi.org/10.1177/002224298805200302.Search in Google Scholar
Zhang, Y., and J. Zhang. 2021. “The Role of Psychological Contract Violation in Shaping Spurious Loyalty.” Marketing Intelligence & Planning 39 (6): 792–808. https://doi.org/10.1108/MIP-01-2021-0008.Search in Google Scholar
Supplementary Material
This article contains supplementary material (https://doi.org/10.1515/roms-2024-0005).
© 2024 the author(s), published by De Gruyter, Berlin/Boston
This work is licensed under the Creative Commons Attribution 4.0 International License.
Articles in the same Issue
- Frontmatter
- Articles
- Personal Innovation, Optimism, Electronic Word of Mouth, and Perceived Factors Affect the Behavioral Intention to Adopt QR Code Payments
- What I Like! The Joint Impact of Attitude, Perceived Quality, and Experience on Brand Loyalty: Semi-Parametric Additive Mixed Modeling
- Evaluation of Consumer Masstige Brand Relationship Between Generations
- Changing Preferences Toward Autonomous Products: Exploring the Roles of Involvement and Temporal Distance to Purchase
- Maximizing the Consumer Connection: Avatars, Emotions, and Effective Virtual Influencer Advertising
- Evaluating the Resident Support for Cultural Tourism Through a Revised Social Exchange Theory Approach
- How to Design Keywords in Search Engine Advertising: A Multi-group Comparison Based on the Search Volume of the Product Type
- Key Determinants of Successful Advertising in the Context of SMEs: An Empirical Analysis in Ecuador
- Fine Dining and Masstige Consumption: Examining the Role of Brand Experience, Trust, and Happiness Using PLS-SEM and ANN Analysis
- Positive Affecter and the Path to Green Gamified Banking: Unveiling the Mediation effect of E-banking Services
- Overcoming High Dimensionality: A Case of Consumer Anarchism
- The Humanity Paradox: Unraveling the Power of Animosity in Leading Boycotts – Evidence from Egypt
- Frugality Can Be Central to Product Success: A View of Frugal Innovation, Perceived Value, and Purchase Intention
- Enhancing the Customer’s Purchase Intention Through Strategic e-WOM Credibility
- The Model of Student-University Relationship Development: The Role of University Brand Love