Green novel photometric and planar chromatographic assays of remdesivir: Comparative greenness assessment study using estimated GAPI tool versus ISO technical reported methods
-
Miranda F. Kamal
 ,
Mona M. Abdel Moneim
,
Mona M. Abdel Moneim

Abstract
Green assessment of analytical procedures has become an environmental obligation in equivalence to their International Council of Harmonization analytical validation obligation. Worldwide awareness of our planet and ecological hazards have raised the shades of green and sustainable chemistry in pure or formulated API assays. The Green Analytical Procedure Index (GAPI) is instant five pentagrams for evaluating the greenness of each step in the developed analytical procedure, in discriminative colors: green, yellow, and red. In the present study, GAPI is applied to assess three novel direct analytical methods: spectrophotometric, fluorimetric, and high-performance thin-layer chromatography (HPTLC) for remdesivir (RDV) quantitation, both in bulk and pharmaceutical vials. Furthermore, a comparative green level calculated GAPI study has been assembled for the proposed methods versus the previously reported methods, for RDV assay, of similar techniques. Spectrophotometric direct Amax method at 240 nm, fluorimetric emission at 404 nm upon excitation at 275 nm as well as the HPTLC densitometric measurement using ethanol and distilled water (7:3, v/v) as mobile phase, all three methodologies are developed, optimized, and fully validated for RDV quantitation. They have been applied to assay RDV pharmaceutical vials and results are compared together with a one-way ANOVA test. Satisfactory recoveries and nano-level sensitivities in addition to the least standard deviations encourage the use of developed methods for routine analysis in quality control laboratories. Their promising greenness profile satisfies the beliefs of ecological sustainability of Green Agenda 2030.
1 Introduction
On October 22, 2020, the Food & Drug Administration (FDA) authorized the use of Vecklury® (Remdesivir) as a Covid-19 antiviral therapeutic agent in hospitalized patients (age ≥ 12 years; weight ≥ 40 kg). Gilead Sciences Inc. won the first FDA approval for Covid-19 in-patient hospital care treatment after data analysis from several clinical trials assessed by the agency since this worldwide pandemic started the “Corona virus Treatment Acceleration Program.” Three clinical studies for Covid-19, hospitalized, mild-to-severe, patients were the main support evidence [1,2,3].
Remdesivir (RDV), Remdésivir, or Remdesivirum, chemically coded GS-5734, is an adenosine triphosphate analogue, first liberated in 2016, used for Ebola treatment. RDV has wide RNA polymerase antiviral activity which is in vitro active against many viral families such as Arenaviridae, Flaviridae, Filoviridae, Paramyxovridae, Pneumoviridae, and Coronaviridae. In 2017, RDV activity against Coronaviridaes was demonstrated, which led to interest as a possible anti-Covid-19. RDV was confirmed as a non-obligate chain terminator of RNA-dependent RNA polymerase (RdRp) from severe acute respiratory syndrome Coronavirus 2 (SARS-CoV-2) and the related severe acute respiratory syndrome Coronavirus (SARS-CoV) and middle east respiratory syndrome Coronavirus (MERS-CoV) [4,5,6].
RDV, C27H35N6O8P has high molecular mass of 602,585, of chemical structure as shown in Figure 1 with IUPAC name 2-ethylbutyl (2S)-2-[[[(2R,3S,4R,5R)-5-(4-aminopyrrolo[2,1-f][1,2,4]triazin-7-yl)-5-cyano-3,4-dihydroxyoxolan-2-yl] methoxy-phenoxyphosphoryl]amino]propanoate. RDV has log P 2.01 and pK a (strongest acid) of 10.23. It is in the form of white to yellowish non-hygroscopic powder, practically water-insoluble, but soluble in ethanol and DMSO [5].
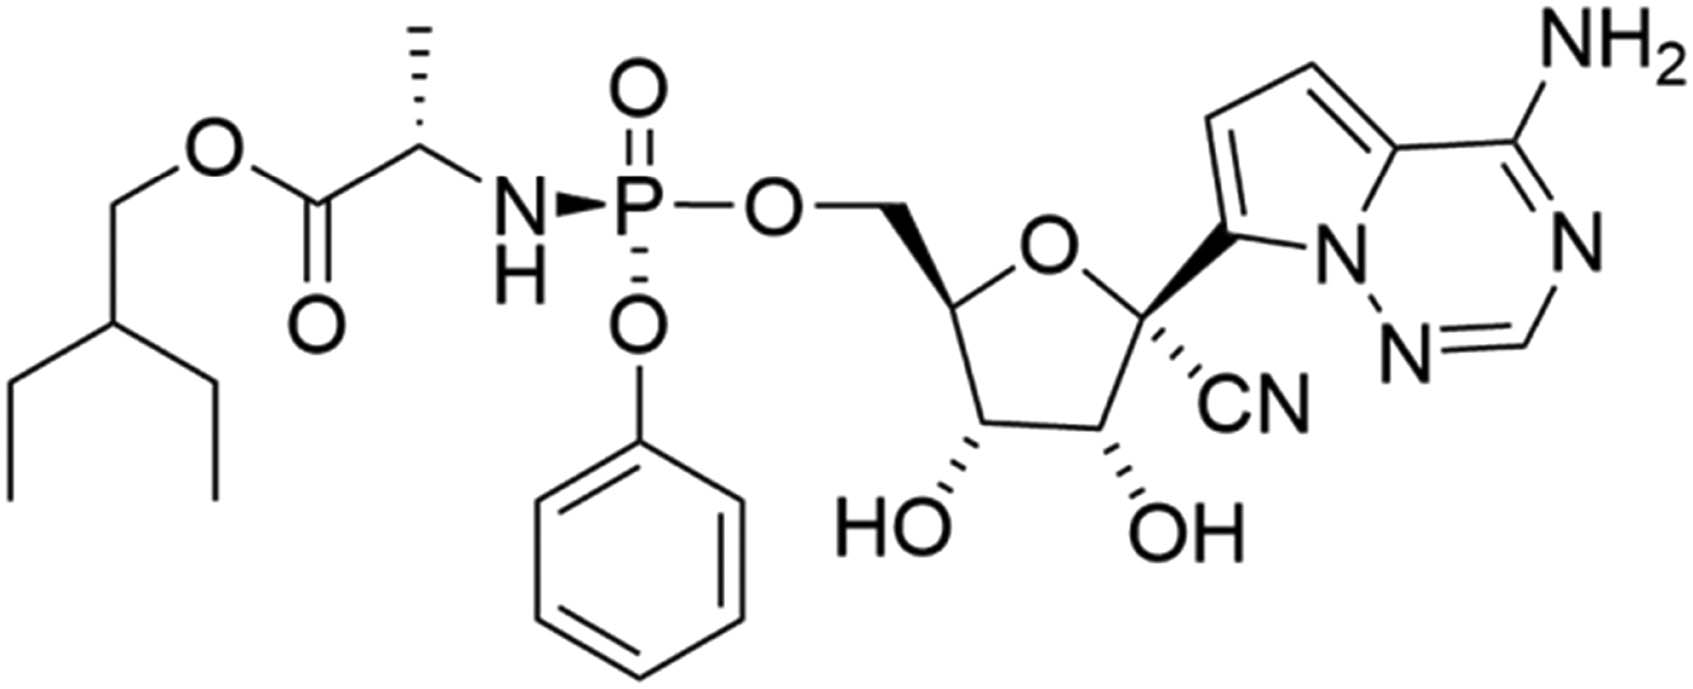
Chemical structure of RDV.
Covid-19 is caused by an RNA virus called SARS-CoV-2. The key step in any RNA virus infectious cycle is genome replication which is carried out by viral RNA polymerase enzymes. RDV is a prodrug. It is a phosphodiester of a 1′-cyano-substituted adenosine nucleotide analogue. It acts by ATP competing in the new viral RNA synthesis. RDV enters cells before being cleaved to its monophosphate form and is subsequently phosphorylated to active RDV triphosphate (RDV-TP) chemically coded GS-443902 [7,8].
Eco-evaluation of novel methods aims to minimize the negative environmental impact of chemical analyses by addressing critical issues such as the generation of toxic laboratory waste and the use of solvents and reagents that are hazardous to human health or the environment.
RDV absorption is quite rapid where the maximal plasma concentrations following a single 30-min intravenous infusion are reached within 0.67–0.68 h (T max). RDV metabolite GS-441524 possesses T max of 1.51–2.00 h. RDV metabolism occurs in the host cell. As a phosphoramidate prodrug, RDV is therapeutically activated by hydrolysis to its triphosphate metabolite. Meanwhile, RDV elimination is mainly through urine 74% and feces 18%. Almost half of the recovered dose is the active metabolite GS-441524. Data regarding RDV contraindications, distribution volume, clearance, and toxicity are still under investigation [5].
The literature review lacks a green analytical method for RDV assay in its pharmaceutical dosage form and it reveals two LC-MS/MS studies for RDV and its metabolite quantification in plasma fluid [9,10]. Besides, the simultaneous determination of RDV with commonly co-administered therapeutic agents in spiked plasma samples [11]. The present work represents three analytical methods: UV-spectrophotometric, fluorimetric, and high-performance thin-layer chromatography (HPTLC) procedures, for RDV determination in bulk and pharmaceutical formulation. They have been developed and fully validated according to the guidelines of the International Council of Harmonization (ICH) [12] and United States Pharmacopeia [13]. The sensitivities of the developed methods are quite analogous to that declared in MS-detected methods [9,10], in addition to their simplicity, sensitivity, and greenness compared to the recent HPTLC method for the assay of RDV with favipiravir [14] and fluorimetric method [15].
2 Materials and methods
2.1 Instrumentation and tools
2.1.1 UV/VIS spectrophotometer
A thermo-spectronic UV-Vis spectrophotometer connected to the Harvest computer system was used. Absorption spectra were measured in 1 cm quartz cells. Data was processed using Excel software.
2.1.2 Spectrofluorimeter
Perkin-Elmer LS 45 luminescence spectrometer, equipped with a 1 cm quartz cell. It was interfaced to a computer loaded with FL Winlab software.
2.1.3 HPTLC instrumentation
HPTLC plates (20 cm × 10 cm) of 250 mm thickness precoated with silica gel 60 (F254) (E. Merck, Germany) were used. Samples were injected on the plates with a 100 µL microsyringe (Camag, Switzerland) as bands, using a Camag Linomat IV (Switzerland) applicator. Slit dimension: 6 mm × 0.2 mm and scanning speed: 20 mm·s−1 were used. The mobile phase was developed ascendingly inside a 20 cm × 10 cm twin trough chamber (Camag, Switzerland) followed by densitometric scanning by a deuterium lamp at 240 nm, using a Camag TLC scanner (III) operated in the reflectance–absorbance mode and controlled by CAMAG CATS software (V 3.15) (CAMAG, Muttenz, Switzerland).
2.1.4 Supporting tools
A Sartorius Analytical Balance to weigh the solid materials and a Jenway 3310 pH meter calibrated with standard buffers of pH 4 and 7 at room temperature were used.
2.2 Materials and reagents
RDV (99.38% purity) was obtained from Selleckchem (Selleck, Houston, USA). Remdesivir-Eva Pharma® injection vials (Eva Pharma, Cairo, Egypt) labeled to contain 5 mg·mL−1 RDV were purchased from the commercial market.
Analytical-grade reagents were used. Absolute ethanol was purchased from Merck (Darmstadt, Germany). In-house double-distilled water (filtered through a 0.45 μm millipore membrane) was used throughout the study.
2.3 Preparation of standard drug solutions
Standard stock solution, 800 μg·mL−1 RDV, was prepared in ethanol solvent. For complete solubility, the solution was warmed at 37°C and shaken in an ultrasonic bath for 10 min. The prepared stock solution could be stored below −20°C for several months. Working standards, for each method, were prepared by further dilution using ethanol.
2.4 Calibration curves
Accurate aliquots from the prepared working solutions were transferred into three sets of 10 mL volumetric flasks. Ethanol was made up to mark in all flasks, to give final concentrations, to be measured as stated in Table 1. Calibration curves and regression equations for each method were constructed where the responses (absorbance A, relative fluorescence intensity [RFI], or peak areas) were plotted versus RDV concentrations.
Characteristic parameters for the regression equations of the proposed methods for the determination of RDV
| Parameters | Method I (spectrophotometry) | Method II (spectrofluorimetry) | Method III (HPTLC) |
|---|---|---|---|
| Linearity range | 1.5–15.0a | 1.0–40.0b | 0.15–5.0c |
| LOQ | 1.08 | 0.42 | 0.09 |
| LOD | 0.36 | 0.14 | 0.03 |
| Intercept (a) | 1.65 × 10⁻¹ | 37.33 | 1,780.08 |
| Slope (b) | 5.16 × 10⁻² | 57.36 | 130.41 |
| Correlation coefficient (r) | 0.9998 | 0.9999 | 0.9990 |
| Standard deviation of intercept (S a) | 5.55 × 10⁻³ | 1.86 | 41.24 |
| Standard deviation of slope (S b) | 6.14 × 10⁻⁴ | 0.04 | 3.35 |
| Standard deviation of residuals (S y/x) | 6.27 × 10⁻³ | 2.13 | 48.01 |
| F | 7,049.67 | 16,425.95 | 1,512.48 |
| Significance F | 3.72 × 10⁻⁶ | 1.05 × 10⁻⁶ | 3.74 × 10⁻⁵ |
aµg·mL−1.
bng·mL−1.
cµg·band−1.
2.5 Preparation of pharmaceutical formulation
As per instructed dosing and administration, two vials, each claimed to contain 100 mg RDV (total 200 mg), are reconstituted with a 0.9% saline infusion bag to volume 250 mL. The prepared stock solution (800 μg·mL−1) is further diluted with absolute ethanol to give a working solution for method application.
2.6 Procedures
2.6.1 Method I: Spectrophotometric method
For spectrophotometric determinations, direct measurement of absorbance readings A at λ max 240 nm was performed.
2.6.2 Method II: Spectrofluorimetric method
For spectrofluorimetric analysis, the RFI at λ em = 404 nm, upon excitation at λ ex = 275 nm, was found to be linear with RDV concentration and was used for its quantitation.
2.6.3 Method III: HPTLC method
Optimized separation and microdetermination entailed RDV standard and sample application, in bands rather than spots, onto thin-layer chromatography (TLC) plates. A volume of 10 μL sample was introduced in a space of 5 mm bandwidth. The injected bands were 4 mm apart and 15 mm away from the plate bottom. After a 30 min saturation with the mobile phase, pure ethanol and distilled water (7:3, v/v), were applied before development. The plate was developed for 10 min in an ascending mode, followed by air-drying for another 10 min. Plate scanning was made at 240 nm under the conditions mentioned in HPTLC instrumentation.
3 Results and discussion
RDV has been assayed using three different analytical techniques with no sample pretreatment and minimal analysis steps. Parameters governing each method have been studied and optimized for maximum selectivity and sensitivity. All validation elements have been considered [12,13]. Each method has been applied to pharmaceutical dosage forms.
3.1 Spectrophotometric assays
Usually, spectrophotometric assays involve using chemometric and/or mathematical treatment (e.g., derivative, Fourier convolution) of the readings to resolve multi-component systems [16,17,18]. However, a single-component assay of RDV was easily achieved using direct measurements in absolute ethanol with the required sensitivity with no further treatment.
3.1.1 Spectrophotometric method
RDV solution was scanned throughout the UV range (190–400 nm), and it showed two maxima, λ max at 240 and 275 nm (Figure 2). A higher and more distinctive peak of 240 nm maximum was chosen, rather than a 275 nm shoulder peak. Direct measurement of RDV using the A max method at 240 nm was carried out. Absorbance readings were linear and reproducible with acceptable sensitivity.

Absorption curve of 10 µg·mL−1 RDV standard solution in ethanol (λ max; 240 nm).
3.1.2 Spectrofluorimetric method
RDV solution was scanned for its excitation and emission spectra (Figure 3). It showed high RFI at λ em = 404 nm, upon excitation at λ ex = 275 nm.
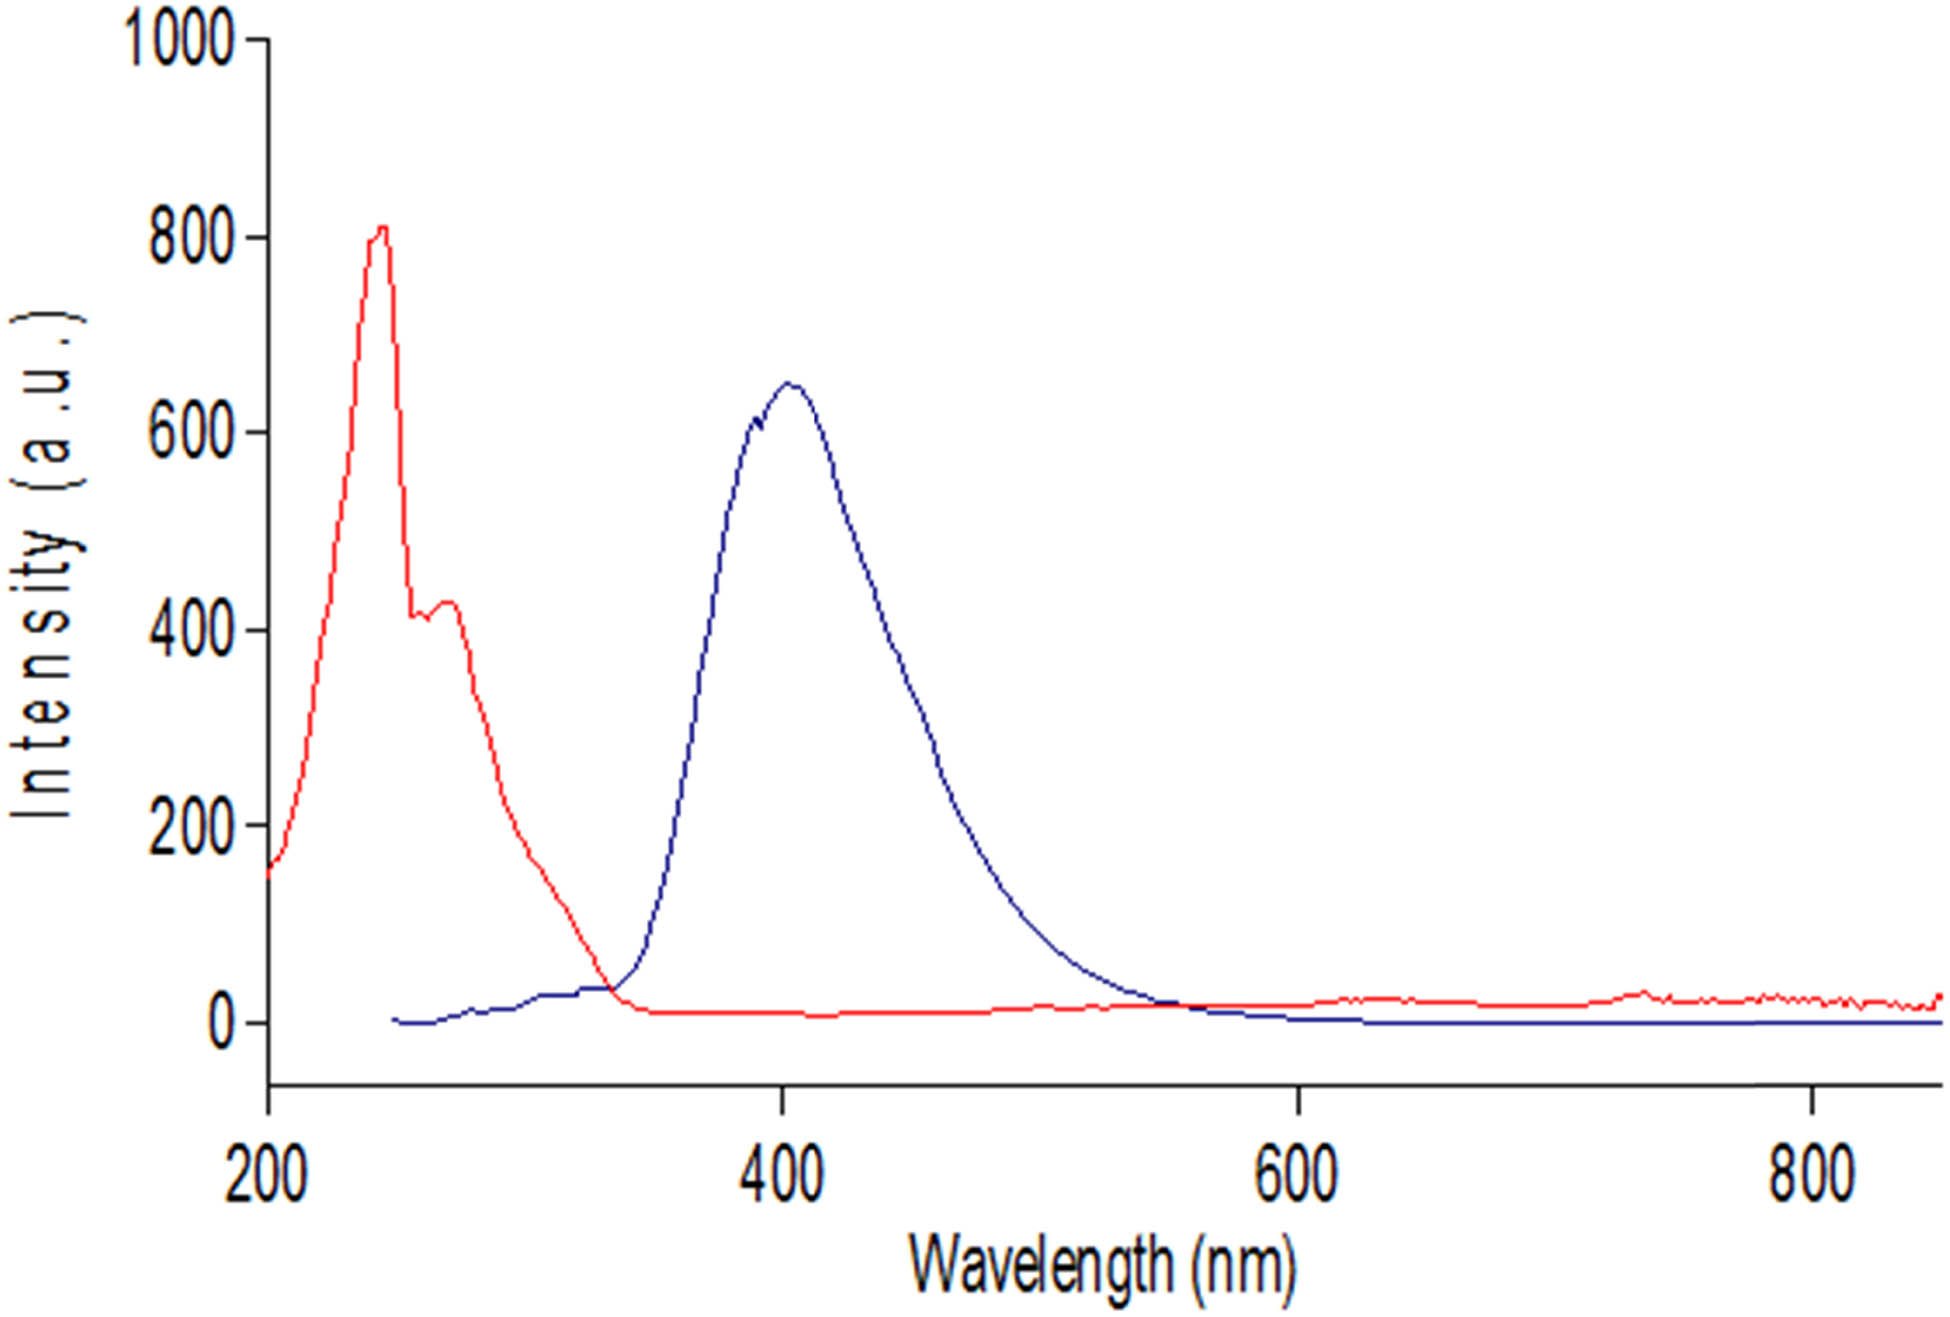
Excitation and emission spectra of 30 ng·mL−1 RDV standard solution in ethanol (λ ex and λ em at 275 and 404 nm, respectively).
3.1.3 Effect of diluting solvents
The type of solvent used has been proven to impact greatly on the A and/or RFI readings as has been investigated in previous assays [19]. Thus, different diluting solvents were used to reach the highest A or RFI values of RDV with low blank readings. Methanol, ethanol, water, aqueous sodium hydroxide (0.1 N), and aqueous hydrochloric acid (0.1 N) were all tried. As shown in Figure A1, NaOH caused a hyperchromic effect in the A reading. However, it was noticed that it caused a rapid kinetic decrease in the A reading with time due to the degradation of RDV in the basic medium. Thus, ethanol was used as it gave high yet, stable A readings. Similarly, for fluorimetric measurements, absolute ethanol was the solvent of choice as it gave the highest and most stable RFI for RDV emissions (Figure A1).
3.2 Chromatographic assay: HPTLC method
In previous years, HPTLC proved to be a versatile analytical tool used for the separation of complex mixtures with a minimum amount of solvents and with the advantage of analyzing multiple samples in one run [18,20]. The RDV optimal separation at R f (0.85 ± 0.05) was achieved using ethanol and distilled water (7:3, v/v, respectively) at 240 nm as shown in Figure 4.
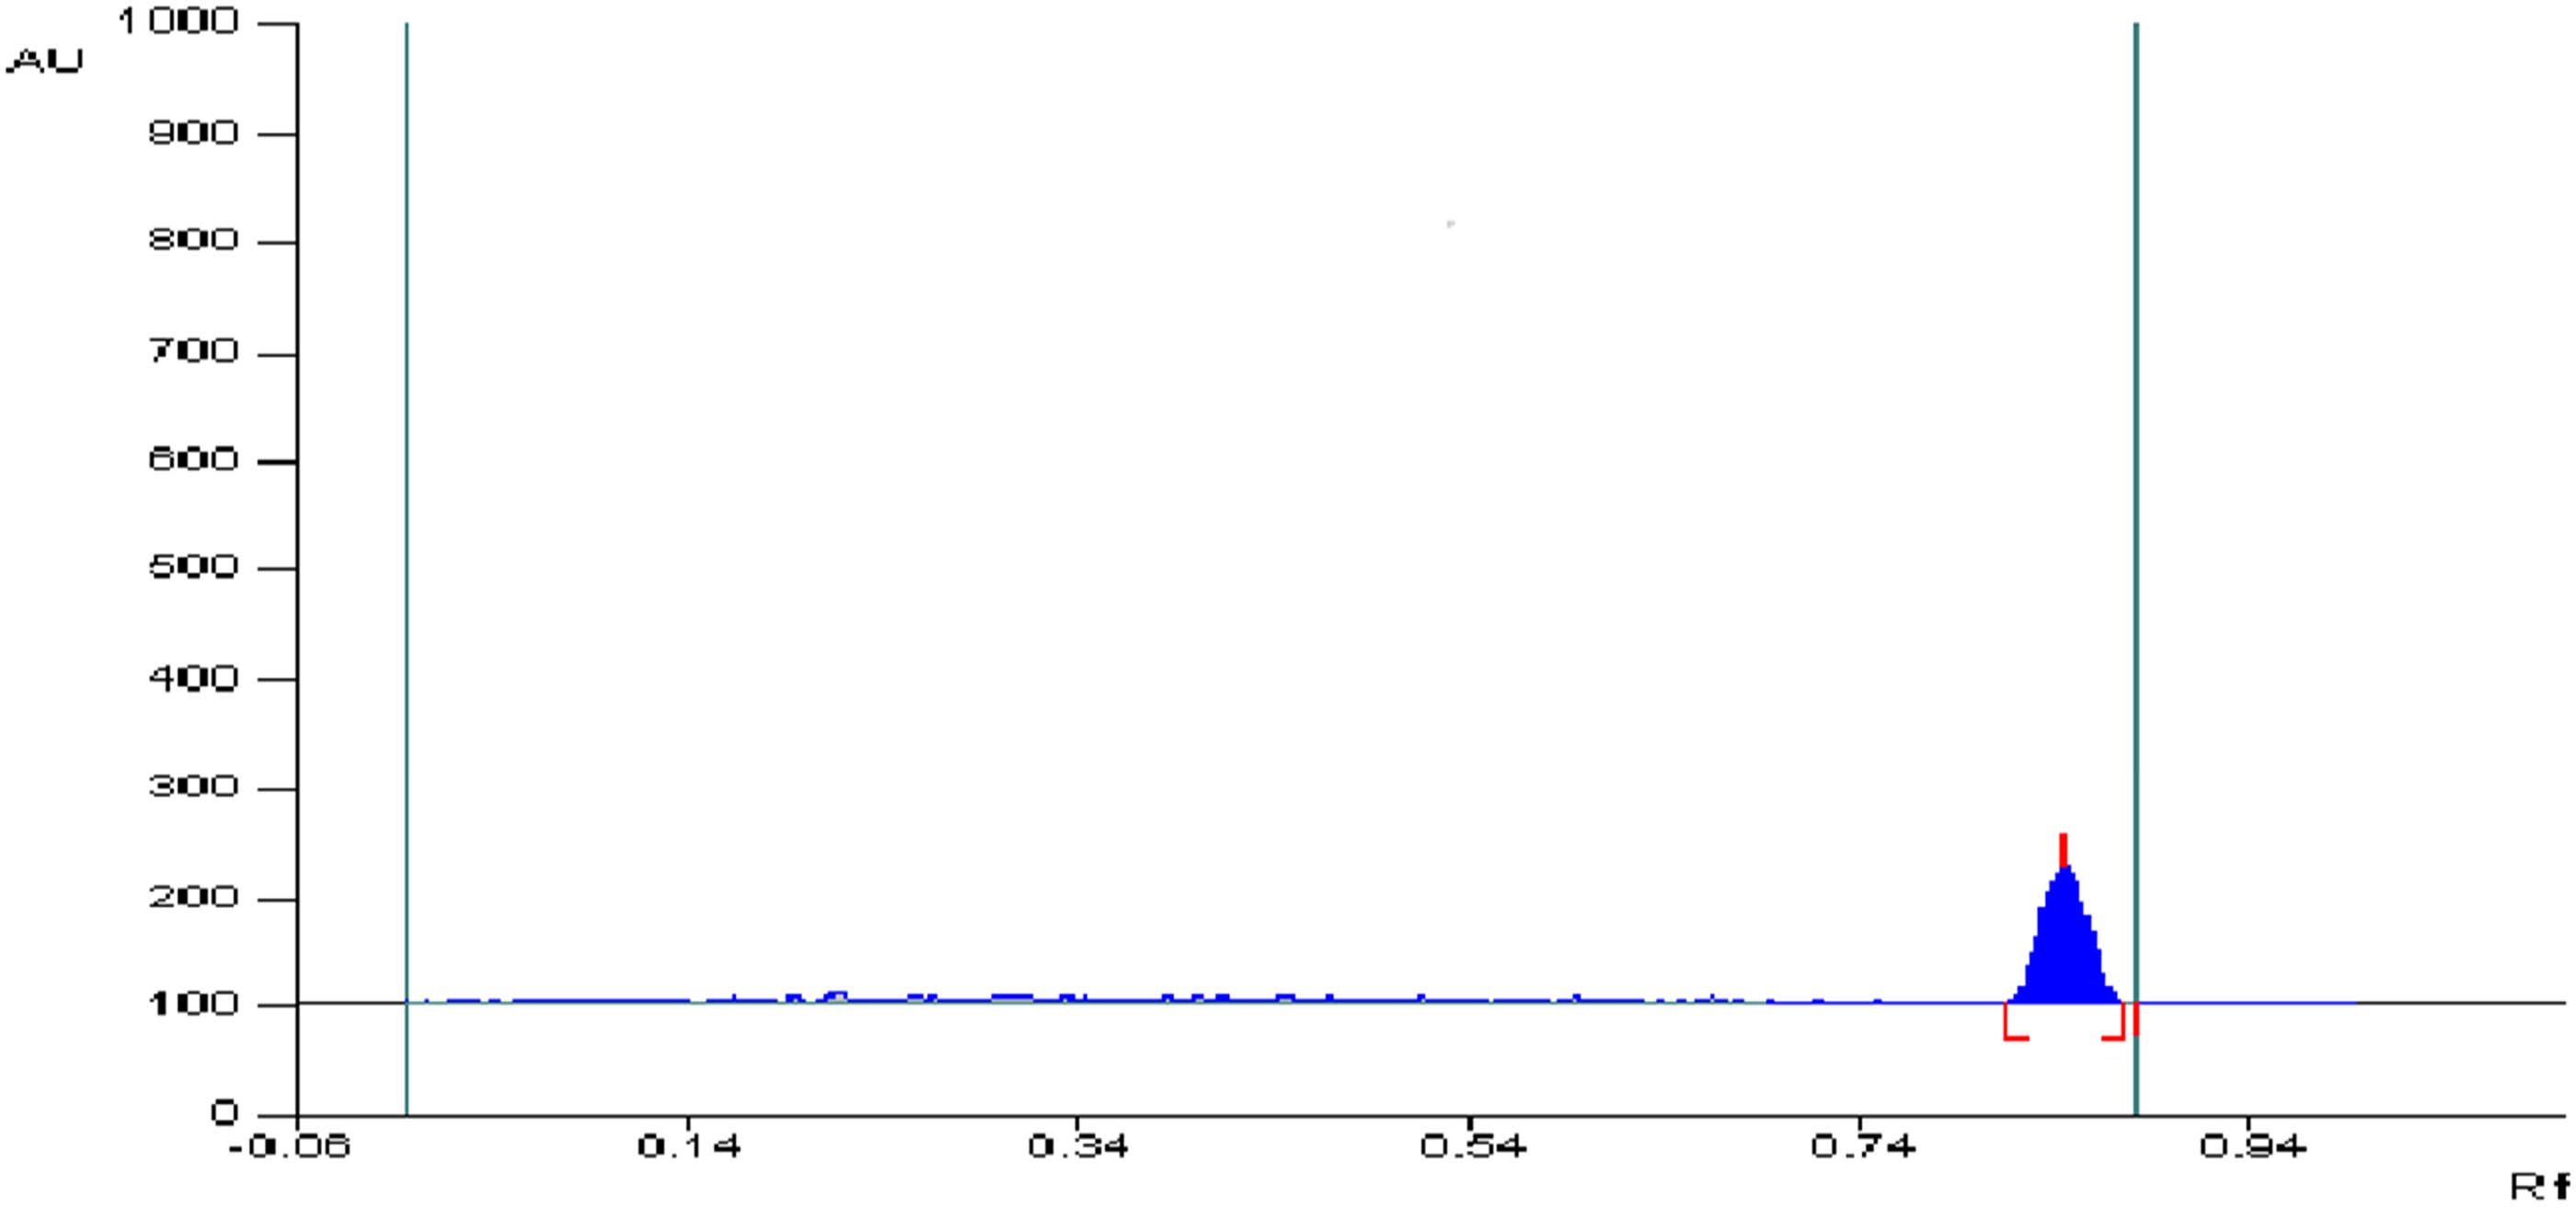
HPTLC chromatogram (10 µL band volume) of 0.2 µg·band−1 RDV standard solution in ethanol.
Different solvents were assessed, such as methanol, water, and ethanol, and their combinations. A mixture of ethanol and distilled water gave untailed well-separated peaks. Since the pH of the HPTLC system affects the separation, different volumes of ammonia and/or acetic acid were added to the mobile phase to adjust the system’s pH, but peak tailing and splitting were observed.
Different scanning wavelengths were also studied, and 240 nm was chosen seeking maximum sensitivity. To avoid an edge effect, washing and then saturation of the glass chamber with mobile phase was done for at least 30 min. The optimal bandwidth chosen was 5 mm. The plates were developed for 9 cm, then air-dried for 10 min before scanning.
3.3 Validation of the proposed methods
3.3.1 Linearity and range
Under the experimental conditions described, the calibration graphs obtained show linear relationships (r ≥ 0.9990). The slopes, intercepts, and correlation coefficients obtained by the linear least-squares regression treatment of the results are also given in Table 1. The small values of standard deviation about regression (S y/x ) indicate the closeness of the points to the straight line [21,22].
3.3.2 Limit of detection (LOD) and limit of quantitation (LOQ)
According to the ICH, LOD and LOQ are given in Table 1, where LOD = 3.3 σ/S and LOQ = 10 σ/S (σ is the standard deviation of the intercept of the regression line of the calibration curve and S is the slope).
3.3.3 Accuracy and precision
To evaluate the accuracy and precision of the proposed methods, five replicates (n = 5) at three concentration levels (within their linearity range) were carried out for each method. The replicates were measured on one day for “intra-day precision” and on different days for “inter-day precision” as summarized in Table 2. The low percentage relative standard deviations (RSD%) and percentage relative errors (E r%) (not exceeding 2%) indicate the high precision and accuracy of the proposed methods.
Evaluation of accuracy and precision of the proposed methods for the determination of RDV
| Method | Concentration | Mean% recovery ± SDa | RSD%b | E r%c |
|---|---|---|---|---|
| (a) Accuracy and intra-day precision (repeatability) | ||||
| Method I (µg·mL−1) | 1.50 | 100.01 ± 0.15 | 0.15 | 0.01 |
| 7.50 | 100.30 ± 0.20 | 0.20 | 0.30 | |
| 15.00 | 101.00 ± 0.09 | 0.09 | 1.00 | |
| Grand mean | 100.44 ± 0.15 | 0.15 | 0.44 | |
| Method II (ng·mL−1) | 1.00 | 100.59 ± 0.70 | 0.70 | 0.59 |
| 10.00 | 101.76 ± 0.99 | 0.97 | 1.76 | |
| 25.00 | 101.99 ± 1.59 | 1.56 | 1.99 | |
| Grand mean | 101.45 ± 1.09 | 1.08 | 1.45 | |
| Method III (µg·band−1) | 0.15 | 99.99 ± 1.33 | 1.33 | −0.10 |
| 0.30 | 102.09 ± 1.00 | 0.98 | 2.09 | |
| 0.40 | 100.52 ± 0.98 | 0.97 | 0.52 | |
| Grand mean | 100.84 ± 1.10 | 1.09 | 0.84 | |
| (b) Accuracy and inter-day precision | ||||
| Method I (µg·mL−1) | 1.5 | 100.04 ± 1.20 | 1.20 | 0.04 |
| 7.5 | 99.15 ± 1.30 | 1.31 | −0.85 | |
| 15 | 99.60 ± 1.50 | 1.51 | −0.40 | |
| Grand mean | 99.60 ± 1.33 | 1.34 | −0.40 | |
| Method II (ng·mL−1) | 1.00 | 101.22 ± 1.03 | 1.02 | 1.22 |
| 10.00 | 102.00 ± 0.33 | 0.32 | 2.00 | |
| 25.00 | 101.30 ± 1.12 | 1.11 | 1.30 | |
| Grand mean | 101.51 ± 0.83 | 0.82 | 1.51 | |
| Method III (µg·band−1) | 0.15 | 99.00 ± 1.00 | 1.01 | −1.00 |
| 0.30 | 101.50 ± 0.80 | 0.80 | 1.50 | |
| 0.40 | 100.09 ± 0.60 | 0.60 | 0.09 | |
| Grand mean | 100.20 ± 0.80 | 0.80 | 0.20 | |
aMean ± standard deviation of five determinations.
bPercentage relative standard deviation.
cPercentage relative error.
3.3.4 Selectivity
The selectivity of the three methods was checked by applying the methods for RDV determination in its injection dosage form, without interference from the vial’s excipients (Table 3) (Mean% recoveries of the three methods were 100 ± 2% and RSD% ≤ 2).
Application of the proposed methods for RDV determination in its drug product
| Drug productb | % Found ± RSDa | ||
|---|---|---|---|
| Method I (spectrophotometry) | Method II (spectrofluorimetry) | Method III (HPTLC) | |
| Remdesivir-Eva Pharma® injection vials 100 mg | 100.53 ± 0.99 | 99.68 ± 1.09 | 100.65 ± 1.02 |
| One-way analysis of variance (ANOVA) F c | 1.33 | ||
a Results are average of five experiments.
b Remdesivir-Eva Pharma® injection vials labeled to contain 5 mg·mL−1 RDV (Eva-Pharma, Cairo, Egypt).
c Theoretical value of F is 3.89 at 95% confidence limit.
3.3.5 Robustness
The robustness of the proposed HPTLC method was assessed, and the influence of parameters’ changes was studied. Intended influences in the conditions were studied as seen in Table 4. The results showed no variations in peaks’ areas or separation of RDV with %RSD less than 2% under all conditions (Table 4).
Robustness evaluation for determination of RDV using the proposed chromatographic method
| HPTLC parameters tested | RSD% of peak areas | R t ± SD |
|---|---|---|
| Mobile phase composition (ethanol/ distilled water [6.9:3.1, 7:3, and 7.1:2.9 (v/v)]) | 1.40 | 0.85 ± 2.0 × 10⁻² |
| Mobile phase volume (15, 20, and 25 mL) | 1.67 | 0.85 ± 3.0 × 10⁻² |
| Duration of saturation (30, 40, and 50 min) | 0.99 | 0.86 ± 2.5 × 10⁻² |
| Time from chromatography to scan (10, 20, 30, and 60 min) | 1.52 | 0.84 ± 3.4 × 10⁻² |
| Wavelength (±2 nm) | 1.80 | 0.87 ± 3.6 × 10⁻² |
3.3.6 Solution stability
RDV stability in its solutions of drug substance and drug product during analysis was investigated. Both RDV standard and sample solutions were prepared and stored at ambient temperature for 1, 3, and 5 h followed by their analysis. The results showed no change by any of the three methods indicating the drug solutions were stable for at least 5 h, which was sufficient for the whole analytical process.
3.4 Analysis of pharmaceutical preparation
The applicability of the proposed methods was tested by the determination of RDV in its vials (Remdesivir-Eva Pharma® injection vials) labeled to contain 5 mg·mL−1 RDV (EVA-PHARMA, Cairo, Egypt). The obtained results were in agreement with the labeled claim. The results obtained were of acceptable accuracy and precision where all percentage recoveries were in the range of 100 ± 2% and RSD% values ≤ 2 (Table 3). As seen in Table 3, the developed methods were compared with each other using the ANOVA test. The calculated value did not exceed the theoretical one at the 95% confidence level indicating no significant differences between the results obtained from the developed methods.
3.5 Comparison of the proposed methods with previously reported methods
The developed fluorimetric method has proved to be more sensitive than the comparison one [15] in terms of LOQ. Moreover, the reported solubility of RDV (23–25) indicates its solubility in ethanol and insolubility in water, where the comparison method used an aqueous medium for the fluorescence measurements (Table 5). On the other hand, the developed HPTLC method is also more sensitive than the comparison one [14] in terms of LOQ. Also, the measurements in the proposed HPTLC method are recorded at the wavelength maximum of RDV in ethanol (240 nm), while at 235 nm in the comparison method. Moreover, the preparation of RDV solutions in the comparison HPTLC method by solubilization in methanol lowered the greenness scale. The present HPTLC method used ethanol in the preparation of RDV solutions giving an advantage to higher reproducibility and a greener level of the developed method (Table 6).
Comparison of the proposed spectrofluorimetric method with a previously published one
| Proposed spectrofluorimetric method | Comparison spectrofluorimetric method [15] | |
|---|---|---|
| LOQ (ng·mL−1) | 0.420 (more sensitive) | 0.871 |
| RDV solution preparation | Ethanol (soluble) [23,24,25] | Water “buffer” (very slightly soluble) – may affect reproducibility [23,24,25] |
| Greenness assessment [26] |

|
|
Comparison of the proposed HPTLC method with a previously published one
| Proposed HPTLC method | Comparison HPTLC method [14] | |
|---|---|---|
| LOQ (µg·band−1) | 0.09 (more sensitive) | 0.12 |
| Detection wavelength | 240 nm (λ max) | 235 nm (not λ max) (less reproducibility) |
| RDV solution preparation | Ethanol (soluble) [23,24,25] | Methanol (no evidence of solubility) – may affect the reproducibility [23,24,25] |
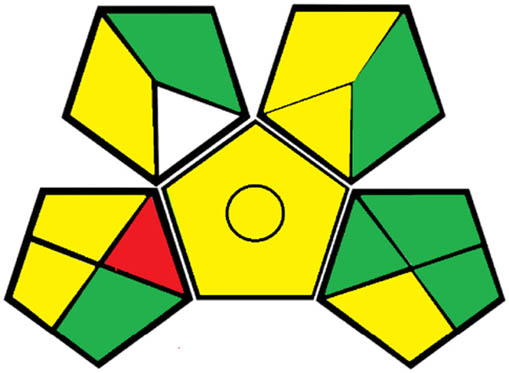
Greenness assessment was done using The Green Analytical Procedure Index (GAPI) [26], which is a recently introduced and widely cited assessment tool. The pictogram of GAPI is represented by 5 major pentagrams divided into 15 zones where each pentagram represents a step in the analytical procedure. Assessment is done through three colors (green, yellow, and red), where these colors represent low, moderate, and high impact on the environment, respectively. Table 5 shows that the proposed spectrofluorimetric method is greener than the comparison method showing seven green zones to six green zones. Table 6 shows that the proposed HPTLC method is much greener than the comparison one, where the comparison method shows 4 red zones compared to the proposed one with only one red zone.
4 Conclusion
Since RDV has been recently approved and authorized for emergency use to treat Covid-19 as it shortens the recovery time. Thus, simple and rapidly validated analytical methods must be available for routine quality control analysis in its dosage forms. Three methods were developed using different analytical techniques (absorption spectrophotometry, fluorimetry, and chromatography) to successfully assay the drug in its injection dosage form. The proposed methods also have the advantages of being low cost, using mainly green solvent: ethanol, sensitive and of simple steps. Also, the proposed methods proved to be more sensitive and more eco-friendly than previously reported methods. Thus, these methods are the perfect choice for analysis of RDV pharmaceutical preparations before its market launching, especially in developing countries where the presence of sophisticated high-cost instruments could be challenging.
-
Funding information: Authors state no funding involved.
-
Author contributions: Miranda F. Kamal: resources, writing – original draft, writing – review and editing, Mona M. Abdelmoneim: methodology, formal analysis, project administration; Mohamed M. Hamdy: formal analysis, visualization, assessment and calculations.
-
Conflict of interest: Authors state no conflict of interest.
-
Data availability statement: The datasets generated during and/or analyzed during the current study are available from the corresponding author on reasonable request.
Appendix
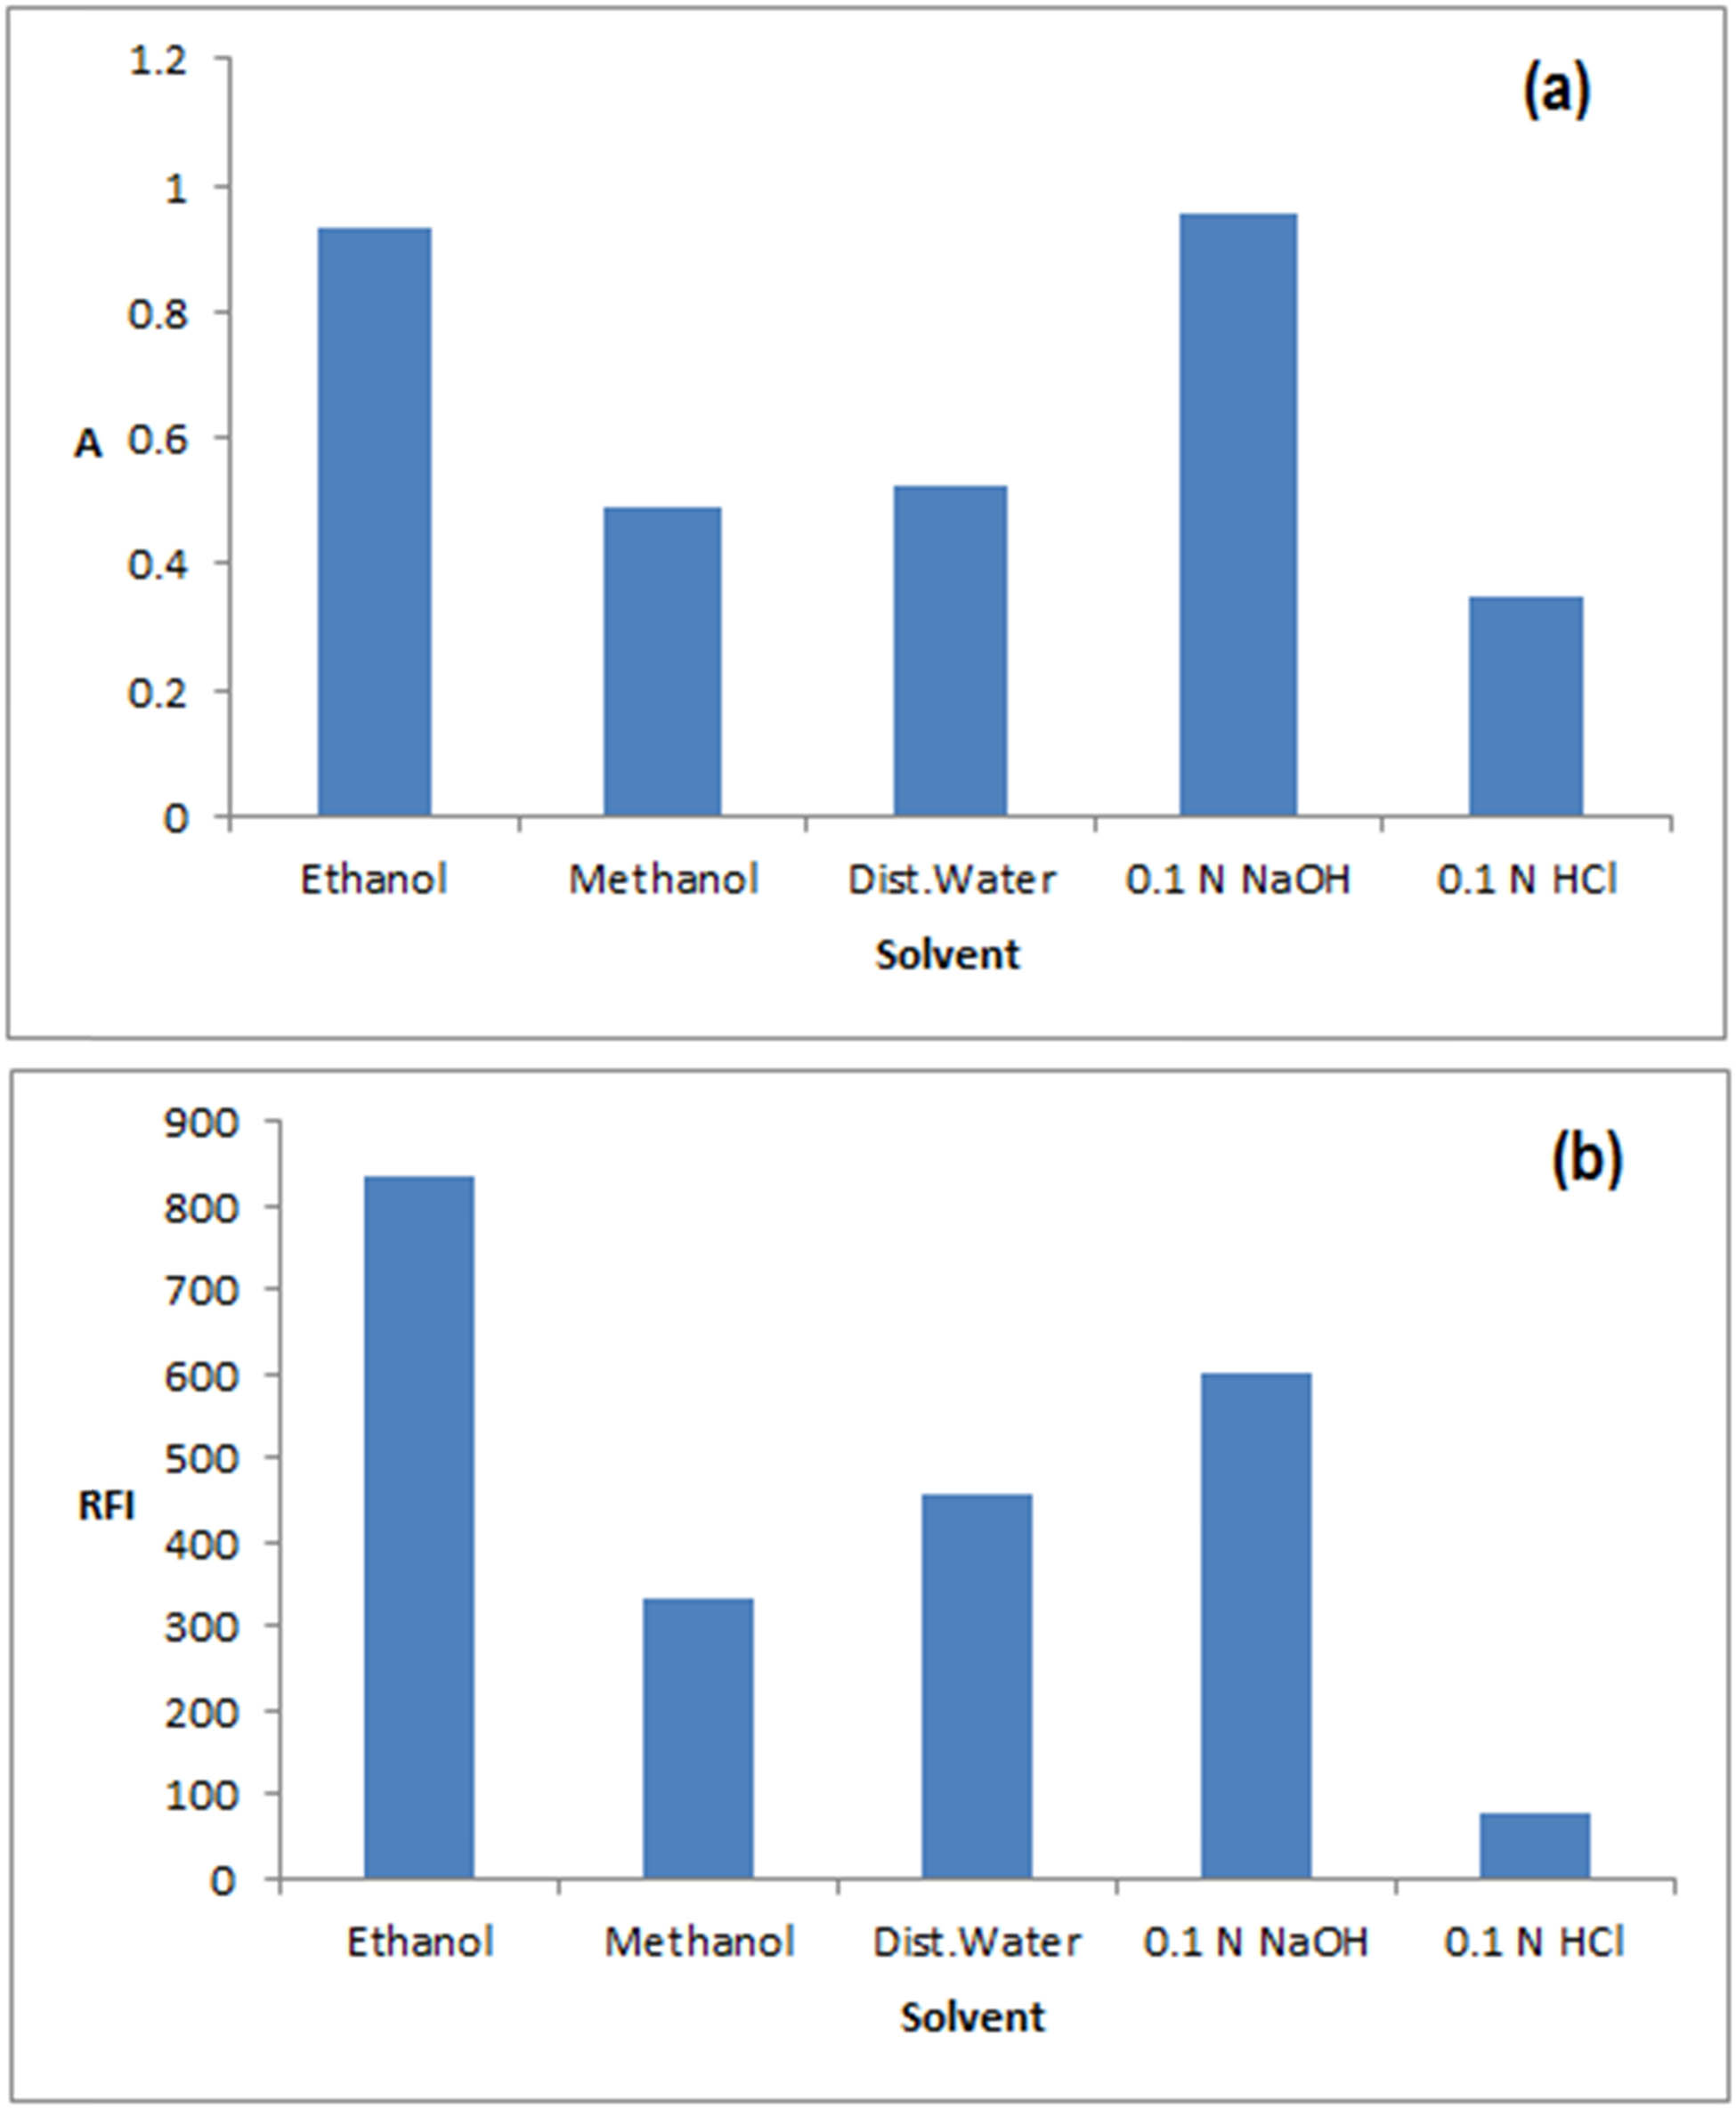
Effect of different diluting on solvents on (a) 15 µg·mL−1 RDV absorbance (spectrophotometry) at 240 nm and (b) 40 ng·mL−1 RDV RFI (spectrofluorimetry) at λ ex = 275 and λ em = 440 nm.
References
[1] FDA US Food and Drug Administration, Approves First Treatment for COVID-19. https://www.fda.gov/news-events/press-announcements/fda-approves-first-treatment-covid-19. (accessed 14 January 2022).Suche in Google Scholar
[2] FDA US Food and Drug Administration, Emergency Use Authorization EUA for Remdesivir and Fact sheet for Healthcare providers EUA for Vulkary® (Remdesivir). https://www.fda.gov/media/137564/download. (accessed 14 January 2022).Suche in Google Scholar
[3] Beigel JH, Tomashek KM, Dodd LE, Mehta AK, Zingman BS, Kalil AC, et al. ACTT-1 Study Group Members, Remdesivir for the Treatment of Covid-19 - Final Report. N Engl J Med. 2020;383(19):1813–26. 10.1056/NEJMoa2007764.Suche in Google Scholar PubMed PubMed Central
[4] WHO. World Health Organization, Coronavirus disease (COVID-19) pandemic; (accessed 14 January 2022). https://www.who.int/emergencies/diseases/novel-coronavirus-2019.Suche in Google Scholar
[5] Drug Bank, Remdesivir. https://go.drugbank.com/drugs/DB14761.Suche in Google Scholar
[6] Agostini ML, Andres EL, Sims AC, Graham RL, Sheahan TP, Lu X, et al. Coronavirus susceptibility to the antiviral remdesivir (GS-5734) is mediated by the viral polymerase and the proofreading Exoribonuclease. mBio. 2018;69(2):e00221-18. 10.1128/mBio.00221-18.Suche in Google Scholar PubMed PubMed Central
[7] Gordon CJ, Tchesnokov EP, Woolner E, Perry JK, Feng JY, Porter DP, et al. Remdesivir is a direct-acting antiviral that inhibits RNA-dependent RNA polymerase from severe acute respiratory syndrome coronavirus 2 with high potency. J Biol Chem. 2020;295(20):6785–97. 10.1074/jbc.RA120.013679.Suche in Google Scholar PubMed PubMed Central
[8] Eastman RT, Roth JS, Brimacombe KR, Simeonov A, Shen M, Patnaik S, et al. Remdesivir: A Review of Its Discovery and Development Leading to Emergency Use Authorization for Treatment of COVID-19. ACS Cent Sci. 2020;6(5):672–83. 10.1021/acscentsci.0c00489.Suche in Google Scholar PubMed PubMed Central
[9] Avataneo V, de Nicolò A, Cusato J, Antonucci M, Manca A, Palermiti A, et al. Development and validation of a UHPLC-MS/MS method for quantification of the prodrug remdesivir and its metabolite GS-441524: a tool for clinical pharmacokinetics of SARS-CoV-2/COVID-19 and Ebola virus disease. J Antimicrob Chemother. 2020;8:1–6. 10.1093/jac/dkaa152.Suche in Google Scholar PubMed PubMed Central
[10] Alvarez JC, Moine P, Etting I, Annane D, Larabi IA. Quantification of plasma remdesivir and its metabolite GS-441524 using liquid chromatography coupled to tandem mass spectrometry. Application to a Covid-19 treated patient. Clin Chem Lab Med. 2020;22:1461–8. 10.1515/cclm-2020-0612.Suche in Google Scholar PubMed
[11] Abdel Moneim MM, Kamal MF, Hamdy MMA. Rapid sensitive bioscreening of remdesivir in COVID-19 medication: Selective drug determination in the presence of six co-administered therapeutics. Rev Anal Chem. 2021;40(1):323–33. 10.1515/revac-2021-0141.Suche in Google Scholar
[12] ICH, Harmonized Tripartite Guideline Validation of Analytical Procedures; 2005: Text and Methodology, Q2 (R1). http://www.ich.org/fileadmin/Public_Web_Site/ ICH_Products/Guidelines/Quality/Q2_R1/Step4/Q2_R1__Guideline.pdf. (Accessed 14 January 2022).Suche in Google Scholar
[13] The United States Pharmacopeia. Thirty-fifth edition, The National Formulary. 29th edn. Washington, DC: United States Pharmacopeial Convention, Inc. Asian edition; 2012.Suche in Google Scholar
[14] Noureldeen DA, Boushra JM, Lashien AD, Abdel Hakiem AF, Attia TZ. Novel environment friendly TLC-densitometric method for the determination of anti-coronavirus drugs “Remdesivir and Favipiravir”: Green assessment with application to pharmaceutical formulations and human plasma. Microchem J. 2022;174:107101. 10.1016/j.microc.2021.107101.Suche in Google Scholar PubMed PubMed Central
[15] Elmansi H, Ibrahim AE, Mikhail IE, Belal F. Green and sensitive spectrofluorimetric determination of Remdesivir, an FDA approved SARS-CoV-2 candidate antiviral; application in pharmaceutical dosage forms and spiked human plasma. Anal Methods. 2021;13:2596–602. 10.1039/D1AY00469G.Suche in Google Scholar
[16] Korany MA, Gazy AA, Khamis EF, Ragab MA, Kamal MF. Analysis of closely related antioxidant nutraceuticals using the green analytical methodology of ANN and smart spectrophotometric methods. JAOAC Int. 2017;100:8–17. 10.5740/jaoacint.16-0203.Suche in Google Scholar PubMed
[17] Ragab MA, El Yazbi FA, Hassan EM, Khamis EF, Hamdy MMA. Spectrophotometric analysis of two eye preparations, vial and drops, containing ketorolac tromethamine and phenylephrine hydrochloride binary mixture and their ternary mixture with chlorphenirmaine maleate. Bull Fac Pharm. 2018;56(1):91–100. 10.1016/j.bfopcu.2018.03.004.Suche in Google Scholar
[18] Mahgoub H, Youssef RM, Korany MA, Khamis EF, Kamal MF. Development and validation of spectrophotometric and HPTLC methods for simultaneous determination of rosiglitazone maleate and metformin hydrochloride in the presence of interfering matrix excipients. Drug Dev Ind Pharm. 2014;40(9):1190–8. 10.3109/03639045.2013.810634.Suche in Google Scholar PubMed
[19] Abdel Moneim MM, Hamdy MMA. Green Spectrofluorimetric Methods for Tramadol Assay with Ibuprofen or Chlorozaxone: Comparison of Greenness Profiles. Luminescence. 2021;36(2):497–505. 10.1002/bio.3969.Suche in Google Scholar PubMed
[20] Youssef RM, Khamis EF, El-Sayed M, Abdel Moneim MM. Development and validation of a high-performance thin-layer chromatographic method for the assay of ternary mixtures containing cetirizine dihydrochloride in pharmaceutical dosage forms. JPC-J Planar Chromat. 2014;27(1):58–65. 10.1556/jpc.27.2014.1.11.Suche in Google Scholar
[21] Armitage P, Berry G, Matthews JNS. Statistical methods in medical research. Pearson, London, England: John Wiley & Sons; 2008.Suche in Google Scholar
[22] Miller JN, Miller JC. Statistics and chemometrics for analytical chemistry. Pearson Education; 2005.10.1002/9780470988459.ch8Suche in Google Scholar
[23] American Chemical Society. https://www.acs.org/content/acs/en/molecule-of-the-week/archive/r/remdesivir.html (accessed 14 January 2022).Suche in Google Scholar
[24] Bio-techne/Tocris (Remdesivir supplier). https://www.tocris.com/products/remdesivir_7226 (accessed 14 January 2022).Suche in Google Scholar
[25] Invivo Gen (Remdesivir supplier). https://www.invivogen.com/remdesivir (accessed 14 January 2022).Suche in Google Scholar
[26] Płotka-Wasylka J. A new tool for the evaluation of the analytical procedure: Green Analytical Procedure Index. Talanta. 2018;181:204–9. 10.1016/j.talanta.2018.01.013.Suche in Google Scholar PubMed
© 2023 the author(s), published by De Gruyter
This work is licensed under the Creative Commons Attribution 4.0 International License.
Artikel in diesem Heft
- Research Articles
- Detection of exosomes in various biological fluids utilizing specific epitopes and directed multiple antigenic peptide antibodies
- A green HPLC method for the determination of apixaban in pharmaceutical products: Development and validation
- Real-time monitoring of recombinant GFP expression in single-cell Komagataella phaffii through filamentous pelletization technology
- Review Articles
- Progress of sensitive materials in chemiresistive sensors for detecting chemical warfare agent simulants: A review
- Major biochemical constituents of Withania somnifera (ashwagandha) extract: A review of chemical analysis
- A brief review of the application of microextraction by packed sorbent for antibiotics analysis from biological, food, and environmental samples
- Poly- and per-fluoroalkyl substances in water: Occurrence, analytical methodologies, and remediations strategies: A comprehensive review
- Special Issue: Greener Analytical Methods - Part I
- Green novel photometric and planar chromatographic assays of remdesivir: Comparative greenness assessment study using estimated GAPI tool versus ISO technical reported methods
- Enhancing methane sensing with NDIR technology: Current trends and future prospects
- Eco-friendly HPLC method by using response surface design to measure a combination of three antidiabetic drugs
- Metal and metalloid monitoring in water by passive sampling – A review
- Green chemistry and its implementation in pharmaceutical analysis
- Synthesis of a benzothiazole-based structure as a selective colorimetric-fluorogenic cyanate chemosensor