Eco-friendly HPLC method by using response surface design to measure a combination of three antidiabetic drugs
-
 and
and

Abstract
In recent years, there has been a significant increase in the application of green chemistry principles in analytical chemistry. One of the key factors affecting the environmental sustainability of analytical methods is the choice of solvent. In this particular study, a two-factor, three-level response surface design was employed to develop an environmentally friendly chromatographic technique for a mixture of metformin, glimepiride, and pioglitazone. Ethanol, which is known to be harmless to the environment, was chosen as the organic modifier in the mobile phase. The separation of the mixture was achieved using a phosphate buffer solution (pH 3) mixed with ethanol (30:70 v/v). The linearity of the developed method covered a concentration of metformin of 10–120 µg·mL−1 with a correlation coefficient of 0.9998, glimepiride of 0.1–20 µg·mL−1 with a correlation coefficient of 0.9997, and pioglitazone of 1–50 µg·mL−1 with a correlation coefficient of 0.9999. To evaluate the environmental friendliness of the developed method, two assessment tools were employed: The Analytical GREEnness metric and Green Analytical Procedure Index. The results revealed that the developed method performed exceptionally well in terms of its eco-friendliness. Furthermore, the developed method was compared to other reported methods in terms of both accuracy and environmental sustainability. The results demonstrated that the developed method serves as an excellent alternative to well-established techniques for the separation and quantification of the analyzed mixture. Overall, this study highlights the importance of integrating green chemistry principles into analytical chemistry practices.
1 Introduction
Over the past two decades, there has been a significant increase in scientific interest concerning health and environmental issues [1]. The concept of green chemistry emerged in the early 1990s, and later, the analytical community recognized the negative impact of hazardous chemicals on health and the environment [1,2]. This led to the proposal of “Green Analytical Chemistry” (GAC) as a means to address these concerns. One of the pioneers of green chemistry, Anastas, highlighted the importance of developing green analytical methods in 1999, resulting in the publication of books and scientific papers on the subject in the past decade [1,3,4,5,6,7,8,9,10,11,12,13,14].
The concept of GAC focuses on reducing or eliminating the use of hazardous chemicals in analytical processes while maintaining method performance [15]. Anastas and Warner published the 12 Codes of Green Chemistry in 1998, which provided guidelines for environmentally friendly practices in chemistry. Ideally, green analytical methods should avoid toxic reagents and solvents, have short analysis times, and utilize safe and energy-efficient instruments [16].
Main approaches that are in line with GAC principles [8] include the use of alternative solvents that are less hazardous to the environment and reducing the time between starting an analysis and getting reliable analytical results. Liquid chromatography is always the go-to method for separating and quantifying analytes. Most described procedures, unfortunately, involve the use of toxic organic solvents and generate excessive waste, which is bad for both humans and the environment. Methanol and/or acetonitrile were discovered to be often used in the extraction solvent and mobile phase of most chromatographic techniques during the literature review. Because of their intrinsic toxicity and the critical significance of safe detoxification of their waste, the US Environmental Protection Agency (EPA) classifies MeOH and ACN as hazardous solvents [1]. Therefore, we set out to create more sustainable liquid chromatographic procedures that did not rely on harmful solvents. Type 2 diabetes mellitus is typically treated using a combination of drugs with different mechanisms of action. Metformin, a biguanide, helps regulate blood glucose levels by reducing glucose absorption and production by the liver [17]. Pioglitazone, a thiazolidinedione, modifies gene transcription to affect carbohydrate and lipid metabolism, improving insulin sensitivity and lipid metabolism [18]. Glimepiride stimulates insulin production by the pancreas, facilitating glucose utilization [19].
Several methods have been reported in the literature for the simultaneous analysis of metformin, glimepiride, and pioglitazone in their combined dosage form [20,21,22,23,24,25]. However, these methods commonly employ organic solvents that are harmful to the environment. Therefore, the aim of this study was to develop a chromatographic method based on the principles of GAC, providing an environmentally friendly alternative for the simultaneous analysis of these drugs. The developed method described in this work is the first to measure this drug combination simultaneously and has been designed to be environmentally friendly.
A response surface design was utilized as a new approach to develop green analytical methods. The environmental suitability of the developed method was assessed using two GAC assessment tools: The Analytical GREEnness metric (AGREE) and Green Analytical Procedure Index (GAPI) [26,27]. Results in AGREE are expressed as a fraction of a whole number, with values closer to one indicating greater greenness and values closer to zero indicating insufficient greenness. In these cases, GAPI can provide a thorough qualitative and quantitative evaluation of the entire analytical process, from sample collection to report generation. Pictogram components can be green, yellow, or red, with green indicating an eco-friendly approach and red indicating the opposite.
2 Materials and methods
2.1 Materials and solvents
Ethanol (high pressure liquid chromatography [HPLC] grade) was provided by FisherScientific, UK. “In-house” HPLC grade water was prepared with a MilliQ filter purchased from Millipore, Watford, UK. Metformin hydrochloride, glimepiride, and pioglitazone reference standards were kindly supplied by the National Organization for Drug Control and Research (NODCAR, Cairo, Egypt). The purity of the standards was certified to be 99.5%, 99.7%, 99.97%, and 99.98%, respectively. Glimestar-1® commercial tablets labeled to contain 1 mg metformin, glimepiride, and pioglitazone were purchased from the Indian market. The chemical structure of the analyzed drugs is presented in Figure 1.

Chemical structure for (a) metformin hydrochloride, (b) pioglitazone, and (c) glimepiride.
2.2 Instrument and software
The separation was achieved using a chromatographic system Schimadzu LC-2040C 3D PLUS nexera –i (Japan) equipped with a photodiode array (PDA) detector (LC-2030/2040 PDA), LC-2040 pump, and four-line degasser. The separation was achieved using Inertsil C-18, (150 mm × 4.6 mm, 5 µ) analytical column. Data acquisition was made with LabSolutions software. Experimental Design was done using JMP®.
2.3 Procedures
2.3.1 Solutions
2.3.1.1 Preparation of standard stock solutions
Standard stock solutions of metformin, glimepiride, and pioglitazone were prepared separately in 100 mL volumetric flasks by dissolving 50 mg of the standard powder in ethanol and water mixture (50:50). Then, standard stock solutions of the analytes were diluted with the mobile phase to prepare standard working solutions (150 μg·mL−1).
2.3.2 Chromatographic conditions
The mixture was separated on an Inertsil C18 column (150 mm × 4.6 mm, 5 µm). The injection volume was 10 μL. A two-factor, three-level response surface design was applied to optimize the mobile phase buffer pH and ethanol ratio. Sixteen random runs generated by the software are shown in Table S1.
Optimal performance of the mixture is phosphate buffer (pH 3) and ethanol (30:70 v/v), peaks were detected at 236, 229, and 269 nm for metformin hydrochloride, glimepiride, and pioglitazone, respectively. Column temperature was set at 40°C. The flow rate was 1 mL·min−1.
2.3.3 Validation
2.3.3.1 Linearity and range
Accurately measured aliquots of the analytes were transferred from their standard working solutions into a series of 10 mL volumetric flasks, and the volume was completed to the mark with mobile phase. The calibration standards consist of six concentrations covering a concentration range of 10–120 μg·mL−1 for metformin, 1–50 μg·mL−1 for pioglitazone, and 0.1–20 μg·mL−1 for glimepiride. The samples were injected separately into the column under a flow rate of 1 mL·min−1 using the aforementioned chromatographic conditions. Each sample was analyzed three times, and the mean relative peak area of the analytes was plotted versus the corresponding concentrations. Regression equations were then computed.
2.3.3.2 Accuracy
The accuracy of results was verified by determining three replicates of different concentrations of analyte using the proposed method. Concentrations were determined from appropriate regression equations for each method and recoveries demonstrate the accuracy of the proposed method.
2.3.3.3 Precision repeatability
Three concentrations of each analyte were injected three times intradaily using the appropriate method under the same experimental conditions. The RSDs were calculated.
2.3.3.4 Intermediate precision
The earlier procedure was repeated daily on three different days in order to analyze the three selected concentrations. RSD was calculated.
2.3.3.5 Selectivity
Solutions containing different ratios of analytes in appropriate dosage forms were prepared by transferring precisely measured aliquots from the working standard solution to a series of 10 mL volumetric flasks and replenishing the volume with the mobile phase. Concentrations of analytes in prepared samples were calculated using the corresponding calculated regression equations.
2.3.3.6 LOQ and LOD
Signal-to-noise ratio was used to evaluate LOQ and LOD of the analytes by the developed HPLC method. A signal-to-noise ratio in the range of 3:1 is generally satisfactory for LOD while a ratio of 10:1 is satisfactory for LOQ.
2.3.4 Application to pharmaceutical preparation
To determine the analytes in the commercial tablets (Glimestar-1® B.NO. A0CJO063), ten tablets were powdered separately, and then, a portion equivalent to one tablet was weighed and transferred to a 100 mL beaker; 25 mL of water and 25 mL of ethanol were added, stirred using a magnetic stirrer for 15 min and filtered through 0.5 μm Whatman filter paper into a 100 mL volumetric flask. The residue was washed three times, each time with 10 mL of ethanol and water (1:1), and the solution was completed to the mark with the same solvent. From the above-prepared solutions, further dilutions were made using the mobile phase to reach the linearity range. The concentration of the analytes in the prepared samples was calculated from the corresponding computed regression equations. The validity and accuracy of the proposed chromatographic method were further checked by applying the standard addition technique.
3 Result and discussion
The use of other solvents that are less harmful to the environment and reduced time from the start of analysis to consistent analytical results are important aspects of GAC and critical to fulfill the GAC Principles approach [10]. Liquid chromatography is the most commonly used analytical approach for the separation and quantification of chemical compounds in both industry and science. Awkwardly, the majority of the reported analytical methods were using harmful organic solvents and produce large amounts of waste that are destructive to both humans and the environment. A literature review revealed that most chromatographic methods used methanol and/or acetonitrile as extraction solvents and as mobile phase components in analytical methods. It is important to note that MeOH and ACN are categorized as harmful solvents by the U.S. EPA due to their inherent toxicity and the critical importance of safely detoxifying their waste products [28]. Our challenge was therefore to develop an environmentally friendly liquid chromatography technique using more environmentally friendly solvents. According to Sadek [29], ethanol is considered one of the important alternatives to methanol and acetonitrile. Therefore, in green chemistry, ethanol was used as the extraction solvent and mobile phase organic modifier. Furthermore, one of the principles of GAC is to reduce the time between starting an analysis and obtaining reliable analytical results. This was achieved by conditions chosen for rapid analyte separation with short run times.
Several preliminary runs showed that ethanol ratio and flow rate had the greatest effect on analyte peak separation, while buffer ionic strength had minimal or no effect on resolution. The pH 5 and 7 buffer produced forked peaks. A two-factor three-level response surface design was applied to optimize the ethanol ratio and flow rate, where the dependent parameters studied were: resolution of pioglitazone peak relative to Metformin peak (Rs1), resolution of Glimepiride peak relative to pioglitazone peak (Rs2), Number of theoretical plates of the three peaks (N1, N2, and N3), and total run time (RT). The 16 random runs generated are shown in supporting information Table S1. The effects of the investigated element ethanol% (x1) and flow rate (x2) on resolution are presented in Table S2 and expressed in the following quadratic regression:
In both surface and contour plots, as shown in Figure 2, the effect of factors on resolution was fully understood. JMP® Predictive Profiler was used to optimize analyte resolution. The desirability is set to maximum, as shown in Figure 3. Profiler suggested that a phosphate buffer (pH 3) containing 70% ethanol was optimal for maximum resolution of the metformin, glimepiride, and pioglitazone peaks, as shown in Figure 3. System suitability parameters are shown in Table 1.

Selected surface plots (top) and contour profilers (bottom) for the effect of flow rate and ethanol% on the studied response (resolution) of metformin, glimepiride, and pioglitazone mixture.

(a) Prediction profilers of metformin, glimepiride, and pioglitazone mixture, showing the effect of each factor on resolution, desirability set to maximum, and (b) complete resolution of metformin, glimepiride, and pioglitazone by the proposed HPLC methods.
System suitability parameters of the proposed RP-HPLC method
| Parameter | Retention time | Resolution* | Tailing factor | Column capacity | Alpha (selectivity) | Column efficiency (no. of theoretical plates) | HETP |
|---|---|---|---|---|---|---|---|
| Metformin | 1.1 | — | 1.4 | 2.57 | — | 1,864 | 0.080 |
| Pioglitazone | 2.2 | 9.4 | 1.23 | 6.33 | 2.46 | 3,600 | 0.042 |
| Glimepiride | 3.5 | 6.9 | 1.3 | 10.67 | 1.68 | 4,306 | 0.035 |
*Resolution is calculated relative to the previous peak.
3.1 Validation
When developing analytical methods, the quality of validation results should be considered. Therefore, the developed HPLC method was fully validated according to ICH guidelines [30]. Validation was done in terms of linearity and range, accuracy, precision, selectivity, LOQ, and LOD. All validation parameters are shown in Tables 2 and 3.
Validation parameters of the proposed RP-HPLC method
| Parameter | Metformin | Pioglitazone | Glimepiride |
|---|---|---|---|
| Range (µg·mL−1) | 10–120 | 1–50 | 0.1–20 |
| Regression equation | y = 0.8433x − 0.0573 | y = 0.7011x + 0.7167 | y = 0.9021x + 0.6821 |
| Correlation coefficient (r) | 0.9998 | 0.9999 | 0.9997 |
| Selectivitya ± SD | 99.43 ± 1.262 | 101.07 ± 0.725 | 100.12 ± 0.684 |
| Pharmaceutical formulation | 99.42 ± 1.029 | 100.84 ± 0.28 | 100.22 ± 0.78 |
| Batch. NO. A0CJO063 | |||
| Standard addition technique | 100.88 ± 1.418 | 99.38 ± 1.147 | 99.91 ± 1.231 |
aThe mean recovery of laboratory prepared mixtures containing different ratios of the analytes.
Accuracy and precision for the determination of the analytes
| Drug | Metformin | Pioglitazone | Glimepiride | ||||||
|---|---|---|---|---|---|---|---|---|---|
| conc.μg.mL−1 | 10 (QCL) | 80 (QCM) | 100 (QCL) | 1 (QCL) | 25 (QCM) | 40 (QCL) | 0.1 (QCL) | 10 (QCM) | 18 (QCL) |
| Accuracy recovery* ± SD | 99.85 ± 1.30 | 99.22 ± 0.43 | 99.15 ± 0.76 | 101.14 ± 0.41 | 100.17 ± 0.87 | 98.96 ± 0.44 | 101.51 ± 0.80 | 101.12 ± 0.54 | 99.52 ± 0.79 |
| Precision recovery* ± SD | 101.34 ± 0.85 | 99.58 ± 1.37 | 100.43 ± 0.68 | 99.87 ± 1.17 | 98.41 ± 1.11 | 100.61 ± 0.83 | 101.73 ± 1.12 | 99.62 ± 1.53 | 99.59 ± 0.77 |
*Mean recovery % and SD were calculated using six determinations.
3.2 Greenness assessment
Assessing analytical methodologies within the framework of green chemistry presents significant challenges due to the extensive range and variety of analytes and analytical methods, the intricate nature of sample matrices, and the unique analytical criteria that must be taken into account, such as precision, accuracy, and LODs [28]. There are limited published and universally applicable approaches for evaluating the environmental sustainability of analytical procedures. In this study, the greenness of the newly developed HPLC methods was evaluated using two distinct GAC assessment tools. The greenness of the developed method was compared with the reported methods, and the results are shown in Table 4.
Comparison of greenness profile between the suggested and reported HPLC methods
| METHOD | AGREE [27] | GAPI [26] |
|---|---|---|
| Developed method |

|

|
| [25] |

|

|
| [31] |

|

|
| [32] |
|

|
| [33] |

|

|
| [34] |

|

|
3.2.1 GAPI
It is considered an accurate GAC tool for assessment. It is able to give a qualitatively and quantitatively comprehensive assessment of the whole analytical procedure, beginning from the sample collection and ending with the final analysis. The color of the pictogram parts may be green, yellow, and red, where the green color indicates a safe procedure while the red refers to non-ecofriendly. The proposed method as well as the reported methods were assessed using GAPI, and the results show that the proposed method was the greenest as shown in Table 4. The GAPI pictogram of the developed method shows all the 15 analytical parameters of the developed procedures; it showed that all the pentagrams were green except section 7 was yellow-colored as we use ethanol as an organic modifier that is considered a green solvent, while section 10 was yellow-colored also, as the ethanol is slightly toxic and irritant, NFPA health hazard rating = 2. Section 11 was yellow in color, as the flammability score of ethanol was 3. Section 14 was yellow as the waste was less than 10 but more than 1 in both methods. Sections 15 were colored red as no waste treatment was applied for both methods. Section 5 was yellow-colored as the sample requires filtration while the circle in the middle indicates that the procedure could applied for both qualitative and quantitative analyses.
3.2.2 AGREE
In June 2020, a new technique has been proposed using downloadable greenness assessment software named AGREE. This method depends on the 12 basic principles of GAC.
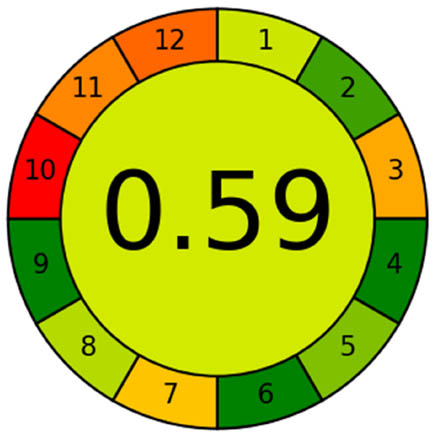
In AGREE, the final score that represents the degree of the greenness of the method is a fraction of one, the results range from zero to one, when it is closer to one it means greener and close to zero indicates inadequate green. The pictogram divided into 12 segments was automatically provided by the software with flexibility for monitoring their width according to their significance. Each segment has an exact color range from green to red. The total score performs in the circular pictogram middle. For comparison, the AGREE tool was used to assess the “greenness” of an analytical methodology, in the proposed and reported methods as shown in Table 4, and the results show that the proposed method was the greenest.
3.3 Statistical comparisons
The analysis results obtained for the analytes in pure powder using the suggested methods were statistically compared with the results obtained from the reported HPLC method [25]. In the method described in Ref. [25], separation was carried out using RP-HPLC with a mobile phase consisting of Potassium dihydrogen phosphate buffer (20 mM) adjusted to pH = 3 by diluted o-phosphoric acid/acetonitrile (55:45 v/v). Detection was performed at 230 nm on an Inertsil C-18 column (100 mm × 4.6 mm, 5 μm particle size) at a flow rate of 1.5 mL·min−1 using an isocratic elution method. The results, as shown in Table 5, indicated no significant differences between the proposed methods and the reported methods.
Statistical comparison of the results obtained by the proposed method and the reference method for the determination of the analytes in bulk powder
| Parameter | Metformin | Pioglitazone | Glimepiride | |||
|---|---|---|---|---|---|---|
| Reference methoda | RP-HPLC | Reference methoda | RP-HPLC | Reference methoda | RP-HPLC | |
| Mean | 100.11 | 99.41 | 100.12 | 100.09 | 101.21 | 100.71 |
| S.D | 0.720 | 0.725 | 0.541 | 0.751 | 0.410 | 0.628 |
| N | 6 | 6 | 6 | 6 | 6 | 6 |
| Variance | 0.518 | 0.526 | 0.293 | 0.564 | 0.168 | 0.394 |
| Student’s t test (2.23)b | — | 1.678 | — | 0.079 | — | 1.633 |
| F test (5.05)b | — | 1.014 | — | 1.927 | — | 2.346 |
aRP-HPLC Method [25].
bThe values in parenthesis are the corresponding theoretical values of t and F at p = 0.05.
4 Conclusion
An eco-friendly HPLC method was developed and validated for the determination of metformin, glimepiride, and pioglitazone. The developed HPLC method employed ethanol as a solvent for analyte separation, which is recognized as a safe and harmless substance. Additionally, the short run time of the HPLC methods resulted in a reduced amount of waste generated, thereby increasing the environmental friendliness of the methods. Comparative analysis with other reported chromatographic methods revealed no significant differences in terms of accuracy. However, a notable distinction was observed in the greenness of the method, indicating that the developed method excelled in its environmental sustainability. The developed HPLC method is the first eco-friendly chromatographic method for the determination of the mentioned analytes.
To enhance the resolution of the analytes and minimize the number of experiments required for method development, a two-factor three-level experimental design was employed. This approach successfully increased the separation efficiency of the analytes. As a result, the developed HPLC method can be utilized for routine analysis of the studied mixtures without causing harm to the environment.
Acknowledgement
The authors acknowledge Kuwait University and Ahram Canadian University for providing the premises, instrument, and software to accomplish this work.
-
Funding information: Authors state no funding involved.
-
Author contributions: Naser F. Al-Tannak and Ahmed Hemdan contributed equally in writing – original draft, writing – review and editing, methodology, and formal analysis;
-
Conflict of interest: Authors state no conflict of interest.
References
[1] Anastas T. Green chemistry and the role of analytical methodology development. Crit Rev Anal Chem. 1999;29:167–75.10.1080/10408349891199356Search in Google Scholar
[2] Kirchhoff MM. Promoting sustainability through green chemistry. Resour Conserv Recycl. 2005;44:237–43.10.1016/j.resconrec.2005.01.003Search in Google Scholar
[3] Heba M. Green, environment-friendly, analytical tools give insights in pharmaceuticals and cosmetics analysis. Trends Anal Chem. 2015;66:176–92.10.1016/j.trac.2014.11.010Search in Google Scholar
[4] Namiesnik J. Pro-ecological education. Environ Sci Pollut Res. 1999;6:243–4.10.1007/BF02987339Search in Google Scholar PubMed
[5] De la Guardia M, Armenta S. Green Analytical Chemistry: Theory and Practice. Vol. 57. Amsterdam, The Netherlands: Elsevier; 2010.10.1016/B978-0-444-53709-6.00001-XSearch in Google Scholar
[6] De la Guardia M, Garrigues S. Challenges in Green Analytical Chemistry. Cambridge, UK: Royal Society of Chemistry; 2011.10.1039/9781849732963Search in Google Scholar
[7] Koel M, Kaljurand M. Green Analytical Chemistry. London, UK: Royal Society of Chemistry; 2010.Search in Google Scholar
[8] Tobiszewski M, Mechlińska A, Zygmunt B, Namieśnik J. Green analytical chemistry in sample preparation for determination of trace organic pollutants. TrAC, Trends Anal Chem. 2009;28:943–51.10.1016/j.trac.2009.06.001Search in Google Scholar
[9] Wardencki W, Curyło J, Namieśnik J. Green chemistrycurrent and future issues. Pol J Environ Stud. 2005;14:389–95.Search in Google Scholar
[10] Tobiszewski M, Mechlińska A, Namieśnik J. Green analytical chemistry—theory and practice. Chem Soc Rev. 2010;39:2869–78.10.1039/b926439fSearch in Google Scholar PubMed
[11] Elzanfaly E, Hegazy M, Saad S, Salem M, Abd El Fattah L. Validated green high-performance liquid chromatographic methods for the determination of coformulated pharmaceuticals: a comparison with reported conventional methods. J Sep Sci. 2015;38:757–63.10.1002/jssc.201401151Search in Google Scholar PubMed
[12] Yehia A, Heba M. Green approach using monolithic column for simultaneous determination of coformulated drugs. J Sep Sci. 2016;39:2114–22.10.1002/jssc.201600081Search in Google Scholar PubMed
[13] Seema S, Jairaj V, Rathod R. Applying green analytical chemistry for development and validation of RP-HPLC stability indicating assay method for estimation of fenoverine in bulk and dosage form using quality by design approach. J Liq Chromatogr Relat Technol. 2017;40:340–52.10.1080/10826076.2017.1304414Search in Google Scholar
[14] Korany M, Mahgoub H, Haggag R, Ragab M, Elmallah O. Green chemistry: analytical and chromatography. J Liq Chromatogr Relat Technol. 2017;40:839–52.10.1080/10826076.2017.1373672Search in Google Scholar
[15] Keith LH, Gron LU, Young JL. Green analytical methodologies. Chem Rev. 2010;107:2695–708.10.1021/cr068359eSearch in Google Scholar PubMed
[16] Anastas PT, Warner JC. Green Chemistry: Theory and Practice. New York: Oxford University Press; 1998.Search in Google Scholar
[17] Sirtori C, Pasik C. Re-evaluation of a biguanide, metformin: mechanism of action and tolerability. Pharmacol Res. 1994;30(3):187–228.10.1016/1043-6618(94)80104-5Search in Google Scholar PubMed
[18] Smith U. Pioglitazone: mechanism of action. Int J Clin Pract Suppl. 2001;121:13–8.Search in Google Scholar
[19] Davis S. The role of glimepiride in the effective management of Type 2 diabetes. J Diabetes Complicat. 2004;18(6):367–76.10.1016/j.jdiacomp.2004.07.001Search in Google Scholar PubMed
[20] Kumar S, Debnath M, Rao J, Sankar D. Simultaneous estimation of Metformin, Pioglitazone and Glimepiride in bulk samples and in tablet dosage forms by using RP-HPLC in an Isocratic mode. J Chem Pharm Res. 2015;7(1):941–51.Search in Google Scholar
[21] Shaikh S, Dighe N. Simultaneous estimation of pioglitazone, glimepiride & metformin hydrochloride in bulk & tablet dosage form by UV, RP-HPLC method. 2021;8(3):91–9.10.18231/j.ijpca.2021.019Search in Google Scholar
[22] Sebaiy M, El-Adl S, Baraka M, Hassan A. Rapid RP-HPLC method for simultaneous estimation of Metformin, Pioglitazone, and Glimepiride in Human Plasma. Acta Chromatogr, 2020;32(1):16–21.10.1556/1326.2018.00515Search in Google Scholar
[23] Khan H, Ali M, Ahuja A, Ali J. Validated UPLC/Q-TOF-MS method for simultaneous determination of Metformin, Glimepiride and Pioglitazone in human plasma and its application to pharmacokinetic study. Asian J Pharm Tech. 2017;7(1):27–32.10.5958/2231-5713.2017.00005.8Search in Google Scholar
[24] Tengli A, Shivakumar G, Gurupadayya B. UPLCMS method development and validation of tablet dosage form containing Glimepiride, Metformin and Pioglitazone using internal standard. IOSR J Pharm. 2014;4(1):6–14.10.9790/3013-04106-14Search in Google Scholar
[25] Hemdan A, Abdel-Aziz O. Application of a fast separation method for anti-diabetics in pharmaceuticals using monolithic column: comparative study with silica based C-18 particle packed column. J Chromatogr Sci. 2018;56(4):351–7.10.1093/chromsci/bmy009Search in Google Scholar PubMed
[26] Płotka-Wasylka J. A new tool for the evaluation of the analytical procedure: green analytical procedure index. Talanta. 2018;181:204–9.10.1016/j.talanta.2018.01.013Search in Google Scholar PubMed
[27] Pena-Pereira F, Wojnowski W, Tobiszewski M. AGREE—Analytical GREEnness metric approach and software. Anal Chem. 2020;92(14):10076–82.10.1021/acs.analchem.0c01887Search in Google Scholar PubMed PubMed Central
[28] Emergency Planning and Community Right-to-Know Act; Section 313; Toxic Release Inventory (TRI), 2004.Search in Google Scholar
[29] Sadek PC. The HPLC Solvent Guide. New York: Wiley; 1996.Search in Google Scholar
[30] International Conference on Harmonization (ICH), 62, US FDA Federal Register 1997.Search in Google Scholar
[31] Jain D, Jain S, Jain D, Amin M. Simultaneous estimation of metformin hydrochloride, pioglitazone hydrochloride, and glimepiride by RP-HPLC in tablet formulation. J Chromatogr Sci. 2008;46(6):501–4.10.1093/chromsci/46.6.501Search in Google Scholar PubMed
[32] Nirupa G, Tripathi U. RP-HPLC analytical method development and validation for simultaneous estimation of three drugs: Glimepiride, pioglitazone, and metformin and its pharmaceutical dosage forms. J Chem. 2012;2013:726235.10.1155/2013/726235Search in Google Scholar
[33] Suchitra M, Sunitha D, Parthiban C, Siddartha B, Madhavi C. Method development and validation of metformin, glimepiride and pioglitazone in tablet dosage form by RP-HPLC. Int Res J Pharm. 2013;4(8):250–4.10.7897/2230-8407.04850Search in Google Scholar
[34] Marie A, Hammad S, Salim M, Elkhodaryet M, Kamal A. Deduction of the operable design space of RP-HPLC technique for the simultaneous estimation of metformin, pioglitazone, and glimepiride. Sci Rep. 2023;13:4334.10.1038/s41598-023-30051-xSearch in Google Scholar PubMed PubMed Central
© 2023 the author(s), published by De Gruyter
This work is licensed under the Creative Commons Attribution 4.0 International License.
Articles in the same Issue
- Research Articles
- Detection of exosomes in various biological fluids utilizing specific epitopes and directed multiple antigenic peptide antibodies
- A green HPLC method for the determination of apixaban in pharmaceutical products: Development and validation
- Real-time monitoring of recombinant GFP expression in single-cell Komagataella phaffii through filamentous pelletization technology
- Review Articles
- Progress of sensitive materials in chemiresistive sensors for detecting chemical warfare agent simulants: A review
- Major biochemical constituents of Withania somnifera (ashwagandha) extract: A review of chemical analysis
- A brief review of the application of microextraction by packed sorbent for antibiotics analysis from biological, food, and environmental samples
- Poly- and per-fluoroalkyl substances in water: Occurrence, analytical methodologies, and remediations strategies: A comprehensive review
- Special Issue: Greener Analytical Methods - Part I
- Green novel photometric and planar chromatographic assays of remdesivir: Comparative greenness assessment study using estimated GAPI tool versus ISO technical reported methods
- Enhancing methane sensing with NDIR technology: Current trends and future prospects
- Eco-friendly HPLC method by using response surface design to measure a combination of three antidiabetic drugs
- Metal and metalloid monitoring in water by passive sampling – A review
- Green chemistry and its implementation in pharmaceutical analysis
- Synthesis of a benzothiazole-based structure as a selective colorimetric-fluorogenic cyanate chemosensor