
Characterization of polymeric biomedical balloon: physical and mechanical properties
-
Farhad Sadeghi
 and
David Le
and
David Le

Abstract
Tubes from nylon 12 and Pebax 6333 resins were produced using an extrusion process. The extruded tubes were used to produce balloons for angioplasty applications. The tubes were stretched using blow molding process to produce balloons. Melt rheology behavior for nylon 12 and Pebax were studied and nylon 12 showed a more pronounced shear thinning behavior compared to Pebax. Orientations of the tubes and the balloons were assessed using Fourier transform infrared spectroscopy (FTIR) and it was found that nylon material is more sensitive to molecular orientation when stretched compared to Pebax material. Melting behavior for the tubes and balloons were investigated using dynamic scanning calorimetry (DSC). The melting temperature shifted to higher temperatures when the tubes are stretched into balloons and the shift was more pronounced for Pebax balloon than nylon. Morphology of Pebax balloon surface revealed a hybrid structure consisting of hard segments dispersed in soft segments and amorphous phases. The hard segments are crystallized polyamides that are biaxially oriented in the balloon with higher molecular orientation in the radial direction compared to axial direction. This resulted in a higher tensile strength along the radial direction compared to axial for the balloons. Dynamic mechanical analyzer (DMA) tests showed that the glass transition temperature of the nylon tubes shifted to higher temperatures (from 51 to 82 °C) during the balloon forming process, which means the nylon becomes stiffer and less flexible when formed into a balloon.
1 Introduction
A balloon catheter is used for an angioplasty procedure. The balloon is assembled on a catheter and can be inflated internally. After inserting the catheter into the femoral artery, the surgeon moves and guides the catheter through the vessel until balloon reaches the clogged artery area. The next step is to inflate the balloon to clear the blockage. The balloons are usually made of inflated extruded tubes (blow molded) where the tubes are stretched in axial and radial directions in a balloon forming machine. The main properties of balloons are surface smoothness, puncture resistance, and burst strength. These properties are controlled by polymer selection and processing [1]. The balloon diameter size ranges from 2 to 10 mm and length ranges from 2 to 10 cm long. Balloon diameter size varies depending on the material and application. The very first process of making balloons is to form the tubes via polymer extrusion [1, 2]. Nylon 12 and Pebax are two polymers that are widely used in balloon applications because of their mechanical properties and biocompatibility [3, 4]. The properties of formed balloons are dependent on the type of material, extrusion process and balloon forming program. The chemical molecular structure of nylon 12 and Pebax are shown in Figure 1. Nylon 12 is a polyamide polymer that also contains segments of hydrocarbon groups. The amide group is hydrophilic and therefore this polymer adsorbs moisture. The rate and content of moisture absorption is lower when compared to nylon 6 because of the addition of six extra hydrocarbon segments into the repeating unit structure (total carbon of 12). The water absorption is 1.3% for nylon 6 and 0.23% for nylon 12 after 24 h at 25 °C and atmospheric conditions [5]. Nylon 12 is a semicrystalline material with a crystallinity of about 23.4% [6]. The crystalline phase contributes to the rigidity of the material and the amorphous phase that forms the rest of the structure contributes to flexibility and stretchability of the material. Pebax is a copolymer of nylon 12 and a polyether.
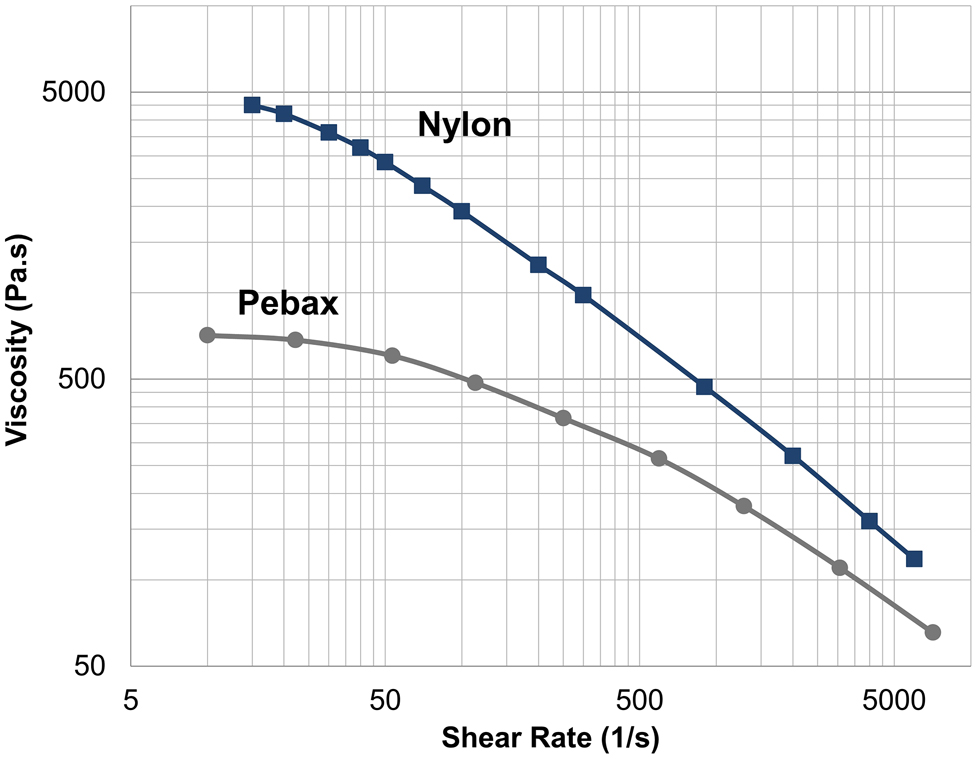
Viscosity curve for nylon and Pebax at 230 °C.
Pebax that is a tradename from Arkema, is a polyether block amide (PEBA) and is categorized as a thermoplastic elastomer. The polyether segment contributes to elastomeric behavior and creates soft segments, whereas the polyamide contributes to the thermoplastic behavior and forms the hard segments [7]. Extruding the material into polymer tubes is the first step for manufacturing the balloon. The rheology, molecular structure, and extrusion processing parameters play important roles in producing tubes with different physical and mechanical properties. The tubes are then stretched axially and radially in a balloon forming machine using a specific recipe that includes combinations of temperature and air pressure to make the final balloon. The tubes are stretched in different cycles in the axial and radial directions, exposing the tube to uniaxial and biaxial molecular orientation. Sadeghi et al. [8] showed that physical and mechanical properties of nylon are related to the degree of polymer stretching. They also showed that the stretching ratio is correlated with the molecular orientation of polymer chains. It was shown that the tensile properties for nylon 6 are significantly improved if the stretching ratio is above 1.5 [8]. It was also shown that the orientation factor of polyamide crystals increases with stretching ratio and reaches a plateau around the stretching ratio of 2. Rhee et al. [9] investigated the crystal structure and morphology of biaxially stretched nylon 12. They showed that room temperature aging of nylon 12 increases the glass transition temperature (Tg) making the samples stiffer. They attributed this to the cold crystallization during the amorphous phase. They also revealed the presence of two crystalline phases of α and γ for nylon 12 for both oriented and non-oriented samples. Cole et al. [10] and Sadeghi et al. [11] measured the orientation factor of polyamide and studied the crystal structure of the two main types of crystalline forms of nylon: α and γ. It was shown that the crystalline structure of nylon in addition to the orientation of crystals contributed to the mechanical properties of polyamide. Dencheva et al. [12] showed that the γ form was more ductile than the α form however a transformation of the γ form to α will occur for nylon 6 if extruded samples are stretched.
For Pebax, the soft to hard segment ratio plays an important role in controlling the physical and mechanical properties of the balloon. Warner et al. [13] investigated balloon surfaces made from Pebax. They observed a distribution of hard segments of polyamide in a circumferential orientation in the balloon body. The hard segments were reported to be (50 ± 20) nm wide by (300 ± 150) nm long. They identified that the extrusion process was responsible for hard segment orientation along the axial direction.
Zhen et al. [14] investigated the crystalline structure changes of nylon 12 in the balloon forming process. They showed that during the balloon forming process, crystalline structure is broken and rearranged into smaller crystals and becomes more oriented. They reported that γ crystals transform to α crystals during stretching.
It is important to characterize and study the effects of material (nylon 12 and Pebax) within physical and mechanical balloon properties considering the extent of application of these materials in the biomedical field. There are a few studies which cover the polymer material effect. This study will investigate the differences of materials (nylon 12 versus Pebax) on the crystalline structure, the physical and mechanical performance of the balloons.
2 Materials and methods and characterization
Materials: Two resins were used in this study: Grilamid L25 (nylon 12) from EMS and Pebax® 6333 SA01 MED (a thermoplastic elastomer from Arkema). The tubes were produced using a one-inch extruder from American Kuhne. Balloons with dimension of 6 × 100 mm (diameter × length) were produced using a Confluent Medical Technologies balloon forming machine. DMA (dynamic mechanical analyzer) tests were performed using a DMA 8000 from Perkin Elmer (Waltham, MA) in tension mode. To evaluate orientation and characterize phase formation, FTIR experiments were carried out by recording infrared spectra on a Frontier FTIR instrument from Perkin Elmer (Waltham, MA) with a resolution of 4 cm−1 and an accumulation of 16 scans. The beam was polarized by means of a Spectra-Tech zinc selenide wire grid polarizer. Thermal properties of the films were analyzed using a differential scanning calorimeter (DSC) 6000 from Perkin Elmer. The samples were heated from −30 to 200 °C at a heating rate of 10 °C/min, then cooled at the same rate to −30 °C and heated again to 200 °C.
Tensile tests were performed using a Shimadzu (AGS-X series) machine (Kyoto, Japan). The tests were performed with a crosshead speed of 127 mm/min. Puncture tests were performed based on ASTM F1306 with a probe size of 1.6 mm diameter.
3 Results and discussion
The viscosity data was extracted from the data provided by the suppliers and the viscosity curves (viscosity versus shear rate at 230 °C) are plotted in Figure 1. Nylon and Pebax are categorized as thermoplastics which means that their melt viscosity depends on the shear rate applied [8, 15]. The polymer viscosity is an important criterion for the extrusion process. The viscosity of the polymer correlates with pressure applied at the die. The pressure at the die determines the consistency and stability of the melt flow and is important as it maintains the dimensions for the extruded tube.
Pebax exhibits a Newtonian plateau in the terminal zone (lower shear rate region), whereas the plateau region is less pronounced for nylon 12 where it shows a higher viscosity and an earlier shear thinning (viscosity reduction with applied shear). This reduction of viscosity in the shear thinning region is due to the molecular alignments and disentanglements of the long polymer chains [11]. The extrusion process for tube extrusion is usually designed for a shear rate range of 100–1000 s−1 [15]. For this study, the range is between 400 and 800 s−1 at the die where shear thinning behavior is more pronounced for nylon compared to Pebax. For example, a 30% increase in puller speed would reduce the viscosity at the die by 15% for nylon but only 6.9% for Pebax, so extrusion of nylon would be more sensitive to such process parameters.
In the extrusion process, materials are melted and then enter a water bath where they crystallize and form a morphology. The morphology and orientation within each tube determines the physical and mechanical properties. Rhee et al. [9] reported that nylon 12 is a semicrystalline material with crystallinity of 18%, the balance (82%) of the material is composed of an amorphous phase that will contribute to flexibility of tube. The Pebax as mentioned in the introduction is a copolymer of nylon 12 (PA) and polyether (PEO). The morphology of the Pebax balloon surface was recorded using polarized optical microscopy and the result is shown in Figure 2. The morphology of Pebax consists of crystallized polyamide (PA) hard segments dispersed in polyether (also called polyethylene oxide-PEO) and amorphous phases of PA (noncrystallized). It is shown that PEO can be crystallized even at room temperature [16] resulting in finer lamellae. Armstrong et al. [17] reported a crystallinity of 10.7% for the PEO portion. Sheth et al. [18] reported that Pebax 6333 is composed of 61% (mol%) nylon 12 and 38% PEO (mol%). It is seen in Figure 2 that the hard segments (crystallized PA segments) are uniformly distributed in a biaxial direction throughout the balloon’s surface.
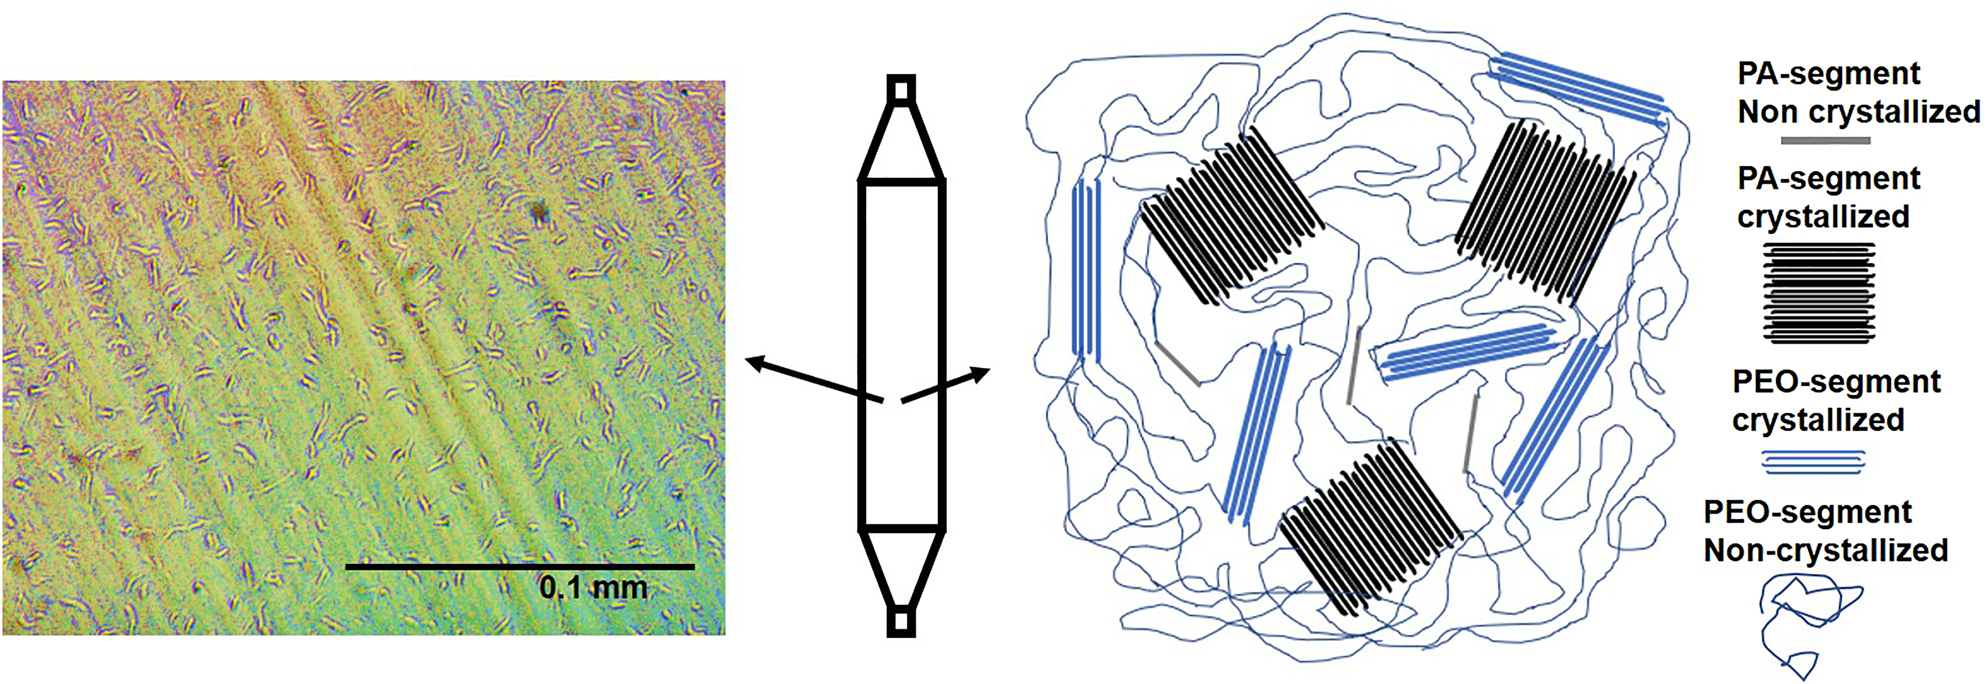
Optical microscopy of the Pebax balloon surface at magnification of 40×.
The extruded tube is expanded axially and radially (blow molding) to form the balloon. One of the effects of the expansion is the orientation of the polymer which improves mechanical strength. Sadeghi et al. [19] showed that both the physical and mechanical properties significantly increased with higher orientation. Tensile tests in the axial direction were performed on the tubes and the balloons. The stress–strain curves can be seen in Figure 3. It is observed that stretching significantly increases the stress at break for both nylon and Pebax. The greatest impact of stretching during the balloon forming process is the change in the behavior of the material. Yielding disappears, and instead a sharp increase in stress is observed. Similar results were observed for nylon 6 when uniaxially stretched to a draw ratio of 50% and over eight.
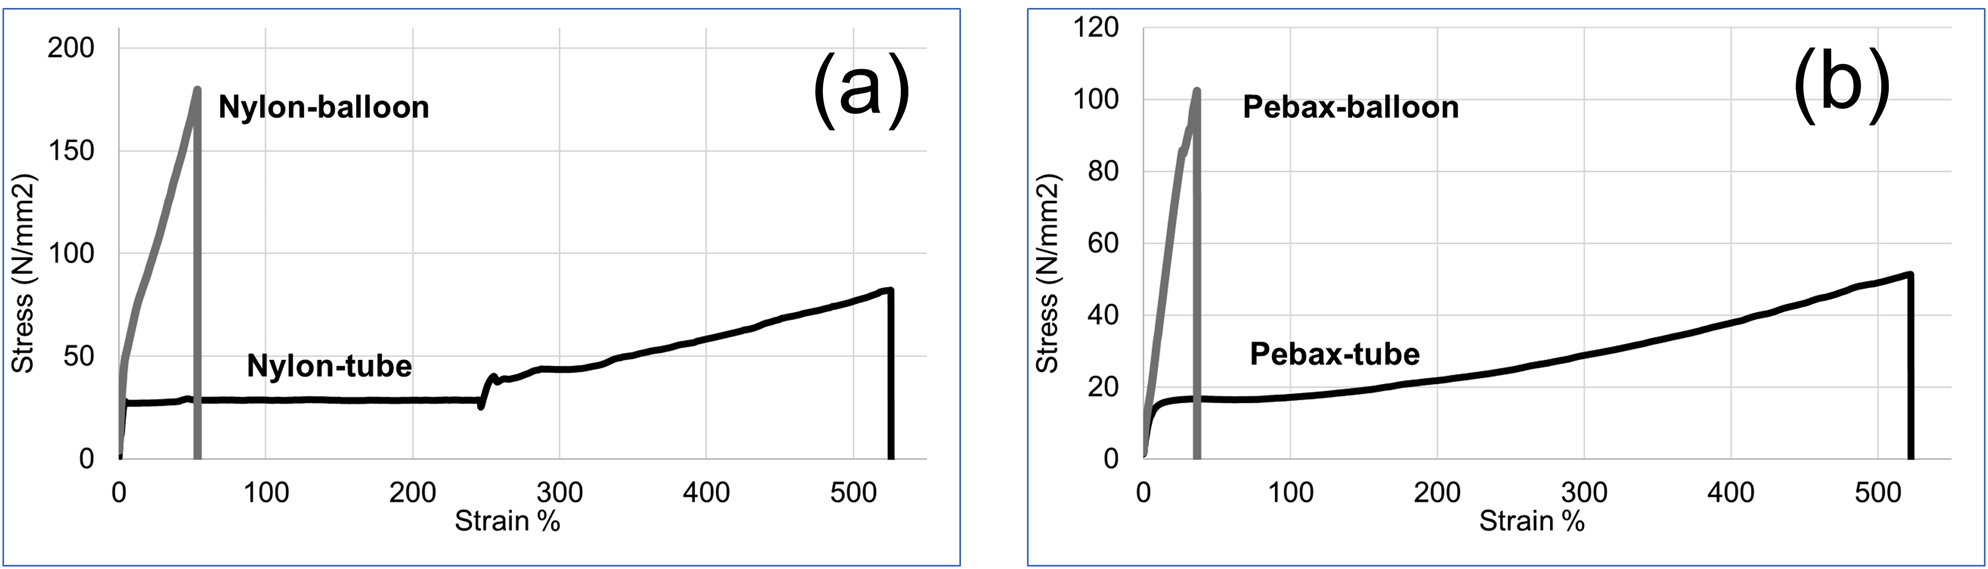
Stress–strain curve for tube and balloon.
This is mostly because of breakdown of initial crystalline structures and formation of fibrillar crystals [19]. In such a process, saturation in orientation of amorphous phases during stretching was reported [19]. Stretching saturation in amorphous regions will significantly limit the stretchability in axial direction; this limitation is higher for Pebax balloons when compared to nylon balloons. The other noticeable change is the yielding behavior of nylon 12 which disappears upon stretching. This is very similar to results published by Sadeghi et al. [8] for the stretching of nylon 6. To evaluate the tensile strength of the balloons in axial and radial directions, a rectangular sample was cut from the balloons and tensile tests were performed along axial and radial directions. The results have been shown in Figure 4. It is observed that the balloon is stronger overall in radial direction when compared to the axial direction. This is more pronounced for nylon than Pebax balloon. This is advantageous for biomedical applications because radial burst increases risk of difficulty in removal and is therefore considered a higher risk failure mode compared to longitudinal burst. This is likely because of a higher molecular orientation applied in the radial direction, relative to axial direction [11]. The tensile behavior is less sensitive to direction for Pebax balloons. This is likely a result of the presence of soft segments that reduce the effect of crystallinity and normalize crystal orientation for the Pebax balloon.
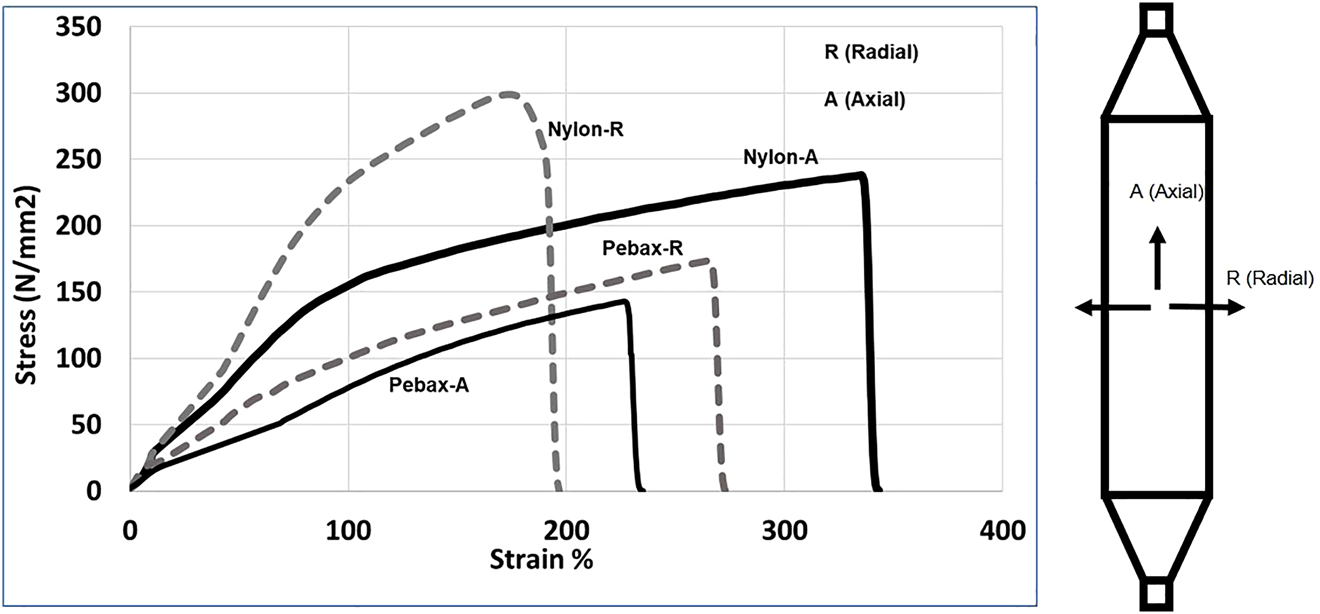
Stress–strain curve in axial and radial directions.
Both the flexibility and stiffness of balloons are important in their applications. The dynamic mechanical analyzer (DMA) was used to evaluate the balloon stiffness in this study. Figure 5a compares the storage modulus (E′) and tan (δ) for the nylon and Pebax tubes. Smaller storage modulus means less stiffness and in the Pebax tube’s case is related to presence of the soft segments [18]. A glass transition (Tg) around 50 °C is observed for the nylon tubes coinciding with a maximum for the tan (δ). The height and area under tan δ curve indicate the amount of energy that can be absorbed by the sample. A large area under the tan δ curve indicates a greater degree of molecular mobility, which translates into better dampening properties [20]. This means that the sample can better absorb and dissipate energy.
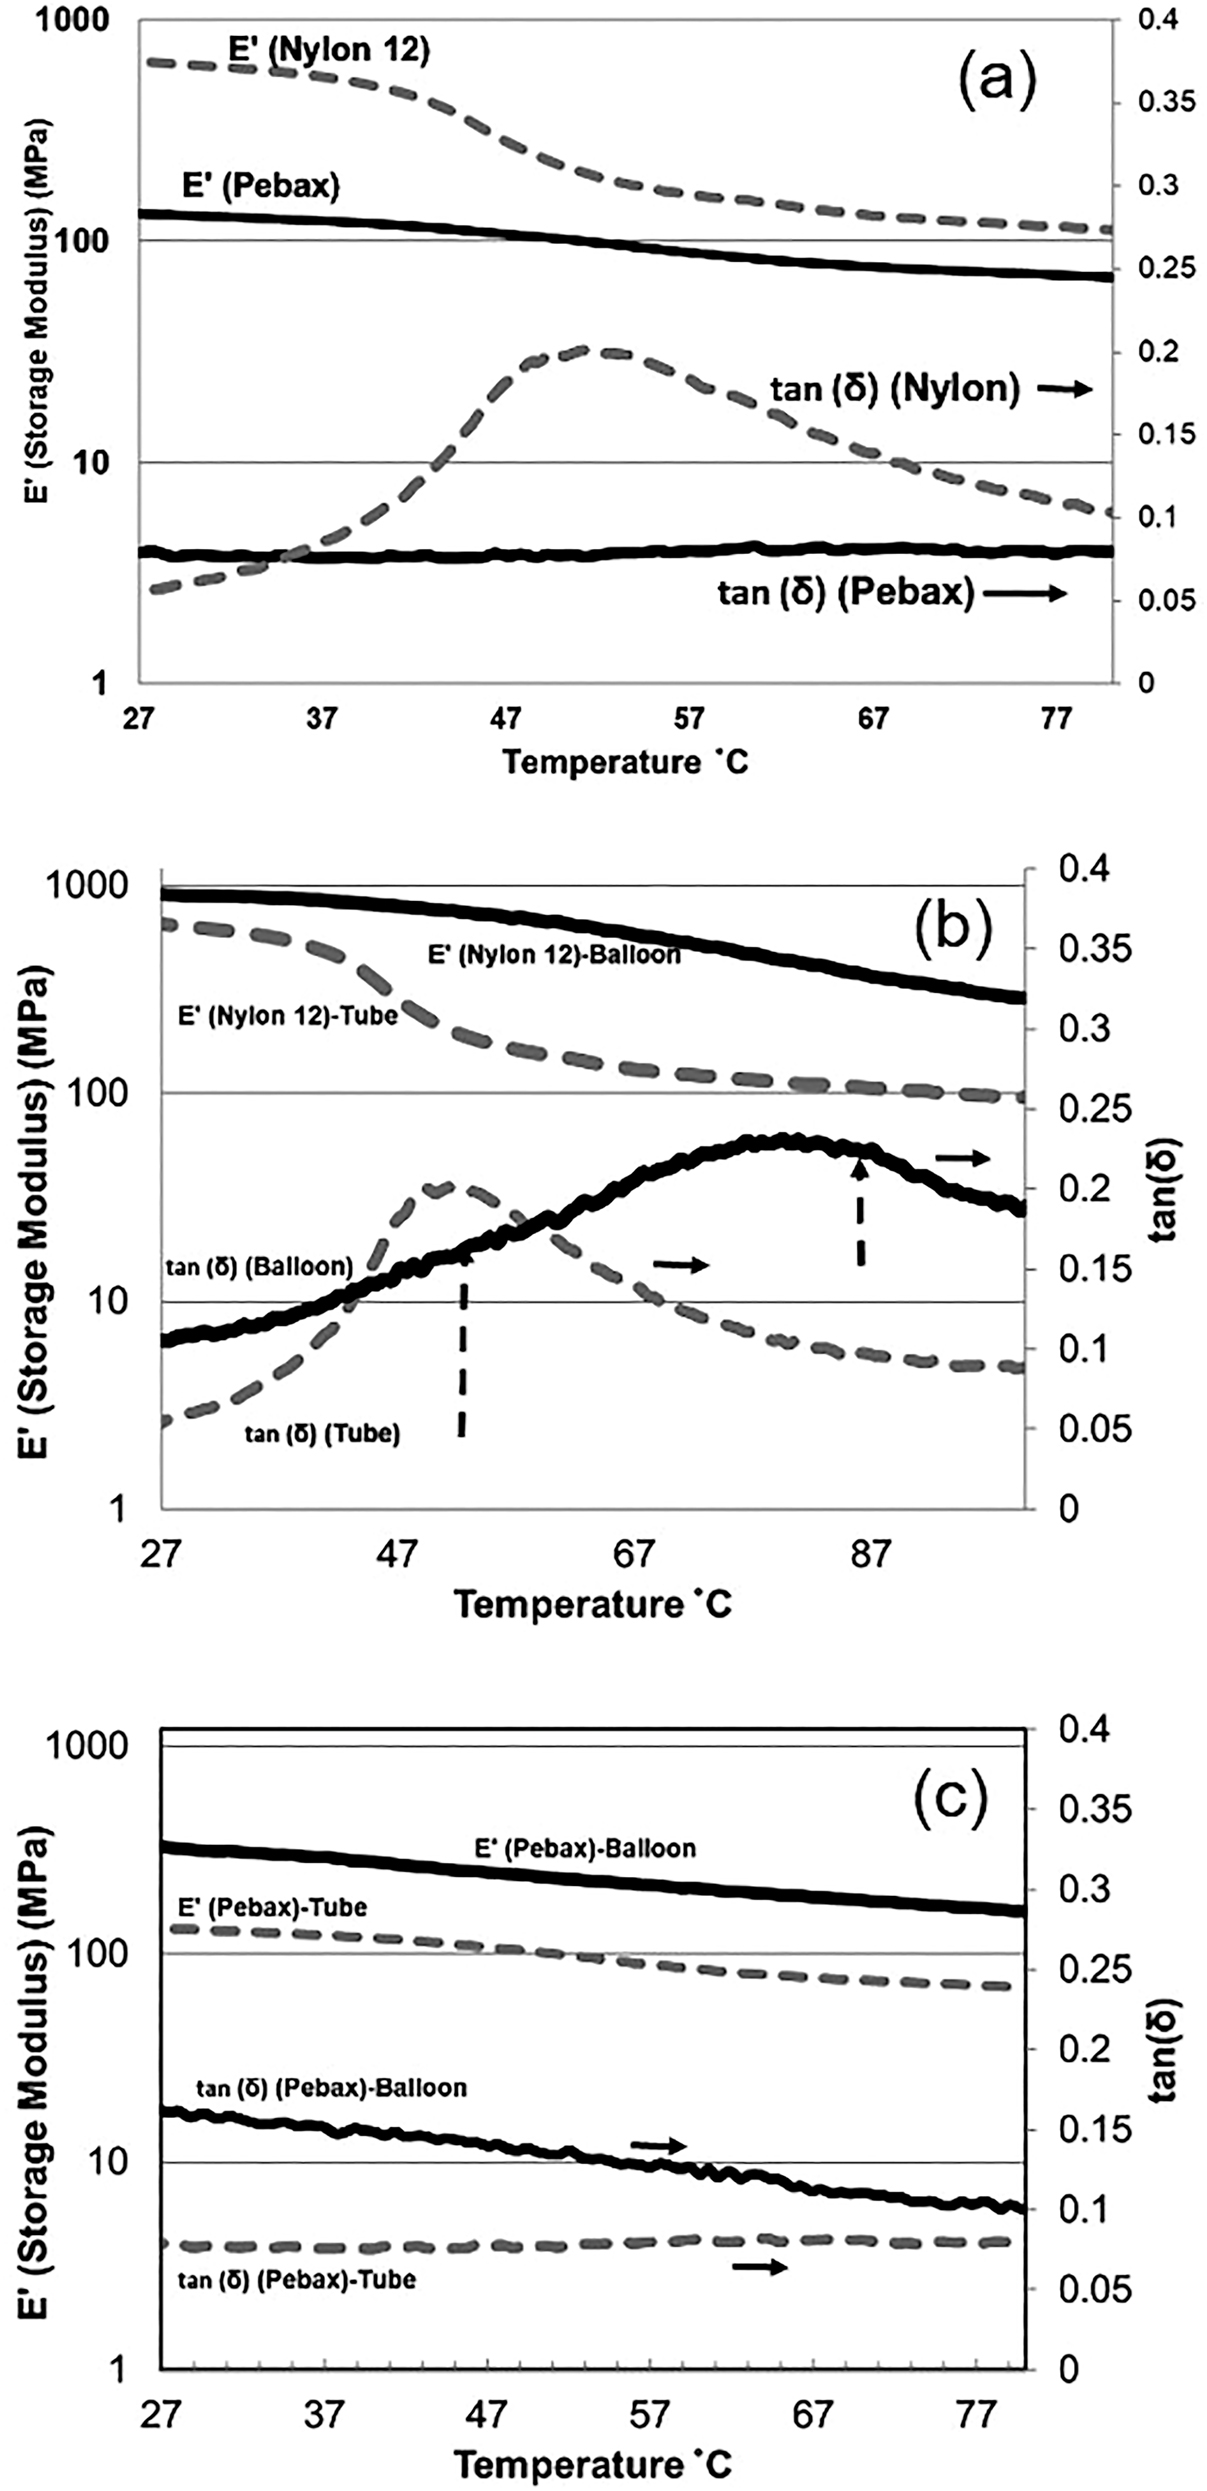
DMA results: (a) tubes, (b) nylon tube/balloon, and (c) Pebax tube/balloon.
Increasing tan δ indicates that the material has more energy dissipation potential so the greater the tan δ, the more dissipative the material is. On the other hand, decreasing tan δ means that the material acts more elastic, and by applying a load, it has more potential to store the load rather than dissipating it. Figure 5a shows that nylon tubes are more elastic than Pebax at room temperature, but as temperature increases it shows a Tg around 51 °C where the elastic modulus drops, and a maximum in tan δ is observed this means the nylon tube absorbs the highest energy at this temperature. The situation changes when the nylon tubes are made into balloons. As it is shown in Figure 5b, Nylon balloons become stiffer and more elastic than tube and the Tg peak shifts to a higher temperature (82 °C). This is most likely due to the molecular orientation for the balloon. The Pebax balloon is stiffer than the tube; however the Pebax balloon has more capability to dissipate energy. However, this capability decreases with temperature as it is observed in Figure 5c.
The dynamic scanning calorimetry (DSC) was used to analyze the thermal behavior of the samples and the results have been shown in Figure 6.
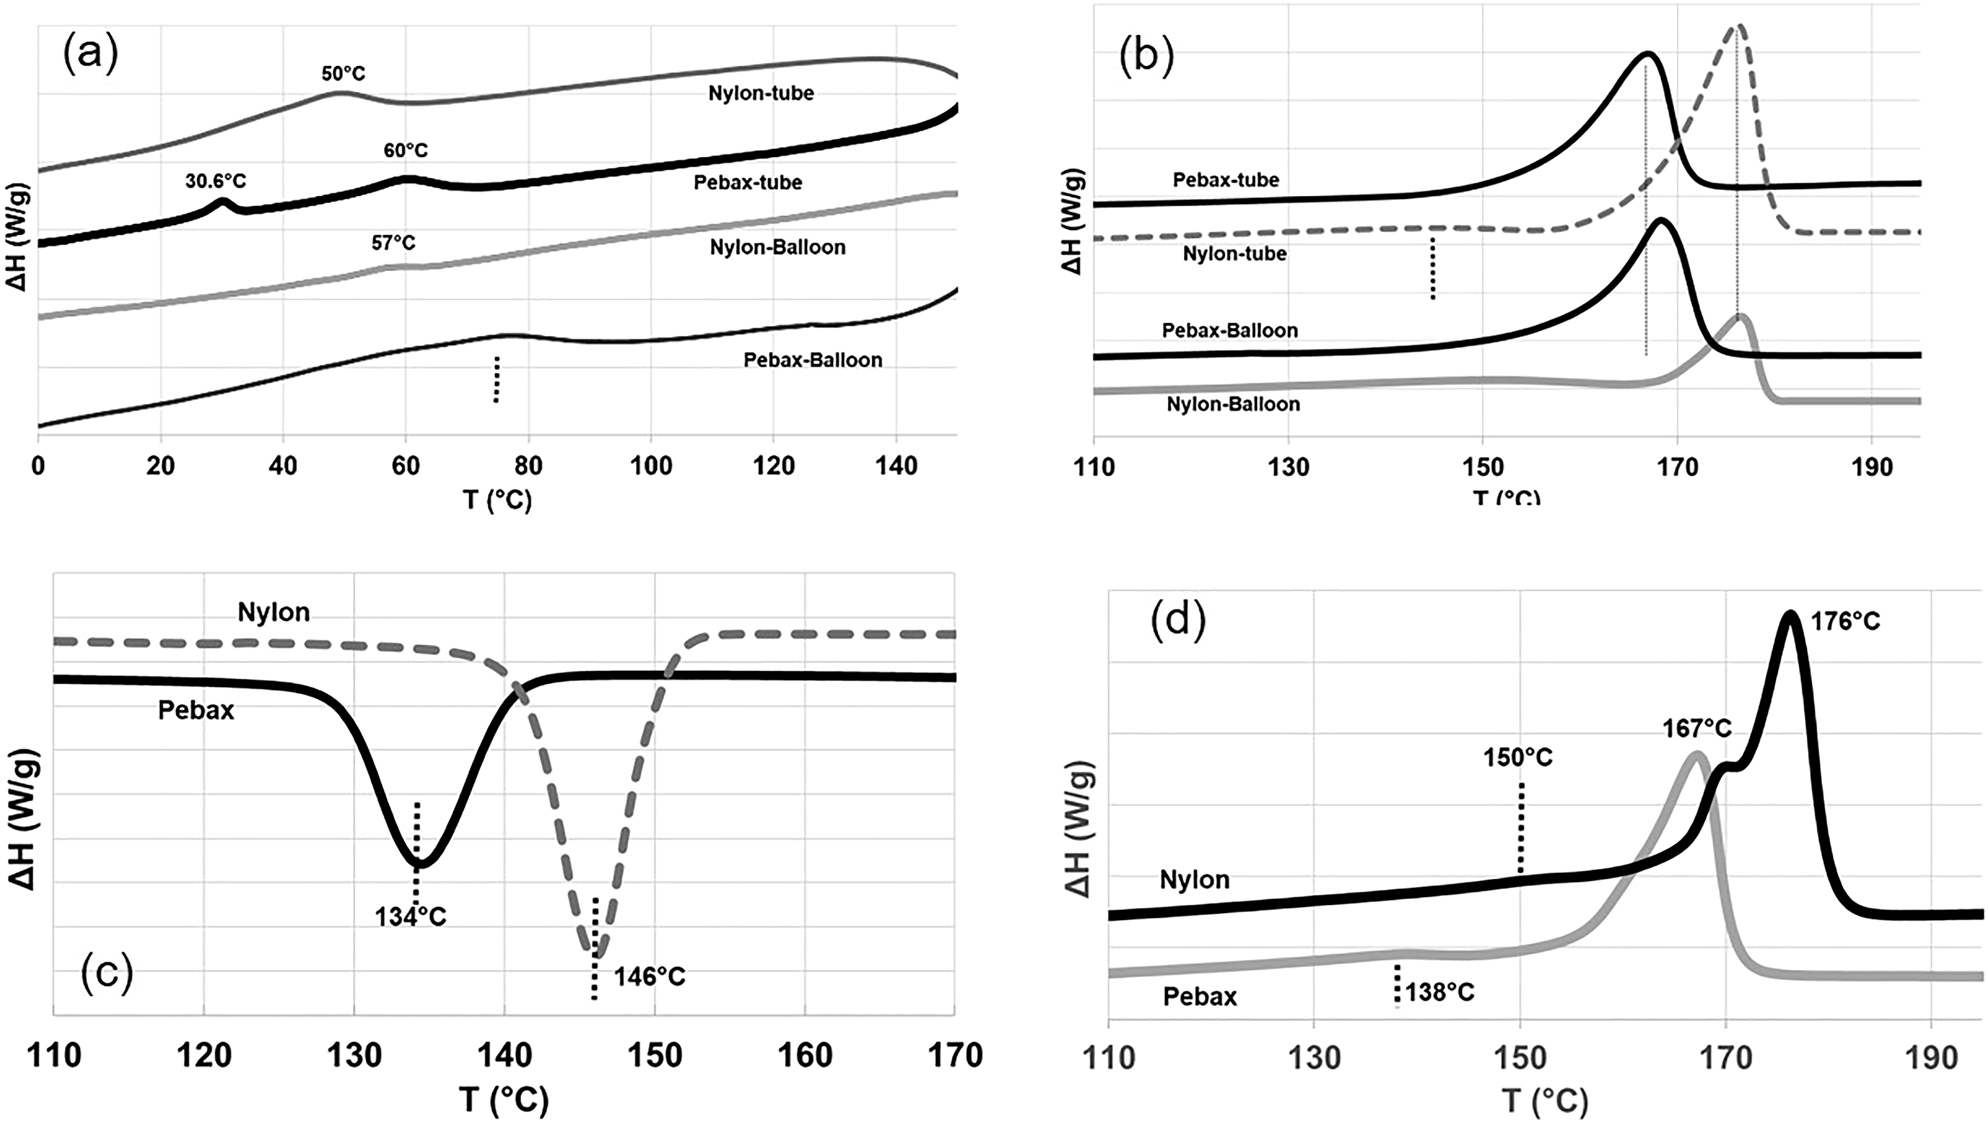
DSC results: (a) first heat (low temperature range), (b) first heat (melting temperature range), (c) crystallization temperature range, and (d) second heat melting temperature range.
The presence of Tg (at 50 °C) is confirmed for nylon tubes in Figure 6a, however for the tube and the balloon, Tg is less pronounced in the DSC experiments. The melting point of Pebax is lower than nylon for both tube and balloon: 168 °C for Pebax and 176 °C for nylon. The effects of balloon formation (stretching) on shifting the melting point are more pronounced for Pebax than nylon as seen in Figure 7b. The DSC of crystallization from the melt reveals a faster and sharper crystallization for nylon than Pebax (Figure 7c) where a 12 °C difference in crystallization temperature (Tc) can be observed for both materials. The nylon 12 shows a delay in crystallization when compared to nylon 6 (Tc of nylon 6 was reported at 188 °C by Sadeghi et al. [11]). The delay in crystallization for Pebax versus nylon is due to the presence of PEO segments [18]. The second melting point represents the behavior of materials without any orientation. The second heating cycle curve for the two materials are shown in Figure 6d. The presence of double melting peaks for nylon in quiescent crystallization is observed and is also reported elsewhere [8, 17]. The presence of double melting peaks is attributed to the two distinct crystal lamellae. The lower melting point corresponds to the thin lamellae initially formed, and higher melting point is attributed to the thicker lamellae formed during cooling [8].
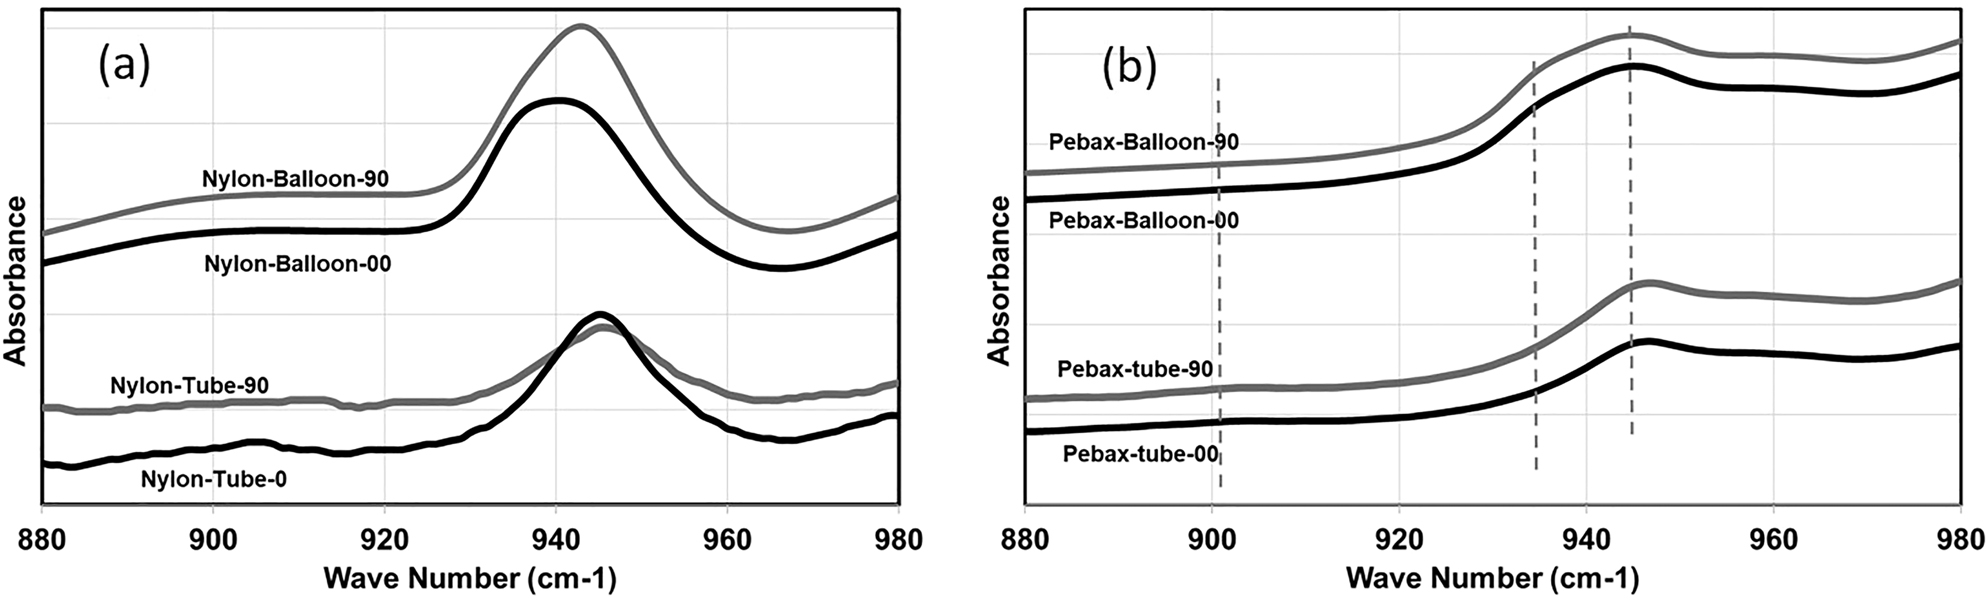
FTIR spectrum of tubes and balloons: nylon 12 (a) and Pebax (b).
FTIR spectroscopy can be used to characterize the orientation and phase structure of the samples [10]. It is based on the analysis of the energy of different molecular vibration modes associated with specific groups in the molecules. In a study by Cole et al. [10], a list of peaks assigned to the different conformations has been proposed for polyamides. Based on the reviewed literature [9] and our experiments, three peaks at wavenumbers of 904, 936, and 946 cm−1 were selected for FTIR characterizations. The peaks at 904 and 946 cm−1 correspond to the γ-crystalline phase and the 936 cm−1 peak is associated with the α-crystalline phase of the polyamide. As previously mentioned, the crystalline structure of nylon (polyamide) consists of a mixture of α and γ crystalline phases. The results for both tubes and balloons of nylon and Pebax are shown in Figure 7a and 7b, respectively. The measurements were performed along axial (0°) and radial (90°) directions as indicated on the curves to evaluate the effect of orientation using a polarized beam.
The crystals in nylon tubes mostly consist of γ phases and some converts to α phase when the tube is formed into the balloon. The Pebax tube crystals have more α phases when compared to nylon and this becomes more so when forming into a balloon. The conversion of γ phases to α phases for polyamides upon stretching has been reported elsewhere [8, 9]. The nylon 12 samples (both tube and balloon) are more sensitive to orientation when compared to Pebax. This can be revealed through the difference in the area under the peaks for the spectrum at angles of 0 and 90°. The higher orientation in radial direction for nylon balloons is in accordance with what was observed in the tensile results in Figure 4, where higher mechanical strength was observed in the radial direction. For Pebax, the soft segments can be identified using the peak at wavenumber 1100 cm−1 [17]. The results for nylon and Pebax tubes have been presented in Figure 8.
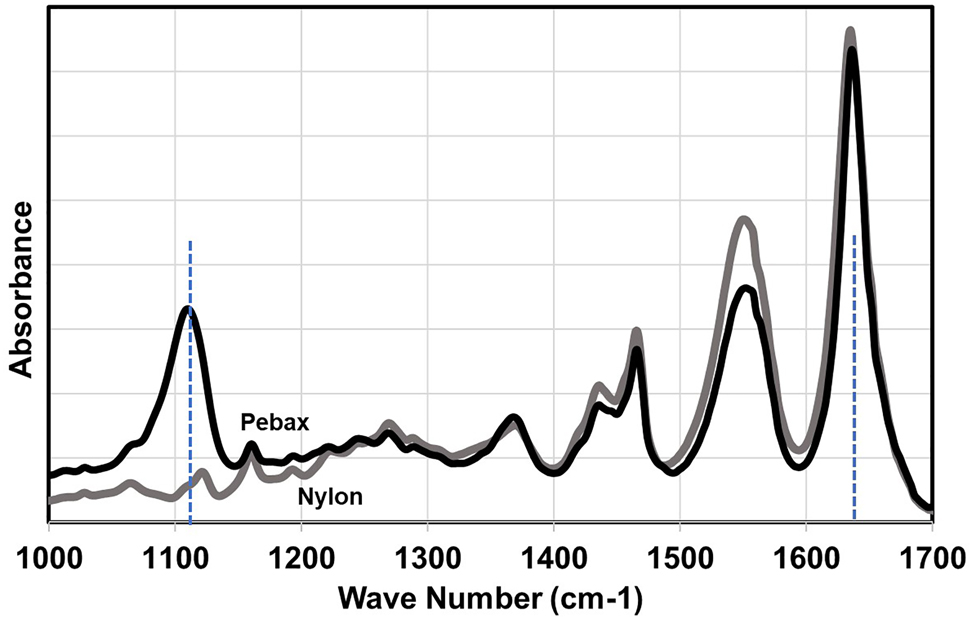
FTIR spectrum of nylon 12 versus Pebax.
The peak at 1640−1 represents the nylon structure (combination of α and γ) and is attributed to the stretching of Amide I (C==O stretching bond) [17] and the ratio of intensity at 1100 cm−1 to (1100 + 1640 cm−1) reveals the percentage of PEO portion (39%) for the Pebax tube [17].
It has been known that nylon exhibits a strong resistance to puncture in comparison to other polymers, especially when it is biaxially stretched [21]. Sadeghi et al. [8] showed that puncture resistance of polyamide increased with stretching. The results of puncture resistance for the balloon samples are shown in Figure 9. It is observed that the puncture strength (penetration force) is greater for Pebax balloons. The nylon balloon sample has shown a good yield against puncture but underperformed against the Pebax sample both in penetration force and deflection distance.
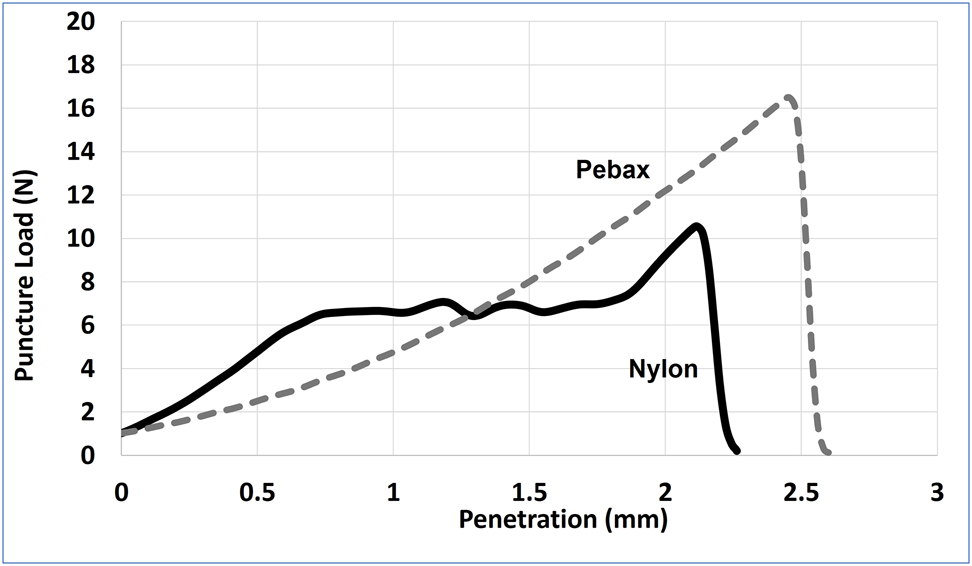
Puncture test for nylon and Pebax balloon.
Burst pressure is an important parameter in medical applications of balloon catheters and represents the strength of balloon when pressurized [14]. Burst pressure tests were performed on the tube and balloon samples in a ramp test. The results can be seen in Figure 10. Nylon tubes with a wall thickness of 0.355 mm passed the maximum capacity of the burst pressure machine. The lower burst pressure for Pebax tubes is likely due to the presence of soft segments. This contributes more to compliance rather than strength. Among the balloons, the Pebax sample shows a burst pressure that is half of the nylon balloon. The strength of nylon balloons against burst is in accordance with the tensile data reported in Figure 4, where nylon samples showed strength twice as that of the Pebax balloon.
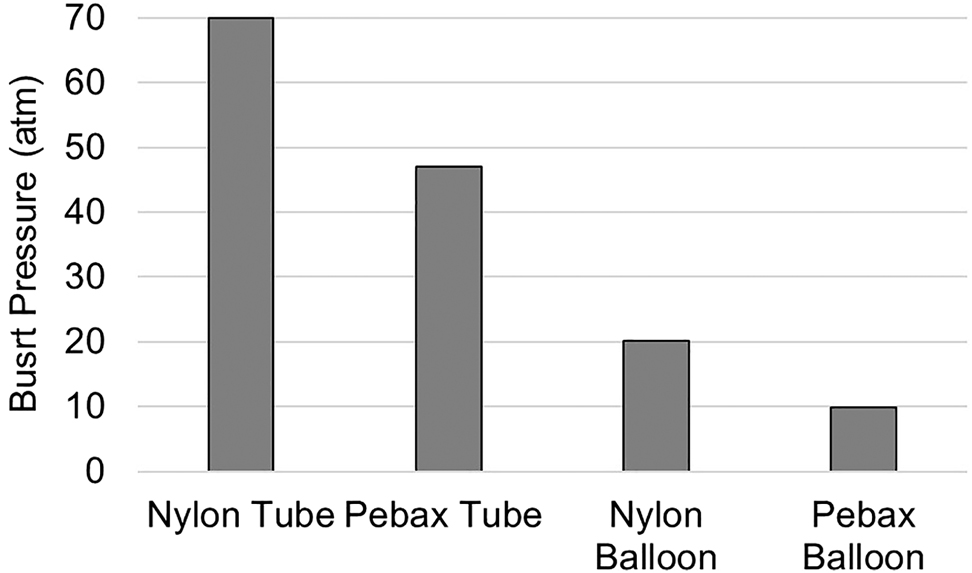
Burst pressure of nylon and Pebax tube and balloons.
4 Conclusion
Tubes from nylon 12 and Pebax 6333 were produced using an extrusion process. The extruded tubes were used to produce balloons for angioplasty applications. The melt rheology and crystalline structure of the tubes and balloons were evaluated using DMA, DSC and FTIR measurements. The physical and mechanical properties of the films were also studied. Our findings can be summarized as follows:
Nylon 12 shows a greater shear thinning behavior in a melt state when compared to Pebax and therefore the nylon tube dimension is more sensitive to extrusion processing parameters such as puller speed.
The Pebax balloon morphology revealed a hybrid structure consisting of hard segments dispersed with soft segments and amorphous phases. The hard segments are crystallized polyamide that is biaxially oriented in the balloon with higher molecular orientation in radial direction compared to the axial direction. This result in obtaining a higher tensile strength along the radial direction compared to axial.
The glass transition temperature of the nylon tube shifted to higher temperatures (51–82 °C), which means nylon becomes stiffer and less flexible when turned into a balloon.
The melting temperature shifted to higher temperatures when the tubes were formed into balloons; this shift was more pronounced for the Pebax balloon than the nylon.
FTIR results showed that the molecular orientation for nylon is more sensitive to stretching than Pebax, as the partial conversion of γ phase to α phase occurs for polyamide crystals during stretching (balloon formation).
The Pebax balloons showed a higher puncture resistance than the nylon balloon. However, the burst pressure was lower for Pebax (half of nylon balloon’s) which is in accordance with the balloon tensile data.
Acknowledgements
The authors wish to thank Frank Duran for help in the fabrication of puncture test fixture, and Sayeh Ghazyani with assisting in plotting the graphs.
-
Author contributions: All the authors have accepted responsibility for the entire content of this submitted manuscript and approved submission.
-
Research funding: None declared.
-
Conflict of interest statement: The authors declare no conflicts of interest regarding this article.
References
1. Ro, A. J., Davé, V. Mater. Sci. Eng. 2013, C 33, 909–915; https://doi.org/10.1016/j.msec.2012.11.020.Search in Google Scholar PubMed
2. Levy, S. B. J. Clin. Eng. 1986, 11, 291–296; https://doi.org/10.1097/00004669-198607000-00010.Search in Google Scholar
3. Saab, M. A. Med. Device Diagn. Ind. Mag. 2000, 86–96.Search in Google Scholar
4. Warner, J. A., Forsyth, B., Zhou, F., Myers, J., Frethem, C., Haugstad, G. J. J. Biomed. Mater. Res. B Appl. Biomater. 2016, 104b, 470–475; https://doi.org/10.1002/jbm.b.33414.Search in Google Scholar PubMed
5. Jia, N., Kagan, V. A. Mechanical performance of polyamides with influence of moisture and temperature – accurate evaluation and better understanding. In Plastics Failure Analysis and Prevention; NY by Plastic Design Library: NY, USA, 2001.10.1016/B978-188420792-1.50014-7Search in Google Scholar
6. Armstrong, S., Freeman, B., Hiltner, A., Baer, E. Polymer 2012, 53, 1383–1392; https://doi.org/10.1016/j.polymer.2012.01.037.Search in Google Scholar
7. Eustache, R. P. Poly(ether –b-amide) TPE: structure, properties and application. In Handbook of Condensation Thermoplastic Elastomers; John Wiley & Sons: Weinheim, Germany, 2006; pp. 263–283.10.1002/3527606610.ch10Search in Google Scholar
8. Sadeghi, F., Ajji, A. Int. Polym. Process. XXVII 2012, 5, 565–573; https://doi.org/10.3139/217.2619.Search in Google Scholar
9. Rhee, S., White, J. L. J. Polym. Sci. B Polym. Phys. 2002, 40, 1189–1200; https://doi.org/10.1002/polb.10181.Search in Google Scholar
10. Cole, K. C., Depecker, C., Jutigny, M., Lefebvre, J. M., Krawczak, P. Polym. Eng. Sci. 2004, 44, 231–240; https://doi.org/10.1002/pen.20022.Search in Google Scholar
11. Sadeghi, F., Fereydoon, M., Ajji, A. Adv. Polym. Technol. 2013, 32, E53–E64; https://doi.org/10.1002/adv.20270.Search in Google Scholar
12. Dencheva, N., Denchev, Z., Oliveira, M. J., Funari, S. S. J. Appl. Polym. Sci. 2006, 32, 2242–2252; https://doi.org/10.1002/app.25250.Search in Google Scholar
13. Warner, J. A., Forsyth, B., Zhou, F., Myers, J., Frethem, C., Haugstad, G. J. Biomed. Mater. Res. B Appl. Biomater. 2016, 104, 470–475; https://doi.org/10.1002/jbm.b.33414.Search in Google Scholar
14. Zhen, L., Xu, L. X., Lu, C. I., Liu, G. Z., Li, X. Y. Appl. Mech. Mater. 2014, 528, 153–161.10.4028/www.scientific.net/AMM.528.153Search in Google Scholar
15. Wagner, J. R., Mount, E. M., Giles, H. F. http://www.w3.org/1999/xhtml The Definitive Processing Guide and Handbook (Plastics Design Library), 2nd ed.; Elsevier: MA, USA, 2014.Search in Google Scholar
16. Money, B. K., Swenson, J. Macromolecules 2013, 46, 6949–6954; https://doi.org/10.1021/ma4003598.Search in Google Scholar
17. Armstrong, S., Freeman, B., Hiltner, A., Baer, E. Polymer 2012, 53, 1383–1392; https://doi.org/10.1016/j.polymer.2012.01.037.Search in Google Scholar
18. Sheth, J. P., Xu, J., Wilkes, G. L. Polymer 2003, 44, 743–756; https://doi.org/10.1016/s0032-3861(02)00798-x.Search in Google Scholar
19. Sadeghi, F., Carreau, P. J. Can. J. Chem. Eng. 2008, 86, 1103–1110; https://doi.org/10.1002/cjce.20109.Search in Google Scholar
20. Menczel, J. D., Prime, R. B. Thermal Analysis of Polymers Fundamentals and Applications; John Wiley & Sons, Inc.: Hoboken, NJ, 2009.10.1002/9780470423837Search in Google Scholar
21. Kohno, M., Tamemoto, K. Polym. Eng. Sci. 1987, 27, 558–561; https://doi.org/10.1002/pen.760270805.Search in Google Scholar
© 2021 Farhad Sadeghi and David Le, published by De Gruyter, Berlin/Boston
This work is licensed under the Creative Commons Attribution 4.0 International License.
Articles in the same Issue
- Frontmatter
- Material properties
- Study on the properties of composite superabsorbent resin doped with starch and cellulose
- Thermal stability, mechanical properties, and gamma radiation shielding performance of polyvinyl chloride/Pb(NO3)2 composites
- Effects of talc, kaolin and calcium carbonate as fillers in biopolymer packaging materials
- Tribological properties of organotin compound modified UHMWPE
- Recent progress on improving the mechanical, thermal and electrical conductivity properties of polyimide matrix composites from nanofillers perspective for technological applications
- Rheological and thermal stability of interpenetrating polymer network hydrogel based on polyacrylamide/hydroxypropyl guar reinforced with graphene oxide for application in oil recovery
- Characterization of polymeric biomedical balloon: physical and mechanical properties
- Preparation and assembly
- Preparation and properties of poly (vinyl alcohol)/sodium caseinate blend films crosslinked with glutaraldehyde and glyoxal
- Lignin reinforced, water resistant, and biodegradable cassava starch/PBAT sandwich composite pieces
- A simple and green approach to the preparation of super tough IIR/SWCNTs nanocomposites with tunable and strain responsive electrical conductivity