Fluorescence-optical handheld non-contact sensor for rapid cleaning validation of surfaces
-
Hans-Joachim Cappius
 ,
Joachim Börner
,
Joachim Börner

Abstract
Background and objective:
Thin films of bacteria, proteins and other biochemical substances are always found on surfaces exposed to the environment. Optical methods enable innovative tools for the detection of such films, as residua of proteins and other substances that exhibit fluorescence when excited with UV light.
Sensor design:
This paper presents and evaluates a specially designed handheld measuring device for this purpose.
Results:
The sensor is able to detect low concentrations of organic contamination with measurement times shorter than a second. The results presented in this paper show that detection of contamination levels of bovine serum albumin down to 200 ng/cm2 is possible on non-fluorescent substrate materials.
Conclusion:
Future development of handheld optical devices suitable for the detection or analysis of various compounds could be based on these results.
Zusammenfassung
Hintergrund:
Auf Oberflächen, die der Umgebung ausgesetzt sind, können fast immer dünne Schichten von Bakterien, Proteinen oder anderen biochemischen Stoffen gefunden werden. Optische Methoden ermöglichen innovative Werkzeuge, um diese Filme zu detektieren, da Rückstände von Proteinen und auch anderen Substanzen eine Fluoreszenzemission zeigen, wenn sie mit UV-Licht angeregt werden.
Sensordesign:
In diesem Artikel wird ein speziell konstruiertes handgehaltenes Messgerät vorgestellt und evaluiert.
Ergebnisse:
Der vorgestellte Sensor ist in der Lage, niedrige Konzentrationen von organischen Kontaminationen mit Messzeiten unter einer Sekunde zu detektieren. Die in diesem Artikel präsentierten Ergebnisse zeigen, dass es möglich ist, die Flächenbelegung von Schichten aus Serumalbumin mit Konzentrationen bis herunter zu 200 ng/cm2 auf nicht-fluoreszierendem Material zu bestimmen.
Schlussfolgerung:
Basierend auf diesen Ergebnissen kann die Weiterentwicklung eines handgehaltenen optischen Messgerätes für die Analyse verschiedener Kontaminationen mit guten Erfolgsaussichten angegangen werden.
1 Introduction
Cleaning validation is a very important step not only in many production processes but also before medical equipment is sterilized. It is used to assure that all residues of ingredients or contaminations originating from the previous use of a piece of equipment, from cleaning aids and/or of microbial organisms found on a piece of equipment, have been removed to below predetermined levels. Cleaning is clearly important to prevent cross-contamination in pharmaceutical production and to ensure the quality and shelf life in food production or to prevent inflammation resulting from medical examination instruments or implants. Suitable validation can help to optimize the cleaning process regarding resources used or outcome.
In many areas for cleaning validation quantitative and semi-quantitative methods are used with their respective advantages and disadvantages, such as the wet wipe test, chemical immersion test or microscope-assisted visual tests [1–10]. The first two are based on chemical solvents that are used with a swab or a piece of equipment that is soaked in a fluid and then a specific chemical reaction is used to detect and/or quantify the diluted contamination. The chemical tests elute particles and encounter insoluble protein films or can affect the clean surface. Optical methods are innovative tools for the detection of such films. Other techniques are often too insensitive to deliver information about the degree of contamination at a level that is required by government regulations for cleaning validation.
Optical methods, such as absorbance spectroscopy, fluorescence excitation or Raman spectroscopy are used to determine and quantify substances. As a general approach absorbance spectroscopy requires comparison with a clean sample and according to the calibration, can quantify the amount of substances by wavelength-specific absorption. Transmission measurements give reliable results of the amount of substance in a solvent. For an all-optical absorption measurement of opaque objects, the measurement has to be performed in reflection. This will not be very exact and may have a higher error at low concentrations, as the absorption can only be measured by the amount of light returning to the detector since scattered or reflected light may not reach the detector through many possible causes (e.g. surface structure). A better way is to measure the fluorescence of a specific substance, as this is excited by a given wavelength range and the substance (fluorophore) emits specific red-shifted fluorescence light. In a controlled environment, only certain fluorophores are present and thus can be separated and quantified. Even very low amounts of fluorophores still give a good signal. To achieve a more specific result, target substances can be detected by Raman-spectroscopic techniques, which have recently been shown to be suitable for the identification of bacteria such as Staphylococcus aureus [11]. For the detection of very low concentrations, enhanced Raman techniques such as surface enhanced Raman spectroscopy [12] or stimulated Raman spectroscopy [13] can be applied. These cannot be simply embedded into compact handheld measurement devices which have to be flexible in application and suitable to investigate surface areas that are not easily accessible, for example, surfaces inside big machines.
The aim of the presented project was to develop a handheld sensor, which can be used in many processes to give a quick and sensitive indication of a contamination. The pilot applications identified were medical products after cleaning and before sterilization – especially long and narrow lumina used as endoscopes or equipment for minimally invasive surgery as well as food preparation lines, where parts in big machines like the screw-conveyor have hard-to-reach areas. With these applications in mind, the optical method selected was the fluorescence detection of proteins, fat and carbohydrates, all of which form the basis for microbial life and it is not desirable to have any of these on the surfaces. Fluorescence detection on fluorescing substrates is also possible, but they require a different approach to distinguish between the substance and material (background) fluorescence. In the first approach this necessitates the use of several excitation wavelengths and spectral signal demultiplexing or expensive time-gated optical cameras and/or illumination.
Fluorescence on the substrate groups metal or glass surfaces, each of which do not have inherent fluorescence at ultraviolet (UV) light excitation, is optimally suited for detecting low concentrations of contamination, such as thin films of bacteria, proteins and other biochemical substances which are usually found on surfaces exposed to the environment. Residue of proteins and other substances exhibit fluorescence when excited under UV light.
2 Sensor design
The sensor detects autofluorescence from proteins as markers for sufficient cleaning of contaminated surfaces. For most of the planned applications, the absence of additional marker substances is crucial. Proteins consist of several hundred up to many thousand amino acids. Three out of 23 amino acids, tryptophan, tyrosine and phenylalanine, are fluorescent. Albumin is a frequently occurring example of these proteins present in blood and meat and containing the fluorescing amino acids of which tryptophan is the strongest fluorophore and is present in most proteins. Tryptophan exhibits a typical fluorescence spectrum with an emission maximum at 325 nm after excitation in the UV range (local absorption maximum at 280 nm). Other contaminations, such as dextrin, also exhibit fluorescence. Dextrins can be products of enzymatic starch digestion from amylases, generated during malting and mashing, or by applying dry heat under acidic conditions as can be the case in cleaning food-production lines or medical instruments.
Figure 1 shows the typical fluorescence spectra of the tryptophan-containing bovine serum albumin (BSA; Sigma Albumin, Bovine, Lot 85H0268, Fraction V) dried to different surface materials after excitation with 280 nm UV diode light. What can be seen here is that the shape of the fluorescence spectra of dried BSA on different surface materials is widely invariant to the surface material. Schmitt et al. [14] found that the intensity of the BSA fluorescence after excitation with 280 nm depends on the surface material while the spectral shape is rather slightly affected. This effect is assumed to result from surface quenching of the BSA fluorescence dependent on the surface material. The reproducibility of the BSA emission spectrum from many different materials can be used to quantify the BSA surface concentration for given materials by determining the overall emission in a certain spectral range (Figure 1).
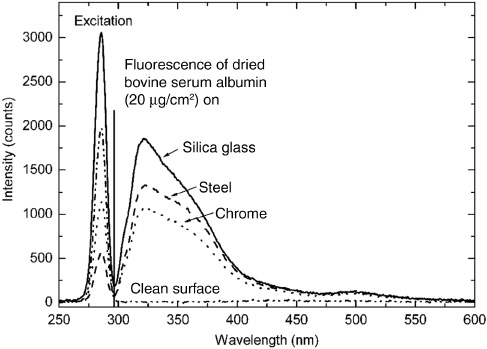
Excitation light peak at 280 nm and fluorescence spectra (separated by a vertical black line at 295 nm) of dried bovine serum albumin at a concentration of 20 μg/cm2 on silica glass (solid line), steel (dashed line) and chrome (dotted line). The signal of the clean surface is shown as a dash-dotted line.
Following the design as a straight-forward beam divider, the set-up was put together in an optomechanical building block system and optimized using dried samples. The schematic can be seen in Figure 2. A light emitting diode (LED) with a peak at 280 nm and 1.8 mW power was used for illumination. The cleanup interference filter was a Semrock FF01-280/20 with 80% transmission at 280 nm; the dichroic beam divider (Semrock FF310-Di01) reflects the excitation beam onto the sample and transmits the collected fluorescence light. Remaining excitation light is filtered (Semrock FF01-310/LP). The fibers used were NA=0.22 quartz fibers with 800 μm core diameter. Lens 1 for LED collimation was a Ø5 mm, f=5 mm biconvex quartz lens, lens 2 for the focus on the sample was a Ø7 mm, f=12.5 mm plano-convex quartz lens and lens 3 for the coupling into the spectrometer fiber was a Ø9 mm, f=15 mm plano-convex lens. The spectrometer used was a simple USB-connected charge-coupled device (CCD) spectrometer (EPP2000; StellarNet, Inc., Tampa, FL, USA).
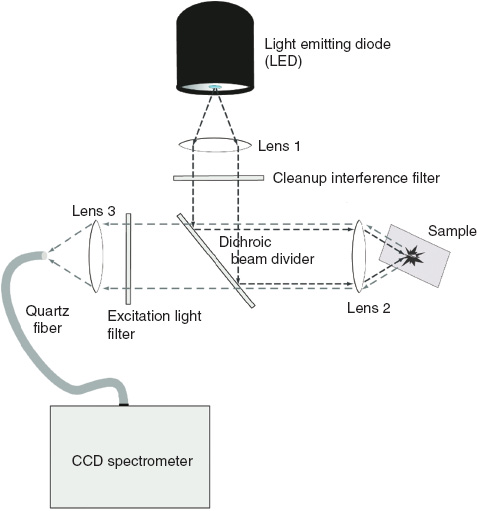
Schematic of the optical set-up of the sensor.
The high sensitivity of the fluorescence detection technique can be fully exploited with the sensor for measurements of dried BSA contaminations on non-fluorescent materials (e.g. metals or fused silica glass), if the fluorescence signal is analyzed in a wavelength range between 300 and 400 nm. A general calibration of the detector set-up was performed on wet droplets of BSA solution on stainless steel. The fluorescence from these droplets was found by Schmitt et al. [14] to be homogeneously distributed along the cross-section of the droplets with a linear relation between the surface concentration and the signal intensity in the wide range of 0.8–400 μg/cm2 BSA as shown in Figure 3. The fluorescence intensity was accumulated during 5 s and integrated in the spectral range of 300–400 nm. It can be seen there is a good chance to correlate the signal to the concentration of BSA.
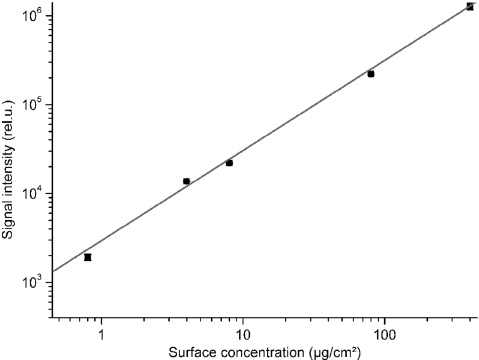
Double-logarithmic plot of the relationship between BSA surface concentration and signal intensity (integration time 5 s) gathered from wet droplets of BSA solution on stainless steel, measured with the handheld set-up according to Figure 2.
Following the testing of the sensor set-up and the development of the signal correlation with the protein concentration, a demonstrator sensor set-up was developed in cooperation with a large industrial partner. The results of the very compact optics are depicted in Figure 4. The optical sensor set-up is not substantially different from the set-up in Figure 2, but optimized for light transmission and equipped with optimized filters.
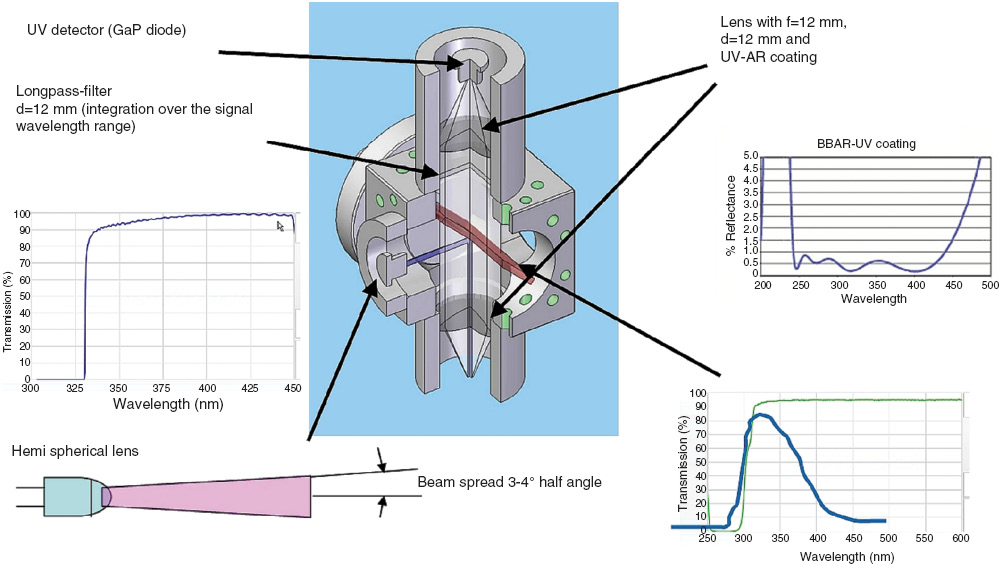
Optical set-up of the sensor demonstrator.
3 Sensor testing
The sensor was tested using the first set-up, as depicted in Figure 5. After the tests, which are described in this section, the comparison with the industrial demonstrator was also performed. A very good agreement between both sensors regarding the results obtained could be shown.
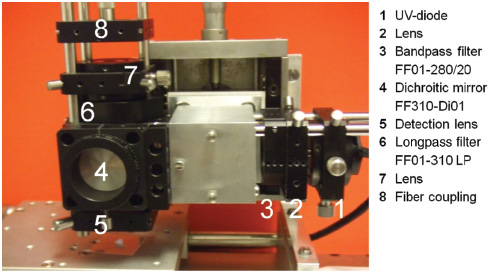
Set-up for sensor testing.
Two test methods were performed on pure substances on V2A-steel plates. The first test used only the pure substances and the second test used the substances dissolved in distilled water and then applied onto the steel plate. Even though the detector was optimized for protein detection in the first place, other organic substances were also analyzed as shown in Figure 6.
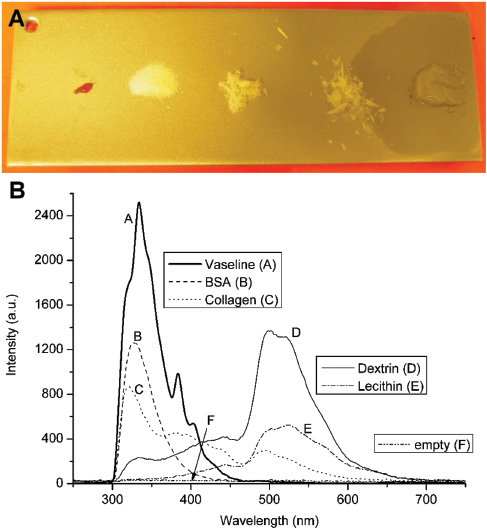
(A) Substrate of sanded V2A-steel with pure (undissolved) contaminations (left to right: lecithin, dextrin, collagen, BSA, Vaseline® – picture taken after 3 days; no grease spot was present while measuring). (B) Spectra of pure substances in high concentration with integration times of 5 s except for BSA and Vaseline® which was 500 ms each.
The Figure 6A shows the substrate plate made up of sanded V2A-steel with pure, i.e., undissolved contaminations. The idea was to have a signal from dry 100% contamination in the measurement spot. Dextrin, collagen and BSA are accordingly dry and do not adhere to the substrate. Dextrin was measured as a fine powder, BSA as a coarse powder and collagen as a dry, flaky substance. Vaseline® and lecithin have a gel-like texture. It is of note that Vaseline® did not have the grease spot on the substrate at the time of measurement; the picture was taken three days after the measurements had been recorded.
The spectra in Figure 6B show the shape of the emission spectrum with arbitrary intensity scaling. Measurements were made using 5-s integration time with a CCD spectrometer (EPP2000; StellarNet, Inc., Tampa, FL, USA). For the samples of BSA and Vaseline® this integration time leads to detector overflow and was set to 500 ms. It can be seen that dextrin and lecithin show significant fluorescence above 350 nm with an intensity maximum between 500 and 600 nm. For the signal correlation with proteins, which is best in the range of 300–400 nm, especially the contribution of lecithin is very low.
For the solutions, a specific amount of distilled water was used to dissolve the substance to give the same concentration for all contaminations. One microlitre of the solution was then transferred to the sanded V2A substrate, which had been verified as clean beforehand. This was left to dry and then measured. Figure 7 shows the samples and spectra. Only BSA, collagen, dextrin and lecithin were measured, each with a concentration of 70 μg/cm2 and integration time of 5 s. The spectra show good qualitative agreement with the spectra from pure contaminations.
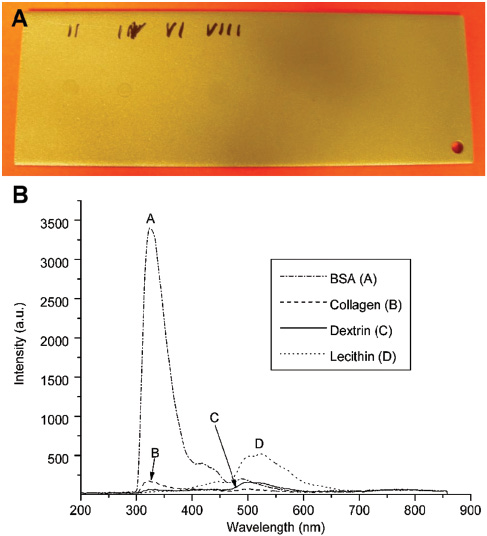
(A) Substrate from sanded V2A-steel with contaminations dissolved in water 10 g/l → 1 μl → 10 μg/13 mm2 → concentration 70 μg/cm2 (left to right: BSA, collagen, dextrin, lecithin). (B) Spectra of the contaminations each with integration times of 5 s.
The next step was to determine the minimum concentration detectable. This was also done with the set-up depicted in Figure 5 and used the sum of the intensity in arbitrary units between 310 and 380 nm with the same EPP2000 spectrometer and 1-s integration time. Figure 8 shows the results of BSA and other contaminations and their BSA equivalent. The BSA equivalent is calculated referring the signal amplitude to a corresponding BSA surface concentration that delivers the same signal amplitude.
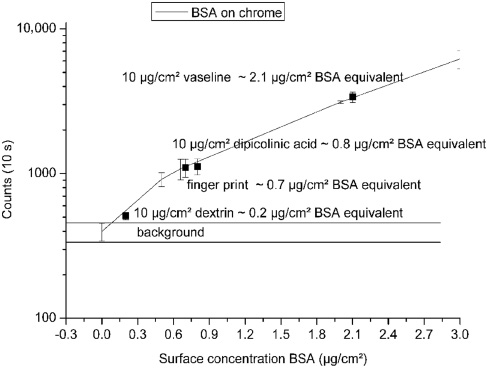
Integrated intensity in the wavelength range 310–380 nm of BSA on chrome-plated substrate. In comparison, different contaminations which also were measured on chrome and converted to BSA-equivalent values with 1-s integration time are shown (detection limit: 0.2 μg/cm2).
4 Discussion
It could be shown that a relatively simple approach to cleaning validation, respective contamination concentration measurement on non-fluorescent metal and glass surfaces, gives a very sensitive measurement of dried protein or dextrin films.
With these findings, the next step was to define a limit of permissible concentrations of impurities and to set the signal calculation in the handheld and battery powered sensor. As the background light has an influence on the amount of light detected, a reference signal of a clean surface part was measured beforehand, and subtracted from the sample signal. When this had been done the handheld sensor can give a quick and simple answer to the question as to whether the cleaning was successful, i.e., is there contamination under the measurement spot, or not.
The demonstrator, as shown in Figure 9, gives an impression of the sensor developed at the LMTB in a project in cooperation with the Technical University Berlin and industrial partners. The handheld sensor was tested under ambient light conditions in a food production environment and in the laboratory with mock-contaminated medical instruments and showed good agreement with already established validation techniques. It has to be pointed out, that the results with the optical sensor were obtained within seconds while the established swab tests require some time for the chemical reaction.
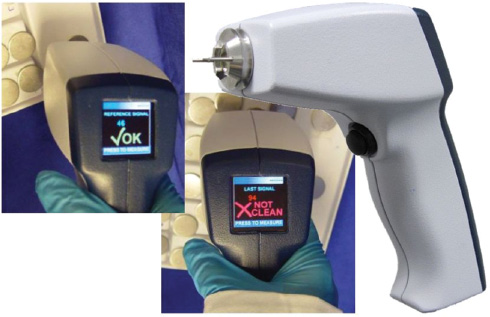
Demonstrator of the handheld fluorescence-optical non-contact sensor for rapid cleaning validation of surfaces.
The handheld device measures fluorescence at a single spot. In order to validate a certain area several measurements have to be taken. In the general testing and validation procedures a critical point regime is established, so before a validation, testing points have to be identified. This point-wise scanning also helps to identify hard-to-clean parts, to verify and improve the overall cleaning process.
5 Conclusion
The presented handheld fluorescence detector is capable of detecting very low contaminations of organic material on non-fluorescing surfaces. This optical method is contactless, very quick and no marker substances are needed.
Key features of the handheld sensor are the measurement with fluorescence method in <1 s for each spot of Ø 1 mm and with a sensitivity comparable to reference methods, which allows the detection of protein (BSA) down to 0.2 μg/cm2 with 5 s total measurement duration (reference methods, 1 … 6 μg/cm2) with ambient lighting switched on.
To date no commercial development of the sensor has started. As part of the commercialization concept a license or cooperation for further common development is possible.
Funding: Federal Ministry of Education and Research (Grant/Award Number: “FKZ 01 RI 0645 A-F”).
Conflict of interest statement: There are no financial and commercial conflicts of interests to report.
References
[1] Kramer A, Assadian O, editors. Wallhäußers Praxis der Sterilisation, Desinfektion, Antiseptik und Konservierung. Stuttgart, New York: Georg Thieme Verlag; 2008.Suche in Google Scholar
[2] Association for the Advancement of Medical Instrumentation (AAMI). AAMI TIR30:2011/Ed. 2. A compendium of processes, materials, test methods, and acceptance criteria for cleaning reusable medical devices. Technical information report. https://fmc4me.qa-intranet.fmcna.com/idc/idcplg?IdcService=GET_FILE&Rendition=Primary&RevisionSelectionMethod=Latest&dDocName=PDF_100032426 [Accessed on April 15, 2015].Suche in Google Scholar
[3] De Bruijn ACP, Orzechowski TJH, Wassenaar C. Validation of the ninhydrin swab test to monitor cleaning of medical instruments. Zentr Steril 2001;9(4):235–47.Suche in Google Scholar
[4] Friedrich T, Roth K, Gauer J, Heeg P. Sensitivity of detection methods for assessment of residual contamination on reprocessed surgical instruments. Zentr Steril 2007;15(1):29–38.Suche in Google Scholar
[5] Lipscomb IP, Sihota AK, Keevil CW. Comparative study of surgical instruments from sterile-service departments for presence of residual gram-negative endotoxin and proteinaceous deposits. J Clin Microbiol 2006;44(10):3728–33.10.1128/JCM.01280-06Suche in Google Scholar
[6] Michels W. Detektionsmethoden der prEN ISO 15883 für die Reinigungsprüfung in der Praxis – Teil 1. aseptica 2005;11(2):19–21. http://www.hygieneinspektoren-rlp.de/aseptica/aseptica_Juni_Juli_05.pdf [Accessed on December 12, 2014].Suche in Google Scholar
[7] O-I Analytical. Utilization of a total organic carbon analysis of pharmaceutical clean in place cleaning validation samples. Application Note 1907. http://www.oico.com/default.aspx?id=searchresults&Phrase=Utilization&product=%&productline=%&doccat=21 [Accessed on December 12, 2014].Suche in Google Scholar
[8] Bryans TD, Braithwaite C, Broad J, Cooper JF, Darnell KR, Hitchins VM, Karren AJ, Lee PS. Bacterial endotoxin testing: a report on the methods, background, data, and regulatory history of extraction recovery efficiency. Biomed Instrum Technol 2004;38(1):73–8.10.2345/0899-8205(2004)38[73:BETARO]2.0.CO;2Suche in Google Scholar
[9] Edouard S, Bassin G, Corvaisier S. Kontrolle der Reinigungsleistung in Reinigungs-/Desinfektionsautomaten. Empfindlichkeit dreier verschiedener Reinigungstests im Hinblick auf die Reinigungsparameter. Zentr Steril 2006;14(3):197–215.Suche in Google Scholar
[10] Heider D, Michels W. Biolumineszenz-Methode zum Nachweis von Kontamination. aseptica 2007;13(2):19–21.Suche in Google Scholar
[11] Willemse-Erix DF, Scholtes-Timmerman MJ, Jachtenberg JW, van Leeuwen WB, Horst-Kreft D, Bakker Schut TC, Deurenberg RH, Puppels GJ, van Belkum A, Vos MC, Maquelin K. Optical fingerprinting in bacterial epidemiology: Raman spectroscopy as a real-time typing method. J Clin Microbiol 2009;47(3):652–9.10.1128/JCM.01900-08Suche in Google Scholar
[12] Murphy T, Lucht S, Schmidt H, Kronfeldt H-D. Surface-enhanced Raman scattering (SERS) system for continuous measurements of chemicals in sea-water. J Raman Spectrosc 2000;31(10):943–8.10.1002/1097-4555(200010)31:10<943::AID-JRS626>3.0.CO;2-XSuche in Google Scholar
[13] Freudiger CW, Min W, Saar BG, Lu S, Holtom GR, He C, Tsai JC, Kang JX, Xie XS. Label-free biomedical imaging with high sensitivity by stimulated Raman scattering microscopy. Science 2008;322(5909):1857–61.10.1126/science.1165758Suche in Google Scholar
[14] Schmitt FJ, Südmeyer H, Börner J, Löber J, Olliges K, Reineke K, Kahlen I, Hätti P, Eichler HJ, Cappius HJ. Handheld device for fast and non-contact optical measurement of protein films on surfaces. Opt Laser Eng 2011;49(11):1294–300.10.1016/j.optlaseng.2011.06.006Suche in Google Scholar
©2015 Walter de Gruyter GmbH, Berlin/Boston
Artikel in diesem Heft
- Frontmatter
- Editorial
- Sensors in diagnostics and monitoring
- Magazine section
- Snapshots
- Reviews
- Recent advances in SPR and SERS for sensitive translational medical diagnostics
- Raman spectroscopy for the discrimination of cancerous and normal skin
- Original contribution
- Fluorescence-optical handheld non-contact sensor for rapid cleaning validation of surfaces
- Preliminary research reports
- Evaluation of a novel skin tone meter and the correlation between Fitzpatrick skin type and skin color
- In-line optical monitoring of oxygen saturation and hematocrit for cardiopulmonary bypass: Adjustment-free and bloodless calibration
- Short communications
- Non-invasive detection of free hemoglobin in red blood cell concentrates for quality assurance
- Development of an in-vivo sensor for monitoring of water content in skin
- Congress announcements
- LASER World of PHOTONICS – DGLM Application Panel: Laser-advanced new methods for diagnostics and therapeutics
- Congresses 2015/2016