Visual analysis of urban design and planning based on virtual reality technology
-
Ying Xia


Abstract
Campus green space management and optimization are essential when an educational campus is sustainable and conducive. Geographic Information System (GIS) technology has advanced recently, making it a powerful tool for preserving and enhancing green space networks. To guarantee that the demands of urban development inhabitants are met while considering the distribution of natural resources, the investigation has developed a GIS-based evaluation technique for the establishment of green spaces. After over 20 years of campus management in developing China, the rate of development has drastically decreased, and a renewed emphasis on creating sustainable, efficient green campuses has taken hold. Enhancing usability, availability, and appeal is a factor in evaluating whether or not green spaces can achieve their potential benefits. This study ensures the longevity and sustainability of green spaces while minimizing downtime. Furthermore, the impression of a smart campus based on Public Green Space (PGS) and its environment is not much impacted by a student’s gender or growth environment. Which is a planned space used for environmental, recreational, and aesthetic functions. The research underscores the significance of the PGS environment to the general attractiveness and accessibility of green spaces and its contribution to how smart the campus is perceived. The research recommends streamlining the layout and facilities of these spaces to accommodate the requirements of students and maximize their functionality. The demand and satisfaction of the campus PGS overall were also high, with Space-6 having the highest overall satisfaction score of 149 and Space-4 having the highest demand for walking or chatting of 135. Usage periods also had high usage participation, with after-class usage having the highest score of 160 in Space-1. The convenience of the PGS was also highly rated, with Space-1 as the most convenient for students at 88 points from the main entrance. Instead, the plant arrangement, seasonal color richness, and the amenities needed in various locations have a greater impact. Our recommendations are based on GIS and address the needs of students while enhancing the appeal and use of green campuses.
1 Introduction
A planned or already established network of green spaces within a college or university campus administration is called the Campus Green Space System. The green spaces are meant to offer natural sites for teachers, employees, and students to relax, socialize, and engage in outdoor activities. Campus architecture is meant to enhance the overall campus life, promote sustainability, and enable the well-being of the smart campus community. Different forms of these green spaces, including parks, gardens, courtyards, and open plazas, are feasible [1]. Trees, grassy areas, seating, walking paths, and recreational facilities may be included in the study. The smart campus becomes more appealing with the inclusion of green spaces and other natural elements. Because of the opportunities for rest, exercise, and stress relief that green spaces offer, their accessibility contributes to improving physical and mental well-being. They are sites for outdoor activities such as running, walking, picnics, and sports. Through the improvement of air quality, reducing the effects of heat islands, conserving water, and offering a habitat for species, green spaces benefit the environment [2]. The areas facilitate community building and social interaction among staff, students, and teachers. They can function as meeting places for activities, outdoor learning, or casual hangouts. The campus administration can serve as outdoor classrooms, providing opportunities for environmental learning, inquiry, and experiential education. A planned green space system can enhance the institution’s status and image, attracting potential students, educators, and visitors [3]. Campus planning and development must consider elements such as space availability, landscaping, accessibility, sustainability criteria, and maintenance. In order to establish a network of green spaces that is both functional and in harmony, institutions can collaborate with landscape architects, environmental experts, and community stakeholders. A campus green space system clearly benefits the community’s overall health in a physical, mental, and environmental sense, and it creates an attractive, sustainable campus community [4]. The GIS tools for urban planning are shown in Figure 1.
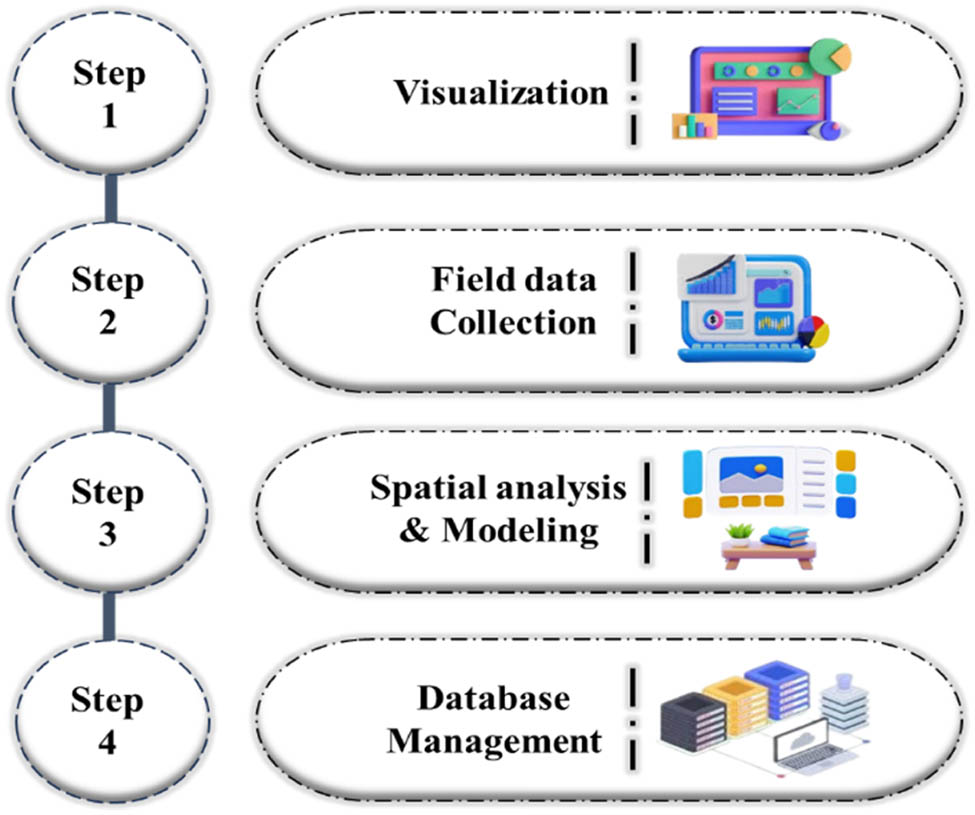
GIS Tools for urban planning.
A system that allows the collection, administration, analysis, and display of geographic information is referred to as a GIS. To generate meaningful maps and enable efficient spatial analysis, it combines attribute data information that is not spatially related to specific locations on the Earth’s surface with spatial data. GIS provides tools for storing and organizing geographic data in an orderly manner. It becomes easier to retrieve, modify, and move information among numerous departments or organizations by facilitating the integration and management of diverse types of data. GIS provides advanced geographical analysis by combining various geographic data layers. It allows users to execute queries, integrate data from numerous sources, calculate distances and areas, perform proximity analysis, generate buffers, and execute statistical research based on geographical relationships [5]. Map creation and data visualization are two of the primary uses of GIS. GIS software provides users with the means of map creation and editing, feature labeling, and displaying data in a variety of formats, including choropleth maps, heat maps, three-dimensional (3D) maps, and thematic maps. Maps allow users to visualize, recognize patterns, and provide effective communication [6]. GIS technology streamlines the process of developing strategies and making data-driven decisions based on the interpretation of geospatial data. It enhances policy decisions by analyzing spatial relationships and patterns, improving routing and siting, identifying possible areas for development, and predicting the potential impacts of proposed projects [7]. GIS is also fundamental to emergency management through the provision of real-time information and spatial analysis in times of emergencies. It can assist with risk evaluation, planning evacuation pathways, spotting at-risk places, distributing assets, and organizing response actions. Environmental studies and investigations make use of GIS frequently. It is useful in managing natural resources, observing land cover alterations, ecosystem modeling, biodiversity trend evaluation, and evaluating the effect of human behavior on the environment. Figure 2 illustrates some examples of benefits for campus planning, transportation planning, public health, natural resources management, agriculture, marketing, and a multitude of other areas that all stand to benefit in some way from the application of GIS technology. It is a valuable tool for understanding and organizing complex study environments because it is flexible to perform, combine, and analyze geographical information [8].
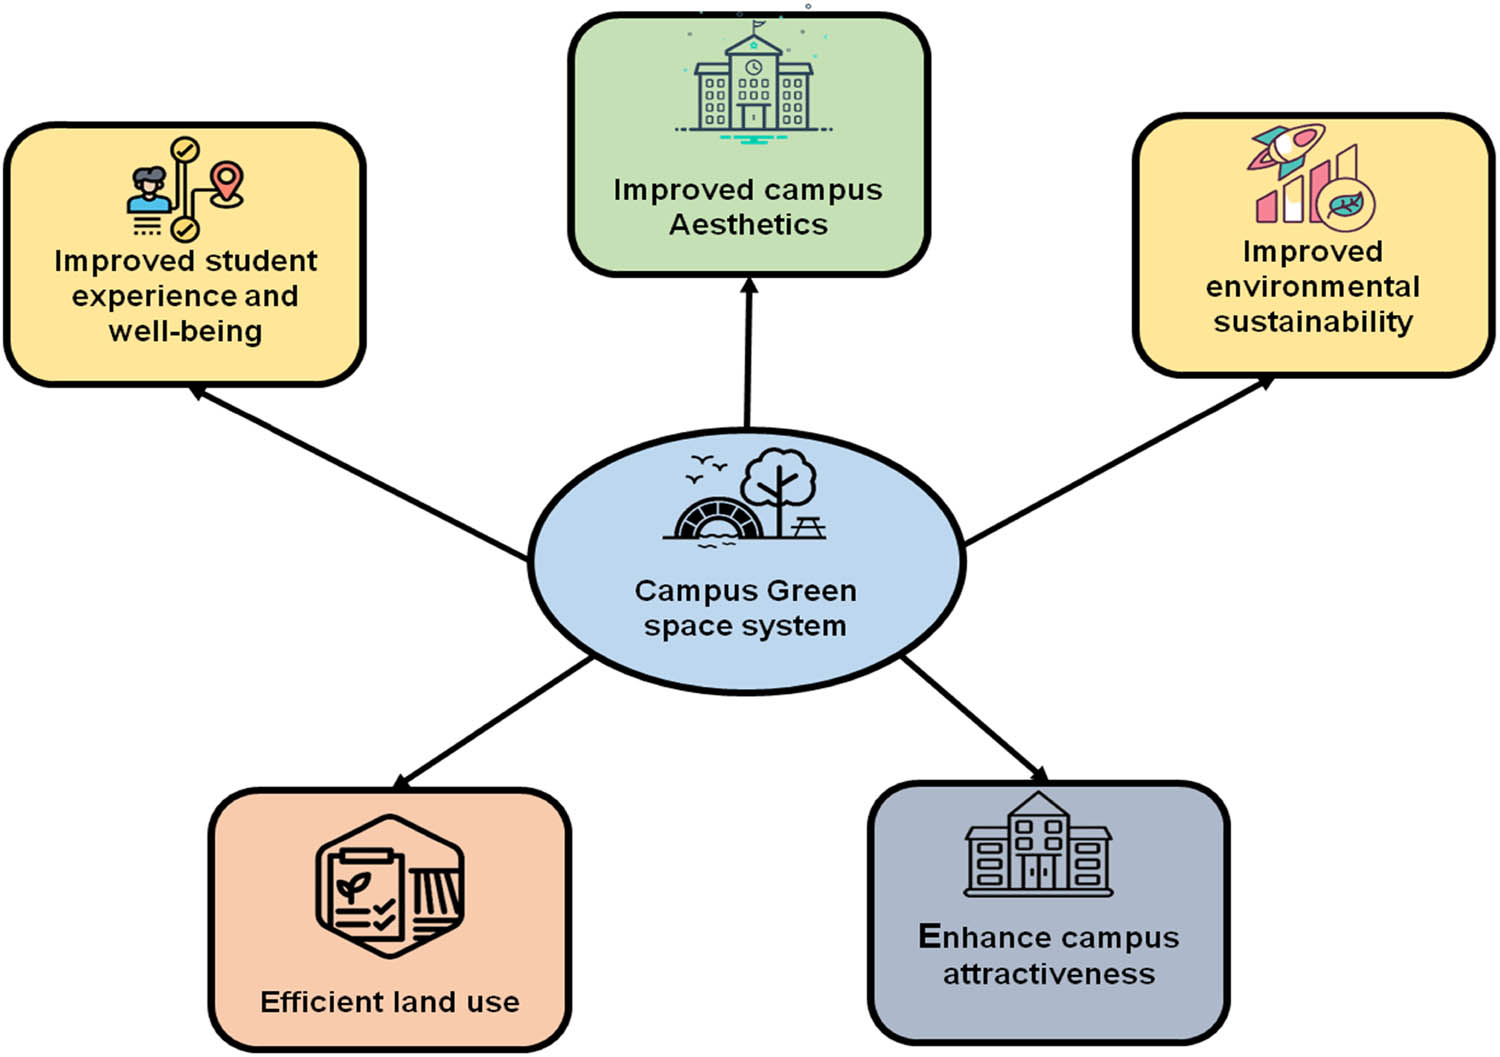
Benefits of campus Green space system.
The application of GIS technology in creating and enhancing a campus green space system can be helpful in providing insights and decision-making. How GIS can be applied in a scenario is as follows: GIS enables the collection of different geographic data relevant to the school green space system [9]. Parks existing, buildings on campus, facilities, geography, soil cover types, vegetation, and other data of relevance might be incorporated. Data can be acquired from GPS surveys, aerial photography, and the integration of datasets. The GIS capabilities allow for the integration of numerous datasets, including campus boundaries, land use, proximity to utility connections, and environmental factors. By combining and analyzing the datasets, it would be possible to identify possible locations for new green spaces, evaluate potential environmental impacts, and indicate areas that may need to have new green infrastructure built. In fact, “GIS has the potential to improve the identification of appropriate areas to extend green space on campus” [10]. A GIS can help choose the best areas to locate new parks, gardens, and recreational centers by taking into consideration criteria such as distance from a building, accessibility for students and faculty, sunlight exposure, soil type, and drainage. Using GIS technologies, land cover and the health of the campus could be evaluated. For instance, GIS can indicate areas that needed more land cover or land with potential pest infestations by utilizing a combination of satellite data, field observations, and land indices. Based on this information, more intensive planting could be targeted to areas of need, and to keep existing green spaces on campus healthy and diverse. GIS also has the ability to examine the environmental impacts of green space systems [11]. By incorporating data about hydrology, soil erosion, and biodiversity, one can assess the potential effects of new projects or alterations to existing green spaces. Research evidence can inform sustainable design strategies and minimize unfavorable effects. GIS can support the creation of interactive visualizations for the Canvas Green Space System and attractive maps. Interactive visualizations can be shared with users to aid their understanding of proposed plans and engagement in decision-making [12]. The campus green space system can benefit from ongoing monitoring and maintenance with GIS technology. By integrating data on irrigation, health, and maintenance schedules, GIS can assist in tracking the condition of green spaces, finding maintenance needs, and identifying the best use of resources for effective management. By applying GIS technology to design and optimize a campus green space system, universities, and colleges can make informed decisions about the management of campus green spaces and maximize the benefits for campus users while ensuring a sustainable and enjoyable environment [13].
Key contributions:
GIS-based monitoring systems provide real-time information on the condition of green spaces, enabling proactive maintenance. The study ensures the longevity and sustainability of green spaces while minimizing downtime.
By leveraging GIS technology in the planning and optimization of campus green space systems, educational institutions can achieve more efficient resource utilization, improve campus aesthetics and functionality, and contribute to the development of sustainable and smart campuses.
GIS platforms provide spatial analysis and visualization tools that aid in the planning and design of campus architecture. By analyzing factors such as satisfaction with the PGS, demands, and usage periods, GIS technology helps in identifying suitable locations for green spaces, optimizing their layout, and ensuring they integrate well with existing infrastructure.
The paper is organized into five sections. Section 1 presents the introduction and Section 2 represents the literature review of the study. Section 3 presents the methods, and Section 4 highlights results and discussion. Section 5 presents the conclusion.
2 Related works
Research in many spaces must include a literature survey, commonly referred to as a literature review or systematic review. It entails a thorough review and analysis of the body of research, which is shown in Table 1.
Related works
| References | Objectives | Summary of findings |
|---|---|---|
| [14] | The study determined that fieldwork-gathered geographical and non-spatial data with additional characteristics produced a comprehensive dataset with a thematic map that was very accurate (0.93 kappa coefficient). The distribution of recreational urban green space is uneven, as seen by the documented status of various typologies and urban green space distribution | The research evaluated that while the western half of the city has a greater availability of natural green spaces, the eastern section of the city severely lacks urban green space facilities. For studying their geographical distribution, noting their qualitative state, and ranking the urban green space provisions in order of importance, the mapping approach is new and effective |
| [15] | The research measured the urban green space accessibility of neighborhoods in central Wuhan by classifying the urban green spaces into three groups using a spatial design network analysis. The study examines the urban green space equity of the spatial distribution at the community level based on the findings and the Gini coefficient, after which the study suggests future greening initiatives for both the city and the community | The study showed that the railroad station and the historic part of Wuhan are the hubs of the transportation network. Urban green space is equally spread across the core regions, but there are few of them and they are scattered quite unevenly outside of the core spaces. The majority of the communities have medium urban green space accessibility, which is where the majority of the residential population is concentrated |
| [16] | An extract from the research different land use data types must be used for determining accessibility and availability. The study defined four geographical dimensions of urban green space and critically assesses how various data sources influence the dimensions and comprehension of how they vary within a metropolitan space (Brussels) | The overview objective of the goal compared the cadastre-based official map, the OpenStreetMap volunteer geographic data, and the urban green space indicators assessed from an imaging source. In a study, provision, and access to urban green space are compared overall, as well as how they are distributed spatially along a centrality gradient and at the neighborhood level |
| [17] | The study examines the requisite amount of data and a revolutionary geospatial platform for managing green space spaces using GIS and artificial intelligence to solve the problem | Research showed that the Green space regions using the classification and analysis, respectively |
| [18] | The study investigated by employing cutting-edge remote sensing and geospatial techniques, the conceptual framework design towards urban green space, and temperature variability across Kolkata and Howrah metropolis. The sparsely vegetated region is situated in a densely populated space that is subject to heat fluctuations | The overview objective of the goal is to determine the center, northern, northwesterly, and some southern regions, where the heat stress index indicated high spaces. Significant changes were seen in the association between land surface temperature and the normalized differential vegetation index, with R2 values ranging from 0.48 (2010) to 0.23 (2020), respectively |
| [19] | Research aimed to look at the relationship to provide some recommendations for its development | The study evaluated the significant correlations between street connectivity and vital capacity |
| [20] | The study identified ways to enhance the amount of green space in different urban shapes, such as primary components that may absorb noise | Research extracted the factors that must be taken into account while creating an equation to calculate the amount of sound absorption by leaves |
| [21] | The study examined the link between each component to create an adequate theoretical framework and to accurately and completely portray it | Research obtained The study spaces’ waterfront green space had a three-dimensional spatial value index |
| [22] | The study contributed to presenting three case studies that used 3D geo-visualizations to address the gap. First, a green factor framework was used to examine the function of 3D point cloud data gathering for objective–deductive urban green evaluations | Research demonstrated Urban and green space planning may gain from subjective-inductive evaluations using 3D geo-visualizations in addition to objective-deductive methodologies. One major finding is that 3D geo-visualization offers opportunities for various knowledge techniques that positively complement one another |
| [23] | Research aimed to simulate the tropical spitting cobra’s native range in the campus’s green spaces. Convex polygon and kernel density applications were used to create the model | The study evaluated the Convex Polygon analysis, the cobra’s home ranges were found to be roughly 114.53 Ha or 35.79% of the campus’s green spaces at the University of Indonesia |
| [24] | The purpose of the research is to explore how campus green infrastructures could improve the learning environment and positively influence student success in postsecondary educational settings. Specifically, the investigation examined understanding students’ academic performance and well-being through the green infrastructures | They confirmed that there are positive contributions to student wellbeing and learning outcomes through the development of green infrastructures on campus. Green spaces promote a positive learning space, and increase students’ academic engagement, motivation, and satisfaction. The research demonstrates that the development of green infrastructures is a key feature to improving the learning environment and students’ academic outcomes |
| [25] | The incorporating images of landscapes and enhancing scene simulation through dual guidance data fusion investigates the application of data fusion and VR technologies in urban landscape design, showcasing its potential for effective and well-planned designs | The VR-based landscape planning system outperforms conventional techniques in terms of accuracy and efficiency, according to the research. When scene and rendering threads are parallelized, it decreases rendering time and preserves the frame rate above 30, even when the virtual landscape is 400. To develop design ability, this approach improves modeling, design, creativity, and expression qualities |
| [26] | The research investigates how VR technology could be integrated with contemporary image presentation, with a particular emphasis on display design. It looks at creative processes and displays history before presenting a forward an approach based on equipment method, assembling order, and visual interactivity | The VR technologies executed are superior to conventional art image visualization materials, with an average score of 9% higher for other visual effects and a visualization score of 95.48% for lighting modification operations. This implies that VR technology is viable and appropriate for visualizing art images and can find use in other computer-based design and visualization fields |
2.1 PRISMA
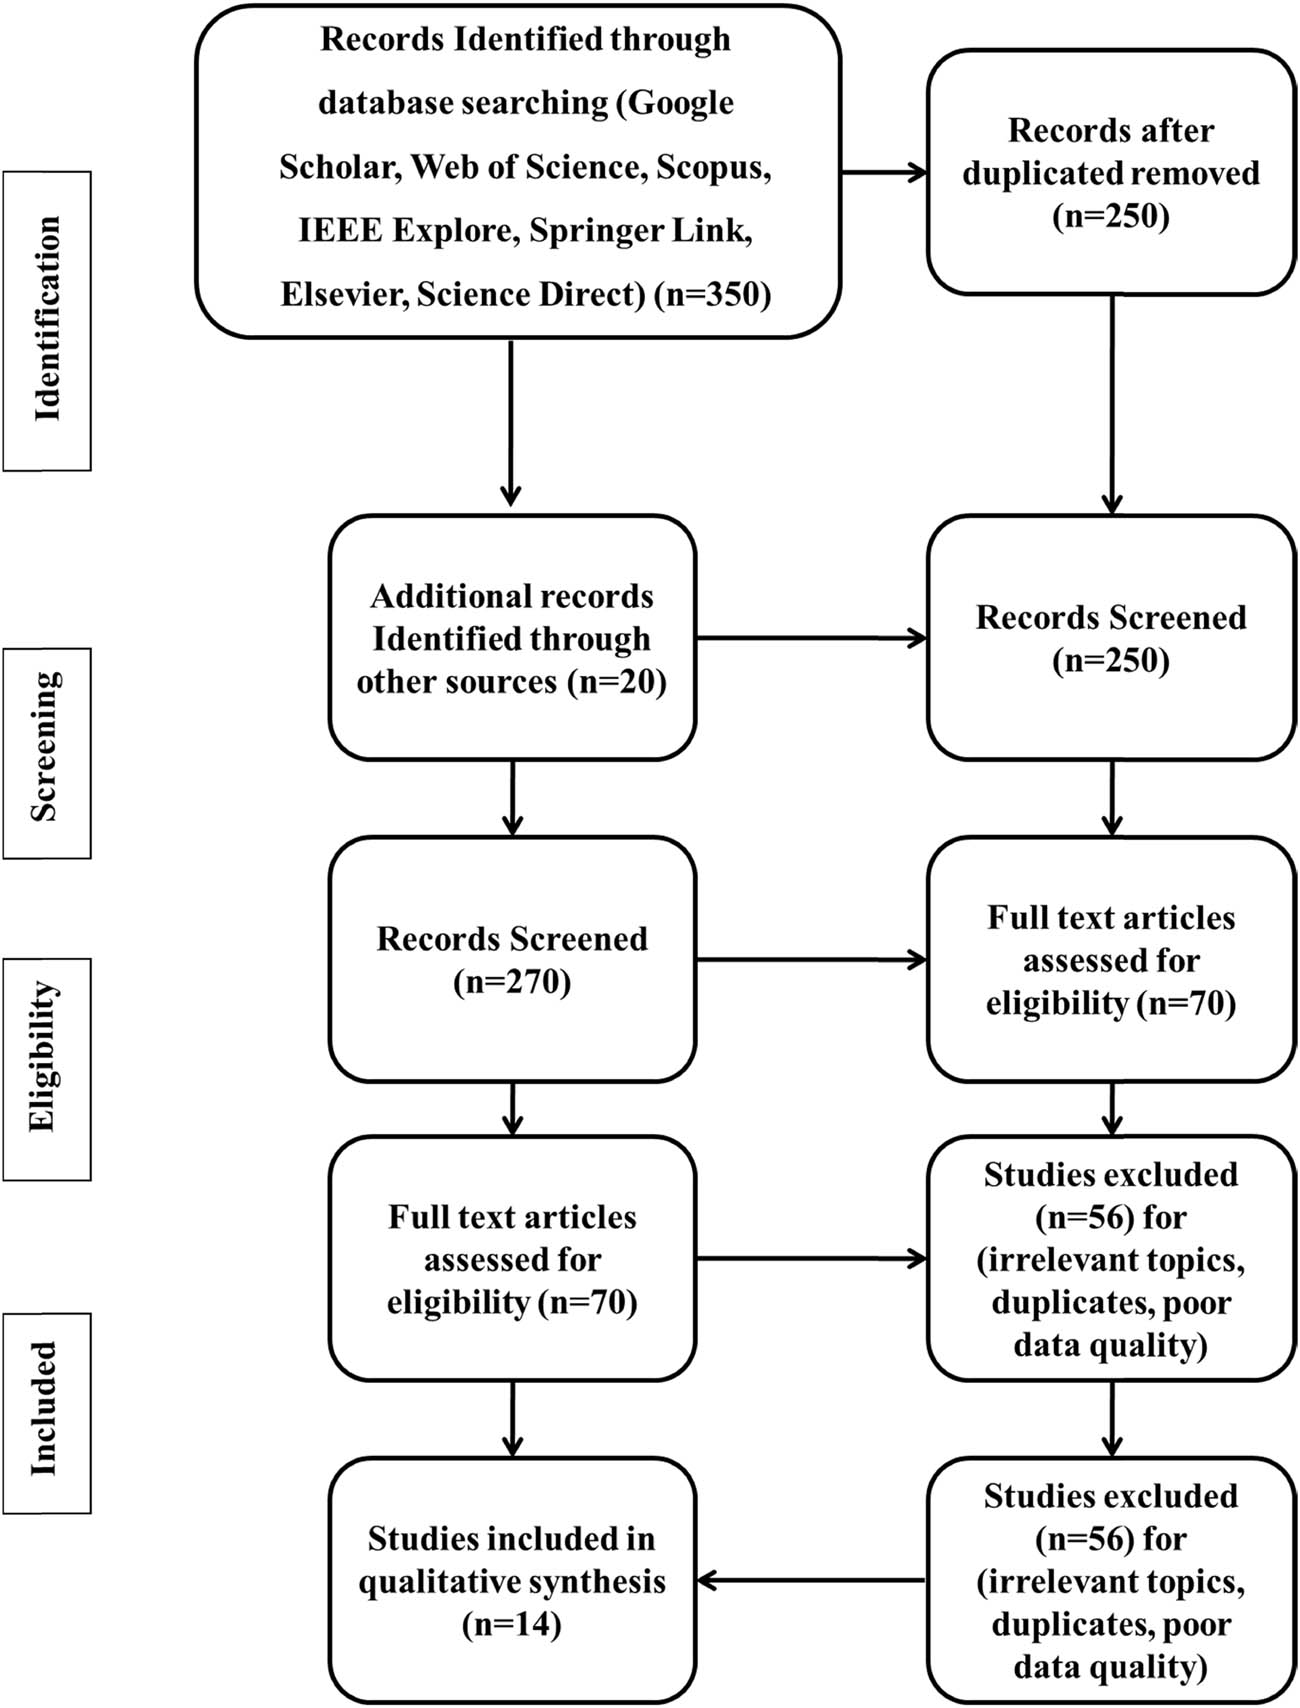
The methodical selection of research investigations for examining urban planning and design with virtual reality technology is described in the PRISMA flowchart. The research’s primary objective is to optimize campus green spaces with GIS to improve accessibility, use, and sustainability. Seventy full-text articles were evaluated after 270 of the 350 original records were examined. After removing 56 irrelevant or duplicate studies, 14 were included in the qualitative synthesis. The results emphasize the value of PGS in smart campuses by focusing on student demands and layout optimization. To grasp the most current trends in urban green space research, the literature search was restricted to the time period of 2015–2023. Research studies published before 2015 were excluded to maintain relevance to contemporary advancements in GIS (geographic information systems) technologies, urban planning, and green infrastructure. Recommendations based on GIS guarantee green spaces that are both functional and sustainable. Figure 3 shows the PRISMA evaluation for related works.
PRISMA evaluation for related works.
3 Materials and methods
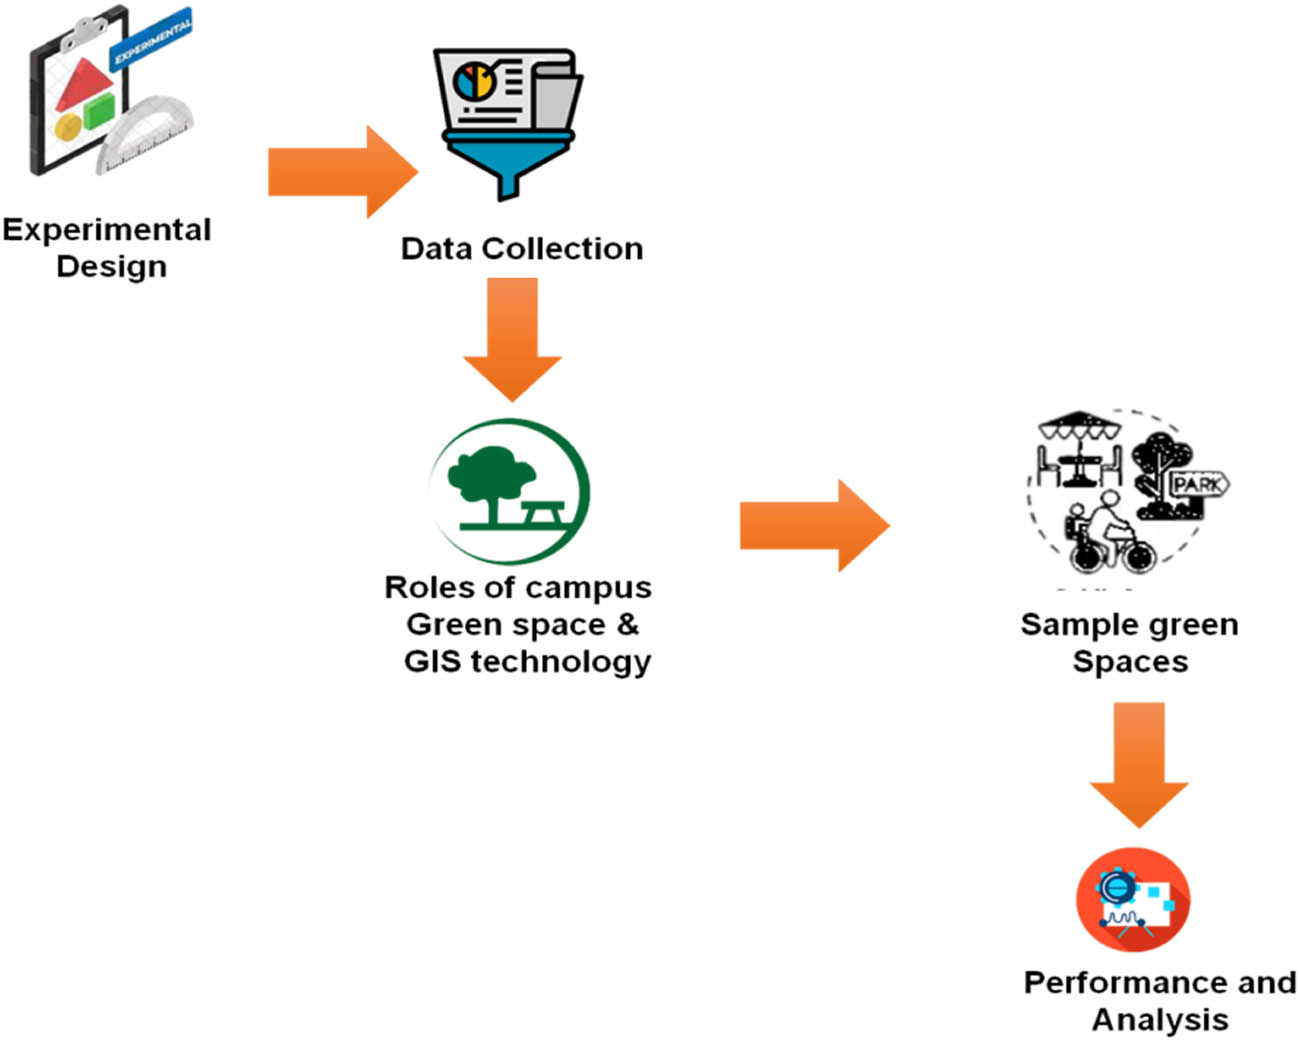
This study examined the PGS plant development, the existing amenities, and their upkeep. It also observed the smart campus’s general condition. Students were polled using questionnaires to see how they felt about the school administration. The accessibility of the Yijin campus was finally evaluated objectively using the Space syntactic theory and compared to how students perceived the campus environment, as shown in Figure 4.
Experimental design.
3.1 Data collection
Following a peak in campus construction that lasted more than 20 years, China’s growth rate has significantly slowed down, and there is now a focus on creating a sustainable and effective green campus. To determine whether or not green spaces can realize their potential advantages, it is important to improve their use, accessibility, and attractiveness. By means of a survey administered to 590 students at the Yijin Campus in Hangzhou, China, and a connectivity analysis grounded in the Space Syntax Theory, the investigators have discovered a negative usage condition for green spaces: most students visit the green space infrequently or sporadically, and their visitation time focuses in the afternoon and after class but very infrequently in early morning. China has experienced a peak in campus construction for almost 20 years; there were 1022 colleges and universities in 1998, but there were 2631 in 2017 super-over 2.5 times as many as in 1998. In addition, there were 30.18 million students enrolled in schools, an astounding over 8.3 times the number of students in 1998 (Ministry of Education 2018) [27]. It is important to note that the rate of development has greatly slowed recently, and the time of extensive college building has started to shift toward an emphasis on a sustainable and efficient campus. Additionally, public greening in Hangzhou expanded far more quickly between 2005 and 2017 than it did throughout all of China. The increase in the ratio for urban public improvement per capita in Hangzhou is also significantly higher than China’s per capita area growth rate, according to data from the National Bureau of Statistics of China in 2017 and the Bureau of Hangzhou Statistics (BHS) in 2018.
3.2 Research questionnaire
The researchers created a questionnaire to investigate the conditions and influences that encourage different uses of PGS, which, upon evaluation, revealed no privacy concerns. Additionally, Students were individually contacted, briefed, and had to acknowledge that participation in the research was optional. A total of 757 items of the questionnaire, distributed throughout the fall months of September to November 2018, were invalid, including 167 that were unrecovered or retrieved but incomplete. Thus, as detailed in the Appendix, it was used to gather basic data on 590 students. The first section covered these data, which included the students’ gender, growth environment, faculties, and dorms, as well as whether they enjoy being in nature and how frequently they move around campus. The second section spoke about how the needs of the pupils for each area were met. The third step was looking at the students’ use time, or when they leave their dorms and go about campus.
3.3 Role of campus green space system based on GIS technology
GIS is a robust technology employed to gather, analyze, and visualize geospatial data for urban planning and design. GIS facilitates mapping and analyzing the interactions between various geographical elements, enabling urban planners to make effective decisions. Visualization techniques based on GIS enhance some understanding of complex urban systems, such as transportation systems and land use, and can simulate possible urban change and the impact on nature and society. GIS ultimately aids effective urban systems planning through clear images of spatial interactions and trends that are sourced from data. A GIS technology-oriented campus green space management system uses spatial data and analysis to manage and enhance campus green spaces. It involves the use of the integration of GIS software, geospatial data, and related technologies to help plan, design, monitor, and maintain green spaces on the campus. The system uses geographic information, including maps, satellite imagery, and other relevant layers of data. The total list of green spaces, i.e., parks, gardens, lawns, sports grounds, and trees, can be quantified with these details. Based on GIS technology, the campus green spaces can be mapped and in significant detail. This displays a graphical mapping of the entire campus along with details of location, area, and characteristics of every green space. The green space data can be analyzed in numerous ways because of GIS technologies. GIS technology enables the planning and designing of green space through the facilitation of stakeholders’ visualization of prospective changes or supplements. Depending on distance from structures, topography, and existing ecology, it facilitates the identification of where future facilities are desirable, e.g., restaurants, pedestrian paths, or sports complexes. The system may involve continuously or periodically monitoring natural factors in green spaces, which would include monitoring soil moisture, temperature, and other meaningful factors. The use of GIS could be used to map and evaluate this data, and identify areas that could be improved or developed. GIS technology assists with the management and upkeep of campus green spaces by tracking the condition and maintenance history of physical features such as trees, irrigation systems, and recreational equipment. It also allows for the scheduling of maintenance, the tracking of work orders, and the optimization of resource allocation. The system could also provide a basis for civic engagement and involvement in the maintenance of green spaces. The creation of a campus green space system utilizing GIS technology can allow for colleges and other institutions of education to manage, improve, and encourage the use of green spaces on campus. It encourages eco-sustainable and people-friendly habitats, enhances maintenance and management practices, and assists in evidence-based decision making.
3.4 Analyzing the value of ecological land in campus green space
Different forms of land use have varying values for ecological services. Living organisms could find a suitable home in a place that maintains a high ecosystem service value per unit area of biodiversity. The environmental service value preserved by the examined area is determined by equation (1) using the amount of biodiversity service value per unit area of the environment, modified by the mean
where
For urban land, the soil retention function offers significant adjusting services that have both the environmental stability of urban green spaces and the prospects of environmentally conscious development. The equation’s fundamental form is (3)–(5),
At the campus green space, the disparity between the limited number of green spaces and the high population density raises the need for ecological units in the eyes of the locals. Using many sources, the search for human agglomeration zones in southeast China
Following training, validation, and testing, the evaluation model establishes the relationship between each neural network layer and the neurons within the permitted error range. The comprehensive weight is calculated by considering the weights from the input layer to the hidden layer and the elements from the hidden layer to the resultant layer
Agglomeration Landscape Images Description Balance, which is based on GIS technology, is a fairly common description technique. The measured light matching complies with Glassman’s law. The following equations (15)–(18) display the particular and tristimulus values: the
3.5 The examination of the sample green spaces’ spatial syntax
The creation of a sustainable environment to be divided among various groups, individuals, or activities is the goal of landscape design, which is based on this basic idea. Since Axial Line Analysis is effective in addressing accessibility difficulties, which can be shown from several examples, it has been mostly utilized to analyze road networks. Due to this, the Yijin campus’s campus road networks were examined in this research using Axial Line Analysis, the main Space syntax approach.
3.5.1 Depth
In essence, it is represented as the number of steps required to go from one location to another. The depth value is the shortest distance between any two nodes. It is defined by equation (19) as the mean depth measurement and the total depths.
where
3.5.2 Integration
The point’s integration can be assessed by its median breadth in relation to all additional nodes, much like comparative imbalances. This reflects how closely or distantly a point is connected to or separated from the main system or the subordinate system as shown in equation (20).
3.6 Benefits of GIS-based planning and optimization
By providing information on the distribution of current green spaces, their use, and possible growth regions, GIS technology allows data-driven decision-making. This guarantees efficient use of the available space and optimizes the distribution of resources.
GIS tools encourage cooperation amongst the many parties engaged in the planning process, such as campus administrators, urban planners, and landscape architects. Through information exchange and input, they may jointly create sustainable green space systems.
GIS-based design assures the long-term sustainability of campus green spaces by taking environmental elements such as sun path analysis, water runoff modeling, and tree planting techniques into account.
4 Results and discussion
The researchers carefully analyzed the plant distribution and growth circumstances in six green spaces on the Yijin campus. Only a limited number of people reside there, although there is almost no exposed surface on the ground. Even a few of them walked in, but most of them merely passed by quickly.
4.1 Results
4.1.1 Satisfaction with PGS
Campus green space system development and optimization based on GIS technology are largely influenced by how much the general public is satisfied with green spaces. GIS technology can be used by planners to identify areas with inadequate green space or that are hard for the general public to access. Green areas can be placed in the best possible positions available for campus students, residents, and visitors through planners’ evaluations of data, including pedestrian routes, transit systems, and population information. By making it easier for users to access and utilize the green areas, public enjoyment is elevated through this greater accessibility. With GIS technology, planners are able to analyze whether green areas are performing well already and identify locations where they should improve. Planners can enhance the green space design and layout to meet the various needs and desires of the public by evaluating information about amenities, recreation activities, sitting areas, and landscaping. Planners can create public-friendly green spaces that are aesthetically pleasing by incorporating this data into the design and optimization process. Customers are more likely to be satisfied in general due to this focus on aesthetics because they can benefit from a lovely and well-maintained setting. Public satisfaction rises as a result of the use of GIS technology in the design and improvement of campus green spaces. Planners may design green spaces that respond to the different requirements and preferences of the public, eventually boosting their overall pleasure and well-being, by taking into account variables such as accessibility, utility, aesthetics, environmental quality, and community participation (there were 590 responses).
In Figure 5 and Table 2, the difference between the six PGS for factors like plant collocation, overall satisfaction, test settings, safety, and the overall seasonal color change is not very great. Therefore, the researchers show a high score at any one of the spaces, which is considered as overall satisfaction, with space 6 being relatively high at 149 points and space 1 being the lowest at 126 points. The next four areas’ scores 131, 133, 135, and 139 points, respectively, had a comparable level of pleasure.
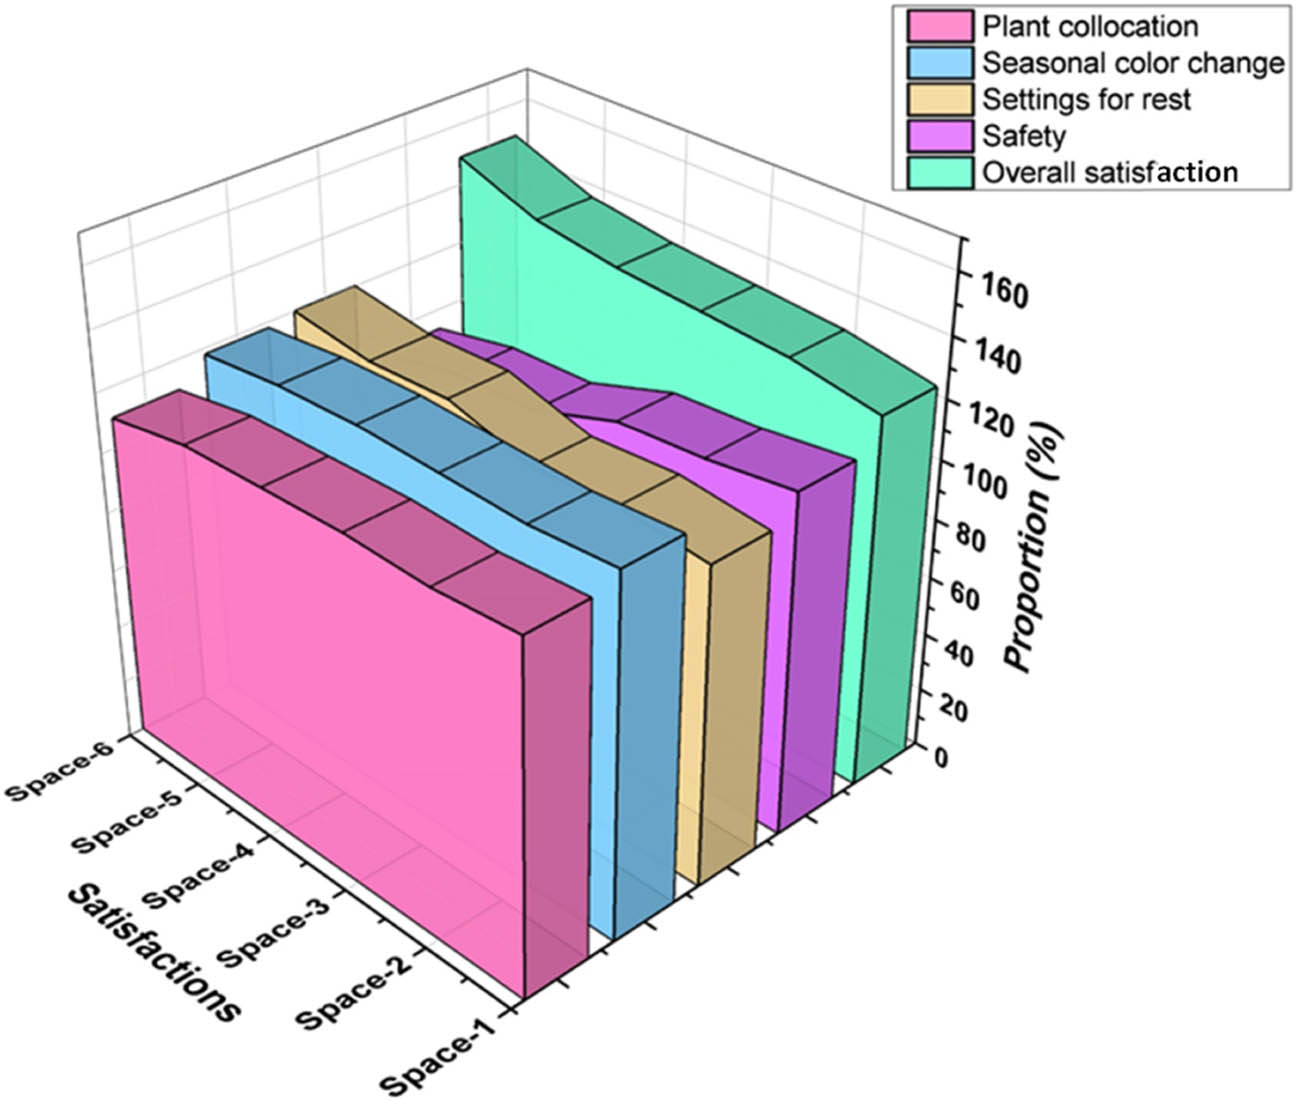
Comparison of satisfactions of the PGS (n = 590).
Numerical outcomes of satisfaction of the PGS (n = 590)
| Proportion (%) | |||||
|---|---|---|---|---|---|
| Satisfactions | Plant collocation | Seasonal color change | Settings for rest | Safety | Overall satisfaction |
| Space-1 | 118 | 122 | 108 | 116 | 126 |
| Space-2 | 116 | 120 | 111 | 112 | 131 |
| Space-3 | 117 | 121 | 109 | 110 | 133 |
| Space-4 | 116 | 122 | 117 | 100 | 135 |
| Space-5 | 115 | 121 | 116 | 99 | 139 |
| Space-6 | 110 | 118 | 120 | 93 | 149 |
4.1.2 Demands to the PGS
According to the respondents (there were 590 responses), enjoying the environment, reading or relaxing, and conversing with others or going for a stroll are the three functions that are required the most on average. The obvious winner among them is talking or walking, which 356 respondents required, or just over 60%, demonstrating the most significant need and desire. PGS are essential elements of urban landscapes and provide the community with several advantages. The demands made on PGSs are a reflection of what the general population wants and needs. Planning and maximizing PGS must take these criteria into account to guarantee that they satisfy the needs and expectations of the general public. To improve the general quality and use of PGS, regular feedback, surveys, and community discussions may assist in collecting information and prioritizing changes.
For the overall Demands of the PGS in Figure 6 and Table 3, there is not much of a difference between the six green places in terms of things like reading or relaxing, taking in the view, conversing or strolling, fitness centers, housing options, and other things. Therefore, the study shows a high score at any one of the spaces that consider chatting or walking, with Space 4 being relatively high, Space 1 has the lowest score, 120 points, with 135 points. The other four and the other spots had the same scores, which came to 130, 121, 128, 132, and 133 indications, correspondingly.
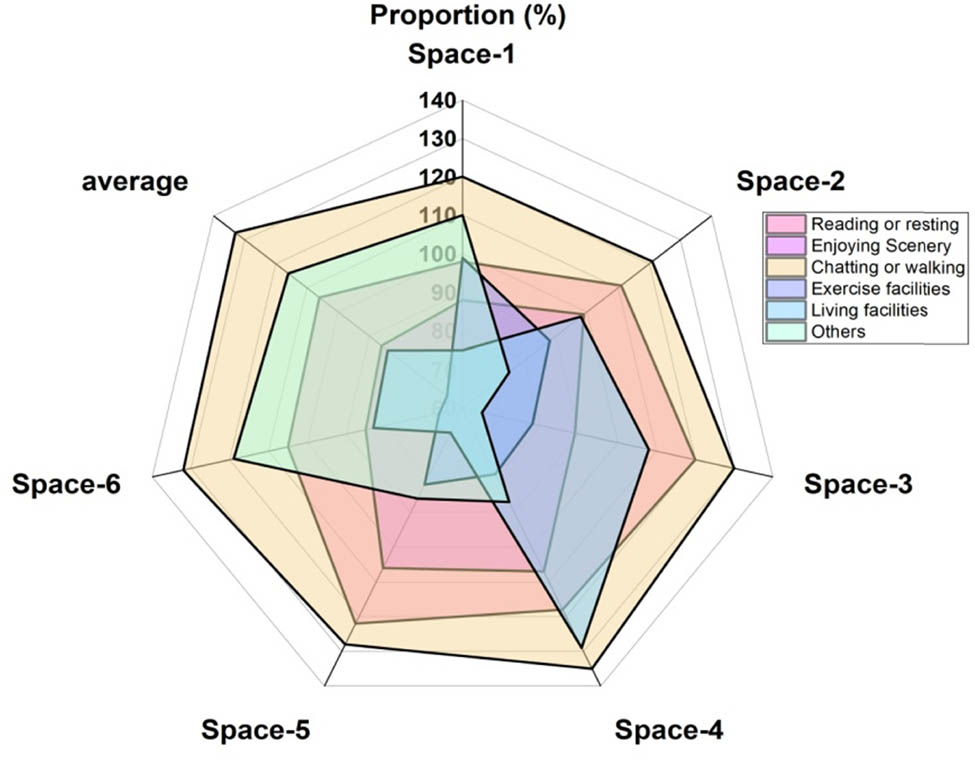
Comparison of demands to the PGS (n = 590).
Numerical outcomes of demands to the PGS (n = 590)
| Proportion (%) | ||||||
|---|---|---|---|---|---|---|
| Demands | Reading or resting | Enjoying Scenery | Chatting or walking | Exercise facilities | Living facilities | Others |
| Space-1 | 98 | 88 | 120 | 99 | 75 | 110 |
| Space-2 | 111 | 99 | 121 | 88 | 98 | 75 |
| Space-3 | 120 | 89 | 130 | 78 | 108 | 65 |
| Space-4 | 118 | 107 | 135 | 79 | 129 | 87 |
| Space-5 | 122 | 106 | 128 | 82 | 67 | 86 |
| Space-6 | 105 | 85 | 132 | 66 | 83 | 119 |
| Average | 106 | 86 | 133 | 65 | 84 | 116 |
4.1.3 Usage periods for the PGS
The community uses PGS; however, the times of use might change depending on the weather, daylight hours, and community preferences. Respondents had the option of selecting more than one response to this section’s question, and those who rarely visited the university’s green spaces were disregarded (there were a total of 481 responses; those who replied “sometimes” and “often” to the question indicate that they often move about on campus but not “nearly no”. Depending on the location, temperature, cultural customs, and accessibility to services and programs in the green spaces, different use times may apply. PGS may be used all year long by individuals, families, and community organizations, and scheduled activities throughout the week, on the weekend, and in the evening.
The difference between the six green spaces and factors like Ante Meridiem (AM) and Post Meridiem (PM), before class, after class, evening, and others is not great for the overall usage periods to the PGS shown in Figure 7 and Table 4, so the researchers show the highest score at any one of the spaces that we consider to be after class, with space 1 being relatively high at 160 points and space 5 being the lowest at 122 points. Similar use times were present in the scores of the other areas, which were 152, 143, 134, 126, and 137 points, respectively.
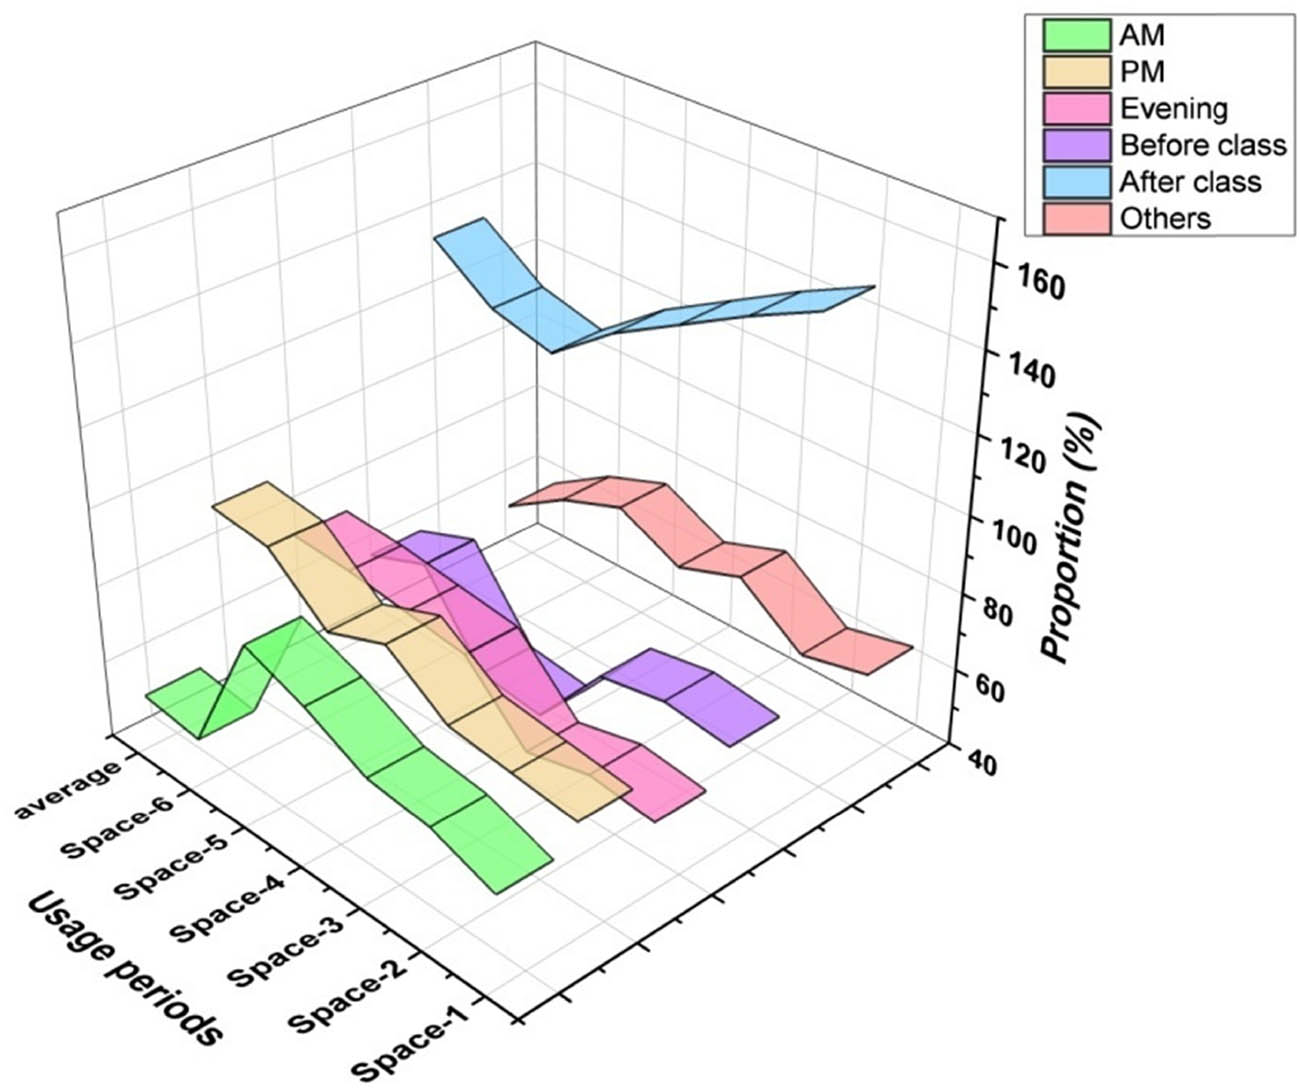
Comparison of usage periods to the PGS (n = 481).
Numerical outcomes of usage periods to the PGS (n = 481)
| Proportion (%) | ||||||
|---|---|---|---|---|---|---|
| Usage periods | AM | PM | Evening | Before class | After class | Others |
| Space 1 | 64 | 70 | 58 | 66 | 160 | 63 |
| Space 2 | 70 | 72 | 60 | 68 | 152 | 59 |
| Space 3 | 72 | 74 | 56 | 65 | 143 | 71 |
| Space 4 | 80 | 85 | 72 | 45 | 134 | 65 |
| Space 5 | 86 | 79 | 74 | 47 | 122 | 73 |
| Space 6 | 52 | 92 | 76 | 68 | 126 | 67 |
| Average | 54 | 94 | 77 | 62 | 137 | 57 |
4.1.4 The convenience of the PGS
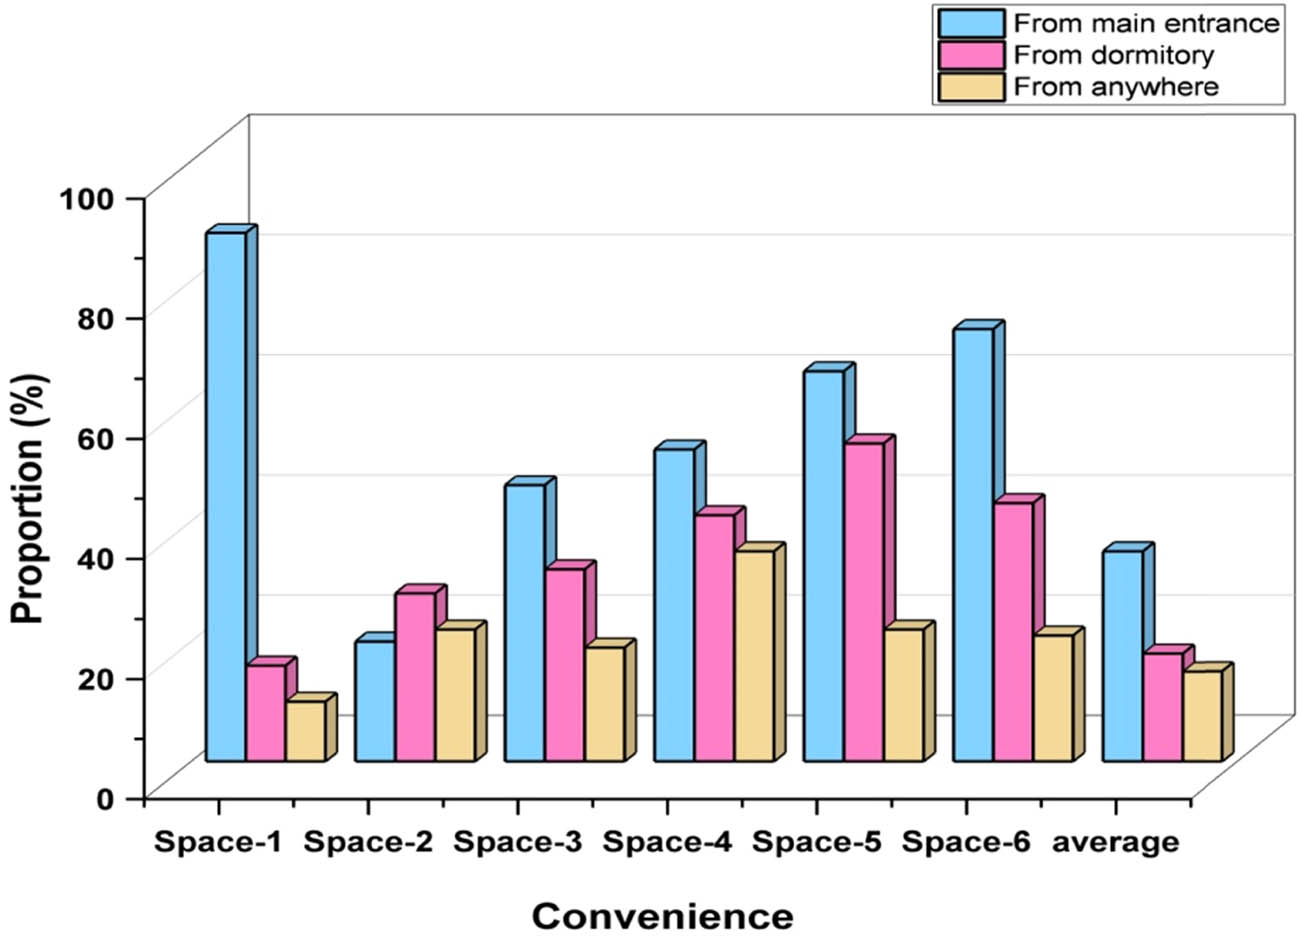
Another question we examined was, How accessible is it from the main campus gate, compared to the residence hall complexes or from any other location on campus to any of these public areas. Figure 8 shows the outcomes. The majority of students said it was rather easy to get from the primary entrance to each of the preserves. Space 2 was the least convenient because it was far from the main entrance. In contrast, since it was closest to their dorms, students felt that space 1 was the most convenient from their dorms, rating 88.
Comparison of the convenience of the PGS.
For the overall accessibility or convenience of the PGS in Figure 8 and Table 5, the variations among the six green areas as features, including the separation from the primary entrance, distance, from the dormitory, and distance from anywhere, are not great. The researchers will display the high score at any one of the spaces that are considered to be the distance from the main entrance, with space 1 being relatively high, with 88 points, and space 2 being the lowest, with 20 points. The average ratings for the following four locations’ convenience were comparable, at 46, 52, 65, 72, and 35 points, respectively.
Numerical outcomes of convenience of the PGS
| Convenience | From dormitory | From main entrance | From anywhere |
|---|---|---|---|
| Space 1 | 16 | 88 | 10 |
| Space 2 | 28 | 20 | 22 |
| Space 3 | 32 | 46 | 19 |
| Space 4 | 41 | 52 | 35 |
| Space 5 | 53 | 65 | 22 |
| Space 6 | 43 | 72 | 21 |
| Average | 18 | 35 | 15 |
4.1.5 Collision of gender on usage periods
A total of 403 people (268 of them were men) participated in the poll, and Figure 9 demonstrates a high indicating 63% of guys seldom ever visit the campus green space. In contrast, there are very few women, only 10, or 135%, who never visit public green places. Gender may have some impact on how people use and prefer PGS, resulting in differences in utilization times. It’s crucial to understand that these are only generalizations and that people’s tastes might differ greatly. Additionally, cultural elements, social conventions, and particular community traits may affect how gender affects use times. PGS may be created and maintained to suit a variety of use patterns, promote inclusiveness and equitable access for everyone, and take into account the various requirements and preferences of all genders.
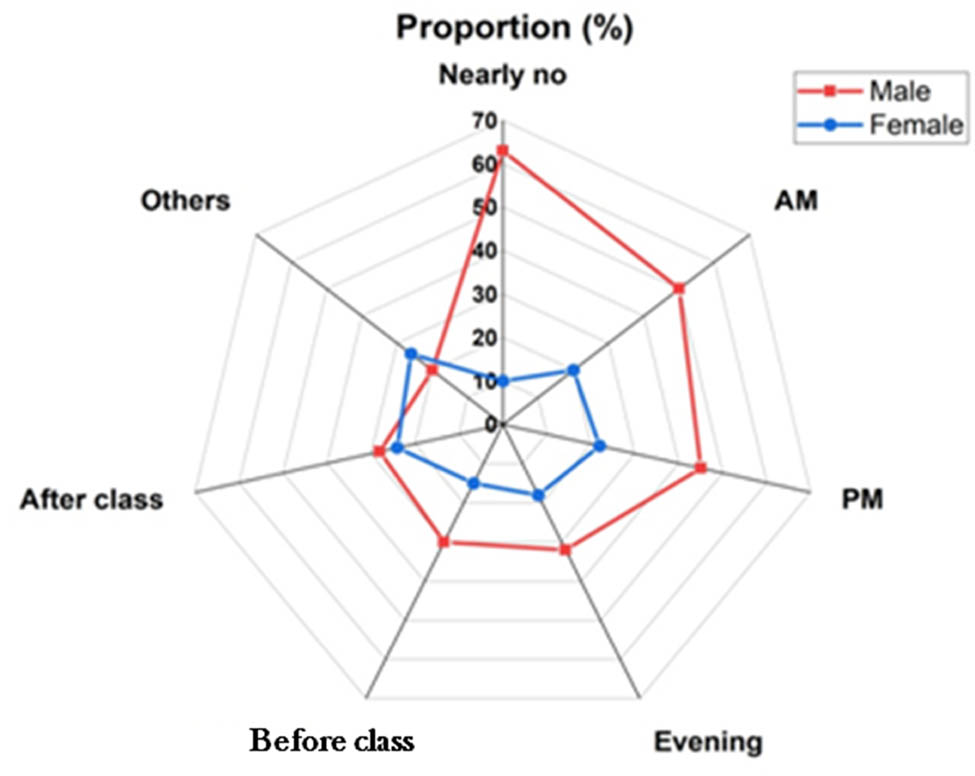
Comparison of collision of gender on usage periods.
For the overall Impact or collision of gender on usage periodsin, Figure 9 and Table 6, the difference between the male and females with factors such as Ante Meridiem (AM) and Post Meridiem (PM), before class, after class, evening, Nearly no (number) (frequency moving round on campus) and others is not large; the researchers will show the high score at Male which consider as from Nearly number (frequency moving round on campus) in which male is relatively high with 63% and nearly number (frequency moving round on campus) in which female is relatively low with 10%.
Numerical outcomes of collision of gender on usage periods
| Proportion (%) | ||
|---|---|---|
| Gender on usage periods | Male | Female |
| Nearly no | 63 | 10 |
| AM | 50 | 20 |
| PM | 45 | 22 |
| Evening | 32 | 18 |
| Before class | 30 | 15 |
| After class | 28 | 24 |
| Others | 20 | 26 |
4.1.6 Lack of appeal of green environments
Children’ enjoyment may be impacted by the standard of the green area itself, which could reflect the location’s attraction. The quality of the green space itself can have an effect on children’s enjoyment and could demonstrate how appealing the location. In the institution’s green space, however, the mix of big trees, medium in size shrubs, and perennials is herbaceous, as well as the flowering season’s concentration in spring and summer, make it easy for it to become monotonous, as seen in spaces 1 and 6 which are represented in Figure 10. The appeal of the green space itself may be increased by using a sensible plant arrangement to create a commensurate Richness of color throughout the seasons and beautiful scenery.
Comparative analysis of unappealing green spaces.
4.1.7 Comparison of GIS and VR/AR
In urban planning and design with GIS-based visualization, GIS is better at data visualization (90%) and impact assessment (95%), due to its capacity to render fine geographic details and evaluate environmental, social, and economic impacts efficiently. GIS is also effective in cost efficiency (85%) and scalability (90%), rendering it effective in big-scale urban planning developments. However, GIS positions low in user interaction (70%) and live data merging (80%) when compared with VR and Augmented Reality (AR) at 95 and 85%, respectively, as a result of their interactive and immersive technology. VR/AR also levels higher than GIS in user interaction and collaboration (85%), but is less cost-effective (60%) and scalable (75%) with greater technology demands and maintenance subscriptions. Generally, while GIS has strong visualization and impact evaluation, VR/AR has more user interaction and real-time integration capabilities, albeit at greater expense. Figure 11 and Table 7 show the outcome performance for comparison of GIS and VR/AR.
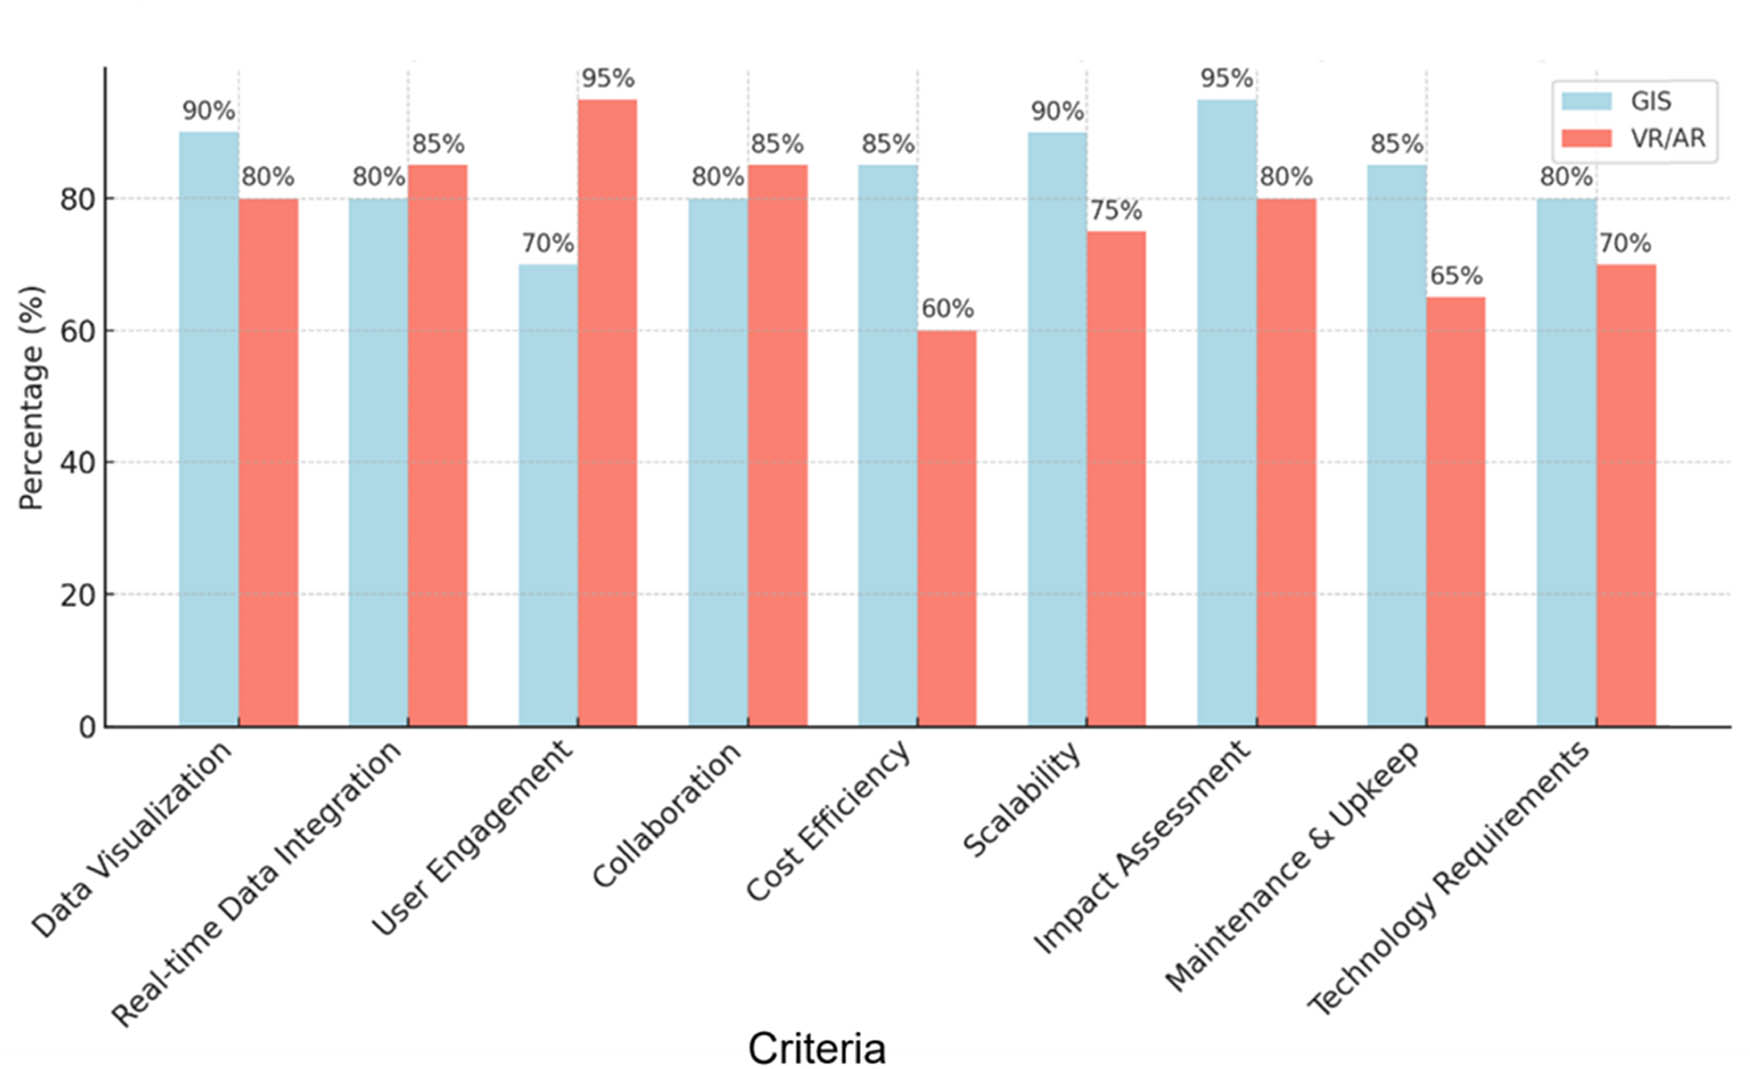
Outcome performance for comparison of GIS and VR/AR.
Numerical comparison of GIS and VR/AR
| Criteria | GIS (%) | VR/AR (%) |
|---|---|---|
| Data visualization | 90 | 80 |
| Real-time data integration | 80 | 85 |
| User engagement | 70 | 95 |
| Collaboration | 80 | 85 |
| Cost efficiency | 85 | 60 |
| Scalability | 90 | 75 |
| Impact assessment | 95 | 80 |
| Maintenance & Upkeep | 85 | 65 |
| Technology requirements | 80 | 70 |
4.2 Findings and implications
The research emphasizes the limited impact gender and environmental conditions have on green space perception among students, with most respondents, especially men, hardly using the green spaces. The research does not provide enough context or detail on how these factors affect usage patterns and preferences. More thorough analysis of cultural and social determinants affecting gender-based differences in use would be an improvement in understanding these findings. Green space attractiveness, or the appeal of green spaces, can be enhanced by more optimal plant scheming and seasonal diversity. Specification of these factors would offer more pragmatic information for optimal green space planning. GIS excels in data visualization (90%) and impact assessment (95%), making it highly effective for large-scale urban planning developments. VR/AR outperforms GIS in user engagement (95%) and real-time data integration (85%), though at higher costs and lower scalability.
4.3 Discussion
Planning and optimizing campus green space systems is essential to developing settings that are sustainable and habitable for educational institutions. GIS technology has evolved in recent times into a powerful tool for storing, displaying, and analyzing spatial data, providing it with an ideal platform for planning and improving campus planning. This article will examine the contributions of GIS technology to the design and improvement of green space systems on campus while highlighting positive and negative aspects. Green campuses provide several environmental advantages, such as mitigating urban heat islands, improving air quality, conserving water, and enhancing biodiversity. Physical activity, social interaction, and stress relief are experiences that enhance the health and well-being of students, faculty, and staff alike. If designed well, green space can improve the learning experience, serve as outdoor classrooms, and provide space for recreation. GIS technology can collect, combine, and analyze several types of geographical data, such as information on structures, terrain, and land cover. It can assess potential locations for green space placement, assess connections to the rest of campus, and analyze how different your campus administration is related spatially. Beyond feeds of spatial data, GIS platforms can also produce attractive maps that share pertinent information while addressing stakeholder involvement, engagement, and decision making. The benefits of various designs are simulated through GIS-based software that studies the land and evaluates sun, wind, and other pedestrian access. This use of GIS will evaluate different green space designs and assess them. Campus green space networks can be designed and optimized to a significant level with the help of GIS technology. GIS facilitates efficient resource allocation, stakeholder participation, and long-term sustainability through the application of geographical data analysis, visualization, and modeling. For effective implementation, it is critical to resolve issues with data accuracy, technical expertise, and flexibility. Adopting the use of GIS technology allows schools to create vibrant, open, and environmentally friendly campus green spaces that enhance the overall campus experience. GIS is particularly good at mapping geographic data and determining impacts, hence being a sound option for massive urban planning schemes. Its cost-efficiency and scalability are significant strengths, although it lags behind VR and AR in user interaction and real-time data incorporation. VR and AR are superior in terms of interactive aspects, boosting collaboration and real-time updates, which are paramount for dynamic urban development procedures. Generally, GIS can be a better option for big investigations, while VR/AR provides more sophisticated features but at a higher price.
5 Conclusions
GIS technology can be employed to establish and enhance a campus green space system, which can provide various benefits to enrich the overall campus environment. By integrating a GIS with the campus design process, campus planners and administrators are able to efficiently administer and determine opportunities for the establishment, maintenance, and development of the green spaces across the campuses. One of the benefits of GIS technology is the ability to gather, store, analyze, and present geographic information that can be integrated into the campus green area space system. Thus, planners can ensure they have a comprehensive understanding of the location, size, and nature of any existing green space. By layering this data with additional relevant information, including student population density, accessibility, and environmental concerns, planners can identify areas for enhancement, prioritize projects, and allocate resources. Additionally, GIS technology simplifies the ability to optimize campus green space through scenario analysis and modeling. Campus Planning can model alternative scenarios of development, including the addition of new green spaces, reorganization of existing, and/or addition of sustainable elements, to understand how those impacts may influence the campus environment as a whole. Overall, campus PGS demand and contentment were similarly high, with Space 4 having the most demand for walking or conversing at 135 and Space 6 having the highest overall satisfaction score at 149. High usage involvement was also observed during usage intervals; in Space 1, after-class usage had the highest score of 160. With Space-1 being the most convenient for students at 88 points from the main gate, the PGS’s convenience was also highly appreciated. In growing China, the pace of growth has drastically decreased after over 20 years of campus management, and an emphasis on a sustainable and efficient campus environment has taken hold. The campus architecture helps in making informed decisions that maximize the benefits of green spaces, such as promoting biodiversity, providing recreational areas, improving air quality, and enhancing the aesthetic appeal of the smart campus. The investigators used an accessible assessment based on the Space syntactic theory and a survey of 590 students to find out how poorly green spaces on the Yijin campus in Hangzhou, China, were being used. The majority of pupils seldom or sporadically visit the green area, and they mostly do so in the afternoon and after class, with very few visits occurring in the morning. Planning and optimizing a campus green space system using GIS technology provides a thorough and methodical way to create surroundings that are aesthetically beautiful, useful, and sustainable. By leveraging the power of GIS, campus planning can enhance the quality of life for its community members, foster a connection with nature, and contribute to a greener and more sustainable future. The research recommends utilizing GIS technology to maximize campus green space does not provide specific suggestions. Specific examples, including enhancing accessibility, expanding green space, or adding sustainable elements such as rain gardens, would make the findings more practical for campus planners. These approaches would render the assumptions more actionable.
5.1 Limitations and future scope
A limitation of this research is the dependence on the precision and detail of GIS data, which cannot always reflect the true complexity of the real world. The absence of real-time data integration and minimal stakeholder engagement might impair the strength of the analysis in reflecting dynamic urban planning situations. Future research studies can investigate the incorporation of real-time data streams into GIS for dynamic urban planning. The integration of more holistic stakeholder feedback, including planners and local communities, could enhance the quality of decisions. Further, the implementation of novel machine learning (ML) algorithms to improve predictive modelling for urban growth could be a worthwhile area of interest.
Acknowledgments
China Ministry of Education’s Industry-Academic Cooperation Collaborative Education Project “Construction of Digital Simulation Laboratory Based on VR Simulation Technology,” project number: 220604709134917; The 2023 general topic of the “14th Five-Year Plan” for Teaching Science in Shaanxi Province is “Construction and Research of the “Three-Dimensional Integrated” Practical Teaching System for Environmental Design Major,” project number: SGH23Y2819; Xi’an Eurasia University Education Development Foundation project “Organic Renewal Design Service Platform for Old Towns Based on Digital Surveying and Simulation Integration Technology,” project number 202304; Xi’an Eurasia University Technical Service Special Key Project “Xi’an Old Factory Revitalization Design Service Guide,” project number OYKF-2022002; Xi’an Eurasia University Technical Service Special Key Project “Shaanxi Province Rural Style Improvement System and Design Guidelines,” project number OYJSFW-2021001.
-
Funding information: The authors state no funding involved.
-
Author contributions: All authors have accepted responsibility for the entire content of this manuscript and approved its submission.
-
Conflict of interest: The authors state no conflict of interest.
-
Data availability statement: All data generated or analyzed during this study are included in this published article.
References
[1] L. Cui, J. Wang, L. Sun, and C. Lv, “Construction and optimization of green space ecological networks in urban fringe areas: A case study with the urban fringe area of Tongzhou district in Beijing,” J. Clean. Prod., vol. 276, no. 2, p. 124266, Dec. 2020, 10.1016/j.jclepro.2020.124266.Search in Google Scholar
[2] X. Liu, B. Huang, R. Li, J. Zhang, Q. Gou, T. Zhou, et al., “Wind environment assessment and planning of urban natural ventilation corridors using GIS: Shenzhen as a case study,” Urban. Clim., vol. 42, no. 5, p. 101091, Mar. 2022, 10.1016/j.uclim.2022.101091.Search in Google Scholar
[3] N.-D. Hoang and X.-L. Tran, “Remote sensing–based urban green space detection using marine predators algorithm optimized machine learning approach,” Math. Probl. Eng., vol. 2021, no. 2, p. e5586913, May 2021, 10.1155/2021/5586913.Search in Google Scholar
[4] J. Wang, L. Zheng, H. Liu, B. Xu, and Z. Zou, “The effects of habitat network construction and urban block unit structure on biodiversity in semiarid green spaces,” Environ. Monit. Assess., vol. 192, no. 3, Feb. 2020, 10.1007/s10661-020-8115-7.Search in Google Scholar PubMed
[5] B.-X. Huang, S.-C. Chiou, and W.-Y. Li, “Accessibility and street network characteristics of urban public facility spaces: Equity research on parks in Fuzhou City based on GIS and space syntax model,” Sustainability, vol. 12, no. 9, p. 3618, Apr. 2020, 10.3390/su12093618.Search in Google Scholar
[6] Y. Sun, S. Saha, H. Tost, X. Kong, and C. Xu, “Literature review reveals a global access inequity to urban green spaces,” Sustainability, vol. 14, no. 3, p. 1062, Jan. 2022, 10.3390/su14031062.Search in Google Scholar
[7] S. Lahoti, M. Kefi, A. Lahoti, and O. Saito, “Mapping methodology of public urban green spaces using GIS: An example of Nagpur City, India,” Sustainability, vol. 11, no. 7, p. 2166, Apr. 2019, 10.3390/su11072166.Search in Google Scholar
[8] Z. Lei, J. Luo, and L. Cao, “Reconstruction strategies for SWMM-based campus landscape stormwater management,” WIT Trans. Ecol. Environ., vol. 1, no. 1, pp. 351–361, Nov. 2020, 10.2495/sc200291.Search in Google Scholar
[9] A. Belmeziti, F. Cherqui, and B. Kaufmann, “Improving the multi-functionality of urban green spaces: Relations between components of green spaces and urban services,” Sustain. Cities Soc., vol. 43, no. 3, pp. 1–10, Nov. 2018, 10.1016/j.scs.2018.07.014.Search in Google Scholar
[10] E. Rall, R. Hansen, and S. Pauleit, “The added value of public participation GIS (PPGIS) for urban green infrastructure planning,” Urban. For. Urban Green., vol. 40, no. 2, pp. 264–274, Apr. 2019, 10.1016/j.ufug.2018.06.016.Search in Google Scholar
[11] L. Li, Y. Zheng, and S. Ma, “Links of urban green space on environmental satisfaction: a spatial and temporarily varying approach,” Environ. Dev. Sustainability, vol. 25, no. 4, pp. 3469–3501, Feb. 2022, 10.1007/s10668-022-02175-z.Search in Google Scholar
[12] S. Yu, X. Guan, J. Zhu, Z. Wang, Y. Jian, W. Wang, et al., “Artificial intelligence and urban green space facilities optimization using the LSTM model: Evidence from China,” Sustainability, vol. 15, no. 11, pp. 8968–8968, Jun. 2023, 10.3390/su15118968.Search in Google Scholar
[13] X. Liu, X. Chen, Y. Huang, W. Wang, M. Zhang, and Y. Jin, “Landscape aesthetic value of waterfront green space based on space–psychology–behavior dimension: A case study along Qiantang river (Hangzhou Section),” Int. J. Environ. Res. Public. Health, vol. 20, no. 4, pp. 3115–3115, Feb. 2023, 10.3390/ijerph20043115.Search in Google Scholar PubMed PubMed Central
[14] A. Larkin and P. Hystad, “Evaluating street view exposure measures of visible green space for health research,” J. Exposure Sci. Environ. Epidemiol., vol. 29, no. 4, pp. 447–456, Jan. 2018, 10.1038/s41370-018-0017-1.Search in Google Scholar PubMed
[15] M. Le Texier, K. Schiel, and G. Caruso, “The provision of urban green space and its accessibility: Spatial data effects in Brussels,” PLoS One, vol. 13, no. 10, p. e0204684, Oct. 2018, 10.1371/journal.pone.0204684.Search in Google Scholar PubMed PubMed Central
[16] S. Puttinaovarat and P. Horkaew, “A geospatial platform for crowdsourcing green space area management using GIS and deep learning classification,” ISPRS Int. J. Geo-Inf., vol. 11, no. 3, p. 208, Mar. 2022, 10.3390/ijgi11030208.Search in Google Scholar
[17] B. Halder, J. Bandyopadhyay, A. A. Al-Hilali, A. M. Ahmed, M. W. Falah, S. A. Abed, et al., “Assessment of urban green space dynamics influencing the surface urban heat stress using advanced geospatial techniques,” Agronomy, vol. 12, no. 9, p. 2129, Sep. 2022, 10.3390/agronomy12092129.Search in Google Scholar
[18] Z. Lu, Z. Li, C. Mao, Y. Tan, X. Zhang, L. Zhang, et al., “Correlation between campus-built environment and physical fitness in college students in Xi’an—A GIS approach,” Int. J. Environ. Res. Public. Health, vol. 19, no. 13, p. 7948, Jan. 2022, 10.3390/ijerph19137948.Search in Google Scholar PubMed PubMed Central
[19] Z. Li, X. Chen, Z. Shen, and Z. Fan, “Evaluating neighborhood green-space quality using a Building Blue–Green Index (BBGI) in Nanjing, China,” Land, vol. 11, no. 3, p. 445, Mar. 2022, 10.3390/land11030445.Search in Google Scholar
[20] K. Jaalama, N. Fagerholm, A. Julin, J.-P. Virtanen, M. Maksimainen, and H. Hyyppä, “Sense of presence and sense of place in perceiving a 3D geovisualization for communication in urban planning – Differences introduced by prior familiarity with the place,” Landsc. Urban. Plan., vol. 207, no. 2, p. 103996, Mar. 2021, 10.1016/j.landurbplan.2020.103996.Search in Google Scholar
[21] B. Halder, J. Bandyopadhyay, K. M. Khedher, C. M. Fai, F. Tangang, and Z. M. Yaseen, “Delineation of urban expansion influences urban heat islands and natural environment using remote sensing and GIS-based in industrial area,” Environ. Sci. Pollut. Res., vol. 29, no. 48, pp. 73147–73170, May 2022, 10.1007/s11356-022-20821-x.Search in Google Scholar PubMed
[22] E. Nurdin, “Applications of convex polygon and kernel density analyses to model the home ranges of equatorial spitting cobra Naja sputatrix (BOIE, 1827) in green areas of universitas Indonesia campus, West Java,” Zoo. Indonesia, vol. 31, no. 2, pp. 121–131, 2023, 10.52508/zi.v31i2.4464.Search in Google Scholar
[23] K. Abimbola and O. Agboola, “Campus green infrastructures and academic performance in tertiary institutions in Nigeria’s South West,” Donnish J. Geogr. Regional Plan., vol. 4, no. 1, pp. 7–26, 2023.Search in Google Scholar
[24] X. Zhang, W. Fan, and X. Guo, “Urban landscape design based on data fusion and computer virtual reality technology,” Wirel. Commun. Mob. Comput., vol. 2022, no. 4, pp. 1–14, Jan. 2022, 10.1155/2022/7207585.Search in Google Scholar
[25] L. He and S. Zhu, “Virtual reality technology in visual design of artistic images: Analysis and applications,” Sci. Program., vol. 2022, no. 2, pp. 1–6, Jan. 2022, 10.1155/2022/2527623.Search in Google Scholar
[26] Q. Li, K. Peng, and P. Cheng, “Community-level urban green space equity evaluation based on spatial design network analysis (sDNA): A case study of Central Wuhan, China,” Int. J. Environ. Res. Public. Health, vol. 18, no. 19, p. 10174, Sep. 2021, 10.3390/ijerph181910174.Search in Google Scholar PubMed PubMed Central
[27] X. Li, G. Ni, and B. Dewancker, “Improving the attractiveness and accessibility of campus green space for developing a sustainable university environment,” Environ. Sci. Pollut. Res., vol. 26, no. 32, pp. 33399–33415, Nov. 2019, 10.1007/s11356-019-06319-z.Search in Google Scholar PubMed
© 2025 the author(s), published by De Gruyter
This work is licensed under the Creative Commons Attribution 4.0 International License.
Articles in the same Issue
- Research Articles
- Air fare sentiment via Backtranslation-CNN-BiLSTM and BERTopic
- Visual analysis of urban design and planning based on virtual reality technology
- Creative design of digital media art based on computer visual aids
- Deep learning-based novel aluminum furniture design style recognition and key technology research
- Research on pattern recognition of tourism consumer behavior based on fuzzy clustering analysis
- Driving business growth through digital transformation: Harnessing human–robot interaction in evolving supply chain management
- Applications of virtual reality technology on a 3D model based on a fuzzy mathematical model in an urban garden art and design setting
- Approximate logic dendritic neuron model classification based on improved DE algorithm
- Special Issue: Human Behavior and User Interfaces
- Study on the influence of biomechanical factors on emotional resonance of participants in red cultural experience activities
- Special Issue: State of the Art Human Action Recognition Systems
- Research on dance action recognition and health promotion technology based on embedded systems