Air fare sentiment via Backtranslation-CNN-BiLSTM and BERTopic
-
Xijun Ke
 ,
Jiajun Wen
,
Jiajun Wen

Abstract
Civil aviation passengers’ comments about airlines or airports on social media are the key to improving service quality. In order to make effective use of these data, in-depth analysis is needed to provide solid support for service improvement of airlines and airports. Due to its uniqueness, accurate modeling and analysis are required. First, the data are accurately collected from various network platforms and reprocessed. In this process, transfer learning, artificial data annotation, and term frequency–inverse document frequency (TF-IDF) analysis technology are innovatively integrated to ensure data quality and analysis depth. Then, according to the characteristics of the review data, the civil aviation domain-specific word vector based on Word2Vec was customized and developed, and the backtranslation – convolutional neural networks – bi-directional long short-term memory (Backtranslation-CNN-BiLSTM) model was constructed for sentiment analysis. The model is verified by multi-dimensional evaluation indicators, which shows excellent performance indicators and ensures reasonable efficiency. Finally, the cutting-edge BERTopic modeling technology was used to deeply mine the passenger comment topics to reveal the focus and potential needs of passengers. This study successfully constructed the technical system of civil aviation passenger comment sentiment analysis, which provided technical support for industry service optimization.
1 Introduction
In recent years, although deep learning techniques have made great strides in the field of natural language processing, especially sentiment analysis, as described in previous studies [1–7], there are still significant research gaps in the in-depth analysis and understanding of the specific field of civil aviation passenger comments. Zhou et al. [8] effectively enhanced the richness of sentence representation by combining convolutional neural network (CNN) and long short-term memory (LSTM) [9], providing a new perspective for emotion analysis. However, these general methods often fail to accurately capture the language patterns and hidden emotions unique to the field when dealing with comments from civil aviation passengers. Sentiment analysis can mainly bring huge business value to enterprises, but the existing methods still have shortcomings in identifying complex emotion expression and context dependence in civil aviation reviews [10]. Although the work of Irsoy and Cardie [11] and Liu et al. [12–16] enhanced the classification ability of the model by combining the word vector and the part of speech information with recurrent neural network (RNN) and LSTM respectively, its performance still needs to be improved in the face of the unique real-time, high variability, and domain specialization of civil aviation review data.
Zhou et al. [17] provided a new idea for sentiment analysis by comparing the performance of CNN and BiLSTM in sentiment classification of short texts and introducing Bagging algorithm to optimize the results. However, most of these studies focus on general texts, and their adaptability to specific problems in the field of civil aviation still needs to be further explored. Although the work of Song et al. [18] and Danyal et al. [19] introduced multimodal and multitask learning, as well as advanced pre-training models such as XLNet and bidirectional encoder representations from transformers (BERT), how to effectively use these techniques in the specific application of sentiment analysis of civil aviation reviews remains to be further studied. In the operation of airlines, passengers will make various comments on social media, so it is necessary to accurately analyze the comments of passengers and timely grasp the situation of passengers, so as to provide strong support for good service. As Song [20] ’s research shows, the sentiment and satisfaction analysis of passenger online reviews in urban transportation hubs reveals the great potential of reviews for service improvement. Although existing studies such as Punetha and Jain [21] used SentiWordNet dictionary to obtain contextual sentiment scores of comments, Damholdt et al. [22] explored the relationship between negative predicates and online situations through sentiment analysis and regression. As well as Vasiliu et al. [23] and Henkel et al. [24]’s exploration in dynamic sentiment analysis and social robot design, the multi-modal emotion recognition algorithm proposed by Nie [25] ’s adopts a dual fusion process at the feature layer and the decision layer, these works mostly focus on the optimization of general scenarios or technical levels, and there is still a significant gap between in-depth analysis and application in the specific field of airline passenger comments.
The research gap is mainly reflected in that civil aviation passenger review data have its own characteristics. First, it is not easy to obtain and process data. Due to the high real-time requirements of comments and the difficulty of collecting from official websites, most of the comments are generated on the Internet platform, which has more changes in grammar, vocabulary, and word order. Second, there is a lack of specialized corpus of Chinese in the field of civil aviation, and its language structure and expression are very different from other languages such as English. Third, since passenger reviews in the civil aviation field contain implicit emotions, it requires in-depth understanding and analysis of the context. Therefore, its characteristics and problems need to be studied in order to accurately analyze the emotions of passengers.
In view of the lack of research, this paper proposes the research based on Backtranslation-CNN-BiLSTM and BERTopic. The work is as follows: 1. Data processing. A transfer learning unsupervised learning model combined with manual labeling was designed to label the samples. 2. Make up the corpus. It uses term frequency–inverse document frequency (TF-IDF) analysis to determine the characteristics of civil aviation data, constructs a stop word list and civil aviation field word vector, and supplements the special civil aviation Chinese corpus. 3. Dig deeper. The Backtranslation-CNN-BiLSTM model is constructed to perform sentiment analysis and combined with BERTopic to mine the topics involved.
2 Research ideas
2.1 Research framework
According to the characteristics of the problem, the research idea is shown in Figure 1, and the specific steps are as follows.
Data fetching. First, civil aviation passenger comment data are collected from the platform as sentiment analysis text. Then, a large number of Chinese-dominated civil aviation-related texts are obtained from Wikipedia, Baidu, and Zhihu as word vector training data.
Data processing. The two text data are processed by unifying the data format, removing the duplication of the text, specifying the characters, and unifying the language into simplified Chinese. Then, based on the basic corpus of stuttering word segmentation, the civil aviation terms are expanded, and the text segmentation is carried out, and then, the stop words are removed.
Annotate the data. The data were unlabeled, and the samples were selected for transfer learning, unsupervised training, and manual annotation to label the data. Therefore, a good representation is learned from the unlabeled data, and the sentiment of civil aviation passenger comment data is divided into negative, positive, and neutral and labeled to form a text database for civil aviation passenger comment sentiment analysis. Then, TF-IDF analysis was performed on different sentiment polarity datasets of the data.
Word vectorization. On the basis of text preprocessing and word segmentation, Word2Vec technology is used to train word vectors based on civil aviation-related texts; to train custom word embeddings, we use the aerial dataset to train the word embedding model. During training, we tune the parameters of the model to optimize domain-specific performance, such as setting a smaller window size to capture tighter context, or increasing the number of iterations to learn more in-depth domain-specific features. Then, the trained word vectors are used to vectorize the sentiment analysis text to form vectorized data.
Model training. According to the characteristics of the data, in order to reduce the generalization error as the goal, the Backtranslation, CNN, dynamic learning rate correction, and callback function are combined to establish the Backtranslation-CNN-BiLSTM model, and the corresponding model parameters are set to train the vectorized data.
Thematic analysis. On the basis of the aforementioned research, the BERTopic topic technology, which is the optimal number of topics determined based on perplexity, is used for topic analysis of sentiment research data.
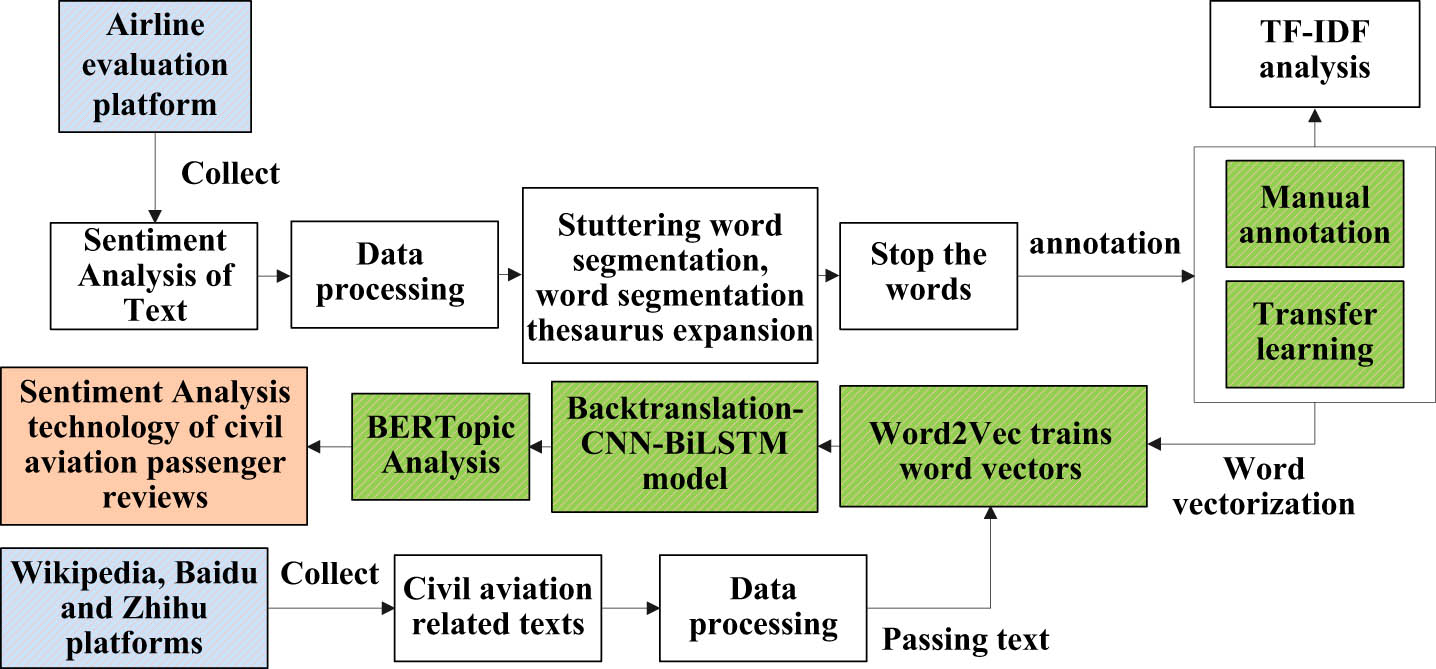
Research idea chart.
3 Sentiment analysis framework based on Backtranslation-CNN-BiLSTM model
3.1 Dataset processing
The data come from Weibo, TripAdvisor, Yelp, travel blog, travel aggregator platform, and flight review website. Through integrating a wider range of data sources, passengers’ emotions can be understood more comprehensively and diversified. Data processing includes data preprocessing and transfer learning techniques combined with manual labeling.
The main steps of data preprocessing are as follows: first, data set sorting, data format specification and deletion of blank lines, confusion lines, repeated lines, and meaningless special characters, resulting in 12,352 pieces of data. The second is data preprocessing, using regular expression matching to further remove invalid data such as characters, and then stuttering word segmentation, and then according to the stop word list based on the characteristics of the data to remove stop words.
3.1.1 Data annotation
The main steps of transfer learning techniques combined with manual annotation are as follows: MiniBatchKMeans algorithm for unsupervised learning is a clustering model that can reduce the computational time while maintaining the clustering accuracy as much as possible. Fine-tuning some parameters of the model can reduce the computational cost and retain the good characteristics of the source model, minibatch, to reduce the amount of computation, thereby speeding up the clustering process, and further improve the resulting model through unsupervised tuning and joint refinement. First, MiniBatchKMeans is used to perform preliminary clustering on 3,009 data, observe the characteristics of each class, and mark the label 2, 1, and 0. Then, the fixed labeling team manually checked and corrected according to the definition of sentiment classification, forming 3,009 labeled data. Second, in order to enhance the generalization of data, the BackTranslation [26] method in the field of machine translation is used. It can improve the generalization ability of the model, alleviate the problem of data sparsity, and enhance the robustness of the model. The process is to call a more mature commercial translation software interface to translate from Chinese to English, then translate from English to Chinese into new data, and perform data enhancement to turn 6,018 qualified sample data with positive, neutral, and negative labels into training data. We consider injecting random noise into text data, such as spelling errors and punctuation changes in combination with BackTranslation, while performing BackTranslation augmentation using different translation models or translation language pairs to increase the diversity of generated sentences.
Then, the best deep learning network is used to train to form a supervised learning model. The third is to label the entire dataset. The supervised learning model was used to save and label the remaining data, and then, 12,352 data were obtained through manual review. In view of the human bias of annotation, cross-validation was used to let different annotators label the same batch of data and compare the results to identify and correct possible bias. For inconsistency, automatic tools were used to assist: clustering and so on to screen and verify the annotation results initially, so as to reduce human errors. In view of subjectivity, through continuous learning and optimization, the amount of collected and analyzed annotation data is increased, and the annotation process and algorithm model are optimized to improve the accuracy and robustness of sentiment classification. Finally, the sample data were enhanced by Backtranslation. It is worth noting that the source domain and the target domain of transfer learning are both civil aviation passenger review data, which has strong correlation and can achieve better results. After the implementation of transfer learning, it provides a stable data source, improves accuracy, recall rate, F1 value, and other indicators, and improves the generalization ability of the model.
In summary, the data preprocessing is realized, and the transfer learning technology is combined with the manual way to label the emotional data analysis. The designed annotation method is a semi-automatic annotation method combining manual annotation and automatic annotation, which reduces human subjectivity, improves the efficiency and accuracy of the annotation, and ensures the reliability of the results. Among them, identification 2, 1, and 0 are positive, neutral, and negative information texts, respectively. Through processing, a qualified data set containing 24,706 pieces of data are obtained as the dataset of the study.
3.2 Analysis of the TF-IDF dataset
Through feature extraction, several features of sentiment polarity can be obtained, which is of great significance for subsequent sentiment analysis. TF-IDF is a method of calculating the importance of a term in a document set. The importance of a word is directly proportional to its frequency in a particular document, but inversely proportional to its frequency in the entire document set. The more frequently a term appears in a given document, the higher the TF-IDF value will be, indicating that the term is more important in that document. Conversely, if a term appears in many documents, its TF-IDF value will decrease, indicating that it is not very important in the entire document set. Based on the constructed dataset of airline passenger reviews, the TF-IDF method [27] is used to extract the features of sentiment analysis text after preprocessing.
The TF-IDF method was used to extract data features, and the data were divided into positive, neutral and negative data sets according to the sentiment polarity. Extracting the positive dataset, we can see that the positive words are thank you, nice, and like for the plane, the airport, the stewardess, and the meal. In the neutral dataset, it can be seen that the neutral feature words are mostly neutral words, and there are also a small number of positive words and negative words. The overall performance of the neutral feature words is related to flights, airports, and airlines. The negative feature words in the negative data set include cancellation, delay, and refund, involving baggage, tickets, and passengers. In order to intuitively show the theme of the data, the top eight meaningful words in the proportion of positive dataset, neutral dataset and negative dataset are shown in Table 1, considering the rule of word frequency and adopting the descending order of TF-IDF value. We can know that the categories corresponding to these keywords have conformity. The larger the TF-IDF value, the more frequently a word appears in the document. If the word is a sentiment word, it also means that the word can better represent the topic and content of the sentiment in the document. The results of TF-IDF analysis will be used as a general understanding of the dataset, a reference to build or extend the stop words list of the sentiment dictionary, and decide whether to add it to the sentiment dictionary based on its TF-IDF value and sentiment tag.
TF-IDF analysis
| Positive | Neutral | Negative |
|---|---|---|
| Airplane | Flight | Make an apology |
| Airport | Airport | Luggage |
| Flight attendant | Airlines | Air ticket |
| Services | Airplane | Passengers |
| Thank you | Recover | Cancel |
| Not bad | Epidemic | Delay |
| Meals | Air ticket | Refund of ticket |
| Like | Airbus | Change of signature |
3.3 Backtranslation-CNN-BiLSTM sentiment analysis model
CNN has the characteristics of focusing on the most obvious features in the line of sight, and BiLSTM uses a combination of forward and backward hidden layers, which has the rich ability to access history and future context and is proven to be better for task order modeling. Adding the past feature states of time series data to the output results has important neural computing and application value. After BiLSTM, it is more widely used to tune the prediction results. According to the characteristics of Backtranslation, CNN, and BiLSTM, a sentiment analysis model based on Backtranslation-CNN-BiLSTM is established.
The Backtranslation-CNN-BiLSTM model is established, which consists of BackTranslation layer, input layer, Word2Vec word embedding layer, CNN layer, BiLSTM layer, and output layer. Sentiment analysis architecture is shown in Figure 2.
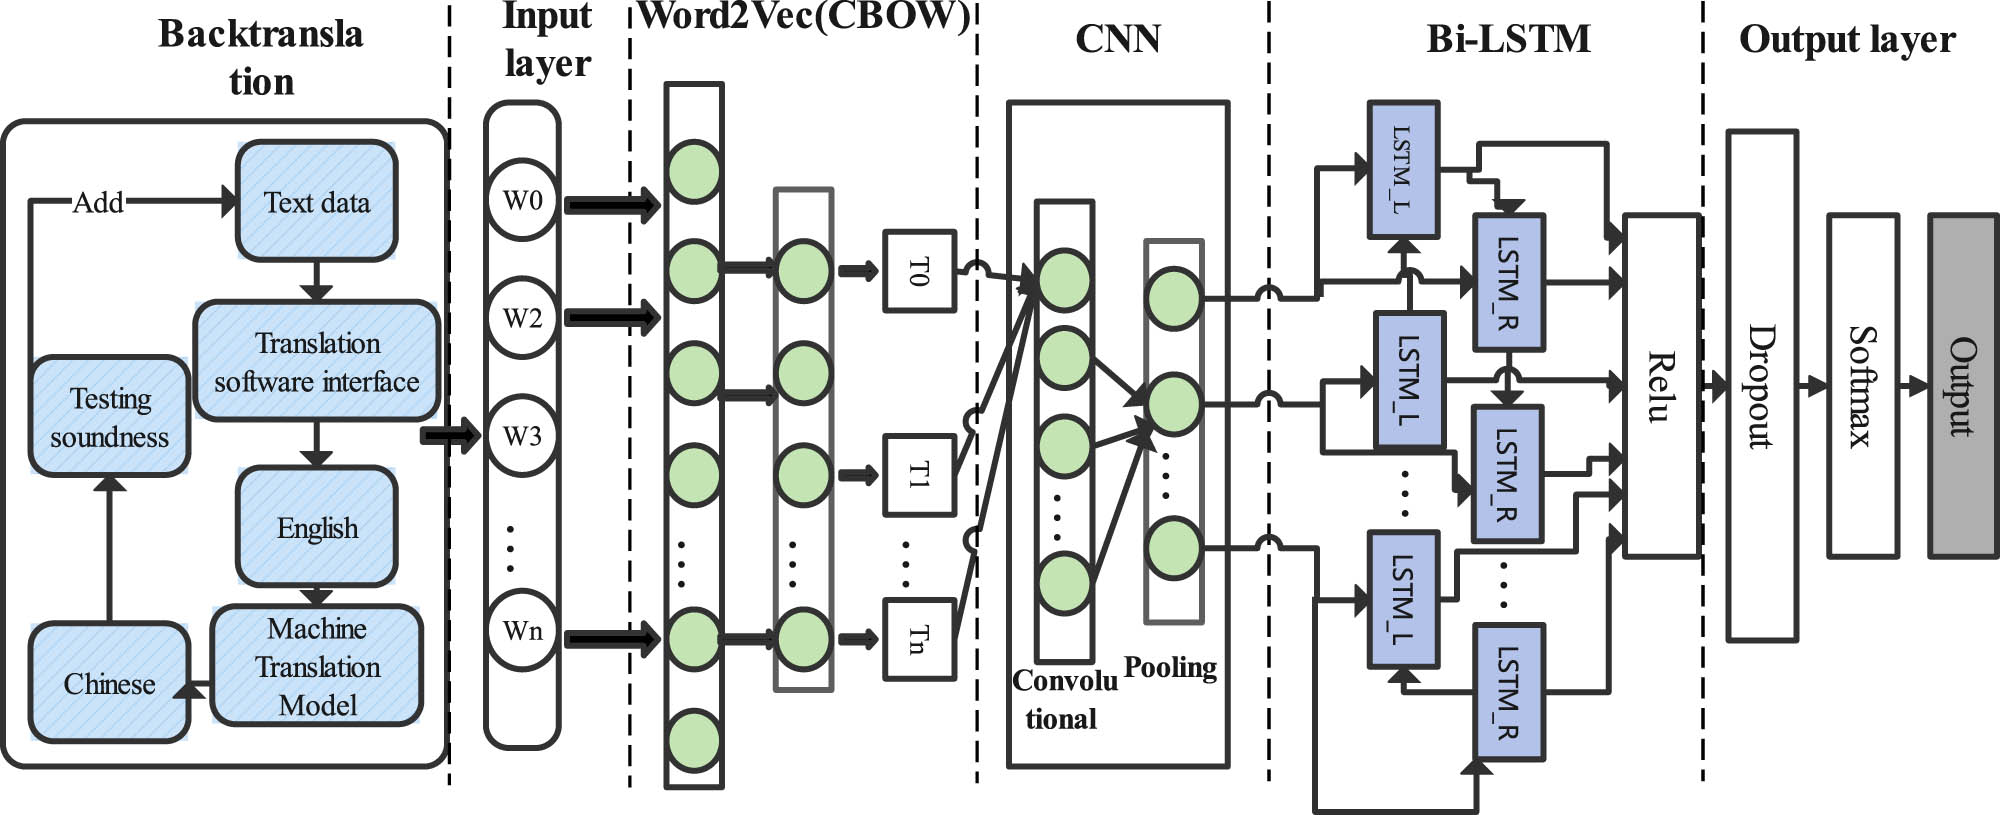
Diagram of the Backtranslation-CNN-BiLSTM architecture.
Bcktranslation layer, the machine translation model used, namely, youdao commercial API translator, is a system of neural networks, especially seq2seq model and attention mechanism. These models are able to capture the semantic information of the input text and generate natural and fluent translations at the time of output. In addition, API also employs terminological base and linguistic knowledge, combining human-produced computational grammar and monolingual and bilingual vocabulary to ensure the accuracy and professionalism of translation. When the same translation model is used to train translations in different directions between two languages, the same training corpus dataset is used, which may result in the backtranslated sentences that are similar to the original ones. To solve this problem, a variety of intermediate languages were also selected.
3.3.1 Word2vec
Considering the characteristics of passenger reviews that are mainly Chinese words and a large amount of data, Word2vec word vectorization technology suitable for data is given. In Word2vec model, there are two model architectures, continuous bag-of-words (CBOW) and Skip-gram. The CBOW model uses context information to predict the word vector of the current keyword. While the Skip-gram model uses the current keyword to predict the word vector of the context keyword [28], this study uses the scene of large-scale corpus and the more efficient CBOW model, which is equipped with two optimization techniques of negative sampling and hierarchical order and is more suitable for the data in this study. A vector is obtained for each data item in word order, which is denoted as an ordered sequence sample. Because there is no fixed format for review data, the ordered samples have different vector lengths.
To build word vectors, we need to collect these data. Then, Backtranslation is applied to the data for data augmentation and then passed to the input layer to divide each text in the dataset into multiple words separated by Spaces and train an embedding word for each word. Word2Vec is used when training each word embedding. Word2Vec was used to train the word vectors of the relevant texts in the civil aviation field. Finally, the word vector was saved, and the civil aviation review word vector CAReview.vector was obtained.
3.3.2 CNN
The basic structure of CNN has two layers. The first layer is the convolution layer, i.e., the feature extraction layer. Each convolution kernel has its own weight, which slides on the image through the convolution sliding window, and multiplies the value in each window with the weight, and adds it to obtain a new feature map, i.e., the input of each neuron is connected to the local receptive region of the previous layer and features are extracted from it. The second layer is the pooling layer, i.e., the feature mapping layer, which is used for dimension reduction and feature selection of the feature map output by the convolutional layer. Common pooling operations include Max pooling and average pooling. Each computing layer in the network is composed of multiple feature maps, each feature map is a plane, and all neurons on the plane have the same weight. The pooling operation can preserve the key characteristics of the data, reduce the number of parameters of the network, and improve the calculation speed. CNN [29] has the ability to identify local features of multidimensional data.
In text processing, the application of CNNs mainly depends on the structure and organization of the text. The CNN model will be used to discover and learn the local features of different sentences in the whole review document.
3.3.3 BiLSTM
BiLSTM is a bidirectional LSTM network, which is composed of forward LSTM and backward LSTM. The LSTM recurrent network is a more commonly used gated RNN, which is a creative improvement of the RNN and uses the “three-threshold design.” In addition to the external RNN cycle, the LSTM recurrent network also has an internal LSTM cell cycle, in which the gate includes input gate, forget gate, and output gate, which can effectively retain long sequence information [30]. The state of each LSTM cell is calculated as shown in equations (1)–(4).
where
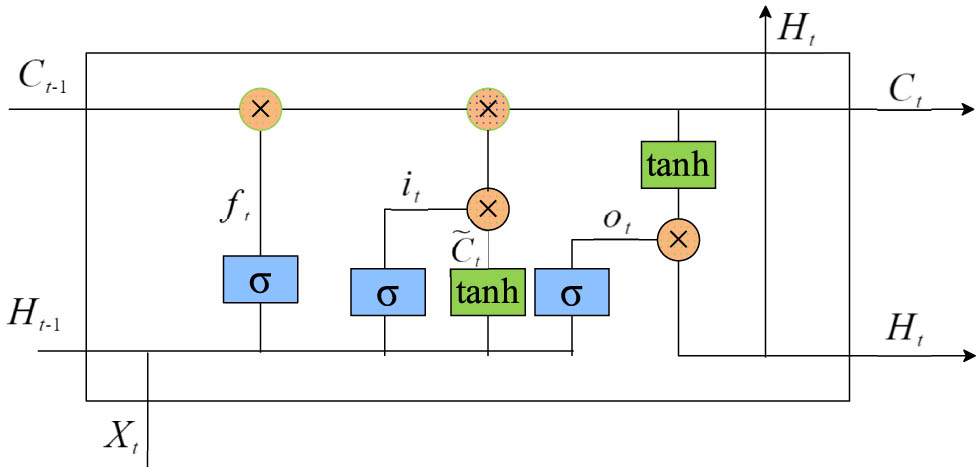
LSTM structure diagram.
In the BiLSTM network, forward LSTM and backward LSTM are independent of each other, and BiLSTM can be regarded as bidirectional LSTM [32]. It is very suitable for modeling time series data, which can better capture long-distance dependencies, and is good at modeling context information, encoding information from back to front, and can better capture bidirectional semantic dependencies through bidirectional LSTM network.
3.4 Performance evaluation
3.4.1 Evaluation index
The common evaluation indicators in text classifier, accurate, Precision, Recall, F-measure, and area under ROC curve (AUC), are used as the evaluation criteria for false information identification. In the latest work, these indicators can also be used to determine stability [33–35]. In the research experiment, precision refers to the proportion of all the data that are judged not to belong to the sentiment class, and recall refers to the proportion of all the data that are actually judged not to belong to the sentiment class. For categories, precision and recall are calculated as shown in Table 2.
Classification annotation
| – | ActuallyBelong | ActuallyNotBelong |
|---|---|---|
| Judge belonging | TP | FP |
| judged not belong | FN | TN |
Accuracy is the ratio of the number of samples correctly classified by the model to the total number of samples; precision is the proportion of instances predicted as positive by the model that is actually positive; recall is the proportion of instances predicted as positive by the model and the harmonic mean of precision and recall. The formulas are given in equations (5)–(8), respectively.
where TP refers to the number of samples whose actual class is positive and which are correctly predicted as positive by the classifier. FP, or false positives, is the number of examples that were incorrectly predicted to have a negative class by the classifier. TN, true negative examples, refers to the number of samples whose actual class is negative and which are correctly predicted as negative by the classifier. Finally, FN, or false negatives, is the number of examples whose class was actually positive but was incorrectly predicted to be negative by the classifier. A high precision value means that a large proportion of the recommended items are relevant; a high recall value means that the model is able to find most of the instances that are actually positive, i.e., there are few false negatives; the F1 score is the harmonic mean of recall and accuracy. It is the most used metric after accuracy. F1 score is a trade-off between recall and accuracy [36], and a high F1 score is a good balance between precision and recall, which is both accurate and comprehensive.
The ROC curve was constructed, and the sample probabilities predicted by the model were sorted from large to small for the AUC by setting different thresholds. The AUC is initialized to be 0. For each sample, formulas (9)–(11) corresponding to its true positive rate (TPR) and false positive rate (FPR) and AUC are calculated, respectively.
where
3.5 Backtranslation-CNN-BiLSTM model verification
According to the dataset of, the Backtranslation-CNN-BiLSTM model and evaluation indicators are combined, and Softmax is used as the activation function. The results of the analysis are shown in Table 3.
Model comparison
| Model type | TestAccuracy | Lossfunction | Category | F-measure | AUC |
|---|---|---|---|---|---|
| TextCNN | 0.7128 | 0.7159 | 0 | 0.63 | 0.9185 |
| 1 | 0.81 | ||||
| 2 | 0.38 | ||||
| BiLSTM | 0.7597 | 0.7988 | 0 | 0.71 | 0.9274 |
| 1 | 0.83 | ||||
| 2 | 0.56 | ||||
| Attention-BiLSTM | 0.6812 | 0.7247 | 0 | 0.61 | 0.9228 |
| 1 | 0.79 | ||||
| 2 | 0.17 | ||||
| CNN-BiLSTM | 0.7638 | 0.7826 | 0 | 0.72 | 0.9641 |
| 1 | 0.84 | ||||
| 2 | 0.55 | ||||
| Backtranslation-CNN-BiLSTM | 0.8992 | 0.3917 | 0 | 0.90 | 0.9871 |
| 1 | 0.92 | ||||
| 2 | 0.82 |
It can be seen that the test set accuracy of the Backtranslation-CNN-BiLSTM model is high, which can better capture the bidirectional semantic dependence and local features. The large AUC value indicates the high stability and robustness of the classifier, and the high F value indicates that the results used to test the sample can represent the overall truth [37], and the effect is good.
From Table 4, it can be seen that the MacroAvg of Backtranslation-CNN-BiLSTM is the highest, indicating that its performance on various categories is relatively balanced, and there is no excessive preference or neglect of a certain category. It has good generalization ability and robustness when dealing with this multi-category problem. The WeightAvg weighted average of the model is also the highest, indicating that the model performs well on the overall dataset and can comprehensively consider the contribution of each category, which further confirms the excellent performance of the model in the global scope. At the same time, the Kappa value of the model is also high, which indicates that the predicted results of the model are highly consistent with the real situation. The classification performance is very stable and reliable.
Model evaluation details
| Model type | Metrics | MacroAvg | WeightedAvg | Kappa |
|---|---|---|---|---|
| TextCNN | Precision | 0.65 | 0.69 | 0.4561 |
| Recall | 0.60 | 0.71 | ||
| F-measure | 0.61 | 0.70 | ||
| BiLSTM | Precision | 0.71 | 0.75 | 0.5663 |
| Recall | 0.69 | 0.76 | ||
| F-measure | 0.70 | 0.76 | ||
| Attention-BiLSTM | Precision | 0.58 | 0.64 | 0.3730 |
| Recall | 0.53 | 0.68 | ||
| F-measure | 0.52 | 0.64 | ||
| CNN-BiLSTM | Precision | 0.72 | 0.76 | 0.5711 |
| Recall | 0.69 | 0.76 | ||
| F-measure | 0.70 | 0.76 | ||
| Backtranslation-CNN-BiLSTM | Precision | 0.88 | 0.90 | 0.8223 |
| Recall | 0.87 | 0.90 | ||
| F-measure | 0.88 | 0.90 |
In order to show the superiority of the model more intuitively, the accuracy and running speed of the model in the training process are compared in Figures 4 and 5.
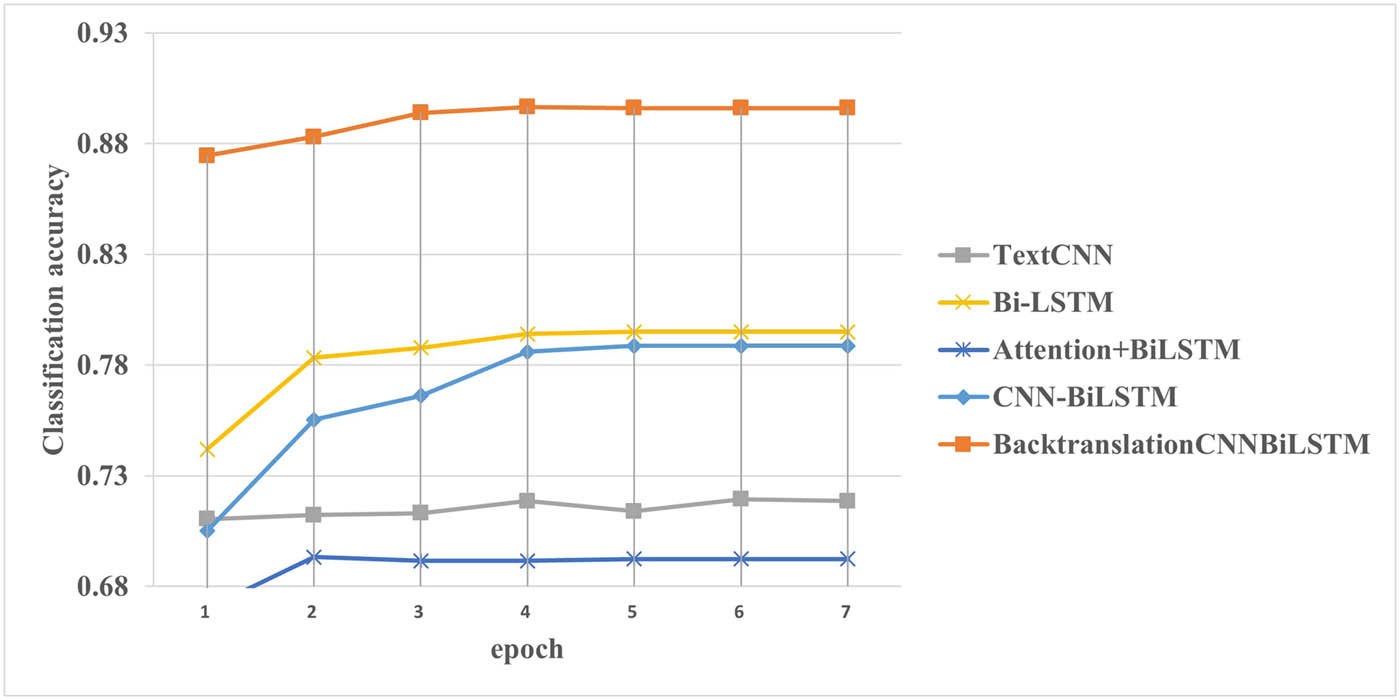
Plot of model training accuracy change.
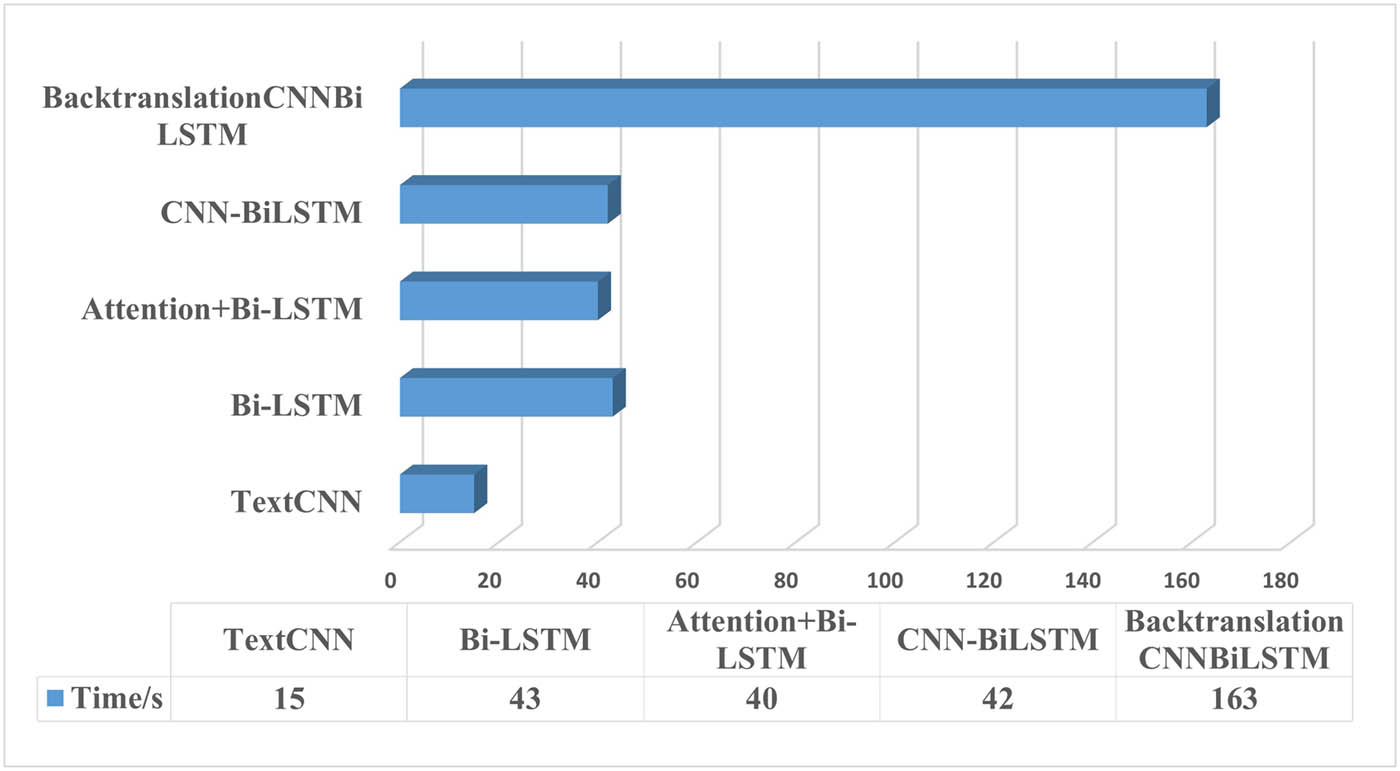
Comparison chart of model running speed.
Among them, the number of positive samples before the current value of
It can be seen that, first, the accuracy of each model shows an increasing trend as a whole, and the TextCNN model shows a slight decrease in the fifth epoch, which may be because it fails to effectively learn the before and after features of the text. The accuracy of the proposed Backtranslation-CNN-BiLSTM model is significantly improved compared with other models as a whole. Second, the TextCNN model runs faster than other models, which may be due to its small size, and the CNN-BiLSTM model runs at a reasonable speed. In summary, the proposed Backtranslation-CNN-BiLSTM model has higher accuracy than other models, but the running speed needs to be improved. The structure and parameters of the BackTranslmCNNbilSTM model are maintained. The model is based on zhihu text word vector sgns.zhihu, Baidu text word vector sgns.baidubaike, public word vector sgns. The specific results are shown in Table 5.
Word vector comparison
| Model | Test accuracy |
|---|---|
| sgns.zhihu | 0.8824 |
| sgns.baidubaike | 0.8785 |
| sgns.renmin | 0.8234 |
| CAReview.vector | 0.8992 |
It can be seen that the accuracy based on CAReview is higher. Among them, the dynamic learning rate correction started with
3.6 BERTopic topic analysis
In order to better analyze and mine passenger review data, this study conducted a theme analysis on the basis of sentiment analysis.
BERTopic is a powerful tool that combines the pre-trained model BERT with topic modeling [39]. The BERTopic model is used to analyze the topic of the dataset, and the topic distribution of the dataset is obtained. The method of calculating perplexity first to measure the quality of the number of selected topics concluded that the optimal number of topics was 5. The number of topics identified here is five. Topic analysis was then performed to obtain the vocabulary distribution of each topic, and the top ten words of each topic were sorted by their posterior probability of occurrence in descending order, as shown in Table 6.
BERTopic topic analysis distribution results table
| Topic | Keywords |
|---|---|
| flight company . airport . international . photography . plane . routes . flight . year month . return to China . | |
| sorry . apology . airport . company . plane . flight . international . date . flight . first . | |
| south . company . swim . plane . hours . students . baggage . . travel . suitcase . | |
| flight . company . and airport . plane . air . international . flight . joint . stewardess . air . | |
| company . flight . plane . airport . flight . . fans cancel . date . capital . first . |
BERTopic topic model [40] is the extraction of topic words from documents. The five themes focus on different aspects. The subject words “flight” and “route” in topic 1 have a large weight, which is the content highlighting airline operations and international flights. Topic 2, which contains words such as “apologies,” “apologies,” and “aircraft,” is the content that highlights airplane-related incidents. Topic 3 contains words such as “aircraft,” “student,” and “baggage” and is content that highlights the travel experience or the relevant services of the airline. Theme 4 contains words such as “flight,” “company,” and “stewardess,” which highlights the overall operation and service content of the airline. Theme 5, which contains words such as “company,” “aircraft,” “flight,” and “enthusiasts,” is the content that highlights the service of airline activities. The analysis shows that the data mainly focus on these five themes.
4 Concluding remarks
Sentiment analysis is a branch of natural language research, which has important application prospects in industrial and civil aviation fields. The review data of civil aviation passengers are analyzed and studied. According to the characteristics of civil aviation passenger review data, a transfer learning unsupervised learning model was designed and the samples were labeled with manual annotation. TF-IDF analysis was used to determine the characteristics of civil aviation data, and a stop-word table and a word vector in civil aviation were constructed to supplement the special Chinese corpus in civil aviation. Then, according to the characteristics of civil aviation passenger evaluation data, the Backtranslation-CNN-BILSTM model is constructed to carry out sentiment analysis. The model consists of BackTranslation layer, input layer, Word2Vec word embedding layer, CNN layer, BiLSTM layer, and output layer. The model pays attention to the generalization, context, and local characteristics of the data, and mines the hidden emotion of the passenger comment data. Finally, BERTopic topic modeling technology is used to dig the topic involved. Through the research model and related technology, the effect and accuracy of sentiment analysis in the field of civil aviation are improved. In this study, the model of passenger review text in the field of civil aviation is modeled, which can be directly applied to the text analysis and knowledge mining of civil aviation passengers. The research technique can be used for service improvements, where airlines can further improve service quality and passenger experience based on the praise and suggestions of passengers in positive reviews. Analysis of negative comments is carried out. The negative comments are identified by the model, and the problems and dissatisfaction encountered by passengers in the service process are determined by combining the topics and keywords extracted by the BERTopic model, and targeted optimization and continuous improvement are made.
Acknowledgements
Thank you to the experts, editors, journal organizers, and responsible persons who have provided assistance.
-
Funding information: This study was supported by “Minimax Optimization Problems in Machine Learning Applications,” a collaborative project between Nanjing University and Civil Aviation Flight College of China, project number: 12371301; And the Basic Scientific Research Fund Project of the Central Universities – Student Innovation Fund Project (Postgraduate) “Research on Sentiment Analysis of Civil Aviation Passenger Reviews Based on Bi-LSTM and LDA,” Project Number: 24CAFUC10176. CAAC Key Laboratory of Flight Techniques and Flight Safety Project FZ2022ZZ05, Key Technology for Pilot Skill Lifecycle Management Based on Big Data and Multi Objective Optimization.
-
Author contributions: All authors have accepted responsibility for the entire content of this manuscript and consented to its submission to the journal, reviewed all the results and approved the final version of the manuscript. Jiajun Wen, Xijun Ke and Haiwen Xu designed the experiments and Jiajun Wen carried them out. Jiajun Wen prepared the manuscript with contributions from all co-authors.
-
Conflict of interest: Authors state no conflict of interest.
-
Copyright: All authors retain copyright, unless – due to their local circumstances – their work is not copyrighted. The non-commercial use of each article will be governed by the Creative Commons Attribution-NonCommercial-NoDerivs license. The corresponding author grants De Gruyter Open the exclusive license to commercial use of the article, by signing the License to Publish. Scanned copy of license should be sent by e-mail to the Managing Editor of the journal, as soon as possible.
-
Data availability statement: The datasets generated during and/or analysed during the current study are available from the corresponding author on reasonable request.
References
[1] M. Al-Ayyoub, A. Nuseir, K. Alsmearat, Y. Jararweh, and B. Gupta, “Deep learning for arabic NLP: A survey,” J. Comput. Sci., vol. 26, pp. 522–531, 2018. 10.1016/j.jocs.2017.11.011Search in Google Scholar
[2] M. V. Naik, M. D. Anasari, V. K. Gunjan, and S. Kumar, A Comprehensive Study of Sentiment Analysis in Big Data Applications, Singapore: Springer; 2020, pp. 333–351, https://doi.org/10.1007/978-981-15-3125-5_35. Search in Google Scholar
[3] M. Ahmed, M. D. Ansari, N. Singh, V. Gunjan, S. K. BV, and M. Khan, “Rating-based recommender system based on textual reviews using IoT smart devices,” Mobile Inform. Syst., vol. 2022, pp. 1–18, July 2022. 10.1155/2022/2854741Search in Google Scholar
[4] L. Ting, M. Khan, A. Sharma, and M. D. Ansari, “A secure framework for IoT-based smart climate agriculture system: Toward blockchain and edge computing,” J. Intel. Syst., vol. 31, no. 1, pp. 221–236, 2022, https://doi.org/10.1515/jisys-2022-0012. Search in Google Scholar
[5] Z. A. Jaaz, M. D. Ansari, P. S. JosephNg, and H. M. Gheni, “Optimization technique based on cluster head selection algorithm for 5G-enabled IoMT smart healthcare framework for industry,” Paladyn J. Behav. Robotics, vol. 13, no. 1, pp. 99–109, 2022, https://doi.org/10.1515/pjbr-2022-0101. Search in Google Scholar
[6] K. Du, F. Xing, R. Mao, and E. Cambria, “Financial sentiment analysis: Techniques and applications,” ACM Comput. Surveys, vol. 56, no. 9, pp. 1–42, 2024. 10.1145/3649451Search in Google Scholar
[7] A. A. Naeem, Zaib Syed, “A near optimal scheduling algorithm for efficient radio resource management in multi-user mimo systems,” Wireless Personal Commun. Int. J., vol. 106, no. 3, 2019. 10.1007/s11277-019-06222-3Search in Google Scholar
[8] C. Zhou, C. Sun, Z. Liu, and F. Lau, A c-LSTM neural network for text classification, 2015, arXiv: http://arXiv.org/abs/arXiv:1511.08630. Search in Google Scholar
[9] M. Jamal, Z. Ullah, M. Naeem, M. Abbas, and A. Coronato, “A hybrid multi-agent reinforcement learning approach for spectrum sharing in vehicular networks,” Future Internet, vol. 16, no. 5, p. 152, 2024, https://doi.org/10.3390/fi16050152. Search in Google Scholar
[10] C. Quan and F. Ren, “Target based review classification for fine-grained sentiment analysis,” Int. J. Innovat. Comput. Inform. Control, vol. 10, no. 1, pp. 257–268, 2014. Search in Google Scholar
[11] O. Irsoy and C. Cardie, “Opinion mining with deep recurrent neural networks,” in: Proceedings of the 2014 Conference on Empirical Methods in Natural Language Processing (EMNLP), Conference Proceedings, 2014, pp. 720–728. 10.3115/v1/D14-1080Search in Google Scholar
[12] P. Liu, S. Joty, and H. Meng, “Fine-grained opinion mining with recurrent neural networks and word embeddings,” in: Proceedings of the 2015 Conference on Empirical Methods in Natural Language Processing, Conference Proceedings, 2015, pp. 1433–1443. 10.18653/v1/D15-1168Search in Google Scholar
[13] A. K. Goel, R. Chakraborty, M. Agarwal, M. D. Ansari, S. K. Gupta, and D. Garg, “Profit or loss: A long short term memory based model for the prediction of share price of DLF group in India,” in :143 2019 IEEE 9th International Conference on Advanced Computing (IACC), 2019, pp. 120–124. 10.1109/IACC48062.2019.8971601Search in Google Scholar
[14] K. K. Mohbey, G. Meena, S. Kumar, and K. Lokesh, “A CNN-LSTM-based hybrid deep learning approach for sentiment analysis on monkeypox tweets,” New Generation Comput., vol. 42, no. 1, pp. 89–107, 2024. 10.1007/s00354-023-00227-0Search in Google Scholar
[15] G. Wei, W. Chen, and N. Dongzhou, “Enhancing sustainable development through sentiment analysis of public digital resources: A PSO-LSTM approach,” J. Knowl. Econ., pp. 1–20, 2024, https://doi.org/10.1007/s13132-024-01998-7. Search in Google Scholar
[16] L. Bacco, L. Petrosino, D. Arganese, L. Vollero, M. Papi, and M. Merone, “Investigating stock prediction using LSTM networks and sentiment analysis of tweets under high uncertainty: A case study of North American and European banks,” IEEE Access, vol. 12, pp. 122239–122248, 2024, https://doi.org/10.1109/ACCESS.2024.3450311. Search in Google Scholar
[17] J. Zhou, Y. Guo, and Y. Ding, “Sentiment analysis of chinese movie reviews based on deep learning,” J. Shanghai Univ. (Natural Sci. Edn.), vol. 24, no. 5, pp. 703–712, 2018. Search in Google Scholar
[18] L. Song, S. Chen, Z. Meng, M. Sun, and X. Shang, “FMSA-SC: A fine-grained multimodal sentiment analysis dataset based on stock comment videos,” IEEE Trans. Multimedia, vol. 26, pp. 7294–7306, 2024, https://doi.org/10.1109/TMM.2024.3363641.Search in Google Scholar
[19] M. M. Danyal, S. S. Khan, M. Khan, S. Ullah, F. Mehmood, and I. Ali, “Proposing sentiment analysis model based on BERT and XLNet for movie reviews,” Multimedia Tools Appl., vol. 83, pp. 64315–64339, 2024, https://doi.org/10.1007/s11042-024-18156-5.Search in Google Scholar
[20] R. Song, W. Shi, W. Qin, X. Xue, and H. Jin, “Exploring passengers emotions and satisfaction: A comparative analysis of airport and railway station through online reviews,” Sustainability, vol. 16, no. 5, p. 2108, 2024. 10.3390/su16052108Search in Google Scholar
[21] N. Punetha and G. Jain, “Bayesian game model based unsupervised sentiment analysis of product reviews,” Expert Syst. Appl., vol. 214, p. 119128, 2023. 10.1016/j.eswa.2022.119128Search in Google Scholar
[22] M. F. Damholdt, V. Christina, A. Kryvous, C. V. Smedegaard, and J. Seibt, “What is in three words? exploring a three-word methodology for assessing impressions of a social robot encounter online and in real life,” Paladyn J. Behav. Robotics, vol. 10, no. 1, pp. 438–453, 2019. 10.1515/pjbr-2019-0034Search in Google Scholar
[23] L. Vasiliu, K. Cortis, R. McDermott, A. Kerr, A. Peters, M. Hesse, J. Hagemeyer, T. Belpaeme, J. McDonald, and R. Villing, “Casie computing affect and social intelligence for healthcare in an ethical and trustworthy manner,” Paladyn J. Behav. Robotics, vol. 12, no. 1, pp. 437–453, 2021. 10.1515/pjbr-2021-0026Search in Google Scholar
[24] Z. Henkel, K. Baugus, C. L. Bethel, and D. C. May, “User expectations of privacy in robot assisted therapy,” Paladyn J. Behav. Robotics, vol. 10, no. 1, pp. 140–159, 2019. 10.1515/pjbr-2019-0010Search in Google Scholar
[25] L. Nie, “A robot electronic device for multimodal emotional recognition of expressions,” Paladyn, vol. 15, no. 1, p. 20220127, 2024. Search in Google Scholar
[26] T. Hayashi, S. Watanabe, Y. Zhang, T. Toda, T. Hori, R. Astudillo, and K. Takeda, “Back-translation-style data augmentation for end-to-end ASR,” in: 2018 IEEE Spoken Language Technology Workshop (SLT), IEEE, Conference Proceedings, 2018, pp. 426–433. 10.1109/SLT.2018.8639619Search in Google Scholar
[27] L. Gomes, R. da Silva Torres, and M. L. CÃ?rtes, “BERT-and TF-IDF-based feature extraction for long-lived bug prediction in floss: A comparative study,” Inform. Software Tech., vol. 160, p. 107217, 2023. 10.1016/j.infsof.2023.107217Search in Google Scholar
[28] J. Teng, W. Kong, Q. Tian, and Z. Wang, “Text classification method based on LSTM-attention and cnn hybrid model,” Comput. Eng. Appl., vol. 57, no. 14, pp. 126–133, 2021. Search in Google Scholar
[29] D. Tang, B. Qin, and T. Liu, “Learning semantic representations of users and products for document level sentiment classification,” in: Proceedings of the 53rd annual meeting of the Association for Computational Linguistics and the 7th international joint conference on natural language processing (volume 1: long papers), Conference Proceedings, 2015, pp. 1014–1023. 10.3115/v1/P15-1098Search in Google Scholar
[30] T. Mikolov, K. Chen, G. Corrado, and J. Dean, Efficient estimation of word representations in vector space, 2013, arXiv: http://arXiv.org/abs/arXiv:1301.3781. Search in Google Scholar
[31] M. Schuster and K. K. Paliwal, “Bidirectional recurrent neural networks,” IEEE Trans. Signal Proces., vol. 45, no. 11, pp. 2673–2681, 1997. 10.1109/78.650093Search in Google Scholar
[32] S. M. Al-Selwi, M. F. Hassan, S. J. Abdulkadir, A. Muneer, E. H. Sumiea, A. Alqushaibi, et al., “RNN-LSTM: From applications to modeling techniques and beyond – systematic review,” J. King Saud Univ.-Comput. Inform. Sci., vol. 36, no. 5, p. 102068, 2024. https://doi.org/10.1016/j.jksuci.2024.102068.Search in Google Scholar
[33] S. Liu and Q. Liu, “A sentiment analysis model based on dynamic pre-training and stacked involutions,” J. Supercomput., vol. 80, pp. 1–23, 2024. 10.1007/s11227-024-06052-6Search in Google Scholar
[34] P. Rasappan, M. Premkumar, G. Sinha, and K. Chandrasekaran, “Transforming sentiment analysis for e-commerce product reviews: Hybrid deep learning model with an innovative term weighting and feature selection,” Inform. Proces. Manag., vol. 61, no. 3, p. 103654, 2024. 10.1016/j.ipm.2024.103654Search in Google Scholar
[35] A. Murtadha, B. Wen, S. Pan, J. Su, L. Ao, and Y. Liu, “BERT-ASC: Auxiliary-sentence construction for implicit aspect learning in sentiment analysis,” Expert Syst. Appl., vol. 258, p. 125195, 2024. 10.1016/j.eswa.2024.125195Search in Google Scholar
[36] M. Wankhade, A. C. S. Rao, and C. Kulkarni, “A survey on sentiment analysis methods, applications, and challenges,” Artif. Intel. Rev., vol. 55, no. 7, pp. 5731–5780, 2022. 10.1007/s10462-022-10144-1Search in Google Scholar
[37] F. Long, K. Zhou, and W. Ou, “Sentiment analysis of text based on bidirectional LSTM with multi-head attention,” IEEE Access, vol. 7, pp. 141960–141969, 2019. 10.1109/ACCESS.2019.2942614Search in Google Scholar
[38] M. J. Warrens, “Kappa coefficients for dichotomous-nominal classifications,” Adv. Data Anal. Classification, vol. 15, no. 1, pp. 193–208, 2021. 10.1007/s11634-020-00394-8Search in Google Scholar
[39] L. Han, X. Zeng, and L. Song, “A novel transfer learning based on ALBERT for malicious network traffic classification,” Int. J. Innovat. Comput. Inform. Control, vol. 16, no. 6, pp. 2103–2119, 2020. Search in Google Scholar
[40] M. Grootendorst, BERTopic: Neural topic modeling with a class-based TF-IDF procedure, 2022, arXiv: http://arXiv.org/abs/arXiv:2203.05794. Search in Google Scholar
© 2025 the author(s), published by De Gruyter
This work is licensed under the Creative Commons Attribution 4.0 International License.
Articles in the same Issue
- Research Articles
- Air fare sentiment via Backtranslation-CNN-BiLSTM and BERTopic
- Visual analysis of urban design and planning based on virtual reality technology
- Creative design of digital media art based on computer visual aids
- Deep learning-based novel aluminum furniture design style recognition and key technology research
- Research on pattern recognition of tourism consumer behavior based on fuzzy clustering analysis
- Driving business growth through digital transformation: Harnessing human–robot interaction in evolving supply chain management
- Applications of virtual reality technology on a 3D model based on a fuzzy mathematical model in an urban garden art and design setting
- Approximate logic dendritic neuron model classification based on improved DE algorithm
- Special Issue: Human Behavior and User Interfaces
- Study on the influence of biomechanical factors on emotional resonance of participants in red cultural experience activities
- Special Issue: State of the Art Human Action Recognition Systems
- Research on dance action recognition and health promotion technology based on embedded systems