“You don’t Pay Your Bills You Get No Protection”: A Trump Effect on NATO Members’ Military Expenditures?
-

 und
und

Abstract
Dispensing with the customary courteous diplomatic language, much of the 47th President’s rhetoric concerning the other NATO Allies echoes the valid US criticism that many of them freeride on the US protective defence umbrella without contributing their fair share to the costs of NATO’s collective defence. “You don’t pay your bills, you get no protection…”, he is quoted saying in a pre-election speech while is his Davos 2025 address, he mentioned, referring to the 2 % NATO guideline and the effect of his first presidential term, that “…most nations didn’t pay until I came along”. Using such statements as an impetus, the paper sets out to examine whether a Trump effect of his first presidency on NATO members’ military spending is empirically traceable. Results reported herein seem to offer evidence in favor of a tentative Trump effect inference.
1 Introduction
January 20, 2025, marked the beginning of Donald Trump’s second term in the White House’s Oval Office. In an interview a few weeks before his inauguration as the 47th President of the USA he stated that he would “absolutely” consider taking the United States out of the Alliance unless members are “treating us fairly”, that is if allies “pay their bills”.[1] He was referring to the lower defence burdens of most NATO members compared to the US defence budget. Indeed, in his first speech to an international audience at the Davos 2025 World Economic Forum Annual Meeting, he stressed that he intended to ask allies to increase their defence spending to 5 % of GDP.[2] Around a year earlier, in February 2024, before his official presidential nomination at the Republican National Convention in Milwaukee in July 2024, he is quoted saying during his speech at a campaign event in South Carolina in a rather blatant and diplomatically unbecoming manner that if “You don’t pay your bills, you get no protection. It’s very simple”.[3] In an interview, once again dispensing with the usual diplomatic tactfulness towards the other NATO allies, he was more explicit saying that in the cases of NATO members that did not contribute enough funds towards the Alliance’s collective defence he would “encourage” Russia “to do whatever the hell they want”, indicating that these Allies should not rely on US supporting them militarily.[4]
Even though such statements are plainly devoid of the expected typical courteous diplomatic language especially when addressed to allies, they nonetheless echo the long-standing, and for all intents and purposes valid US criticism that many of their allies freeride on the US protective defence umbrella without contributing their fair share to the costs of NATO’s collective defence. The issue of burden sharing between NATO’s members is by no means a new one. Hence the attention it has received in the relevant literature that has been expanding steadily over the years. Recent papers on the theme of burden sharing and interdependency among Western Allies include George and Sandler (2024, 2022), Kivimäki (2019), Pedersen, Ohrt, and Svendsen (2023), Kim and Sandler (2020), Mombelli (2024), Caruso and Di Domizio (2016), Sandler and Shimizu (2014), Zyla (2016), Becker (2017). Random examples of more vintage papers on this theme are those by Sandler and Hartley (2001), Hartley and Sandler (1999), Oneal (1990), Solomon (2004), Murdoch and Sandler (1984), Sandler and Forbes (1980). A recent systematic and comprehensive review of this literature can be found in Bogers, Beeres, and Bollen (2022) and in George and Sandler (2024, 2022). Consequently, for reasons of brevity, we refrain from engaging in a fundamentally similar discussion here. Moreover, the aim of the present paper is not to engage with the burden sharing issue per se.
During his first Presidential term, Trump did not spare his stern criticism towards other NATO members, especially towards major European countries, for not shouldering the costs of their defence. For example, during the 2018 Brussels NATO Summit it was reported that he gave something of an ultimatum regarding allies’ defence spending: “He said they must raise spending by January 2019, or the United States would go it alone”.[5] A statement very much contextually similar to the recent one cited above concerning a possible US withdrawal from NATO. In a similar vein, at the outset of that Summit he is quoted calling other NATO members delinquent in their defence expenditures and demanded that they should increase their defence budgets immediately,[6] while he has also asked European countries to buy American weapons to keep NATO strong.[7] Foreign sales are a very important source of revenues for the US defence industry, a substantial share of which are exports to other NATO members. For instance, during 2000–2024 US manufactured weapon systems imported by European NATO Allies accounted for almost a quarter of the US industry’s total exports[8] while, the revenues of the US defence industries are also affected by the US political cycles (Balestra and Caruso 2025) as well as by foreign interventions (Baronchelli and Caruso 2024).
In his Davos 2025 speech when calling for a 5 % of GDP allocation to defence, President Trump also referred to his first term in office and the effect it had on allies’ military spending: “I’m also going to ask all NATO nations to increase defence spending to 5 % of GDP, which is what it should have been years ago. It was only at 2 %, and most nations didn’t pay until I came along”.[9] In what follows we examine the impact exerted by the first Trump Presidency on NATO Allies’ military spending, trying to determine whether the bragged Trump effect cited above is in fact empirically traceable. The section that follows contains a brief overview of the empirical methodologies used to probe into the issue at hand. The findings are reported and discussed in sections three and four while section five concludes the paper.
2 A Bird’s Eye View of the Data and Methodologies
Two metrics are used to examine empirically whether a Trump effect is identifiable on NATO members’ allocations to defence: military spending as a share of GDP and equipment expenditure as a share in total defence spending. Data for the former are drawn from SIPRI’s database and for the latter from NATO. Since the 2014 NATO Wales Summit, both are the metrics used to determine the minimum thresholds that Alliance members should adhere to in order to meet their obligation to the quantity of resources allocated towards their military capabilities (inter alia: Kim, Sandler, and Shimizu 2024; Haesebrouck 2022; Blum and Potrafke 2020; Arvanitidis, Kollias, and Messis 2017). To probe into the Trump effect hypothesis, these two metrics are compared and analyzed during two Presidential periods: the Obama two term presidency (2009–2016) and the first Trump presidency. To allow for a possible hysteresis in a Trump effect, the first year of the Biden administration is included in the later period. Hence the second period in the analyses and empirical tests that follow covers the years 2017–2021. Albeit data is available for more years, we opt to have 2021 as the cut-off point in the series given the profound effect the full-scale Russian invasion of Ukraine in February 2022 had on NATO defence planning and budgets (inter alia: Buts, Christie, and Du Bois 2024; Magula, Rouland, and Zwack 2022). All current NATO members[10] are included in the empirical analyses conducted herein. However, due to data availability constraints in the case of the second metric, i.e. the share of equipment expenditure in total military spending, Montenegro, North Macedonia, Finland and Sweden, are not included in the sample and the estimations. Using boxplots, Figures 1 and 2 offer a bird’s eye view of the data during the two periods mentioned above. That is, the two Obama presidential terms (2009–2016) and the first Trump presidency wherein the first year of the Biden administration that followed is included (2017–2021) as previously pointed out.
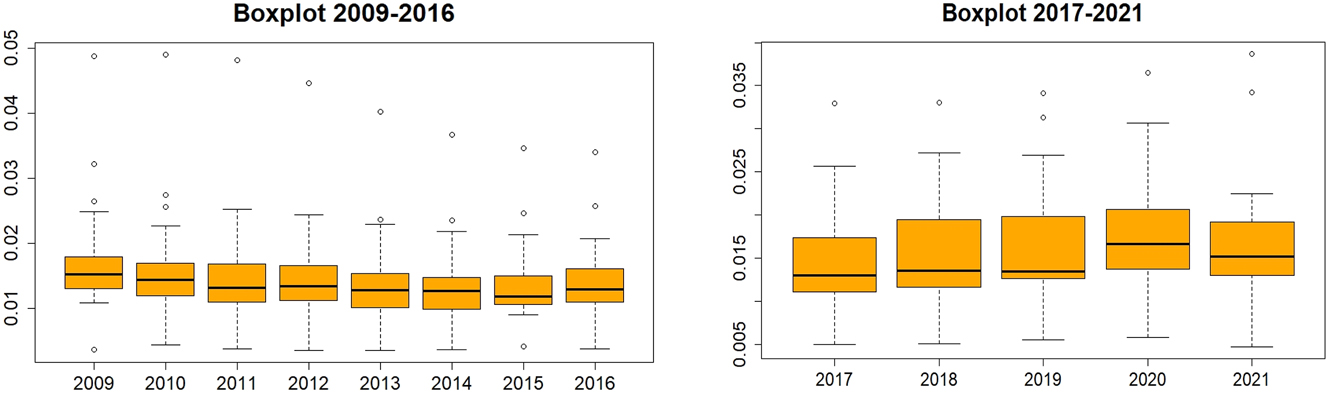
Military spending as a share of GDP during the Obama and trump Presidencies. The military spending as a share of GDP data is drawn from SIPRI’s military expenditure databaseen.
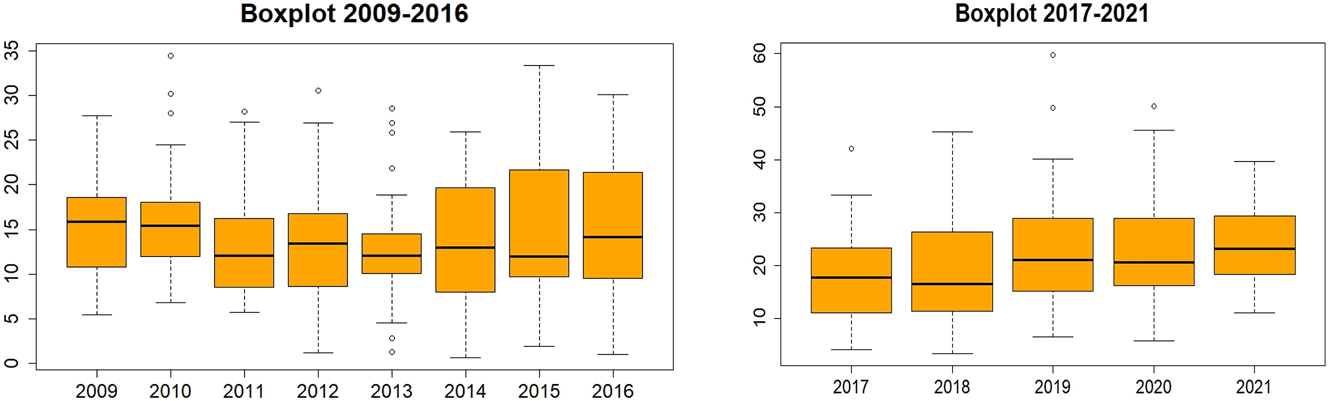
Defence equipment expenditure as a share of total military spending during the Obama and trump Presidencies. The defence equipment expenditure as a share of total military spending data is drawn from NATO’s databaseen.
For the first of the two metrics, the median value for the entire first period was 1.33 % and for the second period it was 1.43 % while the corresponding mean values of defence spending as a share of GDP were 1.49 % and 1.59 % respectively. During both periods the average defence burden of the USA was the highest among all the NATO members standing at 4.2 % during 2009–2016 and 3.4 % during 2017–2021. The second and third largest defence spending to GDP ratios were those of Greece (2.6 %) and the UK (2.3 %) during the Obama administration period. The average ratios for major European powers such as Germany, France, Italy and Spain were 1.2 %, 1.9 %, 1.4 %, 1.3 % respectively during the first period depicted in Figure 1. During the second period (2017–2021), the second and third largest defence spending to GDP ratios were those of Greece (3 %) and Türkiye (2.3 %) while the corresponding averages for the largest European economies were: Germany 1.3 %, UK 2 %, France 1.9 %, Italy 1.5 % and Spain 1.3 %.
Turning to the second metric, i.e. equipment expenditure as a share of total military spending[11] depicted in the boxplots of Figure 2, the median value for the entire first period was 13.48 % and for the second it was 19.8 % while the corresponding mean values were 14.45 % and 21.52 % respectively. During the two Obama presidencies period, the highest average share of equipment expenditure was France’s 27.3 % followed by the USA (25.5 %) and Türkiye (25.3 %). The corresponding averages for the major European powers were as follows: Germany 14.7 %, UK 22 %, Italy 11.9 % and Spain 13.3 %. During the second period depicted in Figure 2, Türkiye (32.5 %), Lithuania (32.4 %), Hungary (29.9 %), Slovakia (28.9 %) and the USA (28 %) emerge as the five NATO members with the highest shares in equipment expenditure, well above the 2014 Wales Summit target. The corresponding averages during 2017–2021 for the major European powers were: France 25.4 %, UK 24.1 %, Spain 21 %, Italy 19.7 % and Germany 14.6 %.
To probe into the issue at hand, a battery of methodologies is applied. The empirical analysis that follows in the next section starts with the application of a multidimensional scaling (MDS) approach to map the relative position of NATO members for each of the two metrics used herein. Briefly, MDS is a statistical technique used to visualize the similarity or dissimilarity between data points in a lower-dimensional space. In our case here, in terms of military spending as a share of GDP and equipment expenditure’s share in the NATO members’ annual defence budgets. The fundamental idea behind MDS is to represent objects as points in a Euclidean space such that the pairwise distances between them approximate their original dissimilarities. In this case study, we use “Classical MDS”, a type of MDS where the input is a matrix of Euclidean distances and eigenvalue decomposition is performed on a transformed distance matrix (Pawliczek and Dzwinel 2007).
The process of MDS begins with a distance or dissimilarity matrix, where each element represents the perceived difference between a pair of objects. In classical MDS, the dissimilarity matrix is converted into a squared distance matrix, followed by double-centering to compute a matrix suitable for eigen decomposition. The largest eigenvalues and their corresponding eigenvectors are then extracted to determine the coordinates in the lower-dimensional space (Pawliczek and Dzwinel 2007). In multidimensional scaling the subject of investigation is data space
where d ij represents the distances in the lower-dimensional space, and δ ij represents the original dissimilarities. A lower stress value indicates a better fit between the transformed and original data. The distances are calculated by Euclidian distance formula:
Interpreting stress values involves general guidelines, with lower values signifying better representations. A stress value below 0.05 is considered an excellent fit, between 0.05 and 0.1 is an acceptable fit, between 0.1 and 0.2 suggests a fair representation, and values above 0.2 indicate significant distortion, meaning the MDS solution may not be reliable (Naud 2006).
In practical applications, minimizing stress is a crucial step in MDS analysis. This is typically achieved through iterative optimization techniques. Despite its importance, stress value should not be the sole criterion for evaluating MDS solutions. Additional diagnostic tools, such as Shepard diagrams, which plot the relationship between original dissimilarities and distances in the MDS space, can provide deeper insights into the quality of the representation (Naud 2006). In summary, stress value serves as a key metric in MDS to assess the accuracy of lower-dimensional embeddings. A lower stress value is desirable as it indicates a more faithful representation of the original data relationships.
Then, as the second step in the empirical analysis we opt to employ the K-means clustering technique. Briefly, K-Means analysis is a widely used clustering technique that organizes data into distinct groups based on similarity. K-Means clustering is based on an algorithm that is used to partition data into k clusters, where each data point belongs to the cluster with the nearest mean. The algorithm aims to minimize the within-cluster variance, ensuring that points within the same cluster are more similar to each other than to points in other clusters (Patel et al. 2022). The K-Means process starts by selecting k initial cluster centroids, which can be randomly assigned or chosen using specific initialization methods, i.e. K-Means++. Each data point is assigned to the nearest centroid based on Euclidean distance, forming k clusters. Once all points are assigned, the centroids are recalculated as the mean of the points in each cluster. The process iterates, reassigning points to the closest centroid and updating centroids until convergence is reached. Convergence occurs when the cluster assignments no longer change, or a predefined stopping criterion is met. To improve stability, k-means is often run multiple times with different initializations, and the best result is chosen based on the lowest total within-cluster variance (Leonov et al. 2019).
Both MDS and K-Means serve critical roles in exploratory data analysis. MDS provides a meaningful low-dimensional representation of complex data relationships, aiding in pattern recognition and visualization. K-Means, on the other hand, is effective in segmenting data into meaningful groups, making it a popular choice for applications such as pattern recognition and anomaly detection. The two techniques can be used together, where MDS reduces dimensionality before applying k-Means clustering to enhance interpretability and efficiency.
As a final step in the empirical analysis, we opt to examine for the possible presence of structural breaks in the time series of the two variables for each NATO member. Structural breaks in economic variables are invariably the outcome of significant changes, domestic and/or external, that exert a statistically traceable effect on the variables concerned. Clearly, in the case of military expenditures these include geopolitical developments that impose rapid adjustments to such public outlays, an unexpected major change in the global or regional strategic environment, a major national security related event, a shift in defence policy due to a governmental change, a fiscal crisis such as the recent sovereign debt crisis that results in significant reductions and cut backs in public expenditures. Evidently, the Russian invasion of Ukraine as well as the shockwaves of the new Trump presidency are the type of geopolitical developments that leave an indelible mark and cause rapid adjustments to defence expenditures. Building on the methodology of Bai and Perron (1998, 2003), we employ a multiple structural break model that does not require any predefined breakpoints. Instead, potential break dates are estimated directly from the data. Each series can be modeled separately with m breaks (leading to m+ 1 distinct segments) using an equation of the form:
where Φτ is the military expenditure as a share of GDP (or equipment share in total defense spending) at time τ, j = 1,2,…,m+1,Ψj is the mean level of Φτ in the j-th segment, and ωτ captures any additional disturbances, including serial correlation or heteroscedasticity. The unknown breakpoints (T1,T2,…,Tm) are found by minimizing a chosen criterion (e.g., the Bayesian Information Criterion, BIC, or the residual sum of squares, RSS).
3 The Findings from MDS Mapping and K-Means Clustering
We begin the presentation and discussion of the findings yielded from the empirical analysis with the results from applying the MDS and K-Means methodologies to the two metrics used herein to probe into the question at hand. These are shown in Figure 3 in the case of the military expenditure to GDP ratio variable and in Figure 4 for the equipment percentage share in total military spending metric. In each figure the corresponding maps and clusters for each of the two periods are included. Starting with the results yielded by applying the MDS methodology to the two periods under comparison, the visual scrutiny of Figure 3 easily reveals a significant difference between the first (2009–2016) and second (2017–2021) periods. In the latter (Figure 3B), with the exception of USA, Greece, Turkey and Bulgaria, NATO members form a much denser cloud compared to the first period (Figure 3A) where their distribution in the MDS map is appreciably more disperse, while USA emerges as a notable outlier among all the alliance members. During this period, i.e. 2009–2016, the annual average defence burden for the USA stood at 4.2 % compared to an overall average for NATO of 1.5 %. During the second period, i.e. 2017–2021, the annual average of military spending as a percentage of GDP in the case of the USA was 3.4 % while the corresponding average for all NATO members had increased to 1.6 %. The K-Means procedure yields four different clusters depicted in Figure 3A with different colours. The two largest clusters (black and blue dots) are comprised of fifteen and nine NATO members respectively. Six countries make up a third cluster – the UK, France, Türkiye, Poland, Greece, Estonia, while the USA emerge as an outlier in a single-country cluster. The value of the within-cluster sum of squares (WSS = 27.58895) statistic is low and indicates that the data points are nearer to their cluster centroids, suggesting that the clusters are compact and well-formed. Around 88.9 % of the total data variability is explained by the clusters that the K-means method yields. For the second period (2017–2021), the number of countries that are comprised in the different clusters slightly changes but the overall picture that emerges is that of denser clustering. The USA and Greece form a cluster of two and so do Belgium and Luxemburg. The rest of NATO members are grouped in two large clusters (red and blue dots). The WSS value of 21.11702 is again low indicating that countries are closer to their cluster centroids and hence pointing to more compact and well-formed clusters while 86.4 % of the total data variability is explained by the clusters from the K-means method.
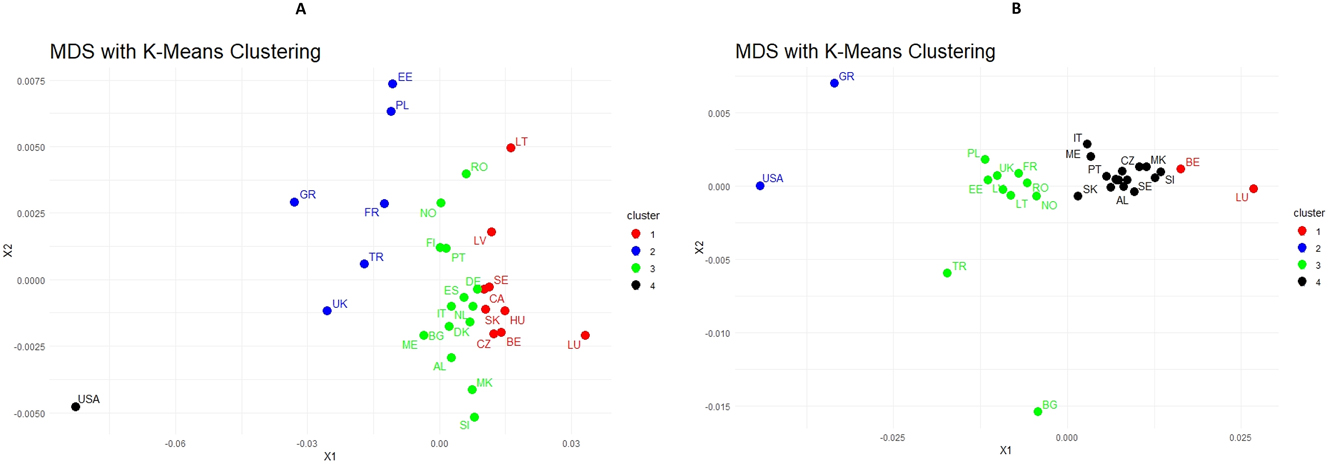
MDS maps and K-Means clustering of military spending as a share of GDP during the Obama and Trump Presidencies.
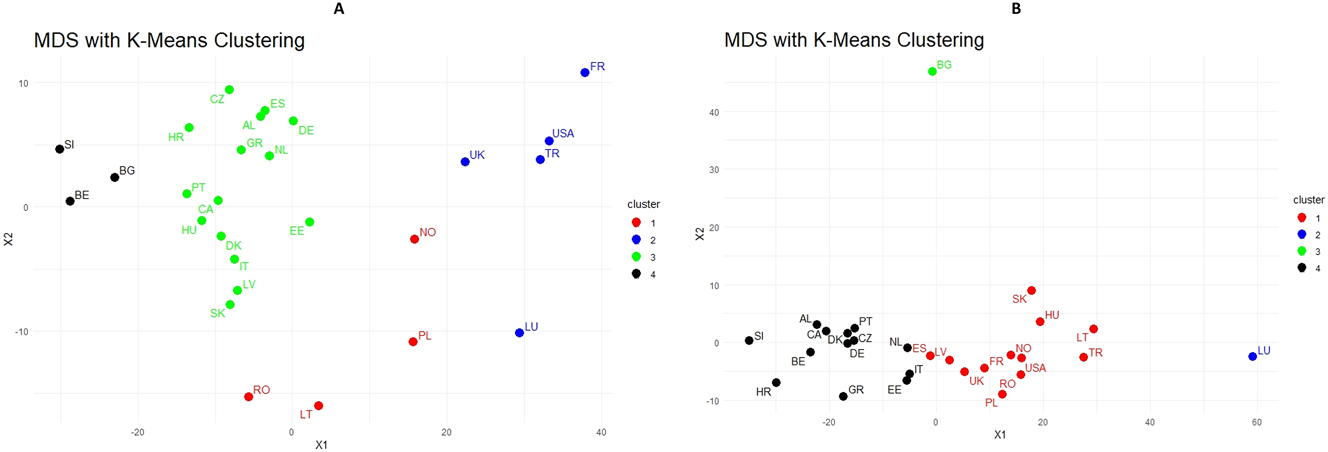
MDS maps and K-Means clustering of defence equipment expenditure as a share of total military spending during the Obama and Trump Presidencies.
Overall, on the basis of the MDS mapping and K-Means clustering, it appears that in the second period (the Trump Presidency plus the first year of the Biden administration) a noteworthy change has occurred in terms of the military spending as a share of GDP metric and allies seem to have converged given the clustering density observed. As mentioned in the previous section, the median value for the first period was 1.33 % while that for the second it was 1.43 %. The corresponding mean values were 1.49 % and 1.59 %. Although this observable change in the MDS maps in Figure 3 cannot be causally attributed to the Trump Presidency, it nonetheless seems to suggest the presence of a mild Trump effect.
A broadly similar picture emerges from the visual scrutiny of Figure 4 where the MDS maps and K-Means clustering of equipment expenditure as a share of total military spending are shown. During the first period examined (Figure 4A), that is the Obama two term presidency years (2009–2016), a wide dispersion appears to be the case. Bulgaria, Belgium and Slovenia form a cluster of three (black dots), Poland, Norway, Lithuania and Romania a cluster of four (red dots) and the USA, France, the UK, Luxemburg and Türkiye a cluster of five (blue dots) while the rest are group in the largest cluster (green dots) of Figure 4A. Except for two outliers, Bulgaria and Luxemburg, in the second period (2017–2021) depicted in Figure 4B, a significant reduction in the dispersion is evident with a noticeably stronger and denser clustering. During the Obama administration years, the median value for the equipment expenditure as a share of total military spending variable was 13.48 % (mean value of 14.45 %) while in the second period the median share of equipment expenditure in total defence spending increased to 19.8 % (mean value of 21.52 %). Just as in the case of the military spending as a share of GDP metric, the MDS mapping procedure presented in Figures 4A and 4B, yields results that seem to be pointing to a Trump effect being present and detectible also in the case of the defence equipment expenditure share in total military spending.
4 “Trump Effect” Related Structural breaks(?)
In this section, the results from estimating the Bai and Perron (1998, 2003) test procedure for the presence of structural breaks in the series involved are presented and discussed. The test is estimated for the entire period, i.e. 2009–2021, for both variables under scrutiny. As pointed out in the introduction, this period includes the two Obama presidential terms (2009–2016) and the first Trump presidency (2017–2020) and also includes 2021, i.e. the first year of the Biden administration to allow for a possible hysteresis in the Trump effect hypothesis examined here.
We start with the results for the military expenditure-to-GDP ratio. These are presented in Table 1. Expectedly, the findings from estimating the Bai and Perron (1998, 2003) test are not uniform. Indeed, in the case of Portugal and Croatia the test fails to identify a breakpoint in the series. This indicates that during the period examined, their defence burden series did not exhibit any statistically traceable shifts. A single break point in the series is detected in the case of Bulgaria (in 2018), Hungary (in 2018), Luxemburg (in 2016) and Norway (in 2016). For the rest of the NATO members, the two or more break points are established. Worth mentioning in that in the case of Belgium, the Czech Republic, Italy, and the UK the Bai and Perron (1998, 2003) test identifies four distinct breakpoints, suggesting several significant turning points in the defence burden series. Clearly, both country specific and external factors may be cited as explanatory determinants of each break point identified. For example, the acute fiscal constraints generated by the sovereign debt crisis that afflicted several European countries in 2009 and 2010 offer a strong explanatory basis for the break points identified around those years. In fact, twelve countries record a breakpoint in 2010, a finding that can be associated with the debt crisis and the significant cutbacks in public spending at the time. For the purposes of the investigation conducted herein, it can be observed that 2019 emerges as the year where the most breakpoints are identified by the estimations. In fourteen countries a breakpoint is identified in 2019, the third year of the first Trump Presidency. As noted in the introduction, during the 2018 Brussels NATO Summit it was reported that Donald Trump gave something of an ultimatum regarding allies’ military expenditures: “He said they must raise spending by January 2019, or the United States would go it alone”.[12] If the breakpoints identified for 2018 in the case of seven countries are added, then in these two years (i.e. 2018 and 2019) a total of 21 countries exhibit a break point in their respective defence burden series. Major European countries are included in this group, such as for instance Germany, UK, France, Italy, Spain, Poland, the Netherlands. It should be stressed that the results of the Bai and Perron (1998, 2003) test estimations should by no means be interpreted as indicating a causal nexus between the pressure exerted by Trump and the break points identified in the military expenditures series for 2018 and 2019. Nonetheless, taken in combination with the findings from the MDS and K-Means analyses conducted in the previous section, the structural breaks identified seem to be pointing to the presence of a Trump effect on NATO Allies’ defence budgets.
Structural breakpoints for military expenditure as a percentage of GDP series.
| Number of breaks | Break years | Number of breaks | Break years | ||
|---|---|---|---|---|---|
| Albania | 3 | 2012, 2014, 2018 | Luxemburg | 1 | 2016 |
| Belgium | 4 | 2010, 2012, 2014, 2019 | Montenegro | 2 | 2012, 2019 |
| Bulgaria | 1 | 2018 | Netherlands | 2 | 2011, 2018 |
| Canada | 2 | 2011, 2016 | North Macedonia | 3 | 2010, 2014, 2018 |
| Croatia | 0 | – | Norway | 1 | 2016 |
| Czechia | 4 | 2010, 2013, 2017, 2019 | Poland | 2 | 2013, 2019 |
| Denmark | 2 | 2012, 2017 | Portugal | 0 | – |
| Estonia | 3 | 2011, 2014, 2019 | Romania | 3 | 2013, 2016, 2019 |
| Finland | 2 | 2013, 2016 | Slovakia | 2 | 2010, 2018 |
| France | 2 | 2010, 2019 | Slovenia | 3 | 2010, 2012, 2019 |
| Germany | 3 | 2010, 2013, 2018 | Spain | 2 | 2012, 2019 |
| Greece | 2 | 2010, 2019 | Sweden | 3 | 2010, 2014, 2019 |
| Hungary | 1 | 2018 | Turkey | 3 | 2010, 2017, 2019 |
| Italy | 4 | 2011, 2013, 2015, 2019 | UK | 4 | 2010, 2012, 2014, 2019 |
| Latvia | 3 | 2010, 2015, 2017 | USA | 2 | 2011, 2013 |
| Lithuania | 2 | 2015, 2017 |
The findings from estimating the Bai and Perron (1998, 2003) test for the second variable are presented in Table 2.[13] Just as before, the results are not uniform. In the case of Bulgaria and Greece no break point year is identified. In most countries the test reveals one or two break points in their respective equipment expenditure as a share of total military spending series. Three breaks are found in the case of Albania, Belgium, Canada, Norway, and Romania, while in the case of the Netherlands and the USA the Bai and Perron (1998, 2003) test estimation yields four breakpoints. Most of the break points traced by the estimations occur in 2018. A total of eleven countries exhibit a break in the equipment expenditure as a share of total military spending series this year and another five in 2019. Germany, the Netherlands, France and the UK are among the European members of NATO for which a break is traced by the estimations in these two years (Table 2). Overall, the results of the structural break point analysis are in line with the findings yielded by the MDS and K-Means methodologies presented in the previous section. Just as in the case of the defence burden variable, many of the break points identified occur during these two years of the first Trump Presidency, offering additional evidence in favor of Trump effect, albeit this should not necessarily be interpreted as evidence of a causal nexus.
Structural breakpoints for the defence equipment expenditure as a share of total military spending series.
| Number of breaks | Break years | Number of breaks | Break years | ||
|---|---|---|---|---|---|
| Albania | 3 | 2012, 2014, 2018 | Lithuania | 1 | 2015 |
| Belgium | 3 | 2011, 2017, 2019 | Luxemburg | 1 | 2016 |
| Bulgaria | 0 | – | Netherlands | 4 | 2010, 2013, 2015, 2018 |
| Canada | 3 | 2010, 2012, 2018 | Norway | 3 | 2013, 2015, 2018 |
| Croatia | 1 | 2019 | Poland | 1 | 2014 |
| Czech Republic | 2 | 2012, 2018 | Portugal | 1 | 2017 |
| Denmark | 1 | 2018 | Romania | 3 | 2013, 2016, 2018 |
| Estonia | 1 | 2019 | Slovak Republic | 2 | 2014, 2018 |
| France | 2 | 2013, 2019 | Slovenia | 2 | 2010, 2017 |
| Germany | 2 | 2012, 2018 | Spain | 1 | 2016 |
| Greece | 0 | – | Turkey | 1 | 2016 |
| Hungary | 1 | 2018 | UK | 1 | 2019 |
| Italy | 1 | 2015 | USA | 4 | 2010, 2012, 2016, 2018 |
| Latvia | 1 | 2017 |
5 Concluding Remarks
From its start, the second Trump Presidency seems to have upended long-standing relationships between the US and their allies. Although it dispenses with the customary diplomatic courtesy, much of the 47th President’s rhetoric concerning the other NATO Allies echoes the valid US criticism that many of them freeride on the US protective defence umbrella without contributing their fair share to the costs of NATO’s collective defence. “You don’t pay your bills, you get no protection…”,[14] he is quoted saying in a pre-election campaign speech, while in his Davos 2025 address referring to his first presidential term and its effect on allies’ military spending, he observed, regarding NATO’s 2 % of GDP guideline, that “…most nations didn’t pay until I came along”.[15] The present paper set out to examine empirically whether the bragged Trump effect on NATO Allies’ military spending is empirically traceable. Two variables were used in the empirical analysis: defence expenditure as a share of GDP, and equipment expenditure as a share of total military spending. Three methodologies were applied to probe into the issue at hand. A multidimensional scaling (MDS) approach was used to map the relative position of NATO members for each of the two variables; then the K-means clustering technique was applied and finally the Bai and Perron (1998, 2003) test was estimated to examine for the presence of structural breaks in the series that could be associated with a Trump effect. Albeit no firm and conclusive inference on a causal nexus is possible, on the whole, the reported results seem to tentatively support the hypothesis of the presence of a Trump effect on NATO Allies’ defence budgets during his first presidential term.
Acknowledgements
The constructive comments by a referee are gratefully acknowledged by the authors. The usual disclaimer applies.
References
Arvanitidis, P., C. Kollias, and P. Messis. 2017. “Converging Allies?” Peace Economics, Peace Science and Public Policy 23 (2): 1–15. https://doi.org/10.1515/peps-2016-0044.Suche in Google Scholar
Bai, J., and P. Perron. 1998. “Estimating and Testing Linear Models with Multiple Structural Changes.” Econometrica 66 (1): 47–78, https://doi.org/10.2307/2998540.Suche in Google Scholar
Bai, J., and P. Perron. 2003. “Computation and Analysis of Multiple Structural Change Models.” Journal of Applied Econometrics 18 (1): 1–22. https://doi.org/10.1002/jae.659.Suche in Google Scholar
Balestra, A., and R. Caruso. 2025. “The Impact of US Elections on US Defense Industry: Firm-Level Evidence from 1996 to 2022.” Defence and Peace Economics. https://doi.org/10.1080/10242694.2025.2474757.Suche in Google Scholar
Baronchelli, A., and R. Caruso. 2024. “Did CIA Interventions Increase US Arms Exports? Evidence from the Cold War (1962–1989).” Economics Letters 238: 111672. https://doi.org/10.1016/j.econlet.2024.111672.Suche in Google Scholar
Becker, J. 2017. “The Correlates of Transatlantic Burden Sharing: Revisiting the Agenda for Theoretical and Policy Analysis.” Defense and Security Analysis 33 (2): 131–52.10.1080/14751798.2017.1311039Suche in Google Scholar
Blum, J., and N. Potrafke. 2020. “Does a Change of Government Influence Compliance with International Agreements? Empirical Evidence for the NATO Two Percent Target.” Defence and Peace Economics 31 (7): 743–61. https://doi.org/10.1080/10242694.2019.1575141.Suche in Google Scholar
Bogers, M., R. Beeres, and M. Bollen. 2022. “NATO Burden Sharing Research along Three Paradigms.” Defence and Peace Economics 33 (5): 534–47. https://doi.org/10.1080/10242694.2020.1819135.Suche in Google Scholar
Buts, C., E. H. Christie, and C. Du Bois. 2024. “Exploring the Speed of Change: European Defence Budgets in an Age of Danger.” Defense and Security Analysis 40 (3): 319–40. https://doi.org/10.1080/14751798.2024.2361513.Suche in Google Scholar
Caruso, R., and M. Di Domizio. 2016. “Interdependence between US and European Military Spending: A Panel Cointegration Analysis (1988–2013).” Applied Economics Letters 23 (4): 302–5. https://doi.org/10.1080/13504851.2015.1071466.Suche in Google Scholar
George, J., and T. Sandler. 2022. “NATO Defense Demand, Free Riding, and the Russo-Ukrainian War in 2022.” Journal of Industrial and Business Economics 49: 783–806. https://doi.org/10.1007/s40812-022-00228-y.Suche in Google Scholar
George, J., and T. Sandler. 2024. “A Spatial Analysis of NATO Burden Sharing at the Operational Levels.” Kyklos 77 (4): 1026–47. https://doi.org/10.1111/kykl.12401.Suche in Google Scholar
Haesebrouck, T. 2022. “NATO Burden Sharing after the Wales Summit: A Generalized Set Qualitative Analysis.” Defence and Peace Economics 33 (6): 637–54. https://doi.org/10.1080/10242694.2021.1928435.Suche in Google Scholar
Hartley, K., and T. Sandler. 1999. “NATO Burden-Sharing: Past and Future.” Journal of Peace Research 36 (6): 665–80. https://doi.org/10.1177/0022343399036006004.Suche in Google Scholar
Kim, W., T. Sandler, and H. Shimizu. 2024. “An Expanded Investigation of Alliance Security Free Riding.” Global Policy 15 (4): 570–82. https://doi.org/10.1111/1758-5899.13385.Suche in Google Scholar
Kim, W., and T. Sandler. 2020. “NATO at 70: Pledges, Free Riding, and Benefit-Burden Concordance.” Defence and Peace Economics 31 (4): 400–13. https://doi.org/10.1080/10242694.2019.1640937.Suche in Google Scholar
Kivimäki, T. 2019. “Power, Contribution and Dependence in NATO Burden Sharing.” European Security 28 (1): 66–84. https://doi.org/10.1080/09662839.2019.1578750.Suche in Google Scholar
Leonov, P., V. Suyts, O. Kotelyanets, and N. Ivanov. 2019. “K-means Method as a Tool of Big Data Analysis in Risk-Oriented Audit.” In Big Data Innovations And Applications, edited by M. Younas, I. Awan, and S. Benbernou, 206–16. Cham, Switzerland: Springer.10.1007/978-3-030-27355-2_16Suche in Google Scholar
Magula, J., M. Rouland, and P. Zwack. 2022. “NATO and Russia: Defense and Deterrence in a Time of Conflict.” Defence Studies 22 (3): 502–9. https://doi.org/10.1080/14702436.2022.2082957.Suche in Google Scholar
Mombelli, S. 2024. “Defense Burden Sharing and Military Cooperation in the EU27: A Descriptive Analysis (2002–2023).” Peace Economics, Peace Science and Public Policy 30 (4): 423–53. https://doi.org/10.1515/peps-2024-0050.Suche in Google Scholar
Murdoch, J., and T. Sandler. 1984. “Complementarity, Free Riding, and the Military Expenditures of NATO Allies.” Journal of Public Economics 25 (1–2): 83–101. https://doi.org/10.1016/0047-2727(84)90045-8.Suche in Google Scholar
Naud, A. 2006. “An Accurate MDS-Based Algorithm for the Visualization of Large Multidimensional Datasets.” In Artificial Intelligence and Soft Computing – ICAISC 2006, 643–52. Berlin, Heidelberg: Springer.10.1007/11785231_67Suche in Google Scholar
Oneal, J. R. 1990. “The Theory of Collective Action and Burden-Sharing in NATO.” International Organization 44 (3): 379–402. https://doi.org/10.1017/s0020818300035335.Suche in Google Scholar
Patel, S. S., S. S. Patel, N. Kumar, N. Kumar, J. Aswathy, J. Aswathy, S. K. Vaddadi, et al.. 2022. “K-Means Algorithm: An Unsupervised Clustering Approach Using Various Similarity/Dissimilarity Measures.” In Intelligent Sustainable Systems, edited by J. Raj, R. Palanisamy, I. Perikos, and Y. Shi, 805–13. Singapore: Springer.10.1007/978-981-16-2422-3_63Suche in Google Scholar
Pawliczek, P., and W. Dzwinel. 2007. “Visual Analysis of Multidimensional Data Using Fast MDS Algorithm.” Photonics Applications in Astronomy, Communications, Industry, and High-Energy Physics Experiments 6937 (2M): 755–65.Suche in Google Scholar
Pedersen, R., A. Ohrt, and G. Svendsen. 2023. “Free Riding in NATO after the Rise of Russia: Cost Sharing, Free Riding and Selective Incentives in NATO from 2009 to 2019.” Journal of Transatlantic Studies 21 (1): 54–72. https://doi.org/10.1057/s42738-023-00109-9.Suche in Google Scholar
Sandler, T., and J. F. Forbes. 1980. “Burden Sharing, Strategy, and the Design of NATO.” Economic Inquiry 18 (3): 425–44. https://doi.org/10.1111/j.1465-7295.1980.tb00588.x.Suche in Google Scholar
Sandler, T., and K. Hartley. 2001. “Economics of Alliances: The Lessons for Collective Action.” Journal of Economic Literature 39 (3): 869–96. https://doi.org/10.1257/jel.39.3.869.Suche in Google Scholar
Sandler, T., and H. Shimizu. 2014. “NATO Burden-Sharing 1999–2010: An Altered Alliance.” Foreign Policy Analysis 10 (1): 43–60. https://doi.org/10.1111/j.1743-8594.2012.00192.x.Suche in Google Scholar
Solomon, B. 2004. “NATO Burden Sharing Revisited.” Defence and Peace Economics 15 (3): 251–8. https://doi.org/10.1080/10242690320001608917.Suche in Google Scholar
Zyla, B. 2016. “Who Is Keeping the Peace and Who Is Free-Riding? NATO Middle Powers and Burden Sharing, 1995–2001.” International Politics 53 (3): 303–23. https://doi.org/10.1057/ip.2016.2.Suche in Google Scholar
© 2025 the author(s), published by De Gruyter, Berlin/Boston
This work is licensed under the Creative Commons Attribution 4.0 International License.
Artikel in diesem Heft
- Frontmatter
- Survey or Review
- University-Government-Foundation Collaboration on Arms Control and Security Policy in the United States from Truman to Trump
- Research Articles
- “You don’t Pay Your Bills You Get No Protection”: A Trump Effect on NATO Members’ Military Expenditures?
- Online Interest in Radical Islam and Terrorist Attacks
- The Red Sea Conflict and Market Reactions: Examining the Role of Military Strength in Financial Markets
- How Inequality and Repression Affect the Link Between Food Insecurity and Urban Social Disorder