How Inequality and Repression Affect the Link Between Food Insecurity and Urban Social Disorder
-
Syed Mansoob Murshed
 ,
Scott Gates
,
Scott Gates

Abstract
We examine the relationship between food insecurity and urban social disorder, featuring the degree of inequality and levels of governmental repression. We develop a formal theoretical model, and our empirical results suggest that food price volatility contributes significantly to conflict events as measured by the PRIO Urban Social Disorder data. We measure vertical inequality using the V-DEM egalitarian index, which is negatively significant; greater inequality sparks unrest. Inter-group horizontal inequality is also statistically significantly related to the risk of food riots. Government transfers are weakly associated with reducing conflict incidence. Governmental repression, in contrast, is associated with food riots across our estimations.
Food shortages and food price increases have sparked social unrest throughout human history. Rising food prices lower the real income of consumers, who are less able to purchase a fixed food basket. Making matters worse, the demand for basic foodstuffs is notoriously inelastic. Those affected most are consumers (not net producers) of food, particularly low-income households, but also middle-class consumers who witness an erosion of their living standards. Clearly, poorer nations are more at risk of conflict, following food price increases. Pronounced examples include the Arab Spring in 2011, the revolutions in Europe in 1848, and notably the French revolution of 1789, which followed a poor harvest.
Yet, rising food prices are not the sole cause of conflict, notwithstanding these famous examples. History is replete with instances of food price increases following poor harvests that did not lead to major riots or revolutions. Countervailing actions by the state can mitigate the effects of food price increases. Indeed, the association between food insecurity[1] or food price volatility and social unrest is indirect; the mediating effect of a variety of other factors need also to be taken into account. It is indirect because a heightened sense of food insecurity brought about by rising or volatile food prices feeds into other fundamental causes of conflict, usually pre-existing grievances related to discrimination, inequality, and state repression. Thus, for food price spikes to cause conflict they must fuel existing grievances against the state or other groups within the state, which includes grievances related to mismanagement and state failure. The inability of the state to manage, suppress or placate these grievances may be another contributory factor. Another point of note is that food prices have become increasingly globalized, and the transmission of international shocks to domestic prices has been rapid in recent years.
The adverse effects of rising food insecurity are likely to be more acute in poorer countries with a poor record of economic growth and where poverty is widespread. Furthermore, food insecurity is more likely to lead to political violence, whether in the form of protest or riots, in more unequal societies and where mitigating policies are not pursued by the government.[2] Thus, a repressive political system along with the extent of inequality is important. Food insecurity ultimately can act as a tipping point that turns relative deprivation, grievances, as well as inter-group and inter-household inequality into conflict in the form of protest and/or war in the presence of weak state capacity.
The current, cross-country empirical literature does not incorporate these factors of inequality and repression into their empirical strategy.[3] Therein lies the innovation of our paper. We account for the roles played by economic inequality and government policies. We organize our article as follows. First, is a brief overview of previous research on factors affecting food insecurity and political violence. Next, we present a formal model of the strategic interactions played between a government and a dissident population affected by food price increases. We then outline our empirical strategy for linking food insecurity and urban conflict. Our empirical findings are presented in the next section, and the final section concludes.
1 Food Insecurity and Urban Social Disorder, Accounting for Destabilizing Factors
This article is about the impact of food insecurity on urban social disorder. Our focus is on urban social disorder in particular. A growing number of scholars have examined this relationship in cross-national empirical research (Brinkman and Hendrix 2011; Arezki and Brückner 2011; Bellemare 2014; Smith 2014; Brancati 2014; Hendrix and Haggard 2015; Weinberg and Bakker 2014; Natalini et al. 2015; Buhaug et al. 2015; Jones et al. 2017; Bush and Martiniello 2017; Murshed et al. 2018).[4] Their research has contributed much, but they do not bring together important factors that foment the relationship between food security and urban social disorder: the role of inequality (inter-group and inter-household); and repression, although it should be noted that recent research does account for state repression.
This body of research has featured urban violence or particular violent events and not the broader aspects of violence involving an insurgent rebellion. Indeed, food insecurity is much more likely to manifest itself in protest and urban social disorder rather than outright civil war, and chiefly in urban areas. Food consumers, not producers, should be expected to protest. In other words, civil conflict and certainly civil war tend to be rural in nature and should not be expected to be related to food insecurity. Food insecurity is unlikely to cause civil war.[5]
Newman (2018) correlates a media generated data base on specific food riot with a number of factors, but the empirical results are based solely on bivariate correlations. A recent study closely resembling ours is Buhaug and Smith 2020, which finds that urban “food riots” (using the PRIO USD data on urban unrest (Bahgat, Buhaug, and Urdal 2018)) result from frustration over increased living costs and general grievances, and not as a result of hunger or food supply insecurity. Their analysis features the mitigating role played by different regime types on the relationship between food insecurity and urban unrest. They find that autocratic regimes experience significantly more unrest than democratic regimes. Unlike us, they do not address the aggravating effects of inequality, nor do they develop a formal model.
Rudolfsen (2023) examines the impact of a food insecurity index on urban unrest in Johannesburg, South Africa, controlling for, and interacting, organizational networks of individuals. Another similar recent study is Rudolfsen (2021), which examines the conditions in which increasing food prices lead to food riots. She features the role of state repression as the primary fuel for grievances and motivation for overcoming collective action problems to voice discontent. Her analysis draws on SCAD for violent events and V-dem for aspects of governance and repression. She does not account for inequality (vertical or horizontal). She also does not develop a formal model. We build on these two excellent studies, Buhaug and Smith 2020; Rudolfsen 2021, by examining how these factors, repression and inequality, affect the relationship between food price rises and urban riots.
In a different context, d’Agostino et al. (2024) find that increased battle related deaths increased food insecurity in 29 African countries between 2012 and 2022. Furthermore, Koren (2018) that increased crop yields intensify conflict in Africa. Caruso and Echevarria-Coco (2023) present a guns-butter tradeoff in a contested sector where the economy also produces an uncontested good. Their theoretical proposition that the acquisition depends positively on the price of butter and negatively on the price of ice cream, the uncontested good. This is borne out by empirical analysis for sub-Saharan African countries for the 1980–2017 period when the rising manufactured goods prices, an uncontested goof, are negatively associated with arms imports and military expenditure.
2 A Model of Food Price Riots
Most work on food price riots is purely empirical. Theory is based on conjecture. In the following section, we develop a formal model explicating the relationship between repression, inequality, price rises, and riots. The mathematical relationships shed light on the dynamic processes at work determining when and where we would expect to see food price riots.
The state has a choice between assuaging dissent via transfers, which could include food subsidies, and utilizing force to suppress dissidence. We postulate that the state behaves akin to a risk-neutral unitary actor, albeit with centrifugal and centripetal tendencies when it comes to the trade-off between using force or buying peace. The expected utility of the state is given in terms of pay-offs in the two states of peace and conflict:
where:
The superscripts P and C refer to conditions which are more peaceful and conflictive, with probabilities π and 1–π respectively. G P and G C refer to exogenous payoffs to the government in the two states. For the government (and the society it represents), utility is derived from general public consumption (Y G ) less security expenditure (A) against food riots. Security expenditure can be used in two ways: a component (F G ) devoted to repressing (via policing and surveillance) dissent (or more specifically food riots) and another element T, which is a transfer to the public that serves to assuage their grievances. For food riots, food price subsidies could be the form of transfer. In Egypt, food subsidies have been found to mitigate anti-government insurgencies (Fielding and Shortland 2010). Transfer payments or food stamp programs would constitute less market distorting policy alternatives. Additionally, the parameter, μ, represents an autonomous shift towards plutocratic or autocratic tendencies towards suppressing dissent. Observe that there is a trade-off based on the two policy alternatives towards the dissident public: repression (sticks) and transfers (carrots).
The probability of peace, π, increases with the parameters, a and e, which correspond to mixed strategies of accommodation and aggression pursued by the two sides to the game, the government and the dissident public, respectively. For the government side, for example, a is defined in (2) as the ratio of transfers (T) and forcefully suppressing dissent (F G ), with the numerator raising the chances of peace and the denominator reducing it. An increase in the ratio, a, implies a rise in relative peaceful behavior. We postulate a rise in heavy-handed behavior towards rioting (F G , μ), has only a limited deterrent effect; it actually increases violence and the sense of grievance. Note that in two-dimensional strategy space, the strategies for both government (a) and public (e) are defined in terms of relatively peaceful behavior, so that a and e as defined raise the probability of peace, π. C refers to the cost of undertaking a by the state, C a > 0. These costs consist of pecuniary and non-pecuniary elements; the first because of the cost of distortionary taxation to finance security as well as the market distortions created by food price subsidies; the latter because accommodating a dissident public entails a political cost by alienating those opposed to the policies adopted. Riots occur only in the conflictive state, and the Nash equilibrium to the game between the two sides occurs along a continuum of peaceful actions by both sides. Equilibria with low levels of peace chosen by both sides are conflictive, enhancing the risk of rioting.
It is instructive, therefore, to examine the government’s strategic variable, which is a mix of accommodation (T) and conflict (F G ). Totally differentiating, a, in (2):
All the partial derivatives in (3) are positive. The security budget (A) can be utilized either to increase transfers to the dissident public or fight them. Therein lies a trade-off; thus, the term in square brackets in (3) is ambiguous in sign. Also, the last term on the right-hand side of (3) indicates an autonomous shift towards greater suppression, implying less peaceful behavior.
The government side maximizes (1) with respect to a:
Essentially, this means that the government equates the marginal utility of its strategic action (a) on the left-hand side of (4) to its marginal cost on the right-hand side.
3 Dissident Group (R)
We need to distinguish between individual motivation to behave in accordance with a dissident public, and the alienated public’s dynamics leading to a clash with the state. Dissidents represent individuals who identify with poor households adversely affected by food price increases, but in the presence of pre-existing grievances experienced by identity-based groups that experience relative economic and political weaknesses relative to the dominant or privileged group (Murshed and Gates 2005; Cederman et al. 2013).
As far as individuals are concerned, following Akerlof and Kranton (2000), we postulate that individuals directly obtain utility from their identity, and the behavior demanded by that sense of belonging. Thus, an individual member (r) of the dissident group derives utility (U r ) from identity related actions in the following manner (other arguments in the utility function such as consumption are ignored):
where
Here the parameter s refers to self-identity or principal identity-based actions including protests and rioting, which yield utility (U s ) from actions (s r ), as well as utility (U o ) from other identity-based actions, k r . Other identity-based actions may refer to activities representing the individual as a member of a separate or larger group. An example could be support for the national football/soccer team, which transcends membership of the dissident group.
These two identity-based behaviors enter the individual’s utility in an additive and separable fashion. An individual, therefore, is allowed to have a complex multiple identity (Sen 2008), and corresponding to these are additive separable inputs into his utility function, which is an innovation of the model. The individual not only derives utility from a vector of his own actions (s r ), but also similar actions of other like-minded individuals belonging to his minority group (s j ) (or identity-based groups), and above all his own identity or self-image (I r ), which in turn depends on the actions (s r , s j ) just described, as well as the inverse of the minority group’s social standing, θ. As indicated earlier, this depends both on the minority group’s economic disadvantage, something that is exacerbated by food price increases, and other factors (i.e. the degree of horizontal inequality). θ may also be construed to be a metric of adverse circumstances that produce disadvantage and enduring inequalities of opportunity, as in Roemer (1998), which disadvantage certain groups because of an adverse perception of their identity irrespective of individual qualities and qualifications (see also Stewart (2000) and Cederman et al. (2013) on this). An increase in θ is a reduction of social standing, but it will encourage own-identity based actions.
The budget constraint describing input or actions to individual utility takes on the following form (where S r refers to the total endowment of possible actions):
We postulate that the attractiveness of inputs into own-identity type behavior (s r ) rises with μ and θ; an increase in both can be described as a fall in the relative price of own-identity based actions relative to other-identity based actions (k r ).
Following Akerlof and Kranton (2000) it is also possible to show that individuals derive disutility from the non-conformity of other minority group members. Secondly, if the costs of so doing are low compared to the pain inflicted on errant members, individuals of a minority group will exert effort to bring back members who have strayed from ideal group behavior back to the fold, as analyzed by Akerlof and Kranton (2000). If another member of the minority group (j) suffers disutility (I j ) from other-identity based behavior (k r ) by person r, they may lure the errant individual back to the fold provided that the cost of doing so to themselves (c j ) is not too large and is less than the loss inflicted (l r ) on the deviant group member through a cooperative game, requiring the condition:
This condition above is more likely to hold amongst poor but culturally homogenous communities suffering from widespread unemployment, which makes them much more vulnerable to shocks to their budgets (such as food price rises) and who live proximately to each other in isolated ghettos with close kinship ties, as is the case in many metropolitan locations.
Rioting behavior is arrived at after summing the choices regarding s r from individual utility maximization described in (5), subject to individual constraints (6):
For collective action (like a club good) to take place via the adoption of the dissident public’s strategy (e), a critical threshold of aggregate own-identity based actions, ∑s r , must be chosen. This requires high enough values of θ; condition (7) must also hold so that it is not too costly to deter non-own-identity based actions through cooperative games; at high enough values of θ condition (7) becomes more relaxed, as more self-enforcing and sincere own-identity based behavior takes place via (6).
The dissident public’s, risk-neutral expected payoffs, R, takes the following form:
where:
R P and R C describe the dissident public’s payoffs in the two states, with utility greater in the peaceful states. Strategic choices surround e (effort with regard to peace with the state) obtained from (8); E describes the aggregate cost function for undertaking e, composed of the nutritional costs of reduced food intake in addition to the psychic costs of ‘capitulation’ to the state or the total losses and costs of inducing own-identity based behavior in (7), with E e > 0. Collective dissident behavior, via the dissident public’s strategy, e, is akin to a club or associational good (Cornes and Sandler 1996). A club good is excludable in nature, only those who subscribe or contribute can partake of it. It is “voluntary” because individuals do not have to participate, unlike in the case of non-excludable pure public goods. With club goods, however, membership and provision are inseparable; this club will not suffer from congestion externalities; members may not be homogenous in their ability to contribute, which are not necessarily anonymous. Differentiating the dissident public’s strategic variable (e) in (10) we find:
The first term on the right-hand side of (11) is positive, e rises with T, but falls with θ and μ. The disgruntled public will maximize (9) with respect to e, equating its marginal benefit to marginal cost:
4 Reaction Functions
In order to analyze variations in parameters we first need to obtain a pair of reaction functions in (a, e) space to capture government-public interaction. Equations (4) and (12) form the basis of the reaction functions for the government and the public, obtained by totally differentiating them with respect to a and e. Thus:
and
Note that π
ae
= π
ea
by symmetry. Also, even though π
a
, π
e
> 0, π
aa
, π
ee
< 0, meaning there are diminishing returns to peaceful behavior, C
aa
, E
ee
> 0, R
P
> R
C
, G
P
> G
C
. We assume that the two strategies are complements:
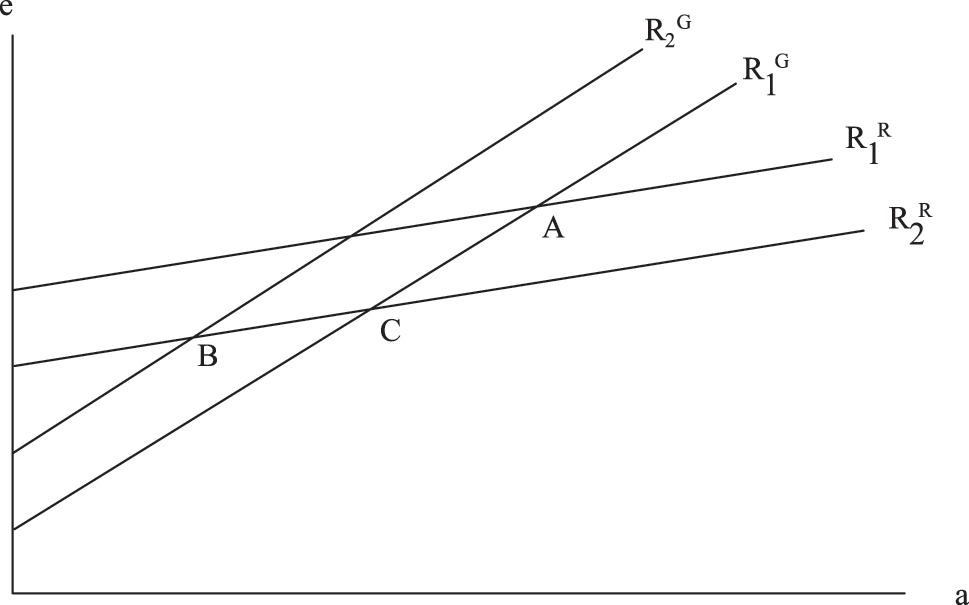
Strategic interaction between the government and dissidents.
5 An Increase in Government Repression (μ)
An increase in government repression in Figure 1 shifts the reaction function of the government R G 1 leftwards to R G 2 , as there is less incentive to be peaceful (a) for each level of e, see Equations (1)–(3). A similar line of reasoning applies to the public, and their reaction functions shift down from R R 1 to R R 2 . The new equilibrium will have shifted from A to point B in Figure 1 with a decline in both a and e, peaceful behavior by both sides to this quarrel, but a greater decline in a relative to e. The dissident public’s stock of collective action, given from (7)–(9), has increased because the individual relative price of own-identity based actions has fallen. From this result, we hypothesize: (1a) Higher levels of state repression will increase the probability of urban food riots, ceteris paribus. (1b) Higher levels of government transfers to subsidize food purchases will lower the probability of urban food riots.
6 A Rise in the Motivation to Fight the State (θ)
An increase in the intrinsic motivation to fight the state by the public can arise because of increased inequality and an increased risk of household budgets to a food price increase. The new equilibrium will be at a point like C in Figure 1. From this result, we hypothesize: (2) A rise in inequality (especially associated with identity) will increase the probability of urban food riots, ceteris paribus.
7 Empirical Methodology
Our empirical strategy investigates the effect of food insecurity (both the level and volatility of food prices) on urban conflict events, allowing for the impact of different measures of inequality and repression as explanatory variables with different specifications within this nexus. Our dependent variable is social unrest; we utilize data on conflict events obtained from the PRIO-USD (urban social disorder) v.2 data set (Bahgat, Buhaug, and Urdal 2018; Urdal and Hoelscher 2012), which contains information on urban disorder in the capital and other major cities across the developing world.[6] These data are presented in a monthly format.
We begin our analysis focusing on food price insecurity. Both food price levels and volatility in food prices will be examined, but mainly the latter. As indicated, food price increases are most likely to affect urban consumers, who may protest if these price hikes are “mismanaged”. In general, food price volatility is more likely to spark urban social unrest, rioting and protests rather than war. Our analysis covers the period 2000–2015, and the country coverage of our analysis is listed in the appendix. Food price data (in the form of consumer price index, CPI, with base year of 2010) is taken from FAO database.[7] The food price index (food CPI) includes a complete and consistent set of monthly time series data from 2000 to 2015, compiled by FAO using population weights to aggregate across countries. These indices measure the price change between the current and reference periods of the average basket of goods and services purchased by households. Based on this price index, the price volatility index is calculated following the methodology in von Haldenwang and Ivanyna (2018). The volatility index can be understood as the typical deviation of the variable from a quadratic time trend over the period. In other words, it measures average volatility for this period (2000–2015).
Our theory pushes us to feature upward price spikes (downward volatility in prices should not lead to protest) and urban unrest. Moreover, food insecurity relates to price spikes and has little to do with downward price volatility or general price levels at equilibrium.
We have calculated upward spikes in food prices, which could be seen as innovation of our paper as we have not discovered a positive food price spike variable in any other research on this topic. To this end, the Hodrick-Prescott (HP) and Band-Pass (BP) filters are employed in calculating long term trend mechanically for business cycle variables in macroeconomics.[8] We have utilized the HP filter to compute food price trend value and calculated how much actual observations have deviated from it. We consider only the positive gap and replace all the negative values as zero, which in turn shaped the gap as price hike or price spike. As we calculated the HP filter using the log of the food price index, the resultant gap indicates the percentage change of food price from its long-term value.[9]
Our dependent variable, urban social disorder, and the main independent variable, food prices and its positive volatility, contain observations in monthly frequency. The monthly frequency of data is beneficial in two ways: firstly, it reflects contemporaneous relationship more accurately and secondly, it would entitle more statistical power as we have more observations. In the case of other control variables that are not reported on an annualized format, we will keep the observation constant over the months of a particular year of the country observation.[10]
Since the mechanism via which rising or volatile food prices is most likely to engender conflict (urban protest) lie in a relative deprivation or horizontal inequality effect according to our theory, it is important to explicitly incorporate inequality measures into the econometric model. This has not been done in any of the studies reviewed above and constitutes a central innovation of our study. We propose two alternative measures related to vertical and horizontal inequality. We use the egalitarian component index from the V-Dem data base (Coppedge et al. 2016).[11] This has a political component measuring equal access to freedoms and rights, as well as the egalitarian distribution of economic resources across social groups, including the fulfilment of basic needs across society. Hypothesis 2 explicitly state that greater inequality fuels conflict.
As far as horizontal inequality is concerned, we employ the ethnic power relations (EPR) dataset (Vogt, et al. 2015). In particular we use the share of the excluded group size relative to the powerful ethno-political group. We also utilize the percentage of the discriminated population. Data on the economic aspects of horizontal inequality (such as income) on a systematic basis across countries is still not available to facilitate a proper panel data econometric analysis.
Our theoretical model also features the tradeoff between the government choosing to repress the public or to subsidize their food budgets. To account for repression, we employ the Political Terror Scale (Gibney et al. 2020).[12] The Political Terror Scale features transgressions against individual human rights, which is directly consistent with our formal model.[13] We also examine the role of the political system (see Appendix Table A2), whereby we employ VDEM’s Liberal-Democracy Index and its squared term. We consider this measure to be highly correlated with repression and does not account as well for the mechanism we model in our game. Repression is what we model and a measure of autocracy-democracy only indirectly accounts for the mechanisms addressed in our game.
Government expenditures data come from the World Bank’s World Development Indicators (World Bank 2021). Ideally we would be able to employ food subsidy data, but such data are spotty and not globally available as are the World Bank’s general data on government transfers.
We also added several control variables, in addition to our main theoretical variables. It needs to be borne in mind that some of the earliest studies hardly control for other factors; Arezki and Brückner (2011), for example. As primary control variables, we employ GDP per capita growth, as food price insecurity and the governmental responses to these depend on the changes in the income level of the country, and growth contributes to this capacity. A growing economy will mitigate the effects of food price shocks. We also use the share of youth and urban population, as a more urban or more youthful population can also contribute to conflict following food price increases via the relative deprivation mechanism (Urdal 2006). Moreover, the opportunity costs of youth to join a protest are lower than for adults.
To summarize, we carry out panel data analysis, covering a period from 2000 to 2014 involving some sixty developing countries. Since the dependent variable is in count data format, we employ appropriate count data techniques such as negative binomial regressions. The model is specified as:
We utilize both a food price index and food price volatility (price spikes) separately as a measure of food insecurity in the model. X represents a set of control variables as discussed, v i are country fixed effects that capture time-invariant country specific unobservable characteristics and γ t are year fixed effects to capture any variation in conflict between years which might not be covered by the explanatory variables in the model. The idiosyncratic error term is indicated by ϵ it.
Table 1 contains the descriptive statistics of our sample. Table A1 in the Appendix lists all countries included in our analysis.
Summary statistics (2000–2014).
| Variables | Mean | SD | Min | Max | Observations |
|---|---|---|---|---|---|
| Conflict Variablesa | |||||
| Number of urban social disorder | 0.13 | 0.42 | 0.00 | 6.00 | 6,480 |
| Food pricea | |||||
| International food price index, log | 466.05 | 43.80 | 284.94 | 700.12 | 6,480 |
| Food price spike (positive hike) | 1.22 | 2.90 | 0.00 | 50.73 | 6,480 |
| Repression | |||||
| Political terror scale | 2.93 | 0.89 | 1 | 5 | 6,792 |
| Inequality variables | |||||
| Egalitarian component index | 0.60 | 0.15 | 0.16 | 0.91 | 540 |
| Share of excluded population relative to ethno-politically relevant population (log) | 2.06 | 1.47 | 0.00 | 4.45 | 298 |
| Powerless population (in %) | 0.09 | 0.17 | 0.00 | 0.84 | 298 |
| Macroeconomic variables | |||||
| Government expenditure (percent of GDP) | 25.49 | 7.09 | 10.40 | 44.74 | 527 |
| GDP growth (annual %) | 4.94 | 3.54 | −14.15 | 17.29 | 540 |
| Openness (% of GDP) | 81.42 | 54.38 | 19.80 | 441.61 | 570 |
| Agricultural value added (% of GDP) | 4.97 | 3.53 | −14.15 | 17.29 | 580 |
| Industry value added (% of GDP) | 29.71 | 10.33 | 5.00 | 69.08 | 542 |
| Urban population (% of total) | 53.29 | 22.98 | 13.89 | 100.00 | 540 |
| Youth population (% of total) | 33.81 | 9.76 | 13.06 | 50.22 | 540 |
| Instrumenta | |||||
| Rainfall (drought) | 0.11 | 0.31 | 0.00 | 1.00 | 2,976 |
-
aConflict, food price and rainfall variables have country-month observations, rest of the variables observed at country-year level.
We discover that potential endogeneity is not an issue between urban social disorder and price spike; to establish which we rely on a test (see Appendix).
8 Empirical Findings
To determine whether the Negative Binomial model is more appropriate than the Poisson model, we performed the likelihood ratio (LR) test. The LR test yielded a chi-squared value of 198.76 with a p-value < 0.05, indicating that the Negative Binomial model is significantly better than the Poisson model, thereby confirming the presence of overdispersion. In Tables 2a, our baseline regressions using conditional fixed-effect negative binomial models show that the coefficient on food prices is insignificant; however, the all-important food price upward spike variable has a positive and significant coefficient. This provides us with prima facie evidence that food price volatility causes conflict. Growth in per-capita GDP is highly significant in lowering urban social disorder risk; as countries become richer, they face less food price related conflict risk. Also, government spending tends to lower the incidence of urban disorder, although not significantly, but nonetheless with the right sign in all cases. The share of youth in the population increases the chances of urban social disorder, although not statistically significantly in all estimations. We also included trade openness (the share of the sum of imports and exports in GDP); this turns up as positive and significant in some instances, but its coefficient is so small, leading us to deduce minimal impact. Also, the value added of different sectors (agriculture in 2a and industry in 2b) yield statistically insignificant coefficients (Table 2b).
Baseline urban social disorder and food insecurity.
| Linear fixed effect regression | Conditional fixed effect negative binomial regression | |||
|---|---|---|---|---|
| (1) | (2) | (3) | (4) | |
| Food price, log | 0.000 | −0.002 | ||
| (0.000) | (0.004) | |||
| Price spike (positive) | 0.004** | 0.023* | ||
| (0.002) | (0.013) | |||
| Government expenditure (% of GDP) | 0.000 | 0.000 | 0.001 | 0.003 |
| (0.002) | (0.002) | (0.016) | (0.016) | |
| GDP growth | −0.007*** | −0.007*** | −0.0461*** | −0.045*** |
| (0.002) | (0.002) | (0.013) | (0.013) | |
| Urban population (% of total) | −0.004 | −0.004 | 0.017 | 0.016 |
| (0.005) | (0.005) | (0.015) | (0.014) | |
| Youth population (% of total) | 0.022*** | 0.020*** | 0.071** | 0.0652* |
| (0.007) | (0.007) | (0.0355) | (0.0358) | |
| Openness (% of GDP) | 0.001** | 0.001* | 0.003 | 0.004 |
| (0.0004) | (0.0004) | (0.003) | (0.003) | |
| Agricultural value added (% of GDP) | 0.001 | 0.001 | 0.0301 | 0.0282 |
| (0.002) | (0.002) | (0.0237) | (0.0236) | |
| Year | 0.005 | 0.005 | 0.020 | 0.008 |
| (0.004) | (0.003) | (0.0261) | (0.0159) | |
| Constant | −11.30 | −10.304 | −42.57 | −19.86 |
| (7.931) | (6.303) | (51.50) | (32.42) | |
| Observations | 6,228 | 6,228 | 5,784 | 5,784 |
| Number of countries | 68 | 68 | 58 | 58 |
-
Standard errors in parentheses. ***p < 0.01, **p < 0.05, *p < 0.1.
Baseline urban social disorder and food insecurity.
| Linear fixed effect regression | Conditional fixed effect negative binomial regression | |||
|---|---|---|---|---|
| (1) | (2) | (3) | (4) | |
| Food price, log | 0.000 | −0.002 | ||
| (0.000) | (0.004) | |||
| Price spike (positive) | 0.004** | 0.0238* | ||
| (0.002) | (0.013) | |||
| Government expenditure (% of GDP) | −0.000 | −0.000 | 0.004 | 0.003 |
| (0.002) | (0.002) | (0.016) | (0.016) | |
| GDP growth | −0.007*** | −0.007*** | −0.0492*** | −0.048*** |
| (0.002) | (0.002) | (0.013) | (0.013) | |
| Urban population (% of total) | −0.004 | −0.004 | 0.0134 | 0.0129 |
| (0.005) | (0.005) | (0.0137) | (0.014) | |
| Youth population (% of total) | 0.021*** | 0.020*** | 0.082** | 0.0760** |
| (0.007) | (0.007) | (0.0325) | (0.0327) | |
| Openness (% of GDP) | 0.001** | 0.001** | 0.004 | 0.004 |
| (0.0004) | (0.0004) | (0.003) | (0.003) | |
| Industry value added (% of GDP) | −0.0001 | −0.0001 | 0.01733 | 0.0168 |
| (0.002) | (0.002) | (0.0151) | (0.0151) | |
| Year | 0.005 | 0.006 | 0.0217 | 0.0107 |
| (0.004) | (0.004) | (0.026) | (0.0153) | |
| Constant | −10.84 | −12.74 | −46.29 | −25.01 |
| (7.907) | (7.47) | (51.19) | (31.27) | |
| Observations | 6,228 | 6,228 | 5,784 | 5,784 |
| Number of countries | 68 | 68 | 58 | 58 |
-
Standard errors in parentheses. ***p < 0.01, **p < 0.05, *p < 0.1.
In Table 3, we include our main theoretical variables (derived from our formal model), the impact of inequality and repression. To measure vertical inequality (inequality between individuals), we utilize the more hybrid egalitarian component index which measures the equality of rights across social groups as well as the provision and coverage of basic needs (Coppedge et al. 2016). The higher the index the more egalitarian is the society in question, hence our expectation for the sign of this coefficient is negative. To account for horizontal inequality (to be more precise, inter-ethnic group horizontal inequality), we draw on the ethnic power relations (EPR) data set (Vogt, et al. 2015). We use two variables, the share of the excluded population compared to the ethno-politically relevant population (logged) and the powerless population share in percentage. We expect their signs to be positive because, as constructed, a higher value implies greater inter-group inequality. Our measure of repression is the State Terror Scale (Gibney et al. 2020). We expect repression to induce riots.
Urban social disorder and food insecurity (with Inequality).
| Variables | Conditional fixed effect negative binomial regression | ||||||
|---|---|---|---|---|---|---|---|
| (1) | (2) | (3) | (4) | (5) | (6) | (7) | |
| Price spike (positive) | 0.022a | 0.023a | 0.022a | −0.009 | −0.003 | −0.010 | −0.002 |
| (0.013) | (0.013) | (0.013) | (0.029) | (0.028) | (0.029) | (0.028) | |
| Egalitarian component index | −2.318* | −1.826* | |||||
| (0.900) | (0.903) | ||||||
| Share of excluded population to ethno-politically relevant population (Log) | 0.462* | 0.394* | |||||
| (0.162) | (0.193) | ||||||
| Powerless population (in %) | 3.711* | 3.692a | |||||
| (2.080) | (2.003) | ||||||
| Political terror scale | 0.298** | 0.266** | 0.363** | 0.429** | |||
| (0.089) | (0.090) | (0.134) | (0.130) | ||||
| Government expenditure (% of GDP) | 0.00307 | 0.001 | −0.000 | −0.046a | −0.047a | −0.037 | −0.046a |
| (0.016) | (0.015) | (0.016) | (0.026) | (0.027) | (0.026) | (0.027) | |
| GDP growth | −0.037** | −0.043** | −0.039** | −0.056* | −0.042* | −0.052** | −0.035a |
| (0.013) | (0.012) | (0.013) | (0.018) | (0.019) | (0.018) | (0.019) | |
| Urban population (% of total) | 0.012 | 0.012 | 0.017 | −0.003 | 0.001 | 0.004 | 0.011 |
| (0.013) | (0.013) | (0.014) | (0.017) | (0.017) | (0.016) | (0.016) | |
| Youth population (% of total) | 0.007 | 0.015 | 0.003 | −0.077* | −0.066a | −0.057 | −0.058 |
| (0.027) | (0.026) | (0.026) | (0.038) | (0.039) | (0.038) | (0.039) | |
| Year | −0.007 | −0.013 | −0.011 | −0.067** | −0.077** | −0.065** | −0.080** |
| (0.014) | (0.014) | (0.014) | (0.023) | (0.024) | (0.023) | (0.025) | |
| Constant | 13.13 | 26.836 | 21.039 | 136.644** | 154.131** | 132.107** | 160.796** |
| (28.37) | (27.451) | (28.194) | (46.346) | (49.403) | (47.291) | (49.894) | |
| Observations | 6,144 | 6,324 | 6,144 | 3,108 | 2,976 | 3,108 | 2,976 |
| Number of countries | 60 | 61 | 60 | 39 | 38 | 39 | 38 |
-
Standard errors in parentheses. **p < 0.01, *p < 0.05, ap < 0.1.
The inclusion of our theoretical variables has very little effect on the baseline model coefficients. The statistical significance associated with price shocks in particular remains for the most part, unchanged. Model 1 in Table 3 corresponds to Model 4 in Table 2 with the inclusion of the Political Terror Scale. Models 2 and 3 in Table 3 add the V-Dem Egalitarian Component Index with and without the inclusion of the state repression measure. The inclusion of the Political Terror Scale reduces the coefficient value of the egalitarian measure, but it remains statistically significant. These findings strongly support Hypotheses 1a and 2. We do not find a statistically significant relationship between government expenditures and urban riots, providing no support for Hypothesis 1b. The lack of a statistical relationship between government expenditures was also evident in Table 2.[14]
In Models 4 and 5 we include the ERP measure of the share of the excluded population with and without a measure of repression. These data include many missing values and thereby reduce our sample size substantially. Indeed, we lose about half of our sample and reduce the number of countries included in the analysis. With these estimations, we now find our food price spike measure is no longer statistically significant, which is most likely due to the smaller sample size.[15] The quality of the ERP data (Vogt, et al. 2015) is extremely high. The problem is with the coverage of the data for our purposes, which is the problem. Inequality and repression are strongly significant, while governmental expenditure is borderline statistically significant at p < 0.1. The results from these estimations support all of our hypotheses.
Models 6 and 7 examine the role of inequality by using the ERP measure of the proportion of population that is powerless, which is statistically significantly related to food riots. When repression is included in Model 7, the effect of our inequality measure declines a bit and is now borderline statistically significant, but repression and government transfers are significant. Models 6 and 7 support all our hypotheses.
Government policies play a substantially important role in increasing or decreasing the propensity for urban food riots. Government transfers (carrots) are associated with reducing the chances of conflict, albeit with borderline statistical significance. This is probably to some extent due to measurement issues with the variable we use. We do not have precise data on food price support or subsidies on a cross-national basis, and our measure may be too crude. We also lack information on who receives the government transfers. If the poor and politically excluded receive less than their share, the subsidies would not work in the manner we theorize. Indeed, if the rich or politically-included groups receive government transfers and the poor and politically excluded portion of the population receive little or nothing, the subsidies will contribute positively to the risk of violent protest. The best measure of what we model in our game would be transfers to the poor and excluded portion of the population. Alas, such a measure is not available. Nonetheless, our results do corroborate Hypothesis 1b to some extent and in turn validate our game theoretic model. Government expenditures reduce the incidence of food riots.
State repression (the stick) is strongly associated with the incidence of food riots. The Political Terror Scale is robustly associated with increasing the incidence of conflict across all estimations. Across all estimations, repression results in a heightened probability of urban riots. These results are completely consistent with our game theoretic model. Hypothesis 1a is strongly supported. Repression does not reduce the changes of urban riots, but rather gives rise to violence. This is especially clear when seen in conjunction with inequality.
Inequality and repression are also strongly associated with food riots. Egalitarianism measured by the V-DEM dataset has the expected negative effect on urban unrest events. The two horizontal inequality measures have the correct sign and are also statistically significant. Hypothesis two is strongly supported. Moreover, control variables such as per capita income growth are significant. Indeed, the seeds of conflict can be found in the prevalence of poverty and inequality, (see Murshed (2010), Østby (2013), Cederman et al. (2013)).
In Table 4 we interact food price spikes with all our measures of inequality. When it comes to our inequality measures captured by political exclusion, powerlessness and political terror reinforce the tendency towards protest and riots following food price spikes, even though the coefficients of the interaction terms only are statistically insignificant. The interaction term of food price increases and the VDEM egalitarian index are positive and significant. Greater egalitarianism, take on its own, moderates the risk of riots and protests; however, the risk diminution effect of equality is counteracted in the presence of food price spikes. In other words, egalitarianism does not dampen the impact of food price increases on urban social disorder. As far as our other measures of horizontal inequality are concerned, when they are interacted with food spikes the resultant interaction term is statistically insignificant, implying that food prices are not an intermediate channel for galvanizing these horizontal inequalities into urban social disorder.
Urban social disorder and food insecurity interacted with inequality.
| Variables | (1) | (2) | (3) | (4) |
|---|---|---|---|---|
| Price spike (positive) | −0.092 | 0.014 | 0.003 | 0.097* |
| (0.057) | (0.059) | (0.030) | (0.051) | |
| Egalitarian component index | −2.516*** | |||
| (0.910) | ||||
| Price spike*Egalitarian | 0.219** | |||
| (0.103) | ||||
| Share of excluded population to ethno-politically relevant population (Log) | 0.477*** | |||
| (0.166) | ||||
| Price spike*Share of excluded | −0.009 | |||
| (0.022) | ||||
| Powerless population (in %) | 3.959* | |||
| (2.087) | ||||
| Price spike*powerless | −0.250 | |||
| (0.234) | ||||
| Political terror scale | 0.326*** | |||
| (0.091) | ||||
| Price spike*PTS | −0.019 | |||
| (0.013) | ||||
| Government expenditure (% of GDP) | 0.000 | −0.046* | −0.037 | 0.002 |
| (0.015) | (0.026) | (0.026) | (0.016) | |
| GDP growth | −0.044*** | −0.055*** | −0.051*** | −0.038*** |
| (0.012) | (0.018) | (0.018) | (0.012) | |
| Urban population (% of total) | 0.013 | −0.003 | 0.004 | 0.013 |
| (0.013) | (0.017) | (0.016) | (0.014) | |
| Youth population (% of total) | 0.017 | −0.077** | −0.057 | 0.010 |
| (0.026) | (0.038) | (0.038) | (0.027) | |
| Year | −0.013 | −0.067*** | −0.064*** | −0.007 |
| (0.014) | (0.023) | (0.023) | (0.014) | |
| Constant | 26.599 | 135.663*** | 131.025*** | 11.269 |
| (27.494) | (46.451) | (47.312) | (28.415) | |
| Observations | 6,324 | 3,108 | 3,108 | 6,144 |
| Number of countries | 61 | 39 | 39 | 60 |
-
Standard errors in parentheses. ***p < 0.01, **p < 0.05, *p < 0.1.
9 Discussion
Let us return to our game theoretic model and recapitulate with regard to our empirical analysis. Several observations are of note. First, consider the logic of our argument regarding riots. Those who protest are the most vulnerable to price shocks and have little political recourse to voice their displeasure than to protest. Lacking formal organizations to engage in non-violent protest, violence is endemic. We see strong evidence to support this argument, especially in models 2 and 3 in Table 3, which feature vertical inequality. Our examination of the relationship between horizontal inequality and urban protest can be seen in models 4–7 in Table 3. These two measures from ERP (Vogt, et al. 2015) demonstrate how group identity helps solve the collective action problem facing protest. Cohesive identities of excluded groups positively link individuals together making protest easier. We measure inequality from a variety of perspectives. All of our estimations show that increased levels of inequality lead to a greater likelihood of urban violent protest. Previous research on food riots and food insecurity has ignored the role of inequality. Clearly, inequality is an important factor that is missing from these works. We demonstrate conclusively that inequality is critically important.
The second aspect of our game is the active role played by the government. The government is not a passive actor. Government policies can directly increase or decrease the chances of urban riots. Of course, government policies are also responsible for the extent of vertical or horizontal inequality in a society. Horizontal inequality is arguably even more the result of government policies, whereby portions of the population are systematically excluded. More directly, governments can choose to reduce the pain of food price shocks with subsidies and government transfers, or they can repress the population that engages in protest. What our results show is that repression backfires. It leads to more protest. Repression is highly associated with governmental systems that offer only a limited voice to the general population and even more strongly constrain the influence of politically excluded groups. These groups have little recourse other than protest to vent their frustration with food price spikes. Models 1, 3, 5, and 7 in Table 3 show that repression is robustly and significantly related positively with urban riots. These results are consistent with our game. Models 1–4 in Table 2 and Models 1–7 in Table 3 show more mixed results for the effectiveness of government expenditures for reducing the likelihood of riots. As discussed above this is probably due to measurement issues. We lack the appropriate measure of the mechanisms outlined in our game to provide an effective test of our hypothesis (H1b). Nevertheless, government expenditures are highly correlated with transfers and subsidies (especially if there are many recipients). Moreover, we do see evidence that government expenditure reduces the likelihood of urban political violence.
10 Conclusions
Since time immemorial food shortages and food price increases have sparked social unrest. Indeed, the colloquial Egyptian Arabic word for bread, ayesh, is also synonymous with life. Food price increases do not necessarily spark widespread protest. The degree of any resultant conflict depends on a host of factors including the degree of inter-personal and inter-group inequality, the income level of the country, its relative urban and youth population share, the degree of social protection or government expenditure as well as state repression.
Our formal model accounts for the strategic dynamics played between a government and excluded or discriminated groups. The game examines the choices and best responses a government and a dissident group play in response to a food price shock (an upward price raise). Whereby, government actions (government transfers or repression) and excluded groups reactions determine the conditions of peace or conflict. The game models how repression and the poor and politically excluded overcome collective action problems (through a common identity) to rise up against the state and contrasts such violent outcomes with peaceful strategic equilibria.
The results of our empirical estimation suggest that food prices, and especially food-price volatility, for the most part, do contribute statistically significantly to urban social disorder measured by the PRIO-USD dataset (Bahgat, Buhaug, and Urdal 2018; Urdal and Hoelscher 2012). The growth in per-capita income is significant and has the right negative sign, indicating that richer countries face less food price related urban unrest. Government expenditure as a share of national income usually has the right sign but is not always statistically significant.
Repression is robustly related to urban unrest. Our empirical analysis supports the findings of our formal model, government transfers reduce the prospects of violence, while repression increases the propensity for riots. In our empirical analysis, like in our theoretical model, repression spurs resentment and anger, which thereby produces the conditions for food riots.
An innovation of our study is the inclusion of inequality. Our metric for measuring inter-personal or inter-household vertical inequality is the V-DEM egalitarian index, which is a broader measure of the extent to which a society is egalitarian. The V-DEM egalitarian index emerges with the correct expected signs, and which are significant, suggesting that more inequality leads to greater urban social disorder, and the urban disorder reducing effects of greater egalitarianism are diminished in the presence of food spikes. We also utilize measures of inter-group or horizontal inequality in its political dimensions, using the EPR data (Vogt, et al. 2015). These result in the expected signs; more horizontal inequality leads to greater conflict and is statistically significant.
Our model highlights the role of food insecurity, government policy (i.e. the employment of carrots or sticks), and the degree of inequality defining society and the propensity for urban violence. Our empirical analysis shows that food price spikes, repression and inequality, especially identity-based inequality, are highly associated with the incidence of food riots. Repression is often associated with the politics of exclusion and impoverishment. Together, these policies create an environment of frustration and anger. Countries with high levels of latent hostility are where food price spikes trigger violent riots.
Funding source: Erasmus University, Den Haag, The Netherlands
Funding source: Qatar National Research Fund
Award Identifier / Grant number: NPRP 8-100-5-148
Test of Endogeneity
In order to address potential endogeneity or bi-causal relationships between social disorder occurrences and food price hike, we have plugged in instrumental variable approach using rainfall monthly data as instrument to food price hike, similar to Koren (2018).
Construction of Instrument
For each country, long term average rainfall and standard deviation of rainfall has been calculated for each month.
We have created an indicator variable, drought which takes value 1and 0 for each month under the following condition.
drought = 0 if (long-term average−1 SD < rainfall < long-term average + 1 SD)
= 0 if (rainfall > long-term average + 1 SD)
= 1 if (rainfall < long-term average−1 SD)
DWH Test of Endogeneity
In order to address endogeneity, we have plugged in rainfall as an instrument. It is to be noted that rainfall might not be a good predictor of food prices outside of Africa, which is more reliant on rained agriculture than other regions of the world, including South Asians countries. Whether it is necessary to employ instrumental variable for our data we rely on the augmented regression test (DWH test) suggested by Davidson and MacKinnon (1993). This test assesses endogeneity in a regression estimated using instrumental variables (IV). The null hypothesis asserts that an ordinary least squares (OLS) estimator of the same equation would produce consistent estimates, meaning any endogeneity among the regressors would not distort OLS estimates. Rejecting the null hypothesis suggests that the impact of endogenous regressors on the estimates is significant, implying that instrumental variable methods are necessary (Tables A1–A4).
List of countries in analysis.
| Afghanistan | Guatemala | Mongolia | Togo |
| Algeria | Guinea | Morocco | Tunisia |
| Armenia | Haiti | Mozambique | Turkey |
| Azerbaijan | Honduras | Niger | Uganda |
| Bangladesh | India | Nigeria | Uruguay |
| Bolivia | Indonesia | Pakistan | Vietnam |
| Brazil | Japan | Panama | Zimbabwe |
| Burkina Faso | Jordan | Peru | |
| Cambodia | Kazakhstan | Philippines | |
| Chile | Kenya | Rwanda | |
| Colombia | Kuwait | Saudi Arabia | |
| Congo, DRC | Kyrgyzstan | Senegal | |
| Cote d’Ivoire | Lebanon | Singapore | |
| Ecuador | Liberia | South Africa | |
| Egypt | Madagascar | South Korea | |
| Ethiopia | Malaysia | Sri Lanka | |
| Georgia | Mali | Tajikistan | |
| Ghana | Mexico | Thailand |
Urban social disorder and food insecurity with VDEM index of democracy.
| Variables | (1) | (2) | (4) | (6) |
|---|---|---|---|---|
| Price spike (positive) | 0.022a | 0.022a | 0.002 | 0.002 |
| (0.013) | (0.013) | (0.028) | (0.028) | |
| Egalitarian component index | −2.201* | |||
| (1.061) | ||||
| Share of excluded population to ethno-politically relevant population (Log) | 0.426† (0.241) | |||
| Powerless population (in %) | 3.343 | |||
| (2.240) | ||||
| Political terror scale (State Dept) | 0.29** | 0.27** | 0.40** | 0.45** |
| (0.089) | (0.090) | (0.139) | (0.135) | |
| VDEM Liberal democracy index | −1.34 | 0.521 | −12.62* | −11.54a |
| (2.40) | (2.60) | (5.80) | (5.97) | |
| VDEM (Liberal democracy index)ˆ2 | 1.52 | −0.003 | 13.07† | 11.96 |
| (3.11) | (3.24) | (7.20) | (7.54) | |
| Government expenditure (% of GDP) | 0.003 | −0.001 | −0.050a | −0.047a |
| (0.016) | (0.016) | (0.028) | (0.029) | |
| GDP growth | −0.037** | −0.039** | −0.038a | −0.032 |
| (0.012) | (0.013) | (0.020) | (0.019) | |
| Urban population (% of total) | 0.011 | 0.016 | 0.007 | 0.015 |
| (0.014) | (0.015) | (0.019) | (0.019) | |
| Youth population (% of total) | 0.007 | 0.003 | −0.064 | −0.068 |
| (0.027) | (0.026) | (0.048) | (0.044) | |
| Year | −0.007 | −0.011 | −0.087** | −0.093** |
| (0.014) | (0.014) | (0.026) | (0.026) | |
| Constant | 12.05 | 20.91 | 177.32** | 189.60** |
| (28.67) | (28.56) | (52.53) | (52.63) | |
| Observations | 6,144 | 6,144 | 2,976 | 2,976 |
| Number of countries | 60 | 60 | 38 | 38 |
-
Standard errors in parentheses. **p < 0.01, *p < 0.05, ap< 0.1.
Output of an instrumental variable approach.
| Variables | First stage | Second stage |
|---|---|---|
| Y = price spike | Y= social disorder | |
| (1) | (2) | |
| Drought | −0.001 | |
| (0.002) | ||
| Price spike | 0.165 | |
| (0.362) | ||
| Government expenditure (% of GDP) | 0.014 | −0.003 |
| (0.006) | (0.005) | |
| GDP growth | 0.045*** | −0.016 |
| (0.011) | (0.017) | |
| Urban population (% of total) | −0.096*** | −0.001 |
| (0.003) | (0.004) | |
| Youth population (% of total) | 0.022*** | −0.096 |
| (0.006) | (0.008) | |
| Year | 0.003 | 0.005 |
| (0.009) | (0.005) | |
| Constant | 27.14 | −8.70 |
| (18.80) | (10.67) | |
| Observations | 6,456 | 6,456 |
-
Instrumented: price spike, Standard errors in parentheses. ***p < 0.01, **p < 0.05 * p < 0.10.
Reverse regression results.
| Dependent variable: Urban social disorder | Dependent variable: Price spike | |
|---|---|---|
| (1) | (2) | |
| Urban social disorder | 0.0886 | |
| (0.066) | ||
| Price spike (positive) | 0.0238* | |
| (0.013) | ||
| Government expenditure (% of GDP) | 0.003 | 0.003 |
| (0.016) | (0.0112) | |
| GDP growth | −0.048*** | −0.0452*** |
| (0.013) | (0.0095) | |
| Urban population (% of total) | 0.0129 | −0.0320 |
| (0.014) | 0.0254 | |
| Youth population (% of total) | 0.0760** | 0.0626* |
| (0.0327) | (0.0369) | |
| Openness (% of GDP) | 0.004 | 0.0017 |
| (0.003) | (0.0020) | |
| Industry value added (% of GDP) | 0.0168 | 0.0389*** |
| (0.0151) | (0.0121) | |
| Year | 0.0107 | 0.0366* |
| (0.0153) | (0.0195) | |
| Constant | −25.01 | – |
| (31.27) | – | |
| Observations | 5,784 | 6,228 |
| Number of countries | 58 | 68 |
-
Standard errors in parentheses. ***p < 0.01, **p < 0.05, *p < 0.1.
The results indicate that the effect of price spikes on conflict becomes insignificant, and drought also turns insignificant in the first stage, suggesting weak instrument strength. To formally test for endogeneity of the price spike, we apply the Durbin-Wu-Hausman (DWH) test, using the ivendog command in Stata after the ivreg or iverg2 commands.
Durbin (score) chi2(1) = 0.4404 (p = 0.5069)
Wu-Hausman F(16,448) = 0.4399 (p = 0.5072)
Since the p-values exceed 0.05, we fail to reject the null hypothesis that price spike is exogenous. This suggests that endogeneity is not a major concern in our model.
Reverse Regression
We also check the reverse regression result, treating urban social disorder as an explanatory variable and considering price spike as dependent variable. The coefficient for conflict/urban social disorder was insignificant (p-value = 0.18), indicating that reverse causality is not a concern. This result complements our earlier findings from the DWH test.
References
Abbs, Luke. 2020. “The Hunger Games: Food Prices, Ethnic Cleavages, and Nonviolent Unrest in Africa.” Journal of Peace Research 57 (2): 281–96. https://doi.org/10.1177/0022343319866487.Search in Google Scholar
Akerlof, George, and Rachel E. Kranton. 2000. “Economics and Identity.” Quarterly Journal of Economics 115 (3): 715–53. https://doi.org/10.1162/003355300554881.Search in Google Scholar
Arezki, Rabah and Markus Brückner. 2011. “Food Prices and Political Instability.” CESifo Working Paper no. 3544. https://doi.org/10.5089/9781455221066.001.Search in Google Scholar
Bahgat, Karim, Halvard Buhaug, and Henrik Urdal. 2018. Urban Social Disorder: An Update, PRIO Paper. Oslo: PRIO. https://www.prio.org/Publications/Publication/?x=10888 (accessed April 16, 2020).Search in Google Scholar
Bellemare, Marc. 2014. “Rising Food Prices, Food Price Volatility and Social Unrest.” American Journal of Agricultural Economics 97 (1): 1–21. https://doi.org/10.1093/ajae/aau038.Search in Google Scholar
Brancati, Dawn. 2014. “Pocketbook Protests: Explaining the Emergence of Pro-democracy Protests Worldwide.” Comparative Political Studies 47 (11): 1503–30. https://doi.org/10.1177/0010414013512603.Search in Google Scholar
Brinkman, Henk-Jan and Cullen Hendrix. 2011. Food Insecurity and Violent Conflict: Causes, Consequences, and Addressing the Challenges, World Food Program, Occasional Paper no 24.Search in Google Scholar
Buhaug, Halvard, Tor A. Benjaminsen, Espen Sjaastad, and Ole Magnus Theisen. 2015. “Climate Variability, Food Production Shocks, and Violent Conflict in Sub-saharan Africa.” Environmental Research Letters 10 (12). https://doi.org/10.1088/1748-9326/10/12/125015.Search in Google Scholar
Buhaug, Halvard, and Todd Smith. 2020. Urban Unrest and Consumer Food Prices in the Developing World. Working Paper. Oslo: Peace Research Institute Oslo (PRIO).Search in Google Scholar
Bush, Ray, and Giuliano Martiniello. 2017. “Food Riots and Protest: Agrarian Modernizations and Structural Crises.” World Development 91: 193–207. https://doi.org/10.1016/j.worlddev.2016.10.017.Search in Google Scholar
Canova, Fabio. 2007. Methods for Applied Macroeconomic Research. Princeton: University Press.10.1515/9781400841028Search in Google Scholar
Caruso, Raul, and Jon Echevarria-Coco. 2023. “International Prices and Continuing Conflict: Theory and Evidence from Sub-saharan Africa (1980–2017).” Journal of Peace Research 60 (6): 889–905. https://doi.org/10.1177/00223433221116657.Search in Google Scholar
Cederman, Lars-Erik, Kristian-Skrede Gleditsch, and Halvard Buhaug. 2013. Inequality, Grievances, and Civil War. New York: Cambridge University Press.10.1017/CBO9781139084161Search in Google Scholar
Coppedge, Michael, John Gerring, Staffan I. Lindberg, Svend-Erik Skaaning, Jan Teorell, David Altman, Frida Andersson, et al.. 2016. “V-dem [Country-Year/Country-Date] Dataset V6.” Varieties of Democracy (VDem) Project.Search in Google Scholar
Cornes, Richard, and Todd Sandler. 1996. The Theory of Externalities, Public Goods, and Club Goods, 2nd ed. Cambridge: University Press.10.1017/CBO9781139174312Search in Google Scholar
d’Agostino, G., J. P. Dunne, and L. Pieroni. 2025. “Food and Peace? Exploring the Link between Conflict and Food Insecurity in Africa.” Defence and Peace Economics: 1–16. https://doi.org/10.1080/10242694.2025.2456798.Search in Google Scholar
Davidson, Russel, and James G. MacKinnon. 1993. Estimation and Inference in Econometrics. New York: Oxford University Press.Search in Google Scholar
Díaz-Bonilla, Eugenio. 2016. “Volatile Volatility: Conceptual and Measurement Issues Related to Price Trends and Volatility.” In Food Price Volatility and its Implications for Food Security and Policy, edited by Matthias Kalkuhl, Joachim von Braun, and Maximo Torero, 35–67. Berlin: Springer.10.1007/978-3-319-28201-5_2Search in Google Scholar
Fielding, David, and Anja Shortland. 2010. “An Eye for an Eye, a Tooth for a Tooth’: Political Violence and Counter-insurgency in Egypt.” Journal of Peace Research 47 (4): 433–47. https://doi.org/10.1177/0022343309360897.Search in Google Scholar
Gibney, Mark, Linda Cornett, Reed Wood, Peter Haschke, Daniel Arnon, Attilio Pisanò, Gray Barrett, and Baekkwan Park. 2020. “The Political Terror Scale 1976-2019.” Date Retrieved April 16, 2021, from the Political Terror Scale website: http://politicalterrorscale.org/.Search in Google Scholar
Heslin, Alison. 2021. “Riots and Resources: How Food Access Affects Collective Violence.” Journal of Peace Research 58 (2): 199–214. https://doi.org/10.1177/0022343319898227.Search in Google Scholar
Hendrix, Cullen, and Stephan Haggard. 2015. “Global Food Prices, Regime Type, and Urban Unrest in the Developing World.” Journal of Peace Research 52 (2): 143–57. https://doi.org/10.1177/0022343314561599.Search in Google Scholar
von Haldenwang, Christian, and Maksym Ivanyna. 2018. “Does the Political Resource Curse Affect Public Finance? the Vulnerability of Tax Revenue in Resource-dependent Countries.” Journal of International Development 30 (2): 323–44. https://doi.org/10.1002/jid.3346.Search in Google Scholar
Jones, Benjamin T., Eleonora Mattiacci, and Bear F. Braumoeller. 2017. “Food Scarcity and State Vulnerability: Unpacking the Link between Climate Variability and Violent Unrest.” Journal of Peace Research 54 (3): 335–50. https://doi.org/10.1177/0022343316684662.Search in Google Scholar
Koren, Ore. 2018. “Food Abundance and Violent Conflict in Africa.” American Journal of Agricultural Economics 100 (4): 981–1006. https://doi.org/10.1093/ajae/aax106.Search in Google Scholar
Murshed, S. Mansoob. 2010. Explaining Civil War: A Rational Choice Approach. Cheltenham: Edward Elgar.10.4337/9781849802260Search in Google Scholar
Murshed, S. Mansoob, Muhammad Badiuzzaman, and Rashel Hasan. 2018. “Food Insecurity and Conflict Events in Africa.” Peace Economics, Peace Science and Public Policy 24 (2): 2018. https://doi.org/10.1515/peps-2018-0007.Search in Google Scholar
Murshed, S. Mansoob, and Scott Gates. 2005. “Spatial-Horizontal Inequality and the Maoist Conflict in Nepal.” Review of Development Economics 9 (1): 121–34. https://doi.org/10.1111/j.1467-9361.2005.00267.x.Search in Google Scholar
Natalini, Davide, Aled Jones, and Giangiacomo Bravo. 2015. “Quantitative Assessment of Political Fragility Indices and Food Prices as Indicators of Food Riots in Countries.” Sustainability 7 (4): 4360–85, https://doi.org/10.3390/su7044360.Search in Google Scholar
Newman, Edward. 2018. “Hungry or Hungry for Change? Food Riots and Political Conflict, 2005-2015.” Studies in Conflict & Terrorism 43 (4): 300–24. https://doi.org/10.1080/1057610x.2018.1454042.Search in Google Scholar
Østby, Gudrun. 2013. “Inequality and Political Violence: A Review of the Literature.” International Areas Studies Review 16 (2): 206–31. https://doi.org/10.1177/2233865913490937.Search in Google Scholar
Raleigh, Clionadh, Hyun Jin Choi, and Dominic Kniveton. 2015. “The Devil Is in the Details: An Investigation of the Relationships between Conflict, Food Price and Climate across Africa.” Global Environmental Change 32 (May): 187–99. https://doi.org/10.1016/j.gloenvcha.2015.03.005.Search in Google Scholar
Roemer, John E. 1998. Equality of Opportunity. Cambridge MA: Harvard University Press.10.4159/9780674042872Search in Google Scholar
Rudolfsen, Ida. 2020. “Food Insecurity and Domestic Instability: A Review of the Literature.” Terrorism and Political Violence 32 (5): 921–48. https://doi.org/10.1080/09546553.2017.1418334.Search in Google Scholar
Rudolfsen, Ida. 2021. “Food Price Increase and Urban Unrest: The Role of Societal Organizations.” Journal of Peace Research 58 (2): 215–30. https://doi.org/10.1177/0022343319899705.Search in Google Scholar
Rudolfsen, Ida. 2023. “Food Insecurity and Unrest Participation: Evidence from Johannesburg, South Africa.” International Studies Quarterly 67 (3). https://doi.org/10.1093/isq/sqad069.Search in Google Scholar
Sen, Amartya K.. 2008. “Violence, Identity and Poverty.” Journal of Peace Research 45 (1): 5–15. https://doi.org/10.1177/0022343307084920.Search in Google Scholar
Smith, Todd. 2014. “Feeding Unrest: Disentangling the Causal Relationship between Food Price Shocks and Sociopolitical Conflict in Urban Africa.” Journal of Peace Research 51 (6): 679–95. https://doi.org/10.1177/0022343314543722.Search in Google Scholar
Stewart, Frances. 2000. “Crisis Prevention: Tackling Horizontal Inequalities.” Oxford Development Studies 28 (3): 245–62. https://doi.org/10.1080/713688319.Search in Google Scholar
Urdal, Henrik. 2006. “A Clash of Generations? Youth Bulges and Political Violence.” International Studies Quarterly 50 (3): 607–29. https://doi.org/10.1111/j.1468-2478.2006.00416.x.Search in Google Scholar
Urdal, Henrik, and Kristian Hoelscher. 2012. “Explaining Urban Social Disorder and Violence: An Empirical Study of Event Data from Asian and Sub-saharan African Cities.” International Interactions 38 (4): 512–28. https://doi.org/10.1080/03050629.2012.697427.Search in Google Scholar
Vogt, Manuel, Nils-Christian Bormann, Seraina Rüegger, Lars-Erik Cederman, Philipp Hunziker, and Luc Girardin. 2015. “Integrating Data on Ethnicity, Geography, and Conflict: The Ethnic Power Relations Data Set Family.” Journal of Conflict Resolution 59 (7): 1327–42. https://doi.org/10.1177/0022002715591215.Search in Google Scholar
Weinberg, Joe, and Ryan Bakker. 2014. “Let Them Eat Cake: Food Prices, Domestic Policy and Social Unrest.” Conflict Management and Peace Science 32 (3): 309–26. https://doi.org/10.1177/0738894214532411.Search in Google Scholar
World Bank. 2021. “World Development Indicators.” https://datacatalog.worldbank.org/dataset/world-development-indicators.Search in Google Scholar
© 2025 the author(s), published by De Gruyter, Berlin/Boston
This work is licensed under the Creative Commons Attribution 4.0 International License.
Articles in the same Issue
- Frontmatter
- Survey or Review
- University-Government-Foundation Collaboration on Arms Control and Security Policy in the United States from Truman to Trump
- Research Articles
- “You don’t Pay Your Bills You Get No Protection”: A Trump Effect on NATO Members’ Military Expenditures?
- Online Interest in Radical Islam and Terrorist Attacks
- The Red Sea Conflict and Market Reactions: Examining the Role of Military Strength in Financial Markets
- How Inequality and Repression Affect the Link Between Food Insecurity and Urban Social Disorder