
Association between multidimensional poverty intensity and maternal mortality ratio in Madagascar: Analysis of regional disparities
-
Hery Sylvestre Bemanana
 ,
Angelina Vavisoa
,
Angelina Vavisoa

Abstract
Introduction
Maternal mortality remains a pressing public health concern in Madagascar, with an estimated 408 deaths per 100,000 live births. This study examines whether regional variations in the intensity of multidimensional poverty are associated with the maternal mortality ratio (MMR).
Methods
We analyzed data from the Third General Population and Housing Census across 22 regions. A cross-sectional approach was used to assess household deprivation and MMRs. Multidimensional poverty was measured using nine indicators across three dimensions – education, health, and living conditions – following the Alkire-Foster method. A simple linear regression model was developed using R version 4.4.2 to test the association between the intensity of multidimensional poverty and MMR.
Results
A strong positive correlation was observed between the intensity of multidimensional poverty and MMR (r = 0.642, p < 0.001), explaining 41.2% of the variation. Rural regions exhibited significantly higher multidimensional poverty index (MPI) and MMR values than urban ones. A one-point increase in MPI was associated with an average rise of 24 maternal deaths per 100,000 live births.
Conclusion
Multidimensional poverty intensity is strongly associated with maternal mortality in Madagascar. These findings underscore the need for targeted policies addressing structural deprivation to improve maternal health outcomes, particularly in high-poverty rural regions.
1 Introduction
Maternal mortality remains an important public health challenge, particularly in low-income countries. According to the report, produced by the United Nations Maternal Mortality Estimation Inter-Agency Group, approximately 260,000 maternal deaths were recorded in 2023 [1], with a significant proportion occurring in sub-Saharan Africa [1,2]. Within the region, a small group of countries – such as Seychelles, Cabo Verde, and Mauritius – have achieved low maternal mortality ratios (MMRs) (below 100 per 100,000 live births), often thanks to sustained investments in universal health coverage and skilled care [3,4]. In contrast, countries like Nigeria, Chad, and South Sudan continue to report extremely high rates – exceeding 1,000 deaths – highlighting persistent systemic failures [3]. The majority of countries fall into the high-to-moderate category, with rates between 100 and 499 per 100,000 live births. Madagascar, with an MMR of 408 deaths per 100,000 live births [5], is among them – well above the sustainable development goal target of fewer than 70 deaths by 2030 [6]. Despite efforts to improve access to obstetric care, persistent inequalities driven by economic, social, and structural factors continue to hinder progress [7,8].
To better understand these persistent disparities, it is essential to look beyond the health sector and consider the broader structural determinants that shape maternal health outcomes. Maternal deaths often result not only from limited access to obstetric services but also from deeper, interrelated forms of disadvantage – such as poor education, gender inequality, and precarious living conditions – that accumulate over time [9]. Addressing maternal mortality, therefore, requires an analytical framework capable of capturing these overlapping and compounding deprivations. In this regard, multidimensional poverty offers a comprehensive lens to assess how these interconnected disadvantages contribute to maternal vulnerability [10].
Multidimensional poverty, as defined by Alkire and Foster [10], represents an approach that extends beyond monetary measures to assess simultaneous deprivations in multiple essential dimensions of wellbeing. It encompasses cumulative deprivations in areas such as education, health, and living conditions. For example, using clearly defined thresholds, a household can be considered multidimensionally poor if it lacks access to clean water, has children outside of school, or experiences malnutrition among its members. This approach, inspired by Sen’s [11] capability framework, recognizes that poverty extends beyond income deprivation to reflect constraints on fundamental freedoms and opportunities. It aligns with Dahlgren and Whitehead’s [12] model of social determinants of health, which highlights how structural factors influence population health outcomes.
It should be noted that the intensity of multidimensional poverty corresponds to the weighted proportion of indicators in all dimensions in which households experience deprivation on average [10]. Thus, higher levels of deprivation reflect greater poverty intensity. In this context, it is essential to examine the extent to which household deprivation levels explain Madagascar’s high MMR. The impact of economic conditions on maternal health has been well established in previous research, particularly by Say and Raine [7], who demonstrated healthcare access inequalities in developing countries. Sen’s [11] capability approach provides complementary insights into the underlying mechanisms, emphasizing that poverty represents not only income absence but also constrained fundamental freedoms and opportunities. Consequently, women experiencing multidimensional poverty face structural barriers in accessing adequate obstetric care, increasing their risk of maternal complications [13].
Furthermore, Thaddeus and Maine’s three delay model [14,15] offers a relevant conceptual framework for understanding how multidimensional poverty directly and indirectly influences maternal mortality. This model identifies three delays in the management of obstetric complications: the decision to seek care, access to health services, and receiving appropriate medical treatment. The high intensity of poverty can affect all three levels by limiting the ability to recognize complication signs, reducing their geographical and financial access to healthcare facilities, and compromising service quality [16,17,18].
Research by Filippi et al. [13] demonstrated that precarious living conditions exacerbate obstetric complications, while Alkire and Housseini [16] established links between multidimensional poverty and increased maternal mortality in sub-Saharan Africa. These findings underscore the need for empirical analysis of this relationship in the Malagasy context, where few studies have specifically examined the association between multidimensional poverty and maternal mortality. This study addresses this gap by proposing a multidimensional analysis adapted to Madagascar’s local realities.
Therefore, the study has two main objectives: first, to assess whether the intensity of multidimensional poverty is associated with MMR; and second, to explore the underlying mechanisms of this relationship. Its originality lies in an integrated approach that combines quantitative analysis of this relationship with a robust theoretical foundation.
2 Materials and methods
2.1 Study setting
Madagascar, an island nation in the Indian Ocean, exhibits geographical and climatic conditions that profoundly influence the livelihoods of the population. Although endowed with opportunities in fishing, agriculture, and tourism, the country remains highly vulnerable to natural disasters, particularly cyclones and floods, which recurrently destroy crops, housing, and infrastructure. These climatic shocks exacerbate the challenges of accessing clean water and sanitation, disproportionately affecting coastal and rural regions.
Socioculturally, perceptions of wealth and poverty vary across contexts: urban areas associate wealth with material possessions, whereas rural communities link it to productive assets like livestock. This divergence shapes living conditions and housing standards. Demographically, 63.4% of the population is under 25 years of age, with 75% residing in rural areas, a demographic profile that presents both developmental potential and challenges in education, employment, and healthcare.
Despite government and international efforts to alleviate poverty through initiatives such as the poverty reduction strategy paper and the national development plan, 75% of the population lived in poverty in 2018, with marked regional disparities. Climate-vulnerable regions face acute deprivation, while others benefit from more favorable natural or economic resources. Persistent gaps in education, healthcare, and basic services necessitate tailored strategies to reduce inequality.
2.2 Data sources and study period
This study draws on data from Madagascar’s Third General Population and Housing Census (GPHC-3), conducted in 2018 by the National Institute of Statistics (INSTAT). As a comprehensive and nationwide census, it covered the entire resident population, regardless of age, gender, or socioeconomic status. The census collected detailed information at both the individual and household levels, encompassing demographic, educational, economic, and health-related variables. The dataset provides regionally disaggregated data across all 22 administrative regions of the country, offering a robust basis for spatially nuanced analyses. The reference period for most variables corresponds to the 12 months preceding the census, which ensures temporal relevance for examining maternal health outcomes and related socioeconomic conditions.
2.3 Study design and population
The study followed a cross-sectional descriptive design, based on the full GPHC-3 dataset. The analysis focused on two distinct but complementary populations.
To estimate maternal mortality, the study considered all reported deaths of women aged 15–49 during the reference period. As maternal mortality was identified through household reports, the census provided a comprehensive and regionally disaggregated dataset, allowing for spatial analysis of maternal deaths in relation to socioeconomic indicators.
Multidimensional poverty was assessed at the household level to reflect the structural deprivations influencing maternal health access. Given the collective nature of poverty indicators (education, health, and living standards), the household was the most appropriate unit of measurement. Individual-level maternal mortality data were then aggregated by region and linked to corresponding regional multidimensional poverty index (MPI) estimates. This alignment enabled geographic comparisons and the exploration of socioeconomic inequalities associated with maternal health outcomes.
2.4 Components and weighting of multidimensional poverty indicators
To measure multidimensional poverty in Madagascar, we applied the Alkire-Foster methodology, which allows for the identification of households experiencing simultaneous deprivations across several critical domains of well-being. This method is well-suited to the Malagasy context, where poverty is not limited to income scarcity but includes overlapping deficits in education, health, and basic living conditions.
The MPI used in this study draws upon nine indicators grouped into three dimensions: health, education, and living conditions. Each of these dimensions contributes equally to the composite index, accounting for one-third of the total weight. However, the indicators within each dimension are weighted unequally to reflect both their empirical importance and theoretical relevance, in line with international standards and national priorities.
As shown in Table 1, the health dimension comprises two indicators. The first measures whether the household lacks access to clean drinking water. The second considers whether at least one child under the age of 18 has died within the household. Each of these indicators carries a weight of one-sixth, contributing equally to the health dimension and jointly representing 33.3% of the total index.
Dimensions, indicators, and weights used to construct the MPI
| Dimensions | Indicators | Weight |
|---|---|---|
| Health (weight = 1/3) | No access to clean drinking water | 1/6 = 16.66% |
| One or more children under the age of 18 have died | 1/6 = 16.66% | |
| Education (weight = 1/3) | No individual aged 11 or over has completed 5 years of schooling | 1/6 = 16.66% |
| At least one school-age child (6–10 years old) does not attend school | 1/6 = 16.66% | |
| Living conditions (Weight = 1/3) | Dirty cooking fuel | 1/15 = 6.66% |
| No access to adequate sanitation facilities | 1/15 = 6.66% | |
| No electricity | 1/15 = 6.66% | |
| Housing with a floor, roof, or walls made of rudimentary materials | 1/15 = 6.66% | |
| The household does not own a car, van, or similar motor vehicle but owns at most one of the following: A bicycle, motorcycle, radio, refrigerator, telephone, or television | 1/15 = 6.66% | |
| Total | 100% |
Source: INSTAT, 2021.
The education dimension also includes two indicators of equal weight. The first assesses whether no individual aged 11 or older in the household has completed at least 5 years of schooling. The second captures whether at least one child of primary school age (6–10 years) is not attending school. These two indicators are each weighted at one-sixth, bringing the total weight of the education dimension to 33.3%.
The living conditions dimension is composed of five indicators, each contributing equally within this dimension. These include the use of dirty cooking fuel, lack of access to adequate sanitation facilities, lack of electricity, poor quality housing materials (floor, roof, or walls made of rudimentary materials), and limited ownership of essential assets. Specifically, households that do not own a car, van, or similar motor vehicle and possess at most one of the following items – bicycle, motorcycle, radio, refrigerator, telephone, or television – are considered deprived in this last indicator. Each of these five indicators is weighted at one-fifteenth, collectively contributing one-third to the overall index.
Each household’s deprivation score was computed by summing the weights of the indicators for which it was deprived. This score reflects the proportion of weighted deprivations experienced by the household. Based on their total score, households were then categorized using thresholds commonly applied in multidimensional poverty research. Households with a deprivation score equal to or greater than 33.3% were classified as multidimensionally poor. Those with scores between 20 and 33.3% were considered vulnerable to multidimensional poverty. A more severe category, defined as extreme multidimensional poverty, was assigned to households with deprivation scores equal to or exceeding 50%.
This structure allows for a nuanced understanding of poverty by distinguishing not only who is poor but also the depth and severity of deprivation. The computation of the MPI, including the headcount ratio and intensity measures, is presented in the following section.
2.5 Computation of the MPI
The MPI used in this study builds on the two standard components of the Alkire-Foster framework: the headcount ratio (H) and the intensity of deprivation among the poor (A). These two elements provide complementary information. While the headcount ratio identifies the proportion of the population classified as poor, the intensity captures how many weighted deprivations poor households experience on average.
The headcount ratio, denoted H, is calculated by dividing the number of individuals living in multidimensionally poor households (q) by the total population (n). It expresses the incidence of multidimensional poverty:
The intensity of poverty, denoted A, corresponds to the average deprivation score among those identified as multidimensionally poor. It is computed by summing the individual deprivation scores of poor households and dividing the total by the number of poor individuals. This measure reflects the breadth and severity of deprivation among the poor.
The final MPI is the product of these two components:
This composite index thus integrates both the prevalence and depth of multidimensional poverty within the population. By design, it enables comparisons across regions and groups, and provides a basis for analyzing associations with other variables, as developed in the subsequent analytical section.
2.6 Study variables
This study focused primarily on two main variables: the intensity of multidimensional poverty and the MMR.
2.7 Dependent variable: Maternal mortality (denoted y)
The maternal mortality variable represents the MMR, defined as the number of maternal deaths per 100,000 live births among women of reproductive age (15–49 years). In our model, this numerical rate variable was calculated at the regional level and served as the dependent variable. The MMR estimation followed standard epidemiological protocols, encompassing deaths during pregnancy, childbirth, or within 42 days after delivery termination, in line with the WHO definition.
2.8 Independent variable: Multidimensional poverty intensity (denoted x)
The main explanatory variable is the intensity of multidimensional poverty, derived from the Alkire–Foster methodology. This variable captures the average proportion of weighted deprivations experienced by individuals classified as multidimensionally poor. The MPI was constructed using nine binary indicators grouped into three equally weighted dimensions: health, education, and living conditions. These indicators were operationalized from GPHC-3 data using standard definitions – for example, households were considered deprived in health if they lacked access to improved drinking water or reported the death of a child under 18.
The weighting scheme (1/3 per dimension; 1/6 or 1/15 per indicator) and the deprivation thresholds (≥33.3% for poverty, ≥50% for extreme poverty) follow the standard Alkire–Foster method. As such, our approach ensures both methodological rigor and comparability with existing MPI-based studies. Full details on indicator definitions, data sources, and scoring are provided in the dedicated section on the components and weighting of the MPI.
2.9 Statistical analysis
Data analysis was conducted using R software version 4.4.2, which facilitated data processing and adjustment of the statistical model. A simple linear model was constructed to examine the relationship between the intensity of multidimensional poverty (x) and the MMR (y). In this analysis, critical thresholds were defined to assess the quality of the model’s fit and the strength of the relationship between the variables.
A coefficient of determination R 2 ≥ 30% is considered acceptable, which means that the model explains at least 30% of the data variability. A correlation coefficient r > 50% indicates a strong relationship, highlighting a significant linear correlation between the variables studied. Lastly, a threshold of p < 5% ensures statistical significance, confirming that the results obtained are unlikely to be due to chance. These criteria are applied to validate the relevance and robustness of the findings in this analysis. The model can be expressed by the following equation:
where β0 is the intercept, representing the value of y when x = 0, β1 is the coefficient of the independent variable x, measuring the impact of the intensity of multidimensional poverty on the MMR, ϵ is the error term that captures unobserved factors that influence y but are not explained by x.
2.10 Evaluation of results
Evaluation of the results included the analysis of coefficient statistics, providing estimates, standard errors, as well as t and p values for each explanatory variable. A residual analysis was also conducted to verify the assumptions of normality and homoscedasticity, which are essential for the validity of linear regression models.
-
Ethical considerations: Although this study was exempted from formal ethical approval by the Madagascar National Ethics Committee, as it was based on anonymized and publicly available data from the GPHC-3, it adhered to Law No. 2014-006 on the protection of personal data. The study strictly followed the fundamental principles of scientific rigor, data integrity, and respect for privacy. The analyzed information was processed anonymously to ensure participant confidentiality, according to the prevailing ethical standards.
3 Results
3.1 Regional disparities in multidimensional poverty and maternal mortality
The results (Table 2) highlighted significant disparities in multidimensional poverty and MMR in Madagascar, depending on the place of residence and the region. The MPI, which combines the poverty rate and intensity, ranged from 0.150 in Analamanga to 0.592 in Atsimo Atsinanana. Similarly, the MMR varied from 159 deaths per 100,000 live births in Itasy to 928 in Vatovavy Fitovinany. These marked variations suggest a potential relationship between poverty severity and maternal mortality outcomes.
MMR and distribution of households (%) according to the multidimensional poverty measure and classification
| Geographical level | MMR | Multidimensional poverty measure | Multidimensional poverty classification | Total (%) | Number of households | |||||
|---|---|---|---|---|---|---|---|---|---|---|
| Poverty rate | Poverty intensity | MPI | Not vulnerable to poverty (%) | Vulnerable to poverty (%) | Poor (%) | Extreme poverty (%) | ||||
| Residence area | ||||||||||
| Urban | 312 | 31.3 | 48.2 | 0.151 | 41.5 | 27.2 | 17.5 | 13.8 | 100 | 1,280,030 |
| Rural | 426 | 83.7 | 56.3 | 0.472 | 4.4 | 11.9 | 25.1 | 58.6 | 100 | 4,799,846 |
| Region | ||||||||||
| Alaotra Mangoro | 366 | 76.9 | 52.1 | 0.4 | 6 | 17.1 | 33.1 | 43.8 | 100 | 297,267 |
| Amoron’i Mania | 439 | 82.1 | 54.1 | 0.444 | 5.9 | 12 | 28.9 | 53.2 | 100 | 173,32 |
| Analamanga | 215 | 32 | 46.8 | 0.15 | 40.2 | 27.8 | 19.1 | 12.9 | 100 | 896,823 |
| Analanjirofo | 336 | 76.9 | 49 | 0.377 | 3.4 | 19.6 | 39.5 | 37.4 | 100 | 322,758 |
| Androy | 243 | 95.2 | 61.8 | 0.588 | 1.2 | 3.7 | 13.5 | 81.7 | 100 | 200,268 |
| Anosy | 566 | 87.7 | 63.1 | 0.553 | 4.3 | 7.9 | 12.7 | 75 | 100 | 189,986 |
| Atsimo Andrefana | 642 | 85.1 | 62 | 0.527 | 6.7 | 8.2 | 13.7 | 71.4 | 100 | 416,441 |
| Atsimo Atsinanana | 503 | 94.5 | 62.7 | 0.592 | 1.5 | 4.1 | 13.4 | 81 | 100 | 198,145 |
| Atsinanana | 471 | 69.7 | 56.4 | 0.393 | 16.7 | 13.6 | 18.3 | 51.4 | 100 | 375,471 |
| Betsiboka | 405 | 83.4 | 58.8 | 0.49 | 7.1 | 9.5 | 18.1 | 65.3 | 100 | 88,606 |
| Boeny | 290 | 66.1 | 58.9 | 0.39 | 17.9 | 15.9 | 16.1 | 50 | 100 | 229,731 |
| Bongolava | 249 | 74.9 | 53.8 | 0.403 | 8.1 | 17 | 28.5 | 46.4 | 100 | 150,596 |
| Diana | 229 | 66.4 | 51.5 | 0.342 | 15.2 | 18.4 | 28.9 | 37.5 | 100 | 253,261 |
| Haute Matsiatra | 578 | 78.7 | 54.6 | 0.429 | 9.9 | 11.4 | 25 | 53.7 | 100 | 296,552 |
| Ihorombe | 626 | 86.2 | 61.7 | 0.532 | 6.1 | 7.7 | 15.2 | 71 | 100 | 91,602 |
| Itasy | 159 | 73.3 | 51.8 | 0.379 | 7.6 | 19.2 | 30.2 | 43 | 100 | 204,827 |
| Melaky | 791 | 91.1 | 64.6 | 0.588 | 4 | 4.9 | 11 | 80.1 | 100 | 69,569 |
| Menabe | 797 | 82.4 | 60.4 | 0.498 | 7.2 | 10.4 | 17.9 | 64.5 | 100 | 161,822 |
| Sava | 308 | 74.9 | 49.3 | 0.369 | 5.2 | 19.9 | 37.9 | 37 | 100 | 309,552 |
| Sofia | 339 | 82.3 | 53.1 | 0.437 | 3.7 | 14 | 31.4 | 50.9 | 100 | 375,861 |
| Vakinankaratra | 200 | 77.8 | 54 | 0.42 | 8.2 | 14 | 28 | 49.8 | 100 | 464,53 |
| Vatovavy Fitovinany | 928 | 91.3 | 59.2 | 0.541 | 2.3 | 6.4 | 18.8 | 72.5 | 100 | 312,888 |
| MADAGASCAR | 408 | 72.7 | 55.6 | 0.404 | 12.2 | 15.1 | 23.5 | 49.2 | 100 | 6,079,876 |
Source: INSTAT, 2021.
3.2 Urban–Rural contrasts
A stark contrast was observed between urban and rural settings (Table 2). In urban areas, the MPI was 0.151, reflecting a poverty rate of 31.3% and an intensity of 48.2%. Urban households had a higher likelihood of not being vulnerable to poverty (41.5%) and exhibited an MMR of 312. In rural areas, the MPI reached 0.472, with a much higher poverty rate of 83.7% and a greater intensity of 56.3%. In these settings, only 4.4% of households were not vulnerable to poverty, and MMR reached 426 deaths per 100,000 live births.
3.3 Regions facing extreme poverty and high maternal mortality
As shown in Table 2, some regions showed critical levels of deprivation and mortality. Vatovavy Fitovinany had the highest MMR in the country (928) and an MPI of 0.541, with more than 72.5% of households living in extreme poverty. Melaky and Androy also revealed alarmingly high MPI values (0.588 each), with MMRs of 791 and 243, respectively. In these regions, over 80% of households lived in extreme poverty (80.1% in Melaky, 81.7% in Androy). Anosy (MMR: 566, MPI: 0.553) and Ihorombe (MMR: 626, MPI: 0.532) also demonstrated similarly high burdens.
3.4 Regions with moderate poverty and lower maternal mortality
In contrast, some regions showed more moderate poverty levels and lower MMR (Table 2). Analamanga, the capital region, had the lowest MPI (0.150), a multidimensional poverty intensity of 46.8% and an MMR of 215 deaths per 100,000 births. Boeny and Diana, with MPIs of 0.390 and 0.342, respectively, reported lower MMRs, at 290 and 229 deaths per 100,000 births. In these regions, a higher proportion of households were classified as nonvulnerable to poverty (40.2% in Analamanga, 17.9% in Boeny, and 15.2% in Diana).
3.5 Association between poverty intensity and maternal mortality
A cross-regional analysis revealed a consistent pattern: regions where over 50% of households lived in extreme poverty also experienced elevated MMR. For instance, in Atsimo Atsinanana (MMR: 503, extreme poverty: 81%), Menabe (MMR: 797, extreme poverty: 64.5%), and Betsiboka (MMR: 405, extreme poverty: 65.3%), the intensity of deprivation coincided with some of the highest MMRs nationally (Table 2).
3.6 Statistical modeling: Linking maternal mortality and poverty intensity
The scatter plot in Figure 1 illustrates the positive association between MMR and multidimensional poverty intensity using a linear regression model. The equation MMR = −950.67 + 24.4 × Poverty Intensity produced an R 2 of 0.412, indicating that 41.2% of the variability in MMR was explained by the intensity of multidimensional poverty. The Pearson correlation coefficient was r = 0.642 (p < 0.001). Regions such as Vatovavy Fitovinany, Melaky, and Menabe were positioned in the upper-right quadrant of the scatter plot, indicating simultaneous high values of both indicators. In contrast, Itasy and Analamanga appeared in the lower-left quadrant.
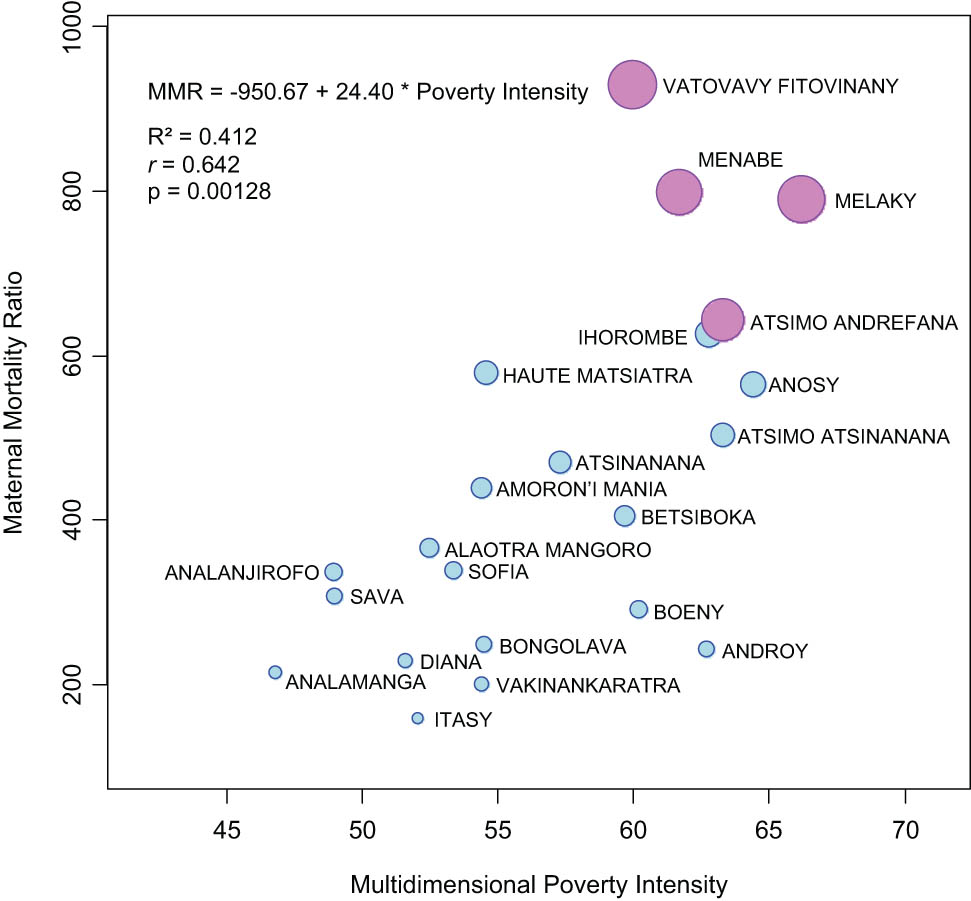
Correlation between MMR and multidimensional poverty intensity.
3.7 Residual diagnostics and model validity
The residual diagnostics, presented in Figure S1, provide additional support for the robustness of the regression model. The QQ plot indicated that most residuals aligned closely with the normality line, with only minor deviations at the extremes. The plot of residuals versus fitted values showed no discernible pattern, suggesting a reasonably homogeneous distribution of errors around zero and confirming the assumption of homoscedasticity. The histogram of residuals was centered near zero, with a slight skewness and values ranging approximately from –400 to +400. The Cook’s distance plot identified a few potentially influential observations, some approaching 0.2, but none exceeded the conventional threshold, indicating that no single data point had an undue influence on the model’s estimates.
4 Discussion
The objective of this study is to determine the association between multidimensional poverty and maternal mortality in Madagascar through a secondary analysis of data from GPHC-3. The results highlight a significant relationship between these two variables, particularly in rural areas and specific regions. These findings are in line with the larger global context, where the social determinants of maternal health, particularly in low-income countries, are increasingly being studied [19,20,21]. Multidimensional poverty, which encompasses not only aspects related to decent living conditions, but also access to education and healthcare [16], appears to be a key factor in explaining disparities in maternal mortality.
The results reveal a clear urban–rural divide, with significantly lower levels of multidimensional poverty and maternal mortality in urban areas compared to rural ones. These findings are consistent with recent studies that highlight that rural areas in developing countries are often more affected by multidimensional poverty due to limited access to basic services, education, and healthcare infrastructure [22]. For example, a study conducted in sub-Saharan Africa showed that rural women have more limited access to maternal healthcare, increasing the risk of complications during pregnancy and childbirth [23,24,25]. Similarly, a recent study in Nigeria [26] revealed that rural areas had significantly higher MMRs than urban areas due to poverty and the remoteness of health centers.
However, some studies indicate that the disparities between urban and rural areas are not always as pronounced. For example, a study in India [8] found that impoverished urban areas exhibited MMR similar to those in rural areas due to overcrowding and limited access to health services in urban slums. This suggests that multidimensional poverty, rather than the simple urban-rural distinction, is a key factor in explaining disparities in maternal mortality [16].
Certain regions of Madagascar illustrate a concerning overlap of high multidimensional poverty and elevated maternal mortality, with some – despite similar poverty levels and limited access to skilled birth attendance – showing markedly different mortality outcomes, underscoring the complexity of underlying contextual and systemic factors. This discrepancy suggests the possible influence of additional elements, such as a lower prevalence of obstetric complications, protective community practices, or alternative forms of healthcare care. Further analysis would be necessary to determine the exact causes.
These findings are consistent with other studies showing that regions with more intense poverty tend to have higher rates of maternal mortality. For example, a multi-country ecological study across 54 African nations found that the average MMR in Sub-Saharan Africa was approximately 415 deaths per 100,000 live births, with significantly higher rates clustered in the poorest countries – such as Guinea-Bissau, Sierra Leone, Chad and Cote d’Ivoire [27], highlighting the universal nature of the link between poverty and maternal mortality. Similarly, a study in Ethiopia demonstrated that the poorest regions had significantly higher MMR than the less impoverished regions due to limited access to healthcare and education [28].
On the contrary, some studies suggest that the relationship between poverty and maternal mortality is not always linear. For example, certain African contexts have shown that, despite high levels of poverty, regions with well-implemented maternal health programs and strong community engagement can achieve relatively low MMRs [29]. This suggests that targeted interventions can mitigate the impact of poverty on maternal mortality, even in the poorest regions.
In contrast, some regions of Madagascar exhibit lower levels of poverty and lower MMR. For example, Analamanga, the capital region, has the lowest MPI (0.150), a multidimensional poverty intensity of 46.8%, and an MMR of 215 deaths per 100,000 births. Boeny and Diana, with MPI scores of 0.390 and 0.342, respectively, display lower MMRs of 290 and 229 deaths per 100,000 births. In these regions, a larger proportion of households are classified as nonvulnerable to poverty (40.2% in Analamanga, 17.9% in Boeny, and 15.2% in Diana).
These results align with studies showing that urban areas, particularly capital cities, often benefit from better healthcare infrastructure and easier access to maternal health services [30]. For example, a study conducted in the Kigoma region of western Tanzania estimated the MMR at 606 per 100,000 live births, with a rate of 447 in urban areas and 638 in rural areas [31].
However, some studies suggest that urban areas are not always spared from high rates of maternal mortality. For example, a study in South Africa found that impoverished urban areas had MMR similar to rural areas due to overcrowding and limited access to healthcare services in urban slums [32].
Linear regression analysis reveals a positive relationship between the intensity of multidimensional poverty and MMR (R² = 0.412). This indicates that 41.2% of the variability in MMR can be explained by the intensity of poverty. This correlation is consistent with other studies that highlight that multidimensional poverty, particularly limited access to clean water, education, and healthcare, is a key determinant of maternal mortality. For example, a study in Ghana found that women living in impoverished households had a significantly higher risk of maternal mortality due to restricted access to health care and education [33].
However, some studies suggest that the relationship between poverty and maternal mortality may be influenced by other factors, such as cultural norms and traditional practices. For example, a study in Pakistan found that cultural norms regarding gender roles and traditional childbirth practices could influence MMR independently of poverty levels [34]. This suggests that interventions aimed at reducing maternal mortality should consider not only poverty, but also cultural and social factors.
Taken together, these findings address the two central objectives stated in the introduction. The statistically significant association between multidimensional poverty intensity and maternal mortality confirms that cumulative structural deprivations are linked to increased maternal risk in Madagascar. In addition, the consistent regional and urban–rural disparities observed highlight the mechanisms through which these deprivations operate – most notably through limited access to education, basic services, and skilled care. These results validate the relevance of a multidimensional poverty framework in analyzing maternal vulnerability and shaping targeted policy responses.
Although our study provides valuable insights into the relationship between multidimensional poverty and maternal mortality in Madagascar, several limitations should be considered. First, the analysis is based on cross-sectional census data, which limits causal inference – observed associations cannot confirm directionality. The data rely on household self-reporting, which may introduce reporting biases or underreporting, particularly concerning maternal deaths, with potential variation by region and literacy level. Moreover, the computation of the MPI involves methodological assumptions, such as equal weighting of dimensions, selection of specific indicators, and fixed deprivation thresholds, which may affect the sensitivity of regional comparisons.
Second, certain relevant variables – such as cultural practices, health-seeking behaviors, quality of obstetric care, or local health policy implementation – were not captured in the census and thus could not be included in the analysis. As a result, residual confounding cannot be ruled out, as these unmeasured factors may independently influence both maternal mortality and poverty levels. Future research should consider longitudinal and qualitative approaches to better identify causal pathways and understand the sociocultural mechanisms underlying maternal vulnerability, in order to inform more context-specific and effective interventions.
However, the findings suggest that interventions to reduce maternal mortality should focus on regions with the highest poverty levels, such as Vatovavy Fitovinany, Melaky, and Androy. Targeted interventions, such as the training of traditional birth attendants inspired by the Rwandan model [35], could be adapted to the Malagasy regions. For example, sterile delivery kits and awareness campaigns led by community leaders and health agents could help reduce waiting times in seeking care.
Furthermore, since rural areas exhibit higher rates of poverty and maternal mortality, it is crucial to strengthen healthcare services in these regions. This could involve training healthcare personnel, improving health infrastructure, and implementing maternal health awareness programs. For example, a study in Rwanda demonstrated that the establishment of community health centers in rural areas significantly reduced MMRs [35].
5 Conclusion
This study highlights a significant relationship between multidimensional poverty and maternal mortality in Madagascar, particularly in rural areas and certain specific regions. The results show marked disparities between urban and rural areas, with MMR considerably higher in regions where poverty is more severe. These inequalities are located within a global context where the social determinants of maternal health, such as access to education, healthcare, and sanitation infrastructure, play a crucial role.
Areas marked by high levels of multidimensional poverty tend to exhibit particularly high MMR, highlighting the need for targeted interventions. In contrast, urban areas with lower poverty levels generally report lower maternal mortality, emphasizing the critical role of access to health services and infrastructure in reducing such mortality.
To address this, it is essential to implement policies and programs targeting the most vulnerable regions. This includes strengthening healthcare infrastructure, training healthcare personnel, improving access to education and clean water, and conducting maternal health awareness campaigns. Additionally, considering cultural and social factors that influence health behavior is vital in designing interventions that are adapted to local realities.
In sum, this study highlights a strong association between multidimensional poverty and maternal mortality in Madagascar, particularly in rural and underserved areas. While causal inference is limited by the cross-sectional nature of the data, the observed patterns suggest that addressing overlapping deprivations – especially in education, health access, and living conditions – could play a crucial role in reducing maternal vulnerability. Reducing maternal mortality will therefore require integrated strategies that are sensitive to both socioeconomic inequalities and territorial disparities, ensuring equitable access to quality maternal healthcare for all women, regardless of their background or place of residence.
Acknowledgments
The authors sincerely appreciate the insightful comments and constructive suggestions provided by the reviewers. Their valuable feedback significantly contributed to enhancing the quality of this manuscript.
-
Funding information: Authors state no funding involved.
-
Author contributions: All authors contributed significantly to this study and approved the final manuscript for submission to Open Health. Each author accepts full responsibility for the scholarly content of this work. HSB led the study conception and design, developed the protocol, conducted data collection and analysis, and prepared the initial manuscript draft. AV, VR, and JCA provided critical intellectual input during manuscript development, rigorously reviewed the findings, and endorsed the final version for publication.
-
Conflict of interest: Authors state no conflict of interest.
-
Data availability statement: The datasets analyzed in this study were sourced exclusively from publicly available statistics published on the official website of Madagascar’s National Institute of Statistics (Institut National de la Statistique de Madagascar). As these constitute open-access government data, they remain freely available to all researchers through the institute’s official portals. For reference, the primary data sources can be accessed at https://instat.mg.
References
[1] World Health Organization, United Nations Children’s Fund, United Nations Population Fund, World Bank, United Nations Department of Economic, Social Affairs Population Division. Trends in maternal mortality estimates 2000 to 2023: estimates by WHO, UNICEF, UNFPA, World Bank Group and UNDESA/Population Division. Geneva: World Health Organization; 2025. p. 108.Search in Google Scholar
[2] Ekwuazi EK, Chigbu CO, Ngene NC. Reducing maternal mortality in low- and middle-income countries. Case Rep Women’s Health. 2023;39:e00542.10.1016/j.crwh.2023.e00542Search in Google Scholar PubMed PubMed Central
[3] Mutabingwa LN, Koubemba AGN, Wangou MM, Bataliack SM, Amaka OP, Konate A, et al. Maternal mortality: The urgency of a systemic and multisectoral approach in mitigating maternal deaths in Africa. Brazzaville, Republic of Congo: iAHO, WHO African Region; 2023 [cited 2025 16/07]. https://files.aho.afro.who.int/afahobckpcontainer/production/files/iAHO_Maternal_Mortality_Regional_Factsheet.pdf.Search in Google Scholar
[4] Jeetoo J, Jaunky VC. Willingness to pay to improve quality of public healthcare services in Mauritius. Healthc (Basel, Switz). 2021;10(1):43.10.3390/healthcare10010043Search in Google Scholar PubMed PubMed Central
[5] Institut National de la Statistique. RGPH3 - Niveaux tendances et caracteristiques de la mortalite à Madagascar. Antananarivo, Madagascar: INSTAT; 2021. p. 82.Search in Google Scholar
[6] United Nations General Assembly. Transforming our world: the 2030 Agenda for Sustainable Development: Draft resolution referred to the United Nations summit for the adoption of the post-2015 development agenda by the General Assembly at its sixty-ninth session. New York: A/70/L. 1, 18 September 2015. http://undocs.org/A/70/L. 1; 2015.Search in Google Scholar
[7] Say L, Raine R. A systematic review of inequalities in the use of maternal health care in developing countries: examining the scale of the problem and the importance of context. Bull World Health Organ. 2007;85(10):812–9.10.2471/BLT.06.035659Search in Google Scholar
[8] Singh A, Padmadas SS, Mishra US, Pallikadavath S, Johnson FA, Matthews Z. Socio-economic inequalities in the use of postnatal care in India. PLoS One. 2012;7(5):e37037.10.1371/journal.pone.0037037Search in Google Scholar PubMed PubMed Central
[9] Padda IUH, Hameed A. Estimating multidimensional poverty levels in rural Pakistan: A contribution to sustainable development policies. J Clean Prod. 2018;197:435–42.10.1016/j.jclepro.2018.05.224Search in Google Scholar
[10] Alkire S, Foster J. Counting and multidimensional poverty measurement. J Public Econ. 2011;95(7):476–87.10.1016/j.jpubeco.2010.11.006Search in Google Scholar
[11] Sen A. Development as freedom. Oxford, United Kingdom: Oxford University Press; 1999. p. 366.Search in Google Scholar
[12] Dahlgren G, Whitehead M. Policies and strategies to promote social equity in health. Background document to WHO - Strategy paper for Europe. Institute for Futures Studies; 1991. p. 69.Search in Google Scholar
[13] Filippi V, Chou D, Ronsmans C, Graham W, Say L. Levels and causes of maternal mortality and morbidity. In: Black RE, Laxminarayan R, Temmerman M, Walker N, editors. Reproductive, maternal, newborn, and child health: Disease control priorities. Vol. 2, 3rd edn. Washington (DC): The International Bank for Reconstruction and Development/The World Bank; 2016.10.1596/978-1-4648-0348-2_ch3Search in Google Scholar PubMed
[14] Thaddeus S, Maine D. Too far to walk: maternal mortality in context. Soc Sci Med. 1994;38(8):1091–110.10.1016/0277-9536(94)90226-7Search in Google Scholar PubMed
[15] Actis Danna V, Bedwell C, Wakasiaka S, Lavender T. Utility of the three-delays model and its potential for supporting a solution-based approach to accessing intrapartum care in low- and middle-income countries. A qualitative evidence synthesis. Glob Health Action. 2020;13(1):1819052.10.1080/16549716.2020.1819052Search in Google Scholar PubMed PubMed Central
[16] Alkire S, Housseini B. Multidimensional poverty in sub-Saharan Africa: Levels and trends. OPHI Working Papers 81, Oxford, United Kingdom: Oxford Poverty and Human Development Initiative (OPHI), University of Oxford; 2014.Search in Google Scholar
[17] Combs Thorsen V, Sundby J, Malata A. Piecing together the maternal death puzzle through narratives: The three delays model revisited. PLoS One. 2012;7(12):e52090.10.1371/journal.pone.0052090Search in Google Scholar PubMed PubMed Central
[18] Smith J, Lennon MS, Kau M, Ranjalahy AN, Ingabire L, Warren C, et al. Harnessing the power of behavioral science: an implementation pilot to improve the quality of maternity care in Rural Madagascar. Glob Health: Sci Pract. 2023;11(Supplement 1):e2300007.10.9745/GHSP-D-23-00007Search in Google Scholar PubMed PubMed Central
[19] United Nations Maternal Mortality Estimation Inter-agency Group. Trends in maternal mortality 2000 to 2020: estimates by WHO, UNICEF, UNFPA, World Bank Group and UNDESA/Population Division. Geneva: World Health Organization; 2023. p. 86.Search in Google Scholar
[20] Grobman WA, Entringer S, Headen I, Janevic T, Kahn RS, Simhan H, et al. Social determinants of health and obstetric outcomes: A report and recommendations of the workshop of the Society for Maternal-Fetal Medicine. Am J Obstet Gynecol. 2024;230(2):B2–16.10.1016/j.ajog.2023.10.013Search in Google Scholar PubMed
[21] Souza JP, Day LT, Rezende-Gomes AC, Zhang J, Mori R, Baguiya A, et al. A global analysis of the determinants of maternal health and transitions in maternal mortality. Lancet Glob Health. 2024;12(2):e306–16.10.1016/S2214-109X(23)00468-0Search in Google Scholar PubMed
[22] Liu Y, Xu Y. A geographic identification of multidimensional poverty in rural China under the framework of sustainable livelihoods analysis. Appl Geogr. 2016;73:62–76.10.1016/j.apgeog.2016.06.004Search in Google Scholar
[23] Gazeley U, Reniers G, Eilerts-Spinelli H, Prieto JR, Jasseh M, Khagayi S, et al. Women’s risk of death beyond 42 days post partum: a pooled analysis of longitudinal Health and Demographic Surveillance System data in sub-Saharan Africa. Lancet Glob health. 2022;10(11):e1582–9.10.1016/S2214-109X(22)00339-4Search in Google Scholar PubMed
[24] Geremew AB, Roberts CT, Kassa BG, Ullah S, Stephens JH. Exploring evidence of healthcare-seeking pathways for maternal complications in Sub-Saharan Africa: a scoping review. BMC Pregnancy Childbirth. 2025;25(1):634.10.1186/s12884-025-07745-3Search in Google Scholar PubMed PubMed Central
[25] Oyedele OK, Lawal TV. Global dominance of non-institutional delivery and the risky impact on maternal mortality spike in 25 Sub-Saharan African Countries. Glob Health Res Policy. 2025;10(1):10.10.1186/s41256-025-00409-xSearch in Google Scholar PubMed PubMed Central
[26] Meh C, Thind A, Ryan B, Terry A. Levels and determinants of maternal mortality in northern and southern Nigeria. BMC Pregnancy Childbirth. 2019;19(1):417.10.1186/s12884-019-2471-8Search in Google Scholar PubMed PubMed Central
[27] Yaya S, Anjorin SS, Adedini SA. Disparities in pregnancy-related deaths: spatial and Bayesian network analyses of maternal mortality ratio in 54 African countries. BMJ Glob Health. 2021;6(2):e004233.10.1136/bmjgh-2020-004233Search in Google Scholar PubMed PubMed Central
[28] Tarekegn SM, Lieberman LS, Giedraitis V. Determinants of maternal health service utilization in Ethiopia: analysis of the 2011 Ethiopian Demographic and Health Survey. BMC Pregnancy Childbirth. 2014;14:161.10.1186/1471-2393-14-161Search in Google Scholar PubMed PubMed Central
[29] Bauserman M, Lokangaka A, Thorsten V, Tshefu A, Goudar SS, Esamai F, et al. Risk factors for maternal death and trends in maternal mortality in low- and middle-income countries: a prospective longitudinal cohort analysis. Reprod Health. 2015;12(2):S5.10.1186/1742-4755-12-S2-S5Search in Google Scholar PubMed PubMed Central
[30] Barros AJ, Victora CG. Measuring coverage in MNCH: determining and interpreting inequalities in coverage of maternal, newborn, and child health interventions. PLoS Med. 2013;10(5):e1001390.10.1371/journal.pmed.1001390Search in Google Scholar PubMed PubMed Central
[31] Mbaruku G, Vork F, Vyagusa D, Mwakipiti R, van Roosmalen J. Estimates of maternal mortality in western Tanzania by the sisterhood method. Afr J Reprod Health. 2003;7(3):84–91.10.2307/3583293Search in Google Scholar
[32] Chopra M, Daviaud E, Pattinson R, Fonn S, Lawn JE. Saving the lives of South Africa’s mothers, babies, and children: can the health system deliver? Lancet (London, Engl). 2009;374(9692):835–46.10.1016/S0140-6736(09)61123-5Search in Google Scholar PubMed
[33] Kpodotsi A, Baku EA, Adams JH, Alaba O. Socioeconomic inequalities in access and use of skilled birth attendants during childbirth in Ghana: a decomposition analysis. BMC Pregnancy Childbirth. 2021;21(1):850.10.1186/s12884-021-04290-7Search in Google Scholar PubMed PubMed Central
[34] Omer S, Zakar R, Zakar MZ, Fischer F. The influence of social and cultural practices on maternal mortality: a qualitative study from South Punjab, Pakistan. Reprod Health. 2021;18(1):97.10.1186/s12978-021-01151-6Search in Google Scholar PubMed PubMed Central
[35] Sayinzoga F, Bijlmakers L, van Dillen J, Mivumbi V, Ngabo F, van der Velden K. Maternal death audit in Rwanda 2009–2013: a nationwide facility-based retrospective cohort study. BMJ Open. 2016;6(1):e009734.10.1136/bmjopen-2015-009734Search in Google Scholar PubMed PubMed Central
© 2025 the author(s), published by De Gruyter
This work is licensed under the Creative Commons Attribution 4.0 International License.
Articles in the same Issue
- Research Articles
- Relationship between body mass index and quality of life, use of dietary and physical activity self-management strategies, and mental health in individuals with polycystic ovary syndrome
- Evaluating the challenges and opportunities for diabetes care policy in Nigeria
- Body mass index is associated with subjective workload and REM sleep timing in young healthy adults
- Prediction of hypoglycaemia in subjects with type 1 diabetes during physical activity
- Investigation by the Epworth Sleepiness Scale of daytime sleepiness in professional drivers during work hours
- Understanding public awareness of fall epidemiology in the United States: A national cross-sectional study
- Impact of Covid-19 stress on urban poor in Sylhet Division, Bangladesh: A perception-based assessment
- Impact of the COVID-19 pandemic on mental health, relationship satisfaction, and socioeconomic status: United States
- Psychological factors influencing oocyte donation: A study of Indian donors
- Cervical cancer in eastern Kenya (2018–2020): Impact of awareness and risk perception on screening practices
- Older LGBTQ+ and blockchain in healthcare: A value sensitive design perspective
- Trends and disparities in HPV vaccination among U.S. adolescents, 2018–2023
- Do cell towers help increase vaccine uptake? Evidence from Côte d’Ivoire
- In search of the world’s most popular painkiller: An infodemiological analysis of Google Trend statistics from 2004 to 2023
- Brain fog in chronic pain: A concept analysis of social media postings
- Association between multidimensional poverty intensity and maternal mortality ratio in Madagascar: Analysis of regional disparities
- A “disorder that exacerbates all other crises” or “a word we use to shut you up”? A critical policy analysis of NGOs’ discourses on COVID-19 misinformation
- Smartphone use and stroop performance in a university workforce: A survey-experiment
- Review Articles
- The management of body dysmorphic disorder in adolescents: A systematic literature review
- Navigating challenges and maximizing potential: Handling complications and constraints in minimally invasive surgery
- Examining the scarcity of oncology healthcare providers in cancer management: A case study of the Eastern Cape Province, South Africa
- Dietary strategies for irritable bowel syndrome: A narrative review of effectiveness, emerging dietary trends, and global variability
- The impact of intimate partner violence on victims’ work, health, and wellbeing in OECD countries (2014–2025): A descriptive systematic review
- Nutrition literacy in pregnant women: a systematic review
- Short Communications
- Experience of patients in Germany with the post-COVID-19 vaccination syndrome
- Five linguistic misrepresentations of Huntington’s disease
- Letter to the Editor
- PCOS self-management challenges transcend BMI: A call for equitable support strategies