
Investigation by the Epworth Sleepiness Scale of daytime sleepiness in professional drivers during work hours
-
Konstantinos Ntelezos

 ,
Georgia Kyriakopoulou
,
Georgia Kyriakopoulou

Abstract
Introduction
Daytime sleepiness in the professional driving industry may affect the safety of drivers at work. Fatigue and obstructive sleep apnoea–hypopnoea syndrome are the most common causes that lead to daytime sleepiness.
Purpose
The aim of this study is to investigate daytime sleepiness as a possible cause of occupational accidents in professional drivers.
Materials and methodology
The Epworth Sleepiness Scale was used to measure sleepiness in 70 professional drivers of different ages, working on both national and international routes. Drivers answered a questionnaire exploring demographic data, as well as an Epworth Sleepiness Scale questionnaire. Data were analysed using the SPSS® Statistical Data Editor 2019 statistical programme, with a 5% level of significance.
Results
Of the studied samples, 50% of the drivers operate on national routes and the other 50% operate on international routes. Nearly half of them (47.1%) work during lunch hours while they rest mostly in the evening. Eight percentage of the drivers suffer from a disease, and 38.6% have 10–15 years of experience. Drivers work an average of 6.91 h and sleep 6.34 h per day, with 37.1% reporting sleeping on the job. The study’s results suggest that there is no statistically significant correlation between sleepiness and the type of route they travel (p-value = 0.142).
Conclusions
Daytime sleepiness is a common cause of road accidents, but this study does not confirm a correlation in specific routes. Although the work involves demanding schedules and routes, Greek professional drivers are perceived as being responsible, focused, and concentrated, which help them to stay alert.
1 Introduction
The main causes of accidents by professional drivers are fatigue, speeding, and sleep apnoea–hypopnoea syndrome (SAHS), which are caused by daytime sleepiness. According to the European Parliament, road accidents are the most common cause of occupational accidents and deaths in industrialized countries. Evidence linked to occupational and road accidents demonstrate the link between drowsiness and events that endanger human lives.
It has been shown that 18 h of insomnia reduces cognition and reaction time, just like alcohol consumption that reaches a concentration of 0.05% v/v in blood, which is against the law. In 1993, 50% of the truck accidents in Australia were attributed to sleepiness and fatigue in professional drivers.
SAHS is directly associated with an increased number of road accidents, particularly among occupational drivers of heavy vehicles. People with SDS are more likely to cause more accidents, compared to the general population. SAHS causes a sudden or gradual decrease in concentration and reflexes, which manifests as inability to perceive the environment, especially when combined with the use of cardiovascular drugs such as beta-blockers, leading to sleepiness.
Another important factor is the fluctuation of glucose levels among overweight diabetics suffering from obstructive sleep apnoea–hypopnoea syndrome (OSAHS). The most extensive study of SAHS in professional drivers was conducted in 2002 by Pack et al. in Pennsylvania, USA, indicating that 17.6% of the professional drivers had mild SAHS.
The Epworth Sleepiness Scale, designed in 1991, is the most widely used method for diagnosing daytime sleepiness. It includes eight questions about daily activities, with scores ranging from 0 to 3. The maximum score is 24, with scores above 10 indicating high sleepiness [1,2,3,4,5].
2 Materials and methodology
This study aims to investigate whether drivers suffer from drowsiness during their work, as well as the factors causing it. Drivers’ drowsiness as a cause of road accidents is usually underestimated, since there are no objective measurements that could incriminate it, as for instance in the case of alcohol consumption. It has been proven that driving while there are signs of drowsiness has similar behavioural symptoms as driving under the influence of alcohol.
This study utilized a stratified sampling method using the Epworth Sleepiness Scale questionnaire, which is considered the most widely used tool for the diagnosis of sleepiness according to the literature. It included eight questions related to activities of daily living, and the scoring of each item ranged from 0 to 3 with a maximum total score of 24. Data collection was conducted over a 3-month period from September 2019 to November 2019, and the data were analysed using the SPSS® 2019 statistical package. Descriptive statistical analyses were performed, as well as the Pearson correlation method was used to address the main research question. The study was conducted in the region of Aspropyrgos in Athens, Greece, while the study sample consisted of 70 professional drivers, who were equally distributed on operating national routes (within Greece, N = 35) as well as on international routes (outside Greece, N = 35).
The questionnaires included questions concerning the participants’ age group, educational level, participation in a behavioural change programme, as well as the quality and habits of their daily life. There were also questions about their general health, any diseases and/or any vision issues that they may have, and any medication that they might be taking. Finally, the distributed questionnaires also inquired about their participants’ previous and current professional experience.
-
Informed consent: Written informed consent was obtained from each individual who participated in this study. Moreover, the privacy and the confidentiality concerning the individuals’ participation, as well as data collection and analysis, were reassured throughout the process of this research.
-
Ethical approval: This study did not involve contact with living tissues, the collection of biological fluids, or any procedures requiring ethical approval. According to applicable guidelines, approval from a Bioethics Committee was not required for this type of research. Informed consent was obtained from all participants where necessary, ensuring compliance with ethical research standards.
3 Results
3.1 Questionnaire
The questionnaire was provided on a scale of 0 to 3, where 0 = never sleepy and 3 = very likely to be sleepy, according to the Epworth Sleepiness Scale method as described above. The questionnaire consisted of 29 questions, with 24 being closed-ended and 5 open-ended questions, reaching a total of 70 questionnaires that were distributed to professional drivers.
3.2 Descriptive statistics
As shown in Figure 1, 50% of the drivers operated on national routes, while the remaining 50% on international routes.
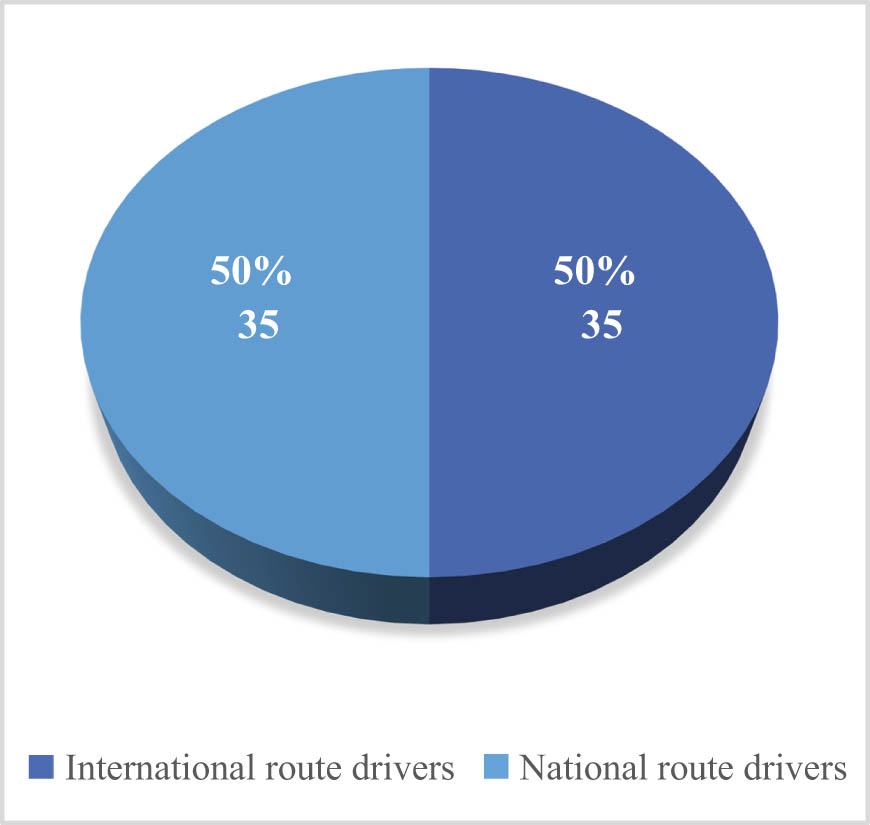
Route distribution.
About 31.43% of the participants fall into the 36–45 age group, as presented in Figure 2, followed by the age groups 46–55 (27.19%), 26–35 (17.14%), and 56–65 (12.86%).
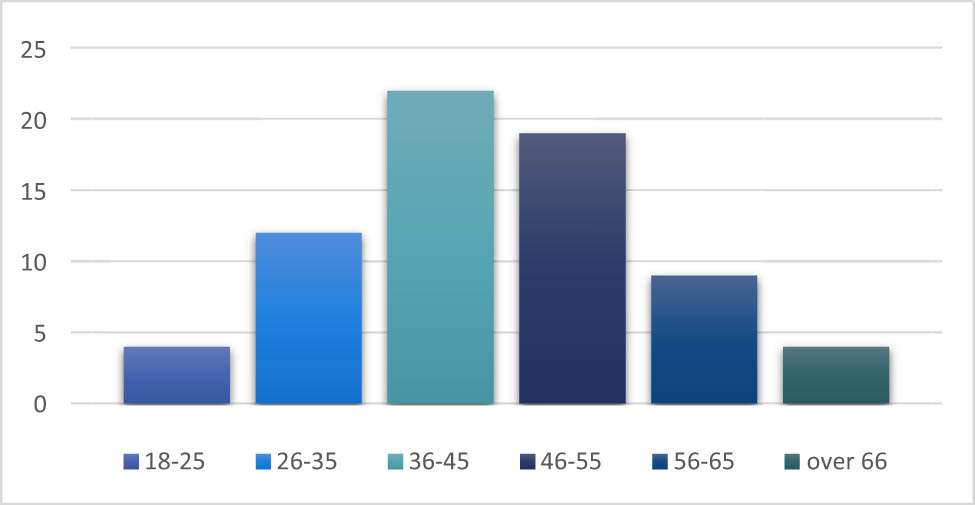
Age distribution.
Concerning the participants’ educational level, Figure 3 shows that 68.57% of the drivers (N = 48/70) were high school graduates, while a total of 27.77% (N = 20/70) were higher education graduates.
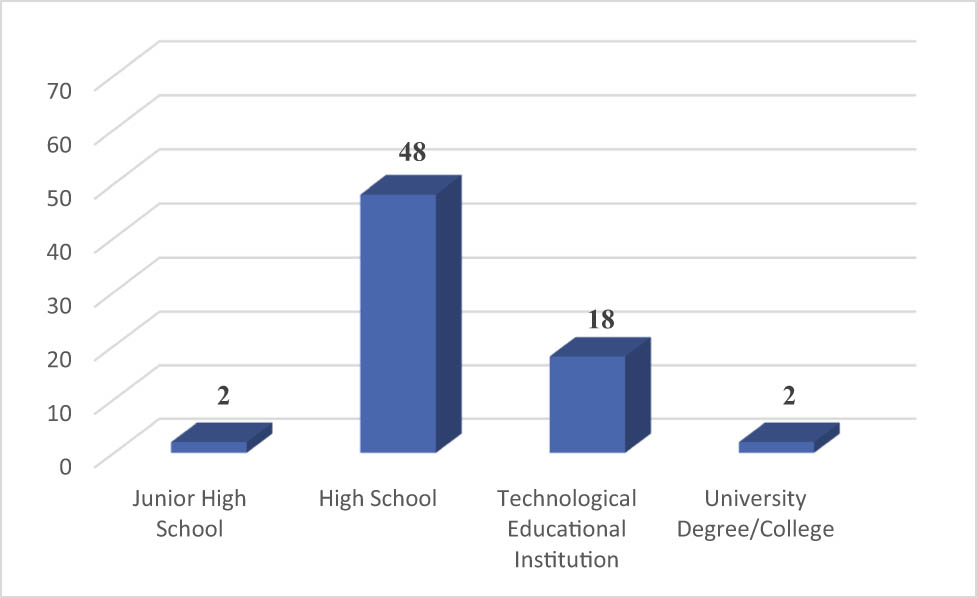
Educational level.
Figure 4 also demonstrates that 45.71% of the drivers were smokers, while 28.57% have been smoking for more than 10 years at a rate of 10–20 cigarettes per day, 21.43% for 5–10 years at a rate of 10–20 cigarettes per day, and 7.14% for less than a year consuming more than one pack.
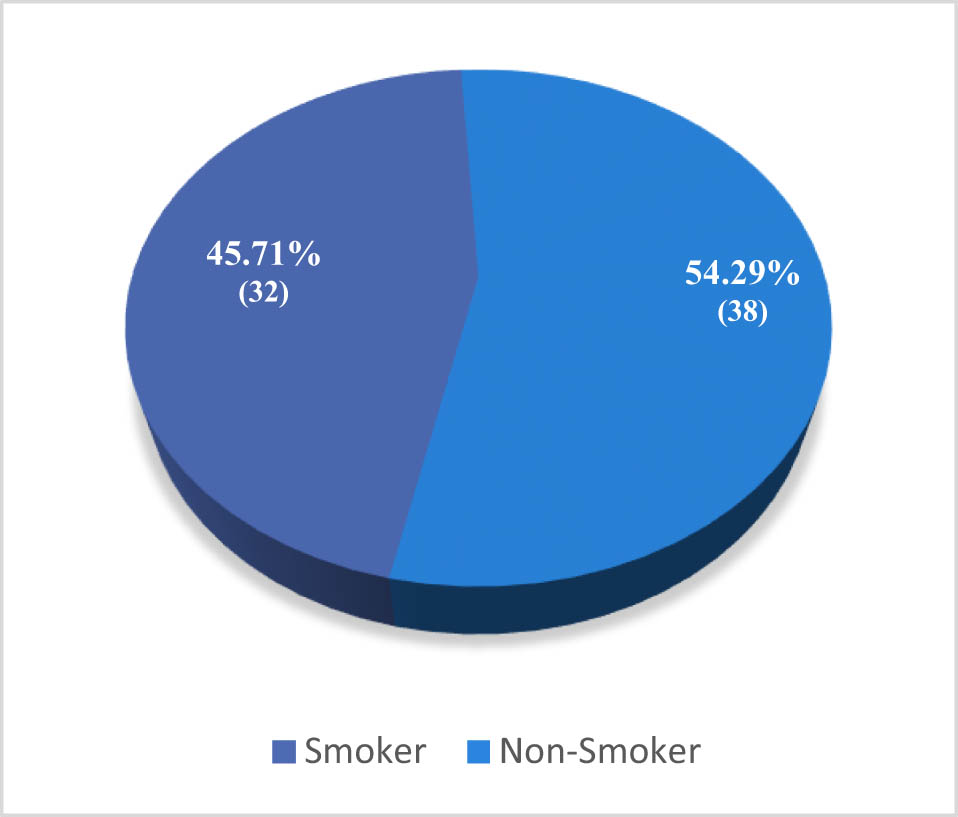
Smoking habits.
As shown in Figure 5, only 11.43% (8/70) of the drivers reported having an underlying health condition. In particular, two drivers over 55 years old have had a heart attack in the past and were smokers, while two had diabetes and four were obese. Moreover, Figure 6 shows that only four of the drivers were on medication – those with diabetes and those who have had a heart attack.
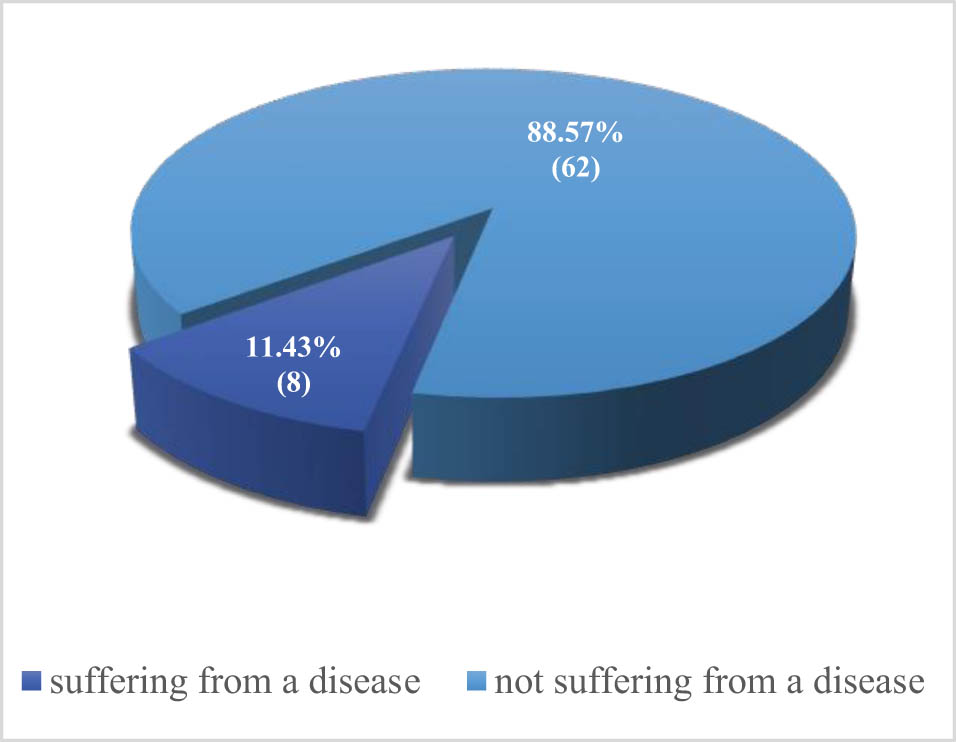
Underlying health conditions.
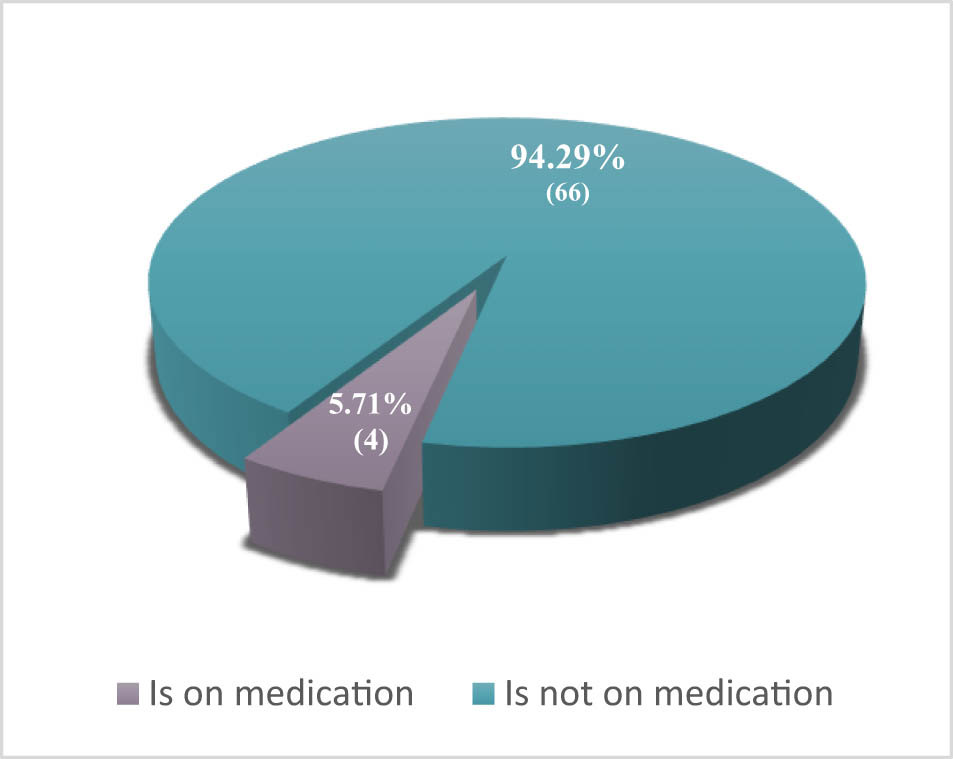
Drivers using medication.
Finally, 52.86% of the drivers stated that they have presbyopia. This finding, however, appears to be normal considering the age groups, since presbyopia appears after the age of 40 (Figure 7).
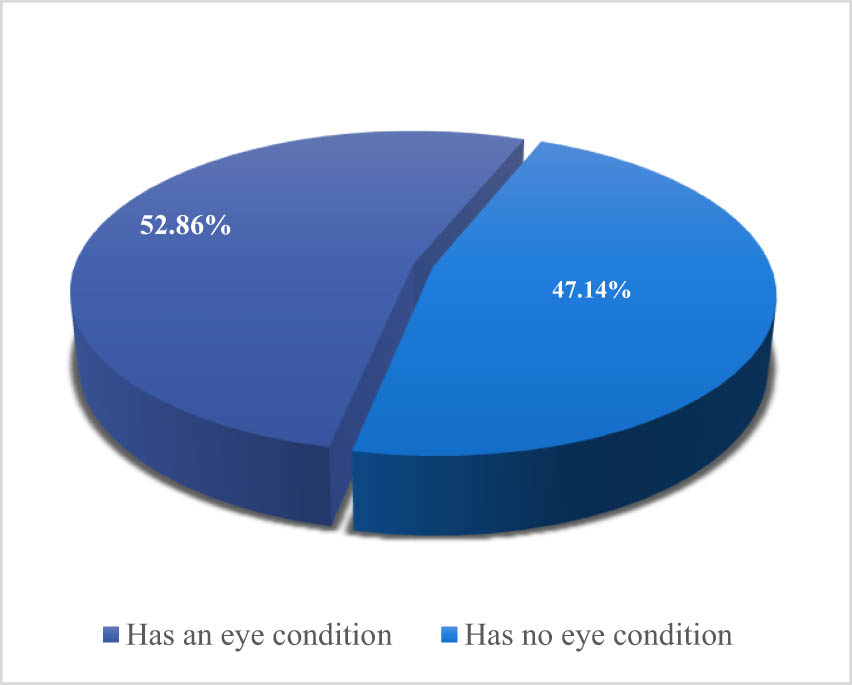
Vision-related conditions.
3.3 Main part
Concerning the main part of the questionnaire, Chart 1 shows that 75.71% of the drivers have been working in this field for 5–15 years and 18.57% of the drivers have been working for 15 years and more.
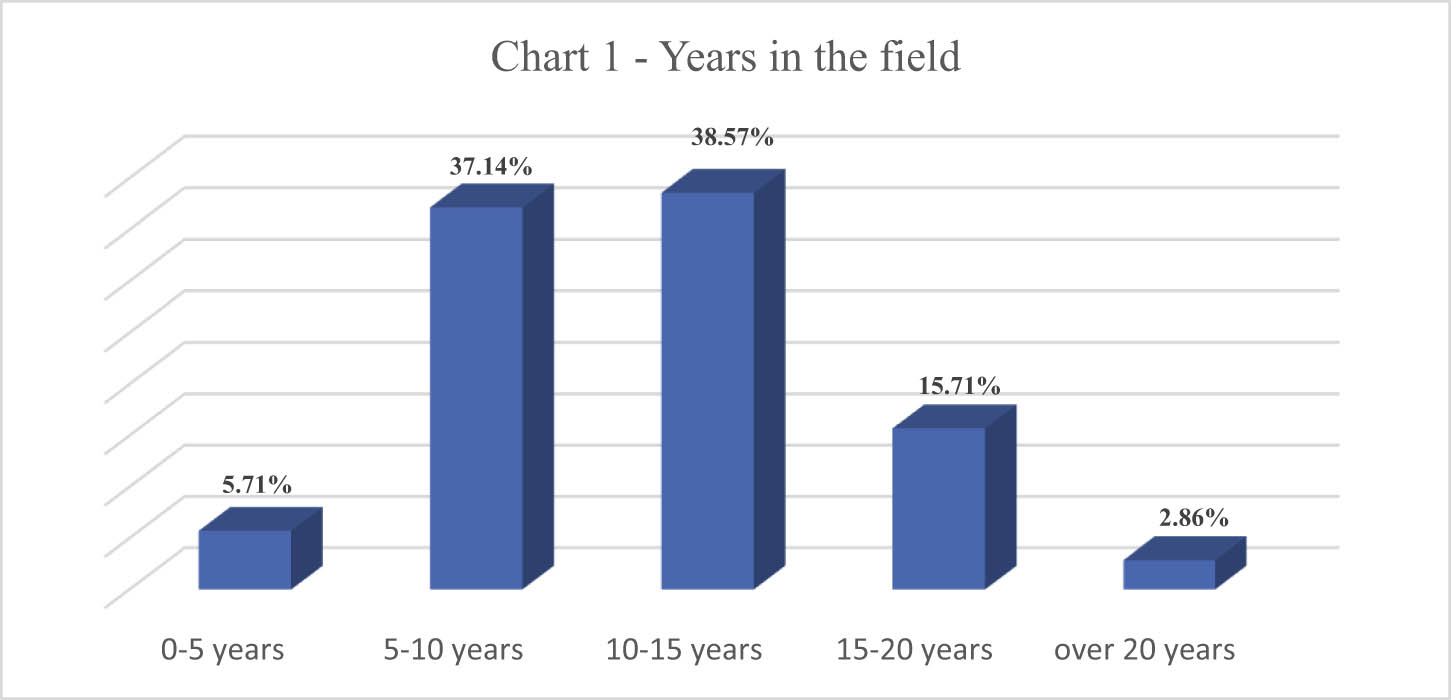
Years in the field.
Furthermore, 47.14% of the participants work part-time on a 6-h shift, while 44.29% work full-time, and only 8.57% work part-time on a 4-h shift (Chart 2).
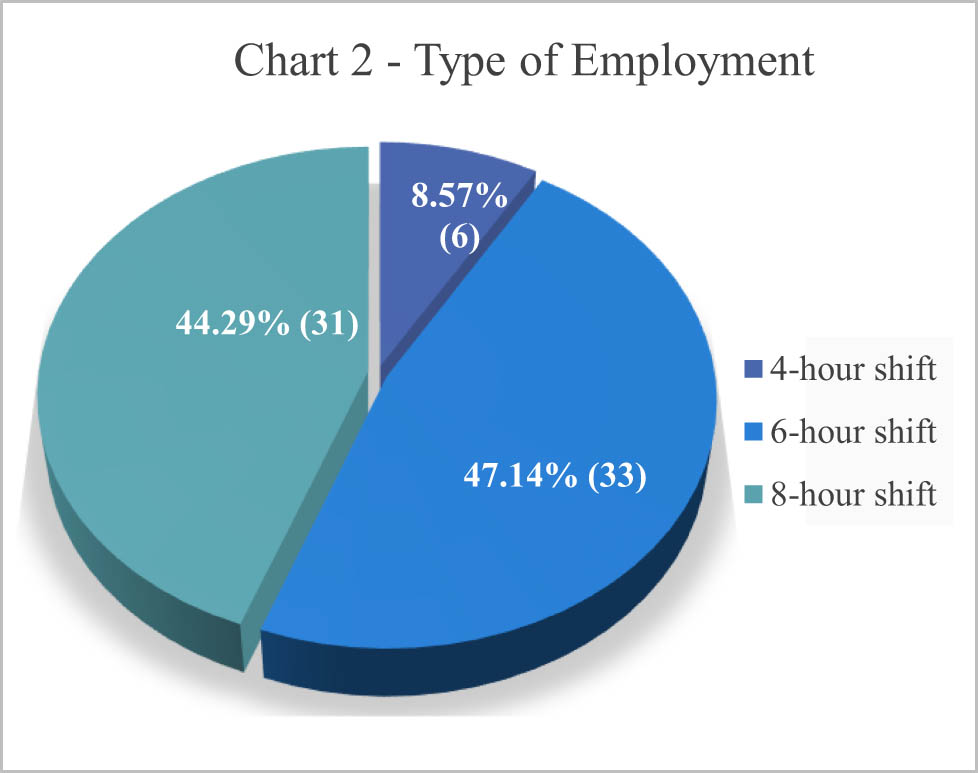
Type of employment.
Chart 3 also shows that 47.14% of the drivers are working midday, 31.43% are working in the morning, and 21.43% are working in the evening.
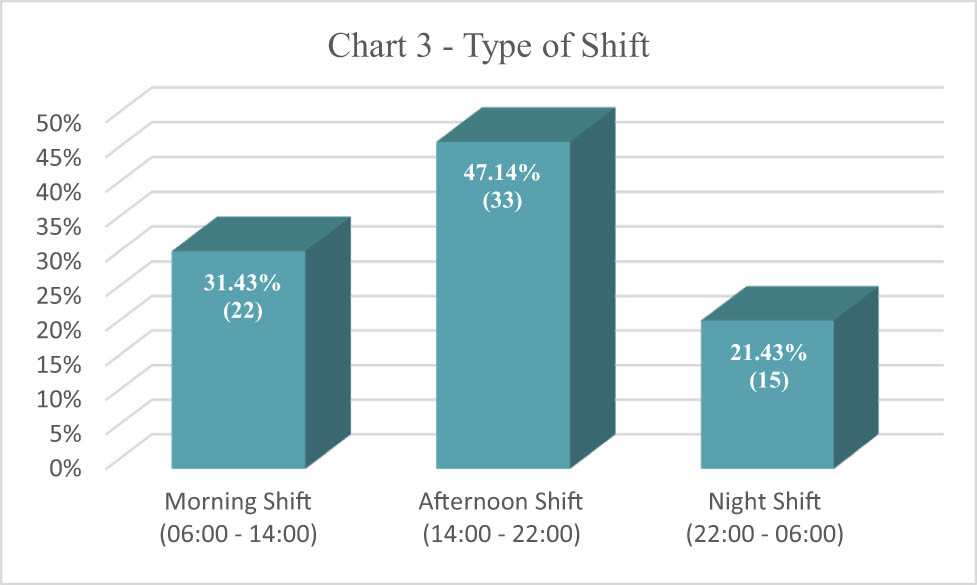
Working hours.
According to Table 1, the average working hours per driver is 6.91 h, whereas Table 2 shows that national route drivers work an average of 6.69 h per day and international route drivers an average of 7.14 h per day.
Descriptive details
| N | Minimum | Maximum | Mean | Standard deviation | |
|---|---|---|---|---|---|
| Daily working hours | 70 | 4 | 2 | 0.91 | 0.625 |
| Valid N (listwise) | 70 |
Descriptive statisticsa
| Department | N | Minimum | Maximum | Mean | Standard deviation | |
|---|---|---|---|---|---|---|
| International route driver | Daily working hours | 35 | 4 | 12 | 7.14 | 2.809 |
| Valid N (listwise) | 35 | |||||
| National route driver | Daily working hours | 35 | 4 | 12 | 6.69 | 2.447 |
| Valid N (listwise) | 35 | |||||
aNo statistics is computed for one or more split files because there are no valid cases.
Table 3 also demonstrates that drivers sleep an average of 6.34 h, whereas Table 4 indicates that national route drivers sleep 7.87 h per day.
Descriptive details
| N | Minimum | Maximum | Mean | Standard deviation | |
|---|---|---|---|---|---|
| How many hours do you sleep on a daily basis? | 70 | 4 | 2 | 0.34 | 0.976 |
| Valid N (listwise) | 70 |
Descriptive details per department
| Department | N | Minimum | Maximum | Mean | Standard deviation | |
|---|---|---|---|---|---|---|
| International route driver | How many hours do you sleep on a daily basis? | 35 | 5 | 9 | 6.11 | 1.008 |
| Valid N (listwise) | 35 | |||||
| National route driver | How many hours do you sleep on a daily basis? | 35 | 4 | 8 | 7.87 | 0.900 |
| Valid N (listwise) | 35 | |||||
Furthermore, Chart 4 shows that 22.86% of the international route drivers have fallen asleep on the job, which is about 8% higher than the 14.29% of the national route drivers.
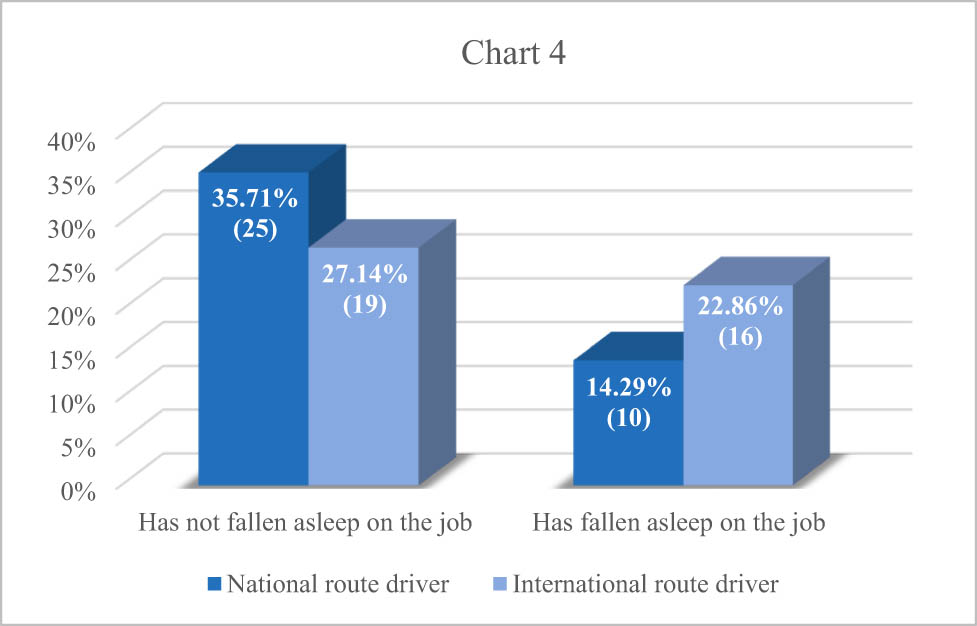
Prevalence of sleep episodes among drivers.
Based on Chart 5, of those drivers who reported to have fallen asleep on the job, 15.38% of the national route drivers have had an accident and 3.85% of the international route drivers have fallen asleep on the job causing accident.
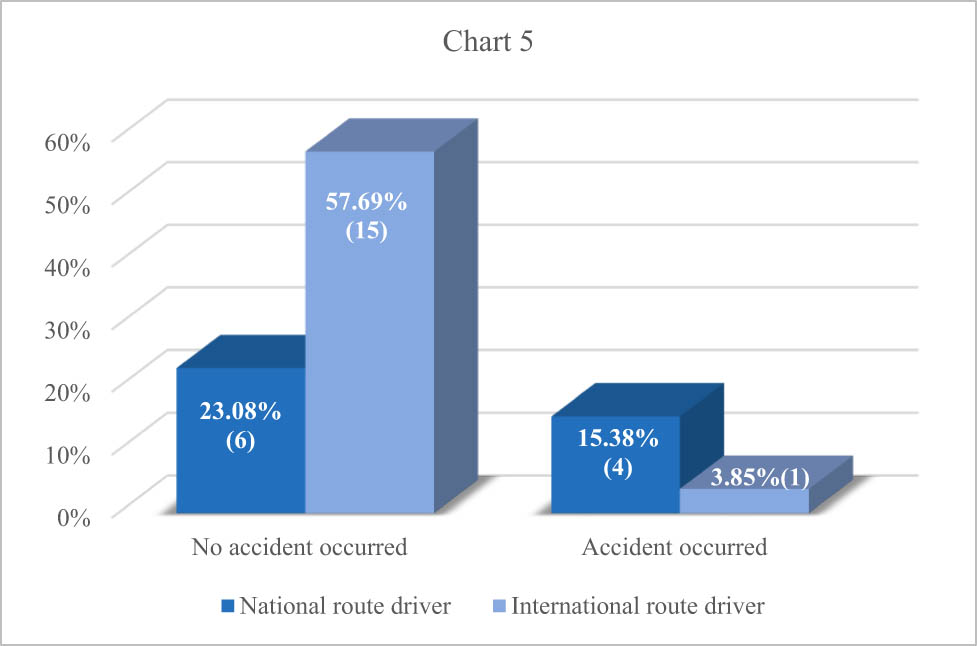
Incidence of accidents attributed to sleep episodes among drivers.
Finally, the following research question was asked: Is sleepiness related to the driving sector, that is, to whether the driver operates on foreign or national routes? (Table 5)
Association between the driving sector and the incidence of sleep episodes
| Driving sector | Have you ever fallen asleep on the job? | ||
|---|---|---|---|
| Driving sector | Pearson correlation | 1 | 0.177 |
| Sig. (two-tailed) | 0.142 | ||
| N | 70 | 70 | |
| Have you ever fallen asleep on the job? | Pearson correlation | 0.177 | 1 |
| Sig. (two-tailed) | 0.142 | ||
| N | 70 | 70 |
Therefore, the hypothetical questions were formed as follows:
H 0 : The driving sector is not associated with sleepiness, with alternative hypothesis.
H 1 : The driving sector is related to sleepiness.
From the correlation analysis table above, it appears that there is no correlation between the driving sector and the manifestation of sleepiness, since p = 0.142 > 0.05. Therefore, the null hypothesis is accepted, leading to the assumption that the fact that more international route drivers than national route drivers have fallen asleep is rather based on random facts than the driving sector on which they operate. Besides, the opposite could also have happened.
4 Discussion
French professional drivers had at least one episode of sleepiness at the wheel in a 1-year period. In a research by Philip et al. [5], where 35,004 drivers were studied, the results showed a high rate of sleepiness while driving (28%) and a high number of accidents (11%), 46% of which were related to sleep. Also, 8.9% of the drivers had at least once a month an episode of sleepiness while driving, forcing them to make a stop in order to rest. Almost one third of the drivers (31.1%) had been involved in an accident (50% sleep-related), 2,520 drivers (7.2%) had a road accident in the previous year, and 146 (5.8%) of these traffic accidents were related to sleep.
In addition, a study by Gulbay et al. [3] that involved taxi drivers reported a significant correlation between sleepiness and road accidents. Among the fatal causes of road accidents by professional drivers, sleepiness and involuntary sleep episodes are identified. Fatigue in professional drivers has been associated for many years with the risk of causing an accident, but the causes of this symptom have not yet been ascertained, so sleep-disordered breathing needs further systematic study and research [2,4,6,7,8].
Moreover, in a study carried out on truck drivers in 2000 using personal interviews, six factors causing sleepiness at work were identified, which included the following: a) intense drowsiness during the day, b) the existence of sleep disorders (SDS), c) the old age or inexperience of drivers, d) difficult work schedule, e) poor and little sleep, and f) night driving [9]. A study in Australia in 2023 has proven that there is a higher risk of drowsiness in truck drivers that work more than 40 h per week, in contrast with the drivers that work around 40 h [10].
The general health and well-being of bus driver workers, including aspects of sleep health, are important elements of shift work which can affect the work performance, as well as sleep and safety. Research among bus drivers has shown an association between BMI and sleepiness [11] and that factors such as poor sleep quality, insomnia, and a high risk of obstructive sleep apnoea are associated with excessive daytime sleepiness [12]. Implementing strategies to encourage and support health improvement has the potential to mitigate fatigue. Also, studies were conducted in South India, which indicated that 47.3% of the drivers were having a bad quality of sleep [13].
Furthermore, in a questionnaire-based survey [14], 20% of the bus drivers stated an ESS > 10, while 12% fell asleep at the wheel at least once a month, 7% had an accident, and 8% of them lost touch due to sleepiness while driving. The results showed a high rate of sleepiness and sleep-related accidents among bus drivers, as well as a potentially high rate of OSAHS.
In a 2017 study [15] that used the Epworth Sleepiness Scale questionnaire, it was shown that 9% of the drivers slept less than 6 h a day. About 74% of the drivers were tired, 25% of the drivers felt drowsy, and 35% of the drivers made body movements to wake up while driving. Drivers often slept in inappropriate positions that affected sleep quality. Fatigue and sleepiness, as well as accidents or near misses, occurred frequently among bus drivers.
A survey conducted in Thailand [16] reported poor sleep quality among 60% of the drivers. An increased risk of poor sleep quality was associated with marital status, alcohol consumption, lack of exercise, and night driving. There is a high prevalence of poor sleep quality among Thai bus drivers. This is likely due to a combination of factors including the shift.
Finally, the existing literature shows that obstructive sleep apnoea syndrome (OSAS) and excessive sleepiness are also highly prevalent in taxi drivers compared to drivers in the general population. Indicatively, in a sample of 241 New Zealand taxi drivers, the proportion of moderate to high risk of OSAS was estimated to be high [17], while in a study of 118 Turkish taxi drivers, there were 58 (49.2%) subjects with severe snoring, 8 (5.9%) subjects had cardiac symptoms due to OSAS, 28 (23.7%) subjects experienced daytime sleepiness, and 8 (67.8%) drivers had been involved in a traffic accident as well [3].
Similarly in the United States, a study of long-distance heavy truck drivers found that 47.1% reported drowsiness while driving, shortly before an accident occurred [2].
The use of the Epworth Sleepiness Scale, a widely validated and accepted tool for measuring daytime sleepiness, strengthens the reliability of the findings and allows for comparisons with other similar studies in the field. However, the reliance on self-reported data introduces the possibility of bias, as participants may either underreport or overreport their sleepiness levels, potentially affecting the accuracy of the results.
5 Conclusions
Daytime sleepiness is a common cause of road accidents. In this study, however, the initial analyses do not confirm that it is related to the realization of specific itineraries. This particular job often has demanding schedules and routes and certainly requires attention and vigilance from the drivers, but it seems that the Greeks are among the most responsible, dedicated, and focused professional drivers.
-
Funding information: Authors state no funding was involved.
-
Author contributions: All authors have accepted responsibility for the entire content of this manuscript and consented to its submission to the journal, reviewed all the results and approved the final version of the manuscript. KN: conceptualization, supervision, and project administration; MFD: methodology, supervision, and project administration; GK: methodology, data curation, and project administration; AMT: methodology, writing, and data curation; MK: data curation, formal analysis, and writing; DD: conceptualization, supervision, and project administration; ID-C: conceptualization, writing, and methodology; IP: conceptualization, data curation, and methodology.
-
Conflict of interest: Authors state no conflict of interest.
-
Data availability statement: All data concerning this research, including the questionnaire used, are available and can be provided upon request by contacting the corresponding author.
References
[1] Pack AI, Maislin G, Staley B, Pack FM, Rogers WC, George CF, et al. Impaired performance in commercial drivers: role of sleep apnea and short sleep duration. Am J Respir Crit Care Med. 2006;174(4):446–54. 10.1164/rccm.200408-1146OC.Search in Google Scholar PubMed PubMed Central
[2] Schiza SE, Bouloukaki I. Screening for obstructive sleep apnoea in professional drivers. Breathe (Sheff). 2020 Mar;16(1):29364. 10.1183/20734735.0364-2019. PMID: 32194762; PMCID: PMC7078730.Search in Google Scholar PubMed PubMed Central
[3] Gulbay BE, Acican T, Doğan R, Baccioğlu A, Gullu E, Karadağ G. The evaluation of excessive daytime sleepiness in taxi drivers. Tuberk Toraks. 2003;51:385–9.Search in Google Scholar
[4] Bioulac S, Franchi JAM, Arnaud M, Sagaspe P, Moore N, Salvo F, et al. Risk of motor vehicle accidents related to sleepiness at the wheel: a systematic review and meta-analysis. Sleep. 2017;40(10).10.1093/sleep/zsx134Search in Google Scholar PubMed
[5] Philip P, Chaufton C, Orriols L, Lagarde E, Amoros E, Laumon B. Complaints of poor sleep and risk of traffic accidents: A population-based case-control study. PLoS One. 2014.10.1371/journal.pone.0114102Search in Google Scholar PubMed PubMed Central
[6] Philip P. Sleepiness of occupational drivers. Ind Health. 2005;43(1):30–3.10.2486/indhealth.43.30Search in Google Scholar PubMed
[7] Zhang H, Yan X, Wu C, Qiu T. Effect of circadian rhythms and driving duration on fatigue level and driving performance of professional drivers. Transp Res Record: J Transp Res Board. 2014;2402:19–27.10.3141/2402-03Search in Google Scholar
[8] Williamson A, Lombardi DA, Folkard S, Stutts J, Courtney TK, Connor JL. The link between fatigue and safety. Accid Anal Prev. 2011;43(2):498–515.10.1016/j.aap.2009.11.011Search in Google Scholar PubMed
[9] McCartt AT, Rohrbaugh JW, Hammer MC, Fuller SZ. Factors associated with falling asleep at the wheel among long-distance truck drivers. Accid Anal Prev. 2000 Jul;32(4):493–504.10.1016/S0001-4575(99)00067-6Search in Google Scholar PubMed
[10] Ren X, Pritchard E, van Vreden C, Newnam S, Iles R, Xia T. Factors associated with fatigued driving among Australian truck drivers: A cross-sectional study. Int J Env Res Public Health. 2023 Feb;20(3):2732. 10.3390/ijerph20032732. PMID: 36768095; PMCID: PMC9916394.Search in Google Scholar PubMed PubMed Central
[11] Santos DB, Bittencourt LG, de Assis Viegas CA, Gaio E. Daytime sleepiness and attention in city bus drivers of two capitals of Brazil. Rev Portuguesa de Pneumologia (Engl Ed). 2013;19(4):152–6.10.1016/j.rppnen.2013.06.003Search in Google Scholar
[12] Kim SM, Um YH, Kim TW, Jeong JH, Seo HJ, Song JH, et al. Excessive daytime sleepiness and its risk factors for commercial bus drivers in Korea. Sleep Med Res. 2017;8(2):76–80.10.17241/smr.2017.00122Search in Google Scholar
[13] Bharathwaj P, Pradeep MV, Kaveri P, Anantharaman VV, Logaraj M. Stress and sleep deprivation experienced by bus drivers of government bus depots in an urban area of Chengalpattu District in South India. Cureus. 2024 Aug;16(8):e67689. 10.7759/cureus.67689. PMID: 39314574; PMCID: PMC11419593.Search in Google Scholar PubMed PubMed Central
[14] Vennelle M, Engleman HM, Douglas NJ. Sleepiness and sleep related accidents in commercial bus drivers. Sleep Breath. 2010;14(1):39–42.10.1007/s11325-009-0277-zSearch in Google Scholar PubMed
[15] Deza-Becerra F, de Castro JR, Gonzales-Gonzales C, León-Jiménez FE, Osada-Liy J, Rosales-Mayor E. Sleep habits, fatigue, and sleepiness in Chiclayo-Peru’s bus drivers. Sleep Breath. 2017;21(3):745–9.10.1007/s11325-017-1502-9Search in Google Scholar PubMed
[16] Chaiard J, Deeluea J, Suksatit B, Songkham W. Factors associated with sleep quality of Thai intercity bus drivers. Ind Health. 2019;2018-0168.10.2486/indhealth.2018-0168Search in Google Scholar PubMed PubMed Central
[17] Firestone RT, Mihaere K, Gander PH. Obstructive sleep apnoea among professional taxi drivers: A pilot study. Accid Anal Prev 2009;41:552–6.10.1016/j.aap.2009.02.006Search in Google Scholar PubMed
© 2025 the author(s), published by De Gruyter
This work is licensed under the Creative Commons Attribution 4.0 International License.
Articles in the same Issue
- Research Articles
- Relationship between body mass index and quality of life, use of dietary and physical activity self-management strategies, and mental health in individuals with polycystic ovary syndrome
- Evaluating the challenges and opportunities for diabetes care policy in Nigeria
- Body mass index is associated with subjective workload and REM sleep timing in young healthy adults
- Prediction of hypoglycaemia in subjects with type 1 diabetes during physical activity
- Investigation by the Epworth Sleepiness Scale of daytime sleepiness in professional drivers during work hours
- Understanding public awareness of fall epidemiology in the United States: A national cross-sectional study
- Impact of Covid-19 stress on urban poor in Sylhet Division, Bangladesh: A perception-based assessment
- Impact of the COVID-19 pandemic on mental health, relationship satisfaction, and socioeconomic status: United States
- Psychological factors influencing oocyte donation: A study of Indian donors
- Cervical cancer in eastern Kenya (2018–2020): Impact of awareness and risk perception on screening practices
- Older LGBTQ+ and blockchain in healthcare: A value sensitive design perspective
- Trends and disparities in HPV vaccination among U.S. adolescents, 2018–2023
- Do cell towers help increase vaccine uptake? Evidence from Côte d’Ivoire
- In search of the world’s most popular painkiller: An infodemiological analysis of Google Trend statistics from 2004 to 2023
- Brain fog in chronic pain: A concept analysis of social media postings
- Association between multidimensional poverty intensity and maternal mortality ratio in Madagascar: Analysis of regional disparities
- A “disorder that exacerbates all other crises” or “a word we use to shut you up”? A critical policy analysis of NGOs’ discourses on COVID-19 misinformation
- Smartphone use and stroop performance in a university workforce: A survey-experiment
- Review Articles
- The management of body dysmorphic disorder in adolescents: A systematic literature review
- Navigating challenges and maximizing potential: Handling complications and constraints in minimally invasive surgery
- Examining the scarcity of oncology healthcare providers in cancer management: A case study of the Eastern Cape Province, South Africa
- Dietary strategies for irritable bowel syndrome: A narrative review of effectiveness, emerging dietary trends, and global variability
- The impact of intimate partner violence on victims’ work, health, and wellbeing in OECD countries (2014–2025): A descriptive systematic review
- Nutrition literacy in pregnant women: a systematic review
- Short Communications
- Experience of patients in Germany with the post-COVID-19 vaccination syndrome
- Five linguistic misrepresentations of Huntington’s disease
- Letter to the Editor
- PCOS self-management challenges transcend BMI: A call for equitable support strategies