Predictors of diagnosed cardiovascular diseases and their spatial heterogeneity in Lagos State, Nigeria
-
Oluwaseun Addie
 und
Olalekan John Taiwo
und
Olalekan John Taiwo

Abstract
Cardiovascular diseases (CVDs) persist as the foremost global cause of death despite persistent efforts to comprehend the risk factors associated with them. Low- and middle-income countries (LMICs) are disproportionately affected, bearing a high burden of CVD morbidity and mortality. Nevertheless, the intricate socio-spatial landscape that could yield new insights into CVD incidence within LMICs like Nigeria has not received sufficient attention. This study aimed to determine the predictors of CVDs in a megacity in one of the LMICs and investigate their spatial heterogeneity. The study acquired and appropriately geocoded hospital records of patients clinically diagnosed with CVDs between 2008 and 2018 from a tertiary healthcare facility. Stepwise regression and geographically weighted regression were employed to identify predictors of CVDs and investigate their patterns. The study’s findings revealed that gender emerged as the primary predictor of diagnosed CVDs. Consequently, the study underscores the importance of focusing on the female population in efforts to control and prevent CVDs while advocating for the formulation and implementation of spatially sensitive policies and interventions.
1 Introduction
Cardiovascular diseases (CVDs), cancers, chronic pulmonary diseases, and diabetes account for more than 80% of deaths from noncommunicable diseases (NCDs) globally [1]. However, over 75% of CVD deaths occur in low- and middle-income countries (LMICs) [1]; about one-quarter of such deaths occur before age 60 [2,3]. Broadly, the risk factors of CVD can be grouped into three categories: environmental, medical, and behavioral. The environment affects health [4]; thus, rapid unplanned urbanization, high levels of exposure to smoke, fine or ultrafine particulate air pollutants, and exposure to chemicals, such as polyaromatic hydrocarbons, aldehydes, and metals, are among the environmental risk factors of CVD [5,6,7,8]. While demographic ageing, high blood pressure, raised total cholesterol, elevated blood glucose, overweight, and obesity constitute the medical risk factors [6,9,10], excessive alcohol consumption, tobacco use, poor diet, and sedentary lifestyle are among the behavioral risk factors [1,11,12]. Even though these factors are global [6], nevertheless, they vary from place to place [13], from person to person [10,14], and from time to time [12,15]. Knowing the prominent predisposing factors of CVDs in an area is, therefore, of utmost importance to healthcare systems and managers [16], because it aids the control and prevention of the disease through focused intervention and appropriate policy development [7,8,12,17].
Gebreab and Roux [17] investigated variations in coronary heart disease (CHD) mortality rates between black and white populations in the continental United States from 1996 to 2006. They initially identified significant geographic differences in CHD mortality when considering age-adjusted rates at the county level. However, after factoring in county-level disparities related to poverty, racial segregation, and racial composition, the previously observed differences in CHD mortality across regions disappeared. The findings underscore how crucial it is to consider spatial variation in addressing and reducing racial inequalities in CHD mortality. Ford and Highfield [18] measured the association between social deprivation and CVD mortality in Harris County, Texas, at the census tract level. Accounting for age, income by race, education, and other factors, there was a significant and spatially varying association between the two variables. While underpinning the importance of geography and place of residence in the relationship between social deprivation and CVD mortality, neighborhoods at greatest risk for poor health outcomes and in need of prompt interventions could be identified. Using hospital records and population data, Fabiyi and Garuba [19] examined the spatial pattern of CVD and its biomedical risk factors among neighborhoods in Ibadan City, Nigeria, and found that the relationship between the spatial pattern of CVD and the biomedical risk factors was statistically significant, with a clustered pattern observable at the neighborhood level, suggesting a very strong positive spatial autocorrelation in the city. It was deduced that CVD is linked to both affluent and impoverished communities within the city.
Kauhl et al. [20] analyzed location-specific associations between hypertension, socio-demographic population characteristics, and area deprivation based on health insurance claims. While identifying age ≥45, area deprivation, and percentage of commuters to work outside residential municipality as the main risk factors, the findings revealed important regional variations, suggesting that the risk of hypertension will be greater in persons ageing in deprived areas. Thus, the future planning and allocation of primary healthcare in northeastern Germany should take into account the impact of area deprivation. To understand the role of urban green spaces (UGSs) in CVD prevention, Rahnama and Shaddel [4] explored the factors influencing the use of UGSs among women affected by CVD in Mashhad, Iran, at the block level; the result of the analysis showed that income, level of education, and access to UGSs were important predictors of the vulnerable blocks. Identifying blocks at risk could prove beneficial for crafting prevention strategies and location-specific interventions. Similarly, using data from the Reasons for Geographic and Racial Differences in Stroke (REGARDS) Study, Tabb et al. [21] explored the spatial patterning in the racial differences in cardiovascular health (CVH) between blacks and whites across the United States and found a significant spatial patterning in racial differences, even beyond the well-known regions labelled as the Stroke Belt and Stroke Buckle. The blacks consistently had diminishing CVH compared with whites. Hence, efforts aimed at enhancing CVH and, in the long run, diminishing inequalities between blacks and whites necessitate the use of culturally sensitive approaches, with a particular emphasis on location-based interventions and policies.
Thus, understanding the significant underlying factors that contribute to CVDs in a particular region is crucial. This knowledge plays a pivotal role in enabling targeted interventions and the development of relevant policies to effectively control and prevent the disease. Even though traditional regression methods such as ordinary least squares and generalized linear model are veritable tools for determining the predictors of a phenomenon, the outcome of a regular regression analysis produces “global” or “average” parameter estimates that are assumed to be stationary everywhere in space [20,22]. However, given the variable nature of most phenomena, the assumption that such estimated regression parameters hold equal value everywhere in geographic space is doubtful. One of the statistical techniques that produce local estimates of the spatial variability of regression results across geographic space is the geographically weighted regression (GWR) [21,22]. Instead of a single global parameter estimate, GWR generates useful results on how parameters vary over space [23], evaluating the existence or otherwise of a linear regression relationship between the observed and expected prevalence of a phenomenon, thereby exposing inherent variations [24]. GWR has been widely applied in studies of the geographic variation of CVD and its predictors [16,18,20,25]. It reveals the locations of inherent variations, thus aiding in specific interventions to control and prevent the disease. However, the identification of the local variations in the incidence of CVDs and associated risk factors is limited in LMICs, especially in Lagos State, Nigeria, despite its status as a megacity.
Consequently, this study determined the predictors of CVDs in a megacity in an LMIC and investigated their spatial heterogeneity using hospital records of patients clinically diagnosed with CVDs between 2008 and 2018 in a tertiary healthcare facility.
2 Methods
2.1 Study population
This was a retrospective study of medically diagnosed CVD patients aged ≥18 years, from 2008 to 2018 (excluding the year 2011), at the Lagos State University Teaching Hospital (LASUTH), Ikeja, Lagos. The data for the year 2011 could not be retrieved as of the time of the study. LASUTH was purposively selected because of the availability of data on CVD for the years under consideration. The years were equally chosen because globally there has been an appreciable rise in CVD since 2008 [6].
2.2 Study location
Lagos, the second-most populous state in Nigeria [26], is located in the southwestern geopolitical zone of the country. Despite Nigeria’s high population, it is the state with the smallest area size (3,577 km2). The lagoon occupies about 22% of the area extent of the state [27]. With a tropical savannah climate similar to that of the rest of the geopolitical zone, it experiences double rainy seasons annually. The first peak is usually from April to July, while the second is from September through early December [28]. The economic and commercial importance of Lagos State has been boosted by some inter-regional and international routes, such as the Trans-West African Coastal Highway to Dakar, the Trans-Sahara Highway to Algiers, and the Lagos–Mombasa Highway [28]. As the country’s financial capital, Lagos is the most urbanized state in Nigeria, with a population of over 13 million [29]. It generates a significant portion (25%) of the country’s GDP [30], and it is comprised of 20 local government areas (LGAs), divisible into rural (four LGAs) and urban (16 LGAs).
2.3 Data analysis
Whereas the biomedical risk factors and some of the lifestyle ones were extracted from the medical records of the cases, the environmental risk factor and the remaining lifestyle risk factors were obtained from published data on each LGA in the state [31]. The variables made up of biomedical, lifestyle, and environmental risk factors were broken down into constituents for a detailed analysis. The resulting 104 variables were then aggregated at LGA levels; this was achieved by sorting each of the variables based on LGA in Excel. Taking the number of diagnosed CVD cases as the dependent variable, the variables became the independent ones (Table 1). They were then standardized to maintain uniformity in interpretation [32].
Breakdown of variables used in executing the stepwise regression
| Variable | Breakdown | |
|---|---|---|
| Residential location (2) | LGA population and LGA population density | |
| Gender (2) | Female and male | |
| Marital status (5) | Divorced, married, separated, single, and widowed | |
| Ethnicity (5) | South-south, North-central, Igbo, Hausa, Yoruba | |
| Age (8) | Adolescents, twenties, thirties, forties, fifties, sixties, seventies, and eighties upwards | |
| Educational level (2) | Below secondary school, secondary school and above | |
| Occupation (52) | Academics, Accounting, Administration, Agric, Apprenticeship, Artisan, Aviation, Banking, Beauty & Body Care, Business, Child Care, Civil Service, Construction, Contracting, Corp member, Education, Engineering, Entertainment, Environmental, Fashion, Finance, Food & Confectionary, Health, Home Maker, Hospitality, Information and communications technology, Leadership, Legal, Manufacturing, Maritime, Marketing, Media & Communication, Medicine, Military, Nursing, Para Military, Pharmacy, Policing, Politician, Public servant, Real Estate, Religion, Retired, Sales, Security, Self-employed, Services, Sports, Student, Trading, Transport, and Unemployed | |
| Risk factors | Biomedical (20) | Ageing, anxiety, cardio, coronary artery disease, depression, diabetes, emotional pain, excessive weight, high blood pressure, hereditary, high cholesterol, kidney disease, past heart disease, sleep apnea, stress, BMI (normal, obese, overweight, and underweight) |
| Lifestyle (7) | Alcohol use, smoking, drug abuse, IGR, number of banks, number of malls, number of restaurants/eateries, number of parks, and number of hotels | |
| Environmental (1) | Percentage built-up area of the LGA | |
Adolescents – 18–19 years; twenties – 20–29 years; thirties – 30–39 years; forties – 40–49 years; fifties – 50–59 years; sixties – 60–69 years; seventies – 70–79 years; eighties upwards ≥80 years; NA – not available; IGR – internally generated revenue.
For each LGA, the landmass, the population density, the internally generated revenue (IGR), the number of banks, the number of restaurants/eateries, the number of hotels, the number of malls, and the number of parks were extracted from the 2018 edition of the Abstract of Local Government Statistics [31], which is a publication of the Lagos State Bureau of Statistics. The total built-up area (km2) in each LGA was derived from the built-up area data of Lagos State on the GRID3 Nigeria project. IGR was a proxy for the level of affluence in the LGA; the number of banks was a surrogate for sedentary works style; the number of restaurants/eateries was to measure exposure to fast food (poor diet); the number of hotels was to measure possible exposure to alcohol use and smoking; the number of parks, the number of malls, and the extent of the built-up area were measures of the avenues of physical exercise [1,6,11,33]. Details of the variables are presented in Table 1.
The stepwise multiple regression model was defined as follows:
where Y denotes CVD cases, X 1 is the log of LGA population, X 2 is the LGA population density, X 3 is the number of female cases in the LGA, X 4 is the number of male cases in the LGA, …, X 102 is the number of parks in the LGA, X 103 is the number of hotels in the LGA, and X 104 is the built-up area of the LGA.
The plot of the square root of standardized residuals against the fitted value did not show any apparent pattern, indicating that the model was well formulated. Then, the regression model residuals were plotted to reveal the inherent spatial pattern. The stepwise regression selected 16 out of the 104 variables as predictors of diagnosed CVD; hence, their standardized values were used to run a GWR to examine how their coefficients changed across the study area. Standardization by z-score involves transforming the variables to have a mean of 0 and a standard deviation of 1. This is done to ensure that all variables are on the same scale, which can be important for interpreting the results since variables with different units and scales can otherwise lead to complications in model interpretation [32,34].
To ascertain the existence or otherwise of a relationship between diagnosed CVD cases and LGA populations, on the one hand, and diagnosed CVD and distances from the LGAs to the healthcare facility at LASUTH, on the other hand, Pearson correlation analysis was adopted. The centroid of each LGA was first determined, and then the intervening distances between the centroids and LASUTH were measured in kilometers.
GWR [23] is a spatial analysis technique that takes nonstationary variables into consideration; it is used to analyze spatial nonstationarity, which is defined as when the measurement of a variable changes across space [35]. It evaluates a local model of the variable that needs to be understood by fitting a regression equation to every feature in the dataset [23].
The GWR model is formulated as follows:
With the estimator:
where y
i
is the dependent variable for the ith observation, x
1i
, x
2i
, …, x
ni
are the independent variables, β
0i
, β
1i
, β
2i
, …, β
n
are the coefficients, ε
i
is the error term,
Compared with traditional regression techniques, GWR can provide a more accurate and detailed analysis of spatial data [36], can help identify spatial patterns and relationships that may not be apparent with other method, and can be used for a variety of applications, including exploratory data analysis, modeling, and prediction [37]. However, GWR can be computationally intensive and may require specialized software, and the results are difficult to interpret, especially when dealing with complex spatial relationships [36]. Also, it may not be appropriate for all types of spatial data or research questions [38].
A formal diagnostic test of the model returned a high variance inflation factors, and variable selection and regularization techniques (Lasso and Ridge regressions) were undertaken to deal with the observed multicollinearity, but the R-square was still high. However, it is pertinent to note that multicollinearity does not affect the overall fit of the model and does not apparently impact predictions [39,40,41], and GWR is robust to it [42].
While ρ was set to <0.05, Microsoft Excel 2013 was used for data cleaning, SPSS software was used for stepwise regression analysis, and the R package “spgwr” [43] was used for GWR analysis. “spgwr” adopts the initial selection of a fixed bandwidth for an isotropic spatial weights kernel, which is naturally a Gaussian kernel. This task can be very demanding because multiple regressions must be fitted at each step. The resulting variations were mapped using the R package “tmap” [44].
3 Results
There were 6,780 cases of medically diagnosed CVDs for the study period 2008–2018, with 51% females. The mean age of the patients was 53.1 ± 15.6 years, although the males were slightly older than the females (53.4 ± 15.6 years). Men (75.0 ± 13.9 kg) weighed more than women, even though the overall average weight was 73.5 ± 14.7 kg. The mean height of men was 1.68 ± 0.1 m, while the average height of the population was 1.66 ± 0.1 m (Table 2). The average BMI of the population was 27.6 ± 5.8, while the average for women (28.2 ± 6.1) was higher. Their educational attainment showed that 59.7% had tertiary education (50.6% males), 15.4% had secondary school education (54.4% females), 3.0% had primary school education (57.1% females), 2.3% had other forms of education (51.6% male), and 5.6% had no formal education (55.2% females). There was no information on the educational attainment of 14% of the cases (51.6% females) (Table 2).
Socio-demographic and anthropometric characteristics of diagnosed CVD cases (2008–2018) in Lagos State
| Cases | % | Female | % | Male | % | |
|---|---|---|---|---|---|---|
| Gender | 6,780 | 3,458 | 51.0 | 3,317 | 48.9 | |
| Age | 53.1 ± 15.6 | 52.9 ± 15.7 | 53.4 ± 15.6 | |||
| Weight | 73.5 ± 14.7 | 72.2 ± 15.4 | 75.0 ± 13.9 | |||
| Height | 1.66 ± 0.1 | 1.63 ± 0.1 | 1.68 ± 0.1 | |||
| BMI | 27.6 ± 5.8 | 28.2 ± 6.1 | 27.5 ± 5.2 | |||
| Education | ||||||
| Tertiary | 4,047 | 59.7 | 1,998 | 49.4 | 2,049 | 50.6 |
| Secondary | 1,045 | 15.4 | 569 | 54.4 | 476 | 45.6 |
| Primary | 205 | 3.0 | 117 | 57.1 | 88 | 42.9 |
| Others | 155 | 2.3 | 75 | 48.4 | 80 | 51.6 |
| None | 382 | 5.6 | 211 | 55.2 | 171 | 44.8 |
| NA | 946 | 14.0 | 488 | 51.6 | 458 | 48.4 |
| Marital St | ||||||
| Married | 4,943 | 72.9 | 2,537 | 51.3 | 2,406 | 48.7 |
| Single | 686 | 10.1 | 270 | 39.4 | 416 | 60.6 |
| Widowed | 386 | 5.7 | 272 | 70.5 | 114 | 29.5 |
| Separated | 63 | 0.9 | 38 | 60.3 | 25 | 39.7 |
| Divorced | 22 | 0.3 | 14 | 63.6 | 8 | 36.4 |
| NA | 680 | 10.0 | 327 | 48.1 | 353 | 51.9 |
| Age group | ||||||
| Adolescents | 51 | 0.8 | 26 | 51.0 | 25 | 49.0 |
| Twenties | 428 | 6.3 | 217 | 50.7 | 211 | 49.3 |
| Thirties | 951 | 14.0 | 510 | 53.6 | 441 | 46.4 |
| Forties | 1,295 | 19.1 | 679 | 52.4 | 616 | 47.6 |
| Fifties | 1,442 | 21.3 | 698 | 48.4 | 744 | 51.6 |
| Sixties | 1,421 | 21.0 | 744 | 52.4 | 677 | 47.6 |
| Seventies | 890 | 13.1 | 426 | 47.9 | 464 | 52.1 |
| Eighties | 247 | 3.6 | 125 | 50.6 | 122 | 49.4 |
| Nineties | 38 | 0.6 | 21 | 55.3 | 17 | 44.7 |
| Hundreds | 1 | 0.0 | 1 | 100.0 | 0 | 0.0 |
| NA | 16 | 0.2 | 11 | 68.8 | 5 | 31.3 |
| BMI group | ||||||
| Obese | 1,478 | 21.8 | 844 | 57.1 | 634 | 42.9 |
| Overweight | 2,650 | 39.1 | 1,286 | 48.5 | 1,364 | 51.5 |
| Normal | 2,438 | 36.0 | 1,211 | 49.7 | 1,227 | 50.3 |
| Underweight | 126 | 1.9 | 70 | 55.6 | 56 | 44.4 |
| NA | 88 | 1.3 | 47 | 53.4 | 41 | 46.6 |
Adolescents – 18–19 years; twenties – 20–29 years; thirties – 30–39 years; forties – 40–49 years; fifties – 50–59 years; sixties – 60–69 years; seventies – 70–79 years; eighties upwards ≥80 years; NA – not available.
While 72.9% were married (51.3% females), 10.1% were single (60.6% males), 5.7% were widowed (70.5% females), 0.9% were separated (60.3% females), and 0.3% were divorced (63.6% females). The data on the marital status of 10% (51.9 males) were unavailable. Among the patients, those overweight were 39.1% (51.5% females), those obese were 21.85 (57.1% females), those underweight were 1.9% (55.6% females), and those with normal weight were 36% (50.3% males). However, the weight information of 1.3% (53.4% females) was not available.
Based on age categorization, CVD patients who were between 50 and 59 years had the highest number of cases (21.3%), followed by those between 60 and 69 years (21.1%). Those that were between 90 and 100 years inclusive (0.6%) and the adolescents (0.8%) group had the lowest number of cases. The data on the age category of 0.2% of the population were not available. Overall, the women (51.0%) were more than the men and also outnumbered men in eight of the ten age groups (Table 2).
The projected population of Lagos State in 2018 was 25,615,703 [31]. Alimosho LGA was the most populous, with a population figure of 2,987,306 (11.7%). Ajeromi-Ifelodun and Mushin LGA followed with 2,094,583 (8.2%) and 1,928,542 (7.5%), respectively. At the other end of the population spectrum were Badagry, Epe, and Ibeju-Lekki LGAs, with 555,162 (2.2%), 472,292 (1.8%), and 145,263 (0.6%) people, respectively.
Alimosho LGA had the highest number of diagnosed CVD cases (19.4%) over the study period, followed by Mushin (10.6%) and Agege (9.7%) LGAs. The LGAs with the lowest number of diagnosed CVD cases during the period were Badagry (0.9%), Ajeromi-Ifelodun (0.3%), Epe (0.3%), and Ibeju-Lekki (0.2%) LGAs. Maps of both the distributions of population and cases are presented in Figure 1a and b. The LGAs with highly diagnosed CVD cases were concentrated in the north-central part of the state, while those with lower figures were in the western, eastern, and southern parts of the state.
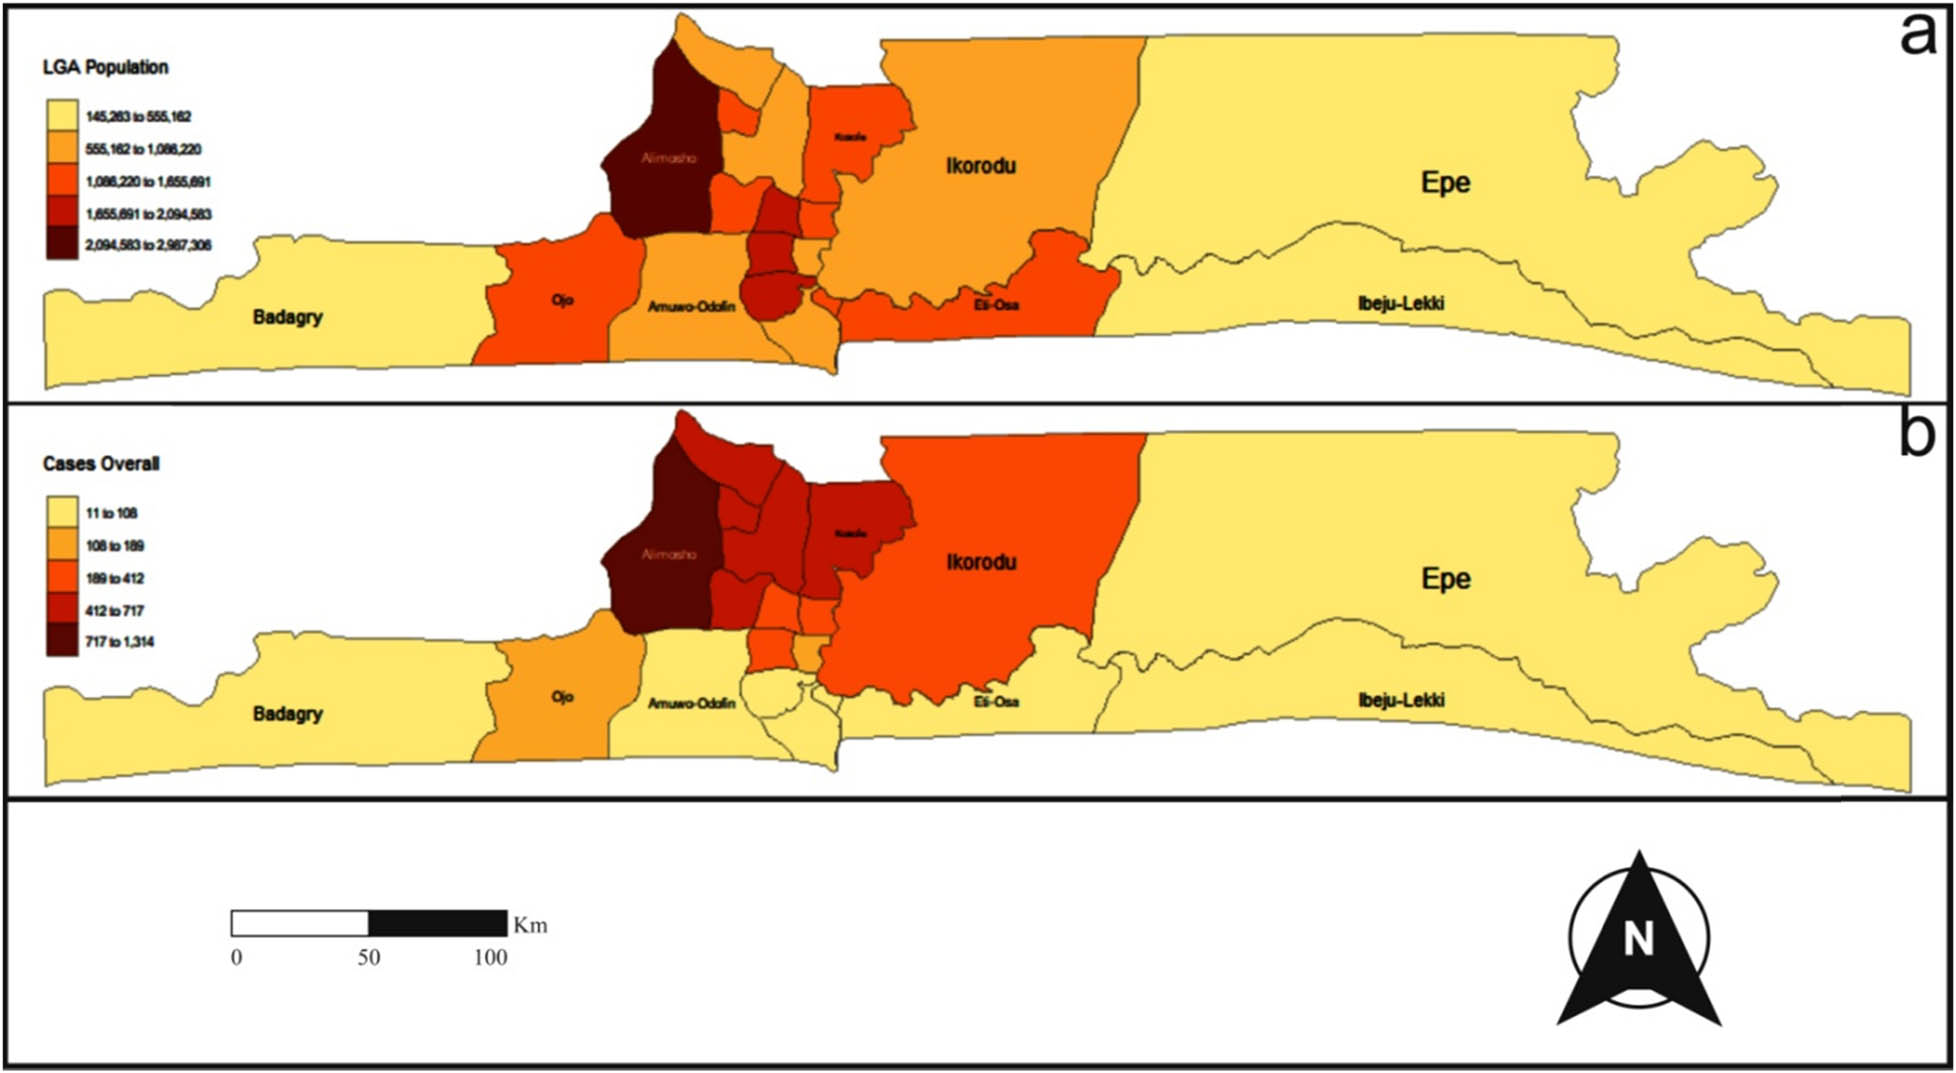
(a) The year 2018 population distribution map of the 20 LGAs of Lagos State, and (b) the map of the distribution of diagnosed CVD cases (2008–2018) in Lagos State.
Out of the 104 variables included in the stepwise regression, the female gender, the male gender, the forties age group, the seventies age group, the twenties age group, the thirties age group, transport profession, accounting profession, fashion profession, the built-up extent, drug abuse, past heart diseases, maritime profession, Yoruba ethnicity, the adolescent age group, and manufacturing profession were identified as the predictors of diagnosed CVD cases in Lagos State. Thus, these predictors can be summarized as gender, age, profession, environment, lifestyle, biomedical, and ethnicity, which conform to some known risk factors. From the model summary, the R-squared value of .998 indicated that the model explains 99.8% of the variance in the dependent variable. This means that the independent variables in the model are highly correlated with the dependent variable. The adjusted R-squared value of .998 is the same as the R-squared value, which suggests that the model does not have any unnecessary variables. The standard error of the estimate of 14.847 indicated the average distance that the observed values fall from the regression line, suggesting that the model’s predictions have relatively low variability around the actual values.
Checking the catch-all plot associated with the model showed no discernible pattern in the points, implying that the model was correctly specified. Plotting the residuals of the regression model to ascertain any spatial pattern revealed an apparent pattern.
The summary of the GWR coefficients (Table 3) revealed how each coefficient varied across the 20 LGAs of Lagos State, although the local coefficient variations observable in the fit were small. The coefficient of the female gender was almost stationary at 170.41, and that of the male gender at 157.88. However, there was a negative relationship between diagnosed CVD cases and seven of the variables: the forties age group, the seventies age group, the thirties age group, the built-up extent, the maritime occupational group, the adolescent age group, and the manufacturing occupational group. Nevertheless, the small values and the narrow range of the coefficients showed that their impact on diagnosed CVD might be negligible.
Summary of GWR coefficient estimates of the predictors of diagnosed CVD in Lagos State
| Min | 1st Qu | Median | 3rd Qu | Max | Global | |
|---|---|---|---|---|---|---|
| X.Intercept. | 3.3280 × 10² | 3.3280 × 10² | 3.3280 × 10² | 3.3280 × 10² | 3.3280 × 10² | 332.7999 |
| ZFemale | 1.7041 × 10² | 1.7041 × 10² | 1.7041 × 10² | 1.7041 × 10² | 1.7041 × 10² | 170.4119 |
| ZMale | 1.5788 × 10² | 1.5788 × 10² | 1.5788 × 10² | 1.5788 × 10² | 1.5788 × 10² | 157.8823 |
| ZA_40 | −3.8528 × 10⁻³ | −2.4233 × 10⁻³ | −2.2139 × 10⁻³ | −2.1014 × 10⁻³ | −1.6533 × 10⁻³ | −0.0027 |
| ZA_70 | −1.9052 × 10⁻³ | −1.1785 × 10⁻³ | −1.0781 × 10⁻³ | −1.0255 × 10⁻³ | −8.2589 × 10⁻⁴ | −0.0014 |
| ZA_20 | 2.2886 × 10⁻³ | 2.4223 × 10⁻³ | 2.4553 × 10⁻³ | 2.4808 × 10⁻³ | 2.5333 × 10⁻³ | 0.0024 |
| ZA_30 | −2.1543 × 10⁻³ | −1.3251 × 10⁻³ | −1.2026 × 10⁻³ | −1.1375 × 10⁻³ | −8.8353 × 10⁻⁴ | −0.0015 |
| ZTransport | 2.0594 × 10⁻³ | 2.1471 × 10⁻³ | 2.1703 × 10⁻³ | 2.1964 × 10⁻³ | 2.2301 × 10⁻³ | 0.0021 |
| ZAcct | 1.2607 × 10⁻³ | 1.3294 × 10⁻³ | 1.3470 × 10⁻³ | 1.3790 × 10⁻³ | 1.5618 × 10⁻³ | 0.0014 |
| ZFashion | 59,711 × 10−3 | 6.1788 × 10⁻³ | 6.2270 × 10⁻³ | 6.3195 × 10⁻³ | 6.8529 × 10⁻³ | 0.0064 |
| ZBuiltup | −4.3323 × 10⁻⁴ | −4.0008 × 10⁻⁴ | −3.9103 × 10⁻⁴ | −3.7642 × 10⁻⁴ | −3.5850 × 10⁻⁴ | −0.0004 |
| ZDrug_Abuse | 2.6882 × 10⁻³ | 2.7260 × 10⁻³ | 2.7363 × 10⁻³ | 2.7562 × 10⁻³ | 2.9442 × 10⁻³ | 0.0028 |
| ZPast_Hrt_dx | 1.1157 × 10⁻³ | 1.2017 × 10⁻³ | 1.2242 × 10⁻³ | 1.2606 × 10⁻³ | 1.3422 × 10⁻³ | 0.0012 |
| ZMaritime | −2.8802 × 10⁻³ | −2.7348 × 10⁻³ | −2.7248 × 10⁻³ | −2.7183 × 10⁻³ | −2.7041 × 10⁻³ | −0.0028 |
| ZYoruba | 1.4277 × 10⁻³ | 1.4408 × 10⁻³ | 1.4471 × 10⁻³ | 1.4572 × 10⁻³ | 1.5107 × 10⁻³ | 0.0015 |
| ZA_Adolescent | −7.8980 × 10⁻⁴ | −7.6460 × 10⁻⁴ | −7.5856 × 10⁻⁴ | −7.5528 × 10⁻⁴ | −7.4116 × 10⁻⁴ | −0.0008 |
| ZManufacturing | −3.3834 × 10⁻⁴ | −3.0659 × 10⁻⁴ | −3.0279 × 10⁻⁴ | −3.0082 × 10⁻⁴ | −2.9469 × 10⁻⁴ | −0.0003 |
Conversely, a positive relationship existed between diagnosed CVD and the remaining nine variables: Female gender, male gender, twenties age group, transport occupational group, accounting profession, fashion occupational group, drug abuse, past heart disease, and Yoruba ethnic group.
The visualization of the spatial heterogeneity of the coefficients of the 16 model variables is presented in Figure 2. The coefficient of the female gender varied across the state, with the figures rising from the west to the east. The extreme figures were in the rural LGAs located at the two ends of the state. The 16 LGAs had female gender coefficients lower than the median value, including the LGAs with high populations. Similarly, the coefficient of the male gender had a west to the east gradient of variation, with a spatial pattern comparable to that of the female gender, and nine of the LGAs had male gender coefficient values lower than the median value.
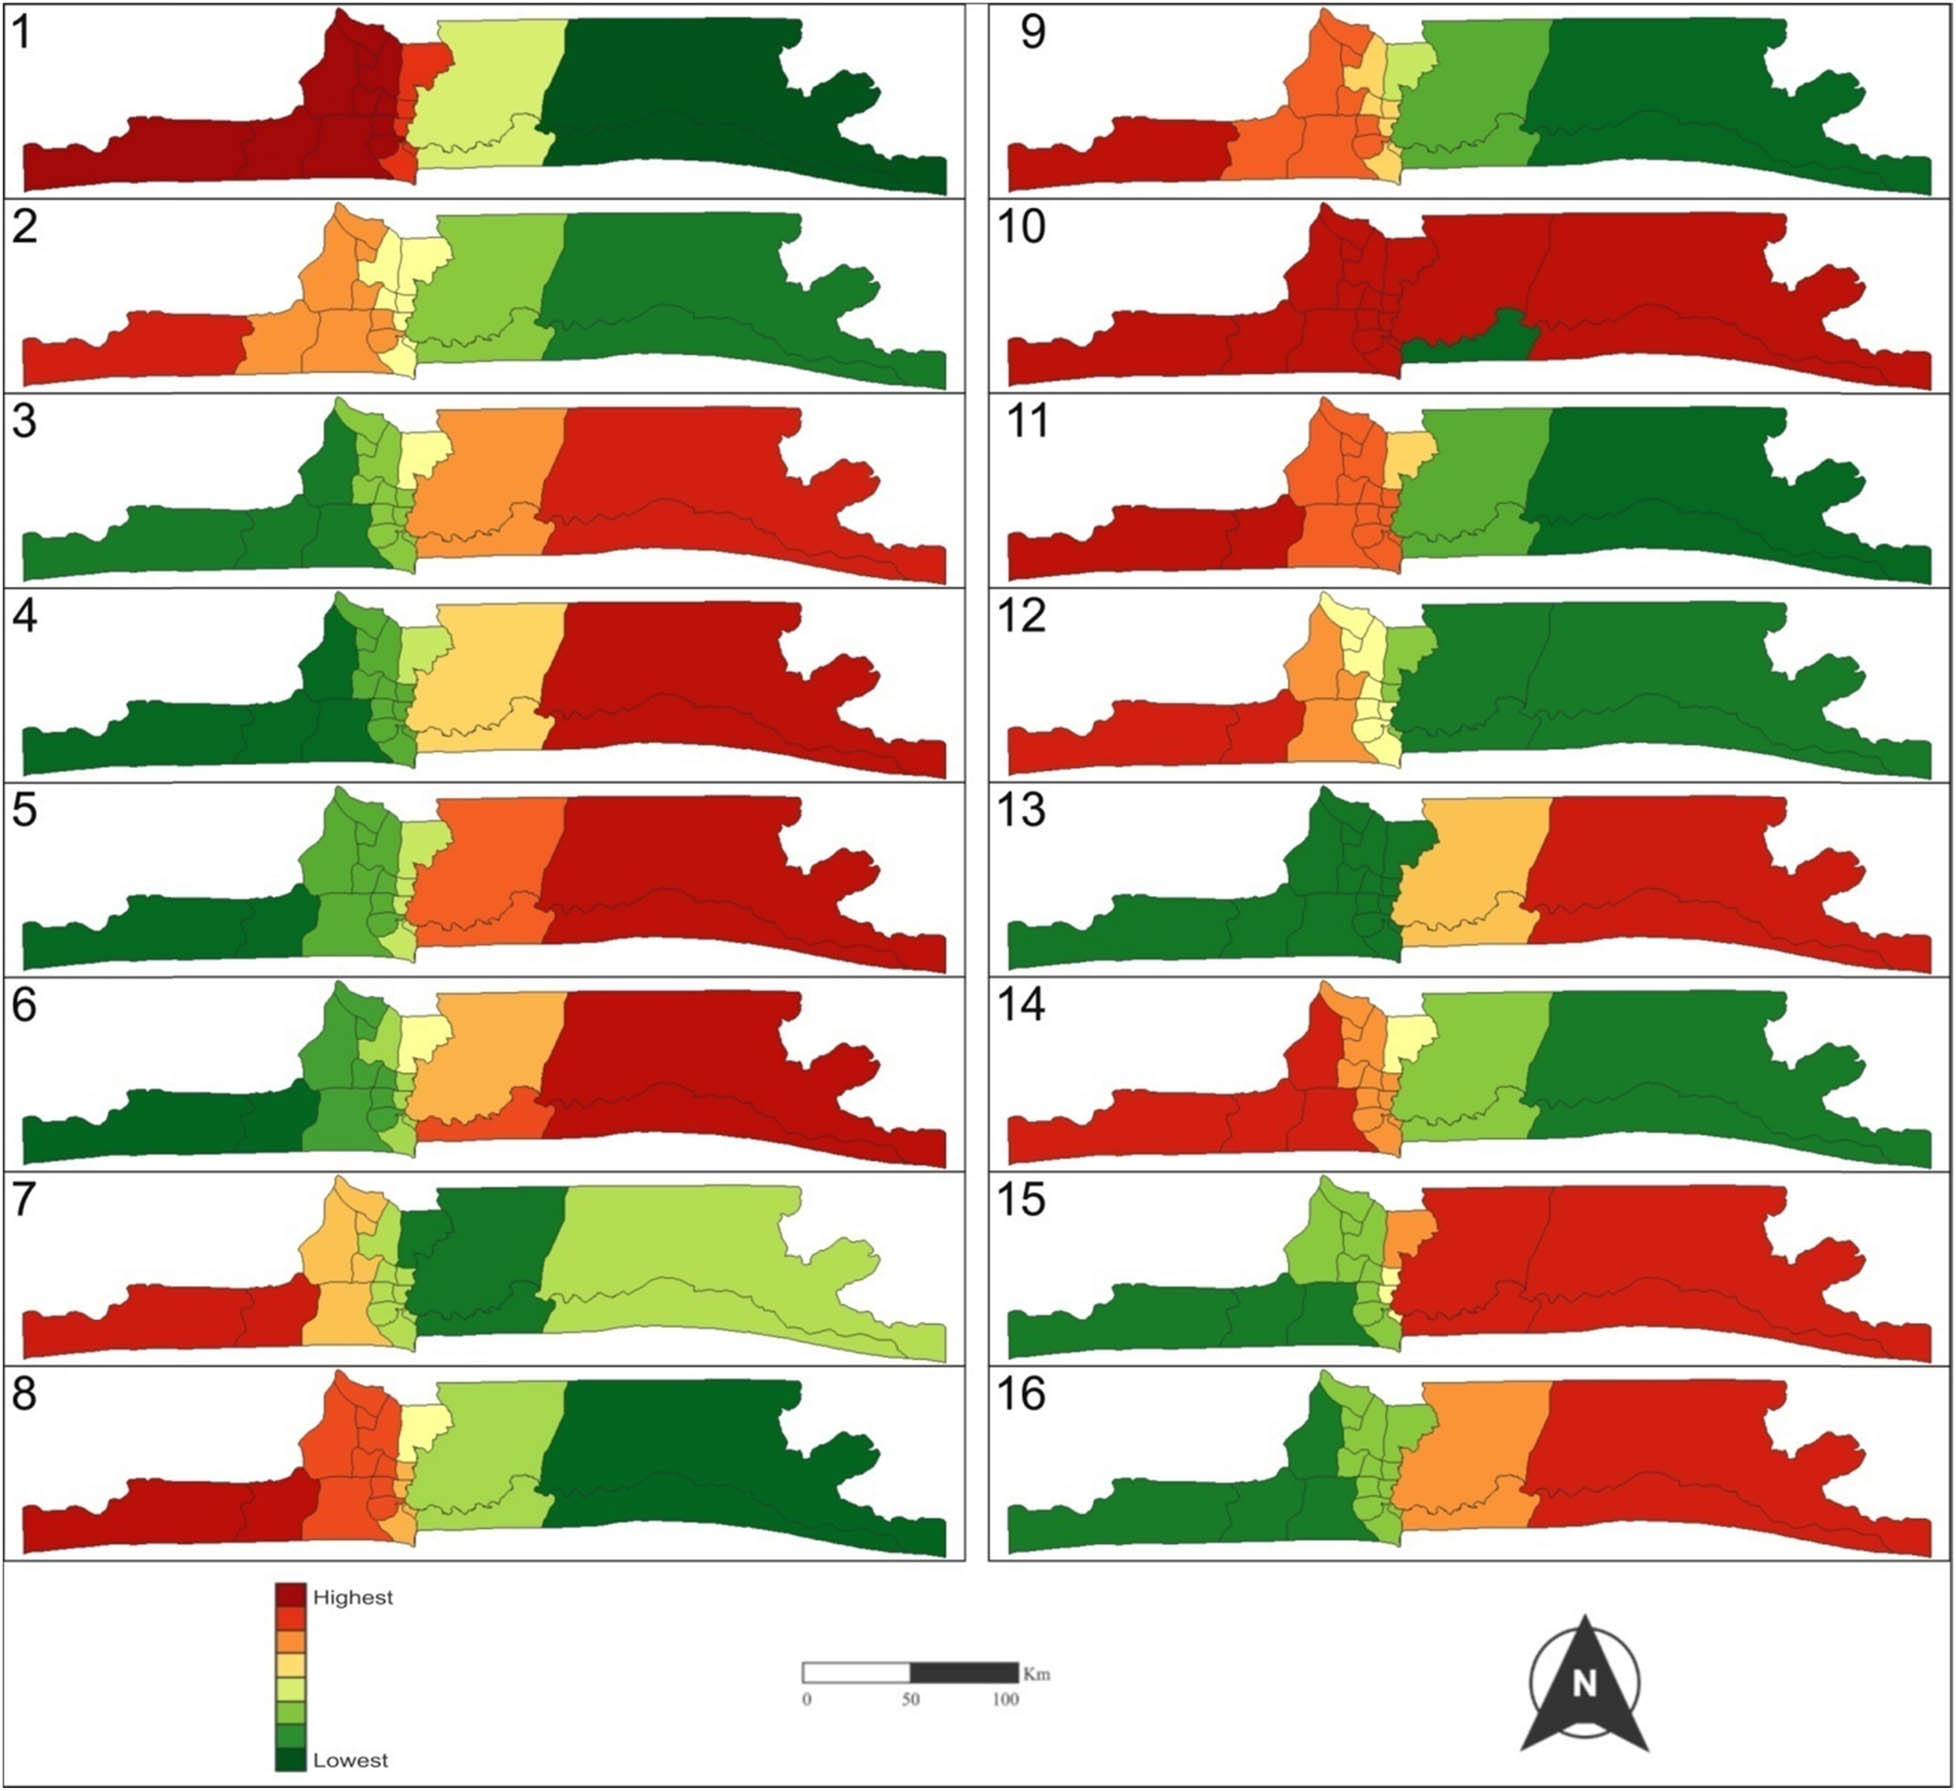
Maps of the variation of the coefficient of the predictors of diagnosed CVD cases (2008–2018) in Lagos State. Variables: (1) female gender, (2) male gender, (3) age 40s, (4) age 70s, (5) age 20s, (6) age 30s, (7) transport sector, (8) accounting profession, (9) fashion profession, (10) built-up area, (11) drug abuse, (12) past heart disease, (13) maritime profession, (14) Yoruba ethnicity, (15) age adolescent, and (16) manufacturing profession.
The coefficients of the age groups (adolescent, twenties, thirties, forties, and seventies) varied oppositely to those of the genders, increasing from the east to the west. However, the most extreme values were observed in the rural LGAs located in the extremes of the state, with the four LGAs (Ikorodu, Epe, Eti-Osa, and Ibeju-Lekki) on the eastern half of the state recording coefficient values lower than the median value. Following a trend akin to that of the age groups, the coefficients of the maritime and manufacturing professions demonstrated an east–west gradient. While the values of the coefficient of the maritime profession were lower than the median value occurred in four LGAs, the values of the coefficient of the manufacturing profession that were lower than the median value were observable in five LGAs.
The variation of the coefficient of the transport profession revealed a pattern different from the previously observed east–west and west–east gradients. The coefficient values lower than the median value were in the western part of the state, rising eastward. However, there was a low–high–low pattern for the coefficient values higher than the median value. Unlike the patterns of the earlier coefficients, the extremely high values were not at the eastern extreme of the state. The spatial pattern of the coefficient of the built-up area was another deviation from the dominant east–west and west–east gradients. Eti-Osa was the only LGA with a built-up area coefficient value above the median; all the other LGAs in the state had values lower than the median. The coefficients of the remaining five predictors of diagnosed CVD cases (accounting profession, fashion profession, drug abuse, past heart disease, and Yoruba ethnicity) for the period 2008–2018 exhibited a west–east variation, with values above the median occurring in the eastern part of the state. Most of the LGAs in the state, with respect to these predictor variables, had coefficient values below the median values of each predictor.
At a distance of 0.96 km, as expected, the centroid of Ikeja LGA was the closest to the CVD clinic at the LASUTH, followed by that of Agege LGA (4.18 km). Whereas the centroid of Oshodi-Isolo LGA was 6.32 km from the healthcare facility, that of Mushin, Kosofe, Ifako-Ijaiye, Shomolu, and Alimosho were 6.70, 8.22, 8.66, 8.75, and 9.55 km, respectively, from the LASUTH. While all these LGAs had their centroids at less than 10 km from LASUTH, the remaining 12 LGAs of the state were more than 10 km from the CVD clinic. The farthest centroid from the clinic was Epe LGA (66.47 km), followed by Ibeju-Lekki (63.70 km), Badagry (49.36 km), Eti-Osa (27.01 km), Ojo (24.68 km), and Ikorodu (21.09 km). The correlation of diagnosed CVD cases at the LGA level with distances from the LGAs to the healthcare facility at LASUTH was −0.61, while the correlation of diagnosed CVD cases in LGAs with the LGA populations was 0.63.
4 Discussion
A total of 104 variables were considered as possible predictors of diagnosed CVD in Lagos State during the study period, and 16 variables were identified as contributing to the observed diagnosed CVD pattern. However, of these variables, the female gender explained 99.8% of the observed cases. This might not be due to biology, but it could be because women use healthcare services more than men [45]. The plausibility of this assumption is further strengthened by the number of women in the study population being more than the men in the age categories of adolescents to sixties. Wang et al. [46] observed that the most significant gap in healthcare facility utilization between men and women occurs between the ages of 16 and 60 years.
Also, the high contribution of females to the model might be due to their susceptibility to various risk factors for CVD such as hypertension, obesity, and diabetes, which are prevalent among women in Lagos State [47,48]. Women in the study group were more obese than men, and women aged 50–60 years were most diagnosed with CVD during the study period, which corroborates the fact that women’s risk for CVD increases with age, particularly after menopause due to hormonal profile changes [48]. In addition, the high contribution of the female gender could also be as a result of the residual effect of pregnancy-related complications, such as preeclampsia and gestational diabetes, which have been known to increase the risk of CVD in women later in life [48], and the urban nature of Lagos State makes the incidence of these complications rife [47].
The map in Figure 1b shows a concentration of LGAs with elevated numbers of diagnosed cases of CVD situated in the central region of the state, near LASUTH in Ikeja, which is also in the central part of the state. This clustering may be attributable to the inverse relationship between diagnosed CVD cases and the distances from the LGAs to the healthcare facility. With a correlation coefficient of −0.61, it indicates that as the distance to the healthcare facility increases, the number of cases decreases. While this does not necessarily imply a reduction in the occurrence of the disease, it does suggest that greater distances act as a barrier to seeking diagnosis. This finding aligns with that of Oviasu [49], who found that, for NCDs, proximity to a healthcare facility facilitates early diagnosis. Hence, geography plays a crucial role in explaining the observed pattern of diagnosed CVD cases in Lagos State, lending support to the use of the GWR model [18].
While there was a moderate correlation (0.63) between the population and the number of diagnosed cases at the LGA level, there were evident anomalies. A comparison of the maps presented in Figure 1 reveals that there was no straightforward one-to-one relationship between the population of LGAs and the incidence of diagnosed CVD within those LGAs. Some LGAs with larger populations had fewer diagnosed CVD cases compared to LGAs with smaller populations. For instance, Ajeromi-Ifelodun LGA, which ranked second in terms of population within the state, had the fewest diagnosed CVD cases during the study period. In addition, a considerable number of LGAs with high numbers of diagnosed CVD cases also exhibited high population densities. An earlier study [50] had already highlighted issues of residential overcrowding in these areas, confirming that housing could play a negative role in the health of the heart [18,51].
The alignment of the highest coefficient values for gender and age groups with rural LGAs may be linked to the state’s cosmopolitan character and its significant industrialization. In LMICs such as Nigeria, there is an observable difference in the life expectancy of adults, with rural inhabitants tending to live longer than their urban counterparts due to disparities in NCDs, traffic accidents, and other external factors [52,53].
The five occupational groups among the 16 predictors can be classified into two, exhibiting two distinct patterns of heterogeneity. The manufacturing and maritime occupation groups displayed a common east–west spatial pattern, whereas the accounting, transport, and fashion groups demonstrated a west-to-east variation. Besides the spatial similarity, these occupational groups also exhibited similar associations with diagnosed CVD. The latter group, consisting of sedentary occupations, showed a positive correlation with diagnosed CVD, while the former group, which is non-sedentary, displayed a negative relationship with diagnosed CVD. This aligns with prior research findings that suggest that a sedentary lifestyle elevates the risk of CVD [11,12,33].
Regarding the spatial pattern of the built-up area coefficient, it is noteworthy that only Eti-Osa LGA exhibited a coefficient value higher than the median. Eti-Osa LGA is characterized by upscale neighborhoods like Ikoyi, Victoria Island, and Lekki Lagoon, which are known for their meticulous planning and development. Previous research findings have indicated that living conditions at the neighborhood level can worsen diseases such as CVD, leading to poorer health outcomes [17,18,25]. Given that the built-up area coefficient showed a negative relationship with diagnosed CVD cases in the state, the affluence of these neighborhoods may have played a role in shaping the observed spatial pattern.
This study identified the predictors of diagnosed CVD in Lagos State for the study period 2008–2018, using GWR; it showed the association between the cases of the disease and its predictors, revealing their spatial variation across the study area. The ability of the technique to highlight how and where the strength of associations exists between a phenomenon and its explanatory variables makes the spatial regression model readily interpretable [20], while the method is also robust to multicollinearity among explanatory variables [21,42]. However, this study has some limitations. The data were restrictive in its spread, being hospital records of diagnosed cases attending the clinic at the LASUTH; a more extensive database might have revealed a more detailed picture of the variation of diagnosed CVD and its predictors in Lagos State. Also, the use of LGAs as the unit of analysis, as opposed to smaller and more homogeneous area units such as Wards, might reduce the applicability of the findings since interventions at curbing NCDs are best at community and neighborhood levels [18].
5 Conclusion
This study investigated the predictors of diagnosed CVD and their spatial heterogeneity. The findings underscore the significance of considering spatial variations when examining diagnosed CVD, highlighting gender as a prominent predictor. Notably, spatial disparities were observed across all 16 predictor variables. Consequently, it is recommended that gender-specific research and healthcare initiatives be implemented to better address the unique risk factors and challenges faced by women in relation to CVD. While this research provided plausible explanations for the observed spatial heterogeneity, the limitations stemming from the lack of comprehensive data at smaller geographical units highlight the necessity for further investigations to comprehensively unravel the dynamics of the predictor variables and their influence on diagnosed CVD in the study area.
Acknowledgments
The authors appreciate the Management of the Lagos State University Teaching Hospital (LASUTH), Ikeja, especially, the Records Department, under the headship of Prof. Ayeni, for granting access to the data used in this study.
-
Funding information: The authors state no funding involved.
-
Author contributions: OA and OJT were involved in study design, data interpretation, drafting the article, critical revision of the manuscript. OA handled data collection and analysis. All contributing authors read and approved the manuscript prior to submission.
-
Conflict of interest: The authors state no conflict of interest.
-
Data availability statement: Data will be shared on request to the corresponding author with the permission of Lagos University Teaching Hospital (LASUTH).
References
[1] World Health Organisation (WHO). Cardiovascular diseases (CVDs). 2021 [cited 2021 July 3] Accessed 3rd July, 2021. https://www.who.int/news-room/fact-sheets/detail/cardiovascular-diseases-(cvds).Suche in Google Scholar
[2] Gaziano TA. Reducing the growing burden of cardiovascular disease in the developing world. Health Aff. 2007 Jan;26(1):13–24.10.1377/hlthaff.26.1.13Suche in Google Scholar PubMed PubMed Central
[3] Magnusson RS, Patterson D. The role of law and governance reform in the global response to non-communicable diseases. Glob Health. 2014 Dec;10(1):1–8.10.1186/1744-8603-10-44Suche in Google Scholar PubMed PubMed Central
[4] Rahnama MR, Shaddel L. Urban green space is spatially associated with cardiovascular disease occurrence in women of Mashhad: a spatial analysis of influential factors on their presence in urban green spaces. J Urban Health. 2019 Oct;96:653–68.10.1007/s11524-019-00373-1Suche in Google Scholar PubMed PubMed Central
[5] O’Toole TE, Conklin DJ, Bhatnagar A. Environmental risk factors for heart disease. Rev Environ Health. 2008 Jul;23(3):167–202.10.1515/REVEH.2008.23.3.167Suche in Google Scholar PubMed
[6] Chan M. The worldwide rise of chronic noncommunicable diseases: a slow-motion catastrophe. Opening Remarks at the First Global Ministerial Conference on Healthy Lifestyles and Noncommunicable Disease Control. Moscow, Russian Federation: 2011 [cited 2023 Mar 20]. http://www.who.int/dg/speeches/2011/ministerial_conf_ncd_20110428/en/.Suche in Google Scholar
[7] Cosselman KE, Navas-Acien A, Kaufman JD. Environmental factors in cardiovascular disease. Nat Rev Cardiol. 2015 Nov;12(11):627–42.10.1038/nrcardio.2015.152Suche in Google Scholar PubMed
[8] Münzel T, Hahad O, Sørensen M, Lelieveld J, Duerr GD, Nieuwenhuijsen M, et al. Environmental risk factors and cardiovascular diseases: a comprehensive expert review. Cardiovasc Res. 2022 Oct;118(14):2880–902.10.1093/cvr/cvab316Suche in Google Scholar PubMed PubMed Central
[9] CDC. Overview of NCD’s risk factors. 2013 [cited 2023 Mar 20], https://www.cdc.gov/globalhealth/healthprotection/fetp/training_modules/new-8/overview-of-ncds_ppt_qa-revcom_09112013.pdf.Suche in Google Scholar
[10] Tran DM, Lekhak N, Gutierrez K, Moonie S. Risk factors associated with cardiovascular disease among adult Nevadans. PLoS One. 2021 Feb;16(2):e0247105.10.1371/journal.pone.0247105Suche in Google Scholar PubMed PubMed Central
[11] Hunter DJ, Reddy KS. Noncommunicable diseases. NEJM. 2013 Oct;369(14):1336–43.10.1056/NEJMra1109345Suche in Google Scholar PubMed
[12] Dyck J, Tate R, Uhanova J, Torabi M. Social determinants and spatio-temporal variation of ischemic heart disease in Manitoba. BMC Public Health. 2021 Dec;21(1):1–5.10.1186/s12889-021-12369-1Suche in Google Scholar PubMed PubMed Central
[13] Müller-Nordhorn J, Binting S, Roll S, Willich SN. An update on regional variation in cardiovascular mortality within Europe. Eur Heart J. 2008 May;29(10):1316–26.10.1093/eurheartj/ehm604Suche in Google Scholar PubMed
[14] Wang Y, Jiao Y, Nie J, O’Neil A, Huang W, Zhang L, et al. Sex differences in the association between marital status and the risk of cardiovascular, cancer, and all-cause mortality: a systematic review and meta-analysis of 7,881,040 individuals. Glob Health Res Policy. 2020 Dec;5(1):1–6.10.1186/s41256-020-00133-8Suche in Google Scholar PubMed PubMed Central
[15] Wang Y, Du Q, Ren F, Liang S, Lin DN, Tian Q, et al. Spatio-temporal variation and prediction of ischemic heart disease hospitalizations in Shenzhen, China. Int J Environ Res Public Health. 2014 May;11(5):4799–824.10.3390/ijerph110504799Suche in Google Scholar PubMed PubMed Central
[16] Mensah GA, Mokdad AH, Ford ES, Greenlund KJ, Croft JB. State of disparities in cardiovascular health in the United States. Circulation. 2005 Mar;111(10):1233–41.10.1161/01.CIR.0000158136.76824.04Suche in Google Scholar PubMed
[17] Gebreab SY, Roux AV. Exploring racial disparities in CHD mortality between blacks and whites across the United States: a geographically weighted regression approach. Health Place. 2012 Sep;18(5):1006–14.10.1016/j.healthplace.2012.06.006Suche in Google Scholar PubMed PubMed Central
[18] Ford MM, Highfield LD. Exploring the spatial association between social deprivation and cardiovascular disease mortality at the neighborhood level. PLoS One. 2016 Jan;11(1):e0146085.10.1371/journal.pone.0146085Suche in Google Scholar PubMed PubMed Central
[19] Fabiyi OO, Garuba OE. Geo-spatial analysis of cardiovascular disease and biomedical risk factors in Ibadan, South-Western Nigeria. J Settl Spat Plan. 2015;6(1):61–9.Suche in Google Scholar
[20] Kauhl B, Maier W, Schweikart J, Keste A, Moskwyn M. Exploring the small-scale spatial distribution of hypertension and its association to area deprivation based on health insurance claims in Northeastern Germany. BMC Public Health. 2018 Dec;18(1):1–2.10.1186/s12889-017-5017-xSuche in Google Scholar PubMed PubMed Central
[21] Tabb LP, Ortiz A, Judd S, Cushman M, McClure LA. Exploring the spatial patterning in racial differences in cardiovascular health between blacks and whites across the United States: the REGARDS study. JAHA. 2020 May;9(9):e016556.10.1161/JAHA.120.016556Suche in Google Scholar PubMed PubMed Central
[22] Fotheringham AS, Charlton ME, Brunsdon C. Geographically weighted regression: a natural evolution of the expansion method for spatial data analysis. Environ Plan A. 1998 Nov;30(11):1905–27.10.1068/a301905Suche in Google Scholar
[23] Brunsdon C, Fotheringham AS, Charlton ME. Geographically weighted regression: a method for exploring spatial nonstationarity. Geogr Anal. 1996 Oct;28(4):281–98.10.1111/j.1538-4632.1996.tb00936.xSuche in Google Scholar
[24] Mena C, Sepúlveda C, Fuentes E, Ormazábal Y, Palomo I. Spatial analysis for the epidemiological study of cardiovascular diseases: a systematic literature search. Geospat Health. 2018 May;13(1):11–9.10.4081/gh.2018.587Suche in Google Scholar PubMed
[25] Comber AJ, Brunsdon C, Radburn R. A spatial analysis of variations in health access: linking geography, socio-economic status and access perceptions. Int J Health Geograph. 2011 Dec;10:1.10.1186/1476-072X-10-44Suche in Google Scholar PubMed PubMed Central
[26] National Population Commission (NPC). National Results: 2016 Population by State and Sex; 2016.Suche in Google Scholar
[27] Lagos State Government (LSG). About Lagos. 2019 [cited 2019 Jan 12], https://lagosstate.gov.ng/about-lagos/.Suche in Google Scholar
[28] Lagos State Ministry of Health (LSMoH). Lagos State Government Strategic Health Development Plan (2010-2015). Lagos State Ministry of Health; 2010.Suche in Google Scholar
[29] United Nations (UN). The World’s Cities in 2016, United Nations, Department of Economic and Social Affairs, Population Division. Data Booklet (ST/ESA/SER.A/392); 2016.Suche in Google Scholar
[30] Rice X. Africa: Lessons from Lagos. Financial Times. 2012.Suche in Google Scholar
[31] Lagos Bureau of Statistics (LBS). Abstract of Local Government Statistics. Lagos Bureau of Statistics, Lagos Ministry of Economic Planning and Budget; 2019.Suche in Google Scholar
[32] Frey BB, editor. The SAGE encyclopedia of educational research, measurement, and evaluation. Thousand Oaks, California, USA: Sage Publications; 2018 Jan.10.4135/9781506326139Suche in Google Scholar
[33] Mensah GA, Roth GA, Sampson UK, Moran AE, Feigin VL, Forouzanfar MH, et al. GBD 2013 mortality and causes of death collaborators. Mortality from cardiovascular diseases in sub-Saharan Africa, 1990-2013: a systematic analysis of data from the Global Burden of Disease Study 2013. Cardiovasc J Afr. 2015;26(2 Suppl 1):S6–10.10.5830/CVJA-2015-036Suche in Google Scholar PubMed PubMed Central
[34] Comber A, Brunsdon C, Charlton M, Dong G, Harris R, Lu B, et al. A route map for successful applications of geographically weighted regression. Geograph Anal. 2023 Jan;55(1):155–78.10.1111/gean.12316Suche in Google Scholar
[35] Wheeler DC, Páez A. Geographically weighted regression. In: Handbook of applied spatial analysis: software tools, methods and applications. Berlin, Heidelberg: Springer Berlin Heidelberg; 2009 Nov. p. 461–86.10.1007/978-3-642-03647-7_22Suche in Google Scholar
[36] Sulekan A, Jamaludin SS. Review on Geographically Weighted Regression (GWR) approach in spatial analysis. Malays J Fundam Appl Sci. 2020 Apr;16(2):173–7.10.11113/mjfas.v16n2.1387Suche in Google Scholar
[37] Fotheringham AS, Brunsdon C, Charlton M. Geographically weighted regression: the analysis of spatially varying relationships. Hoboken, New Jersey, USA: John Wiley & Sons; 2003 Feb.Suche in Google Scholar
[38] Leong YY, Yue JC. A modification to geographically weighted regression. Int J Health Geogr. 2017 Dec;16:1–8.10.1186/s12942-017-0085-9Suche in Google Scholar PubMed PubMed Central
[39] Frost J. Multicollinearity in regression analysis: problems, detection, and solutions. Stat Jim. 2017 Apr;2. https://statisticsbyjim.com/regression/multicollinearity-in-regression-analysis.Suche in Google Scholar
[40] Minitab. What are the effects of multicollinearity and when can I ignore them? 2013 May; https://blog.minitab.com/en/adventures-in-statistics-2/what-are-the-effects-of-multicollinearity-and-when-can-i-ignore-them.Suche in Google Scholar
[41] Wu S Multicollinearity in regression: Why it is a problem? How to check and fix it. 2020 May; https://towardsdatascience.com/multi-collinearity-in-regression-fe7a2c1467ea.Suche in Google Scholar
[42] Fotheringham AS, Oshan TM. Geographically weighted regression and multicollinearity: dispelling the myth. J Geogr Syst. 2016;18:303–29.10.1007/s10109-016-0239-5Suche in Google Scholar
[43] Bivand R, Yu D. spgwr: Geographically Weighted Regression. R package version 0.6-34. 2020. https://CRAN.R-project.org/package = spgwr.Suche in Google Scholar
[44] Tennekes M. tmap: Thematic Maps in R. J Stat Softw. 2018 Apr;84:1–39.10.18637/jss.v084.i06Suche in Google Scholar
[45] Bertakis KD, Azari R, Helms LJ, Callahan EJ, Robbins JA. Gender differences in the utilization of health care services. J Fam Pract. 2000 Feb;49(2):147.Suche in Google Scholar
[46] Wang Y, Hunt K, Nazareth I, Freemantle N, Petersen I. Do men consult less than women? An analysis of routinely collected UK general practice data. BMJ Open. 2013 Aug;3(8):e003320.10.1136/bmjopen-2013-003320Suche in Google Scholar PubMed PubMed Central
[47] Ogbera AO. Prevalence and gender distribution of the metabolic syndrome. Diabetol Metab Syndr. 2010 Dec;2:1–5.10.1186/1758-5996-2-1Suche in Google Scholar PubMed PubMed Central
[48] de Castro ML. Third in a series on diabetes and the heart. Diabetic heart disease in women: prevalence as compared to men? Implications for treatment? EJ Cardiol Pract. 2016;2016(14):1–8.Suche in Google Scholar
[49] Oviasu O. The spatial analysis of diagnosed chronic kidney disease in Nigeria: a case study of Edo State. (Doctoral dissertation, University of Sheffield); 2012.Suche in Google Scholar
[50] Ijasan KC, Ogunro VO. How rapid urbanisation, neighbourhood management affects living conditions. A survey of Agege local government area, Lagos, Nigeria. J Sustain Dev. 2014 Dec;7(6):110.10.5539/jsd.v7n6p110Suche in Google Scholar
[51] Sims M, Kershaw KN, Breathett K, Jackson EA, Lewis LM, Mujahid MS, et al. Importance of housing and cardiovascular health and well-being: a scientific statement from the American Heart Association. Circ Cardiovasc Qual Outcomes. 2020 Aug;13(8):e000089.10.1161/HCQ.0000000000000089Suche in Google Scholar PubMed PubMed Central
[52] Sudharsanan N, Ho JY. Rural–urban differences in adult life expectancy in Indonesia: a parametric g-formula–based decomposition approach. Epidemiol (Cambridge, Mass). 2020 May;31(3):393.10.1097/EDE.0000000000001172Suche in Google Scholar PubMed PubMed Central
[53] Wu J, Kc S, Luy M. The gender gap in life expectancy in urban and rural China, 2013–2018. Front Public Health. 2022 Feb;10:749238.10.3389/fpubh.2022.749238Suche in Google Scholar PubMed PubMed Central
© 2024 the author(s), published by De Gruyter
This work is licensed under the Creative Commons Attribution 4.0 International License.
Artikel in diesem Heft
- Research Articles
- Predictors of diagnosed cardiovascular diseases and their spatial heterogeneity in Lagos State, Nigeria
- Discourses of risk in public health advertising about underage alcohol consumption
- Utilization of health service and associated factors among women in childbearing age in selected internally displaced persons camps, Hargeisa – Somaliland
- Healthcare workers’ attitudes toward children getting Covid-19 vaccinations in Gaza Strip
- Regional prevalence and spatial modeling of hypertension in South Africa
- Immediate effect of mud pack on resting cardiovascular parameters in hypertensive individuals – A single-arm pilot study
- An analysis of medical scheme-related pregnancy terminations in South Africa in 2022
- Immediate effect of Kaki Mudra on pupillary light reflex among healthy individuals – A study protocol of a Randomized control trial
- Healthy lifestyle perceptions and practices among college students at Yanbu University College for Women in Saudi Arabia
- Food service management perspectives on reducing sodium content in foods served: Opportunities and challenges
- Effects of sanitation on child growth in Serbian Roma communities
- College students’ resilience-promoting behaviors and psychological well-being: A latent class analysis
- Comparative analysis of household deprivation among Jewish and other religious groups in England and Wales
- A study protocol for a randomized controlled trial on the effect of Surya Nadi Pranayama practice on cognitive abilities in school children
- Determinants of health insurance adoption among residents of Lagos, Nigeria: A cross-sectional survey
- Enhancing geographical access to cardiovascular disease healthcare services in Lagos State, Nigeria
- Mortality trends from all causes and diabetes mellitus according to sex between 1998 and 2021
- Developing syndrome of inappropriate antidiuretic hormone secretion in Guillain-Barre syndrome
- Health professionals’ continuing education attitudes and experiences in food and nutrition sustainability
- Nutrition literacy among women participating in a community kitchen program in Antioquia, Colombia: A cross-sectional study
- Review Articles
- Unraveling PCOS: Exploring its causes and diagnostic challenges
- Smart healthcare: Integration of AI and brain cells for advanced healthcare applications
- Disrupting the melody: The interplay of obesity and metabolic dysfunction
- Comparing global trends in gastric cancer and the need for national screening programs: An in-depth literature review
- Social media – Boon or Bane?
- Advancing rheumatic disease treatment: A journey towards better lives
- Antimicrobial resistance: A significant public health issue of both human and veterinary concern
- Psychological flexibility and celiac disease in adolescents: Understanding adherence and well-being for enhanced care. A rapid narrative review
- Harnessing real-world evidence in pharmacoeconomics: A comprehensive review
- Commentary
- Mixed messages, broken trust, avoidable deaths: A critical appraisal of the UK government’s response to the COVID-19 pandemic
- The psychological profile of Iraq: A nation haunted by decades of suffering
- Metabolic mysteries of the mind: Investigating type 3 diabetes
- Ready to bleed when touched – Moral Injury in the Special Operations Forces military population
- Towards robust pharmacovigilance surveillance systems
- Short Communications
- From click to calories: Navigating the impact of food delivery apps on obesity
- Long-term economic outlook for Japan, as impacted by COVID-19
- Special Issue on Public Health Resilience - Part II
- Reframing the response to the opioid crisis: The critical role of resilience in public health