
Normal and shear delamination of paperboards
-
Mohammad Ebrahimijamal

 ,
Anders Biel
,
Anders Biel

Abstract
In packaging, the structural integrity of paperboard under complex stresses is essential. This study examines the delamination behavior of paperboard under normal and shear loading modes, which are the base for developing mixed-mode models. Four commercial paperboard grades, sourced from fibers across three geographical regions, are investigated using Double Cantilever Beam (DCB) and Split Double Cantilever Beam (SDCB) tests, which are used to calibrate a cohesive zone model from the literature. This model introduces a shape parameter that governs the cohesive traction-separation relationship, consistent across both normal and shear modes. Experimental findings support this approach, demonstrating that, while the shape parameter remains mode-independent, its numerical value varies uniquely for each paperboard quality.
1 Introduction
Paperboard is a renewable and sustainable material primarily used in packaging due to its strength and durability. However, its mechanical performance, particularly during converting processes such as creasing and folding, is heavily influenced by its delamination behavior. Understanding the delamination mechanics, especially under mixed-mode loading conditions, is crucial for improving the material’s performance and ensuring packaging integrity throughout its lifecycle.
In industrial quality control of paperboard, standard tests like the ZD tensile (ZDT) test (ISO 15754, 2009) and the Scott bond test (TAPPI T 569 om-09) are commonly used to monitor material properties. The ZDT test, a conventional method for evaluating delamination under normal loading, measures the maximum force required to delaminate the paperboard. In contrast, the Scott bond test assesses the total energy needed to separate a sample in the through-thickness (ZD) direction and exhibits a mixed-mode response (Fellers et al. 2012; Isaksson et al. 2010). However, these methods do not capture force-displacement data, which is essential for fully describing the cohesive fracture evolution during delamination. Additionally, no standardized test methods exist for measuring normal and shear load-separation to characterize the paperboard’s complete cohesive fracture behavior.
Laboratory methods have been developed to measure the out-of-plane stress-strain response of paperboards. For example, Fellers and Andersson (2012) introduced a reliable ZD tensile test to evaluate stress-strain properties in the thickness direction, particularly for thin and strong papers. Out-of-plane shear properties have been measured using rigid block tests (Nygårds 2008) and shear strength profiles assessed through notched shear tests (Nygårds and Malnory 2010).
Delamination in paperboard occurs due to the out-of-plane shear and normal stresses that arise during creasing. A notable feature of mixed mode is that the energy dissipated per unit of a delaminated surface depends on the active fracture mode and may differ significantly between normal opening and shear sliding modes (Benzeggagh and Kenane 1996; Hutchinson and Suo 1991). Understanding this variation is essential for predicting failure and designing more reliable materials. Energy methods for evaluating normal and shear modes in paperboard have been explored using various specimen types, such as the Double Cantilever Beam (DCB), End-Notched Flexure (ENF), and Split Double Cantilever Beam (SDCB) (Biel et al. 2022; Ebrahimijamal et al. 2025; Li et al. 2016; Lundh and Fellers 2001; Tryding et al. 2023). The DCB method measures normal delamination, while the ENF and SDCB tests induce shear delamination.
Previous studies have demonstrated methods to extract fracture resistance data. Olsson and Stigh (1989) showed that by measuring the reaction force and rotation of a DCB specimen with an adhesive joint, it is possible to determine the traction-separation relation, which is essential for cohesive zone modeling (Rice 1968). This technique has been successfully applied to various test specimens, including DCB, SDCB, ENF, and combinations of these specimens, to produce mixed-mode responses (Biel et al. 2022; Sørensen 2016). However, accurate determination of the fracture resistance energy during testing remains crucial, as instability in crack growth can affect the derived cohesive laws if the entire fracture zone is not recorded before instability occurs (Ebrahimijamal et al. 2025). Biel et al. (2022) have shown that it is feasible to use DCB and SDCB experiments to characterize paperboard’s normal and shear out-of-plane properties. Later, Ebrahimijamal et al. (2025) enhanced the practicality of SDCB by optimizing the specimen geometry to smaller dimensions. They used a design of experiments approach to examine how varying specimen sizes affect result accuracy, ultimately identifying an optimal configuration for SDCB. To simulate these experiments, they applied an updated version of the mixed-mode potential model previously used by Biel et al. (2022). This updated model included a failure criterion fitted to experimental data from normal, shear, and mixed modes (Xia 2002), with damage derived from the mixed-mode cohesive potential and the failure criterion. Additionally, Rigid Block Specimens (RBS) were used to validate their calibrated mixed-mode cohesive model, given the presence of mixed-mode interactions in RBS (Jina and Nagasawa 2018).
This study characterizes four different paperboards from four mills using both DCB and SDCB methods. The fibers used in the paperboards were sourced from Scandinavia, North America, and South America. First, the material properties, geometry, and test procedures are presented and described. The results of the measurements and calibration using a fracture resistance approach are then discussed. The cohesive zone model proposed by Biel et al. (2022), characterized by a shape parameter that governs the cohesive traction-separation relationship consistently across all modes, forms the basis for this investigation. Our experimental approach provides evidence that a unique shape parameter exists for each paperboard tested and shows that the shape parameter is mode-independent, representing a material property of delamination behavior. Furthermore, a near-symmetry between the cohesive parameters in normal and shear modes is experimentally observed. Due to the isotropy in the shape parameters and this observed near-symmetry, the number of parameters required for calibrating the normal and shear modes is reduced from ten to eight.
2 Materials and methods
In DCB and SDCB, a paperboard strip is glued to two metal substrates using dry-mount tissues. It is worth mentioning that, in addition to the different loading directions for DCB and SDCB experiments, the material and geometry of the DCB specimen beams differ from the SDCB specimen beams. The specimen configurations of DCB from Biel et al. (2022) and the SDCB configuration from Ebrahimijamal et al. (2025) were utilized with negligible modifications to characterize four distinct paperboards from different providers, as shown in Table 1. The ZDT strength test results in Table 1 have been estimated according to TAPPI T 541, and at test speed of 1.6 mm/s, but since the ZDT results are not the focus of this work, extensive details are not presented in this article.
Paperboard properties. All paperboards are clay coated.
| Paperboard | 1 | 2 | 3 | 4 |
|---|---|---|---|---|
| Thickness (mm) | 0.265 ± 0.004 | 0.249 ± 0.003 | 0.249 ± 0.002 | 0.340 ± 0.005 |
| Grammage (grm−2) | 238.32 | 206.97 | 192.3 | 286.7 |
| MD strength (kNm−1) | 16.26 ± 0.48 | 18.17 ± 0.65 | 16.04 ± 0.39 | 17.99 ± 0.46 |
| CD strength (kNm−1) | 6.54 ± 0.34 | 9.21 ± 0.32 | 7.38 ± 0.32 | 12.53 ± 0.15 |
| ZDT strength (kPa) | 471 ± 47 | 322 ± 29 | 424 ± 25 | 304 ± 32 |
| Number of layers | 1 | 3 | 5 | 4 |
| Fiber type | Bleached kraft softwood and hardwood | Outer-plies: kraft fibersMiddle-ply: kraft, CTMP and broke | Outer-plies: kraft fibersMiddle-plies: CTMP, chemical pulp, broke | Outer-plies:kraft fibersMid-plies: kraft, CTMP, broke |
2.1 DCB and SDCB specimens
Figures 1 and 2 show the schematics of the DCB and the SDCB, respectively. As seen in the figures, both specimens involve two beams with a strip of paperboard glued between them. In addition, the direction of loading and the parameters recorded during experiments are also visible in Figures 1 and 2. The DCB and SDCB substrates are made of a steel sheet and an aluminum rectangular tube, respectively. Table 2 lists the configurations for each specimen. Due to practical considerations, the paperboard strip length was set to 280 mm instead of the 300 mm proposed by Ebrahimijamal et al. (2025) for SDCB while maintaining the same total length of specimens and initial crack length. As a result, the far 20 mm end of the SDCB specimens did not include any paperboard.
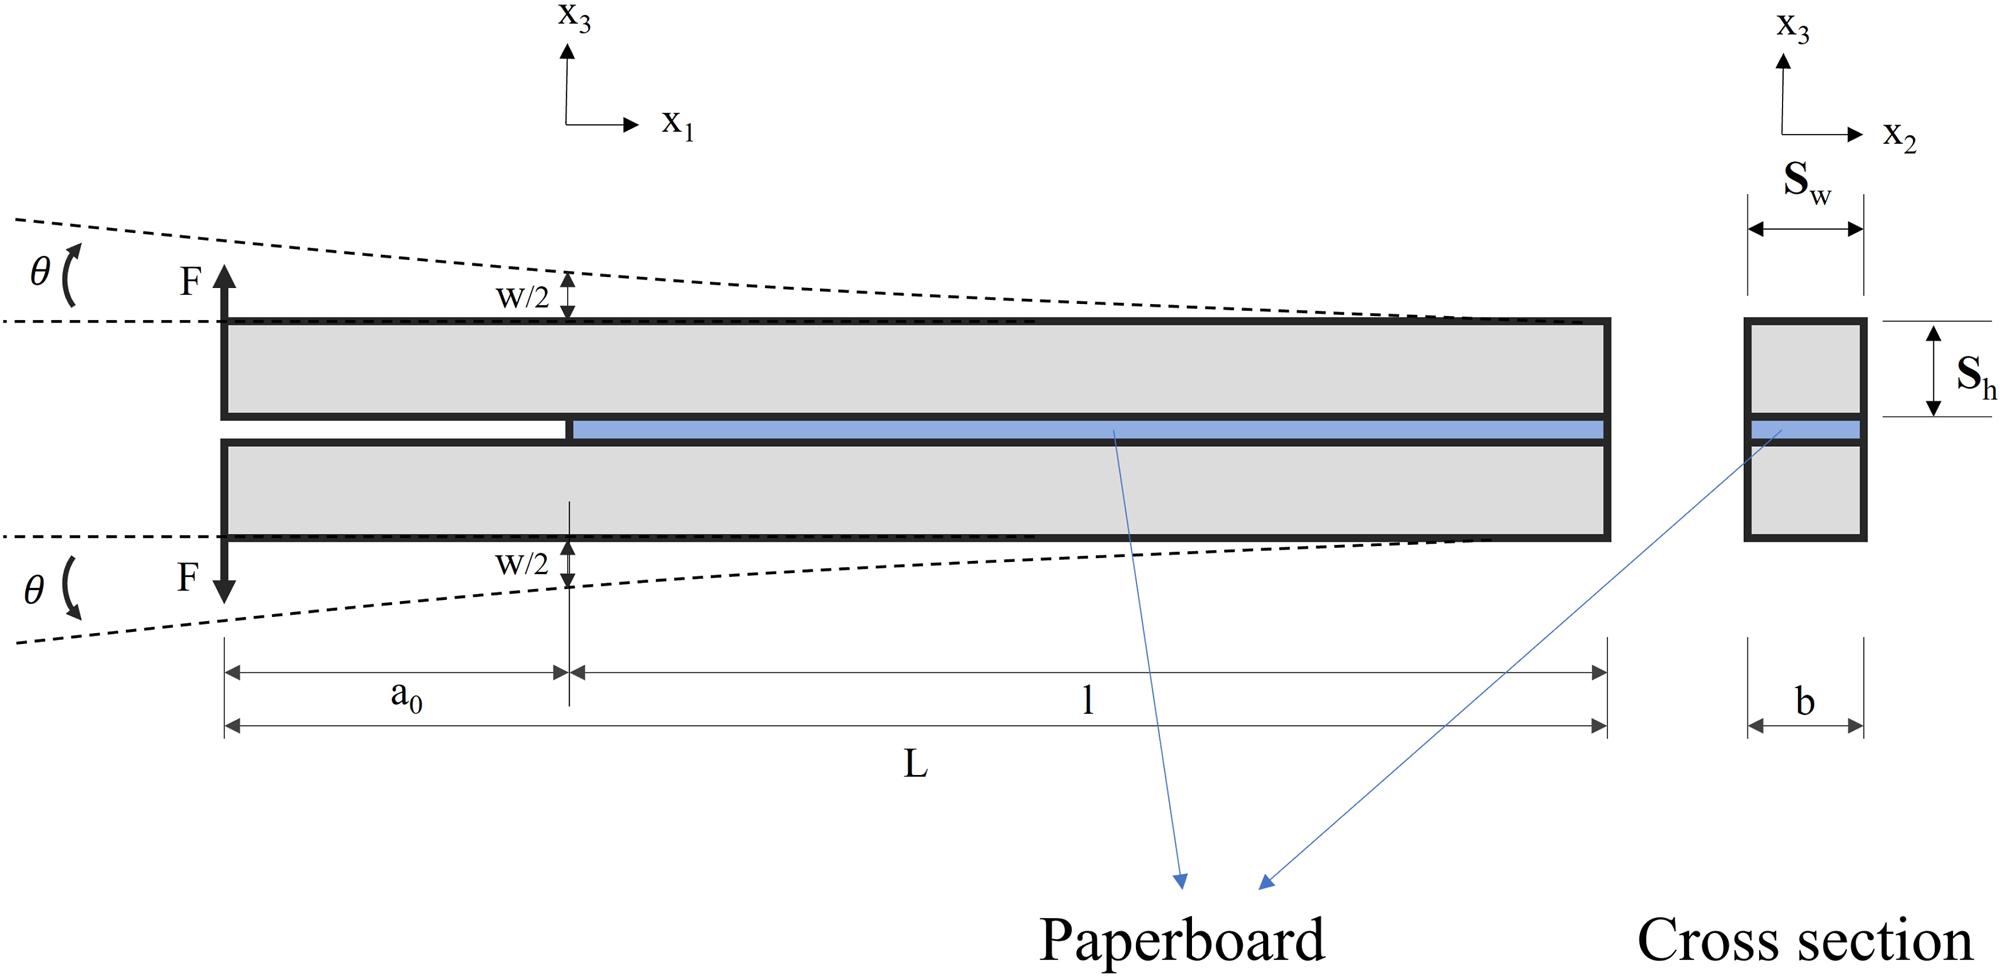
A schematic of DCB. Displacement and rotation are exaggerated.
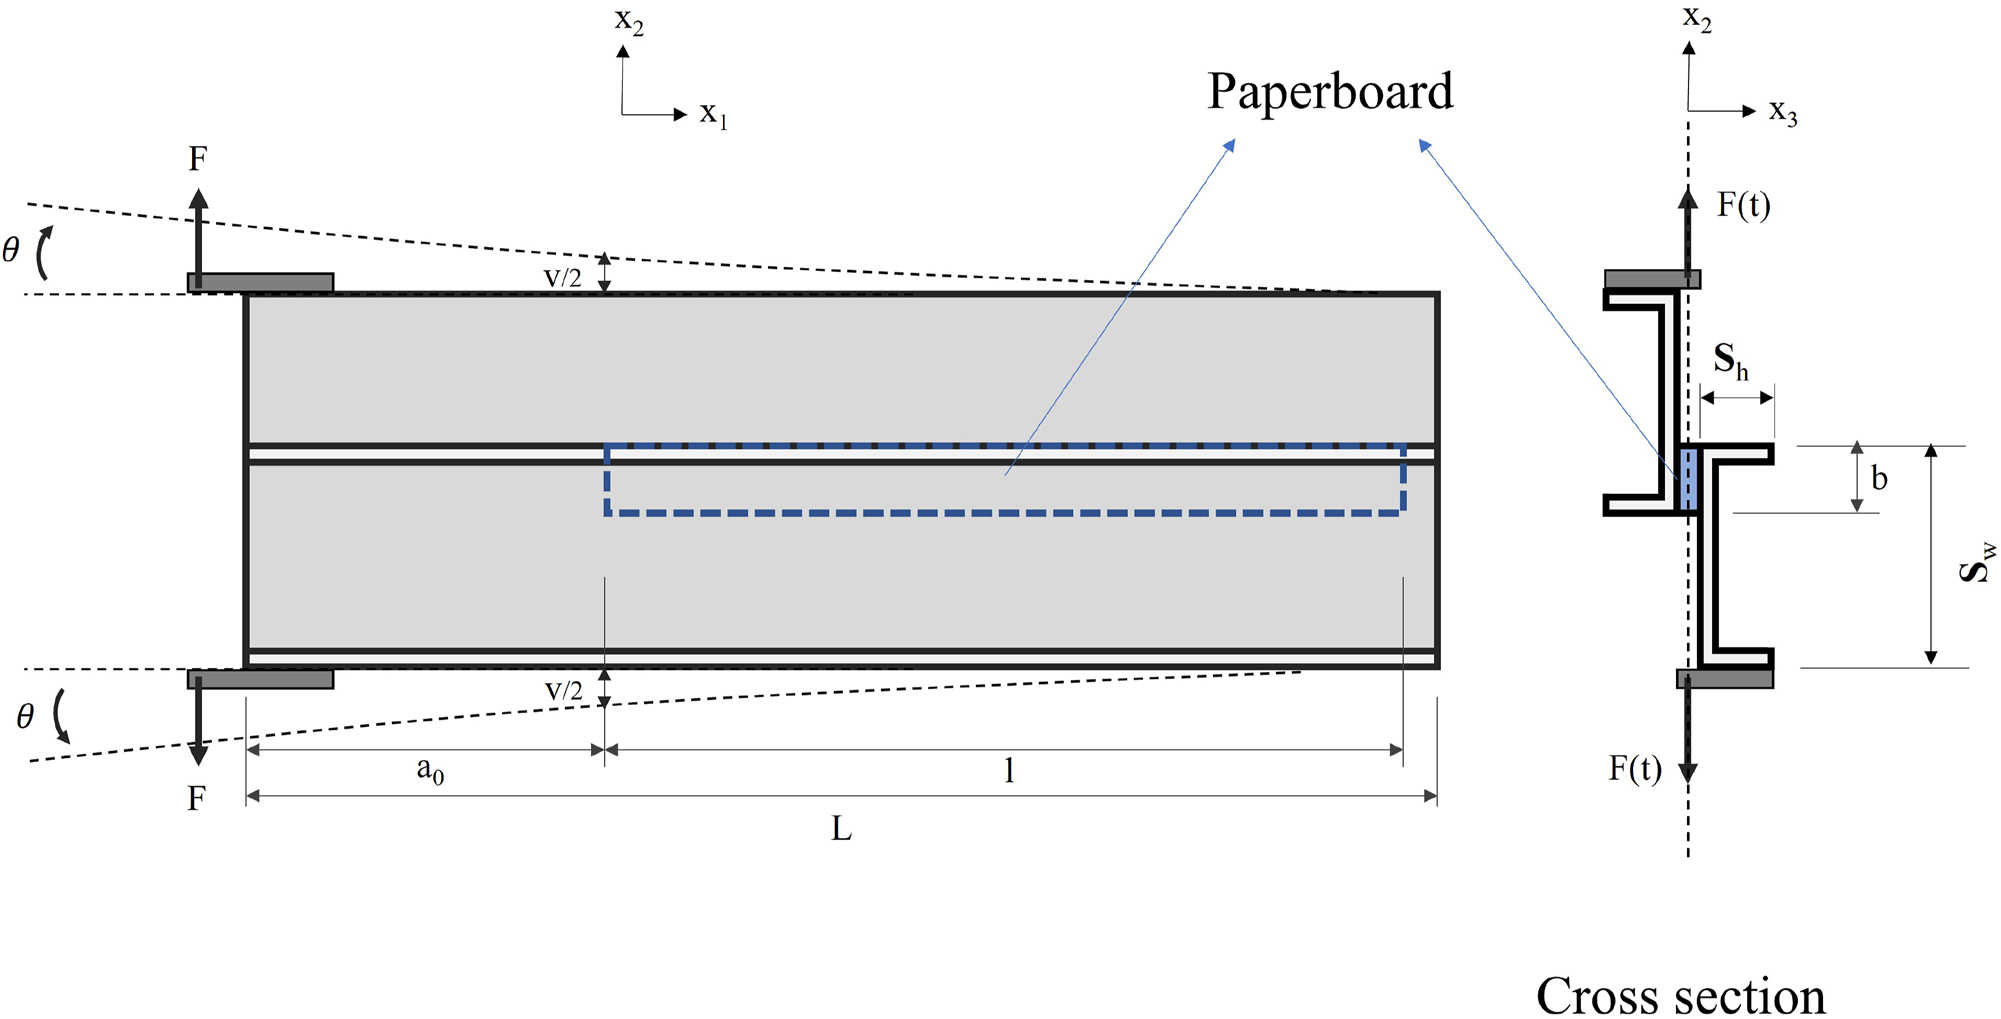
A schematic of SDCB. Displacement and rotation are exaggerated.
Specimen configuration.
| Specimen | Total | Paper board | Initial crack | Paper board | Beam | Beam | Beam |
|---|---|---|---|---|---|---|---|
| length L | length l | length a0 | widht b | height S h | width S w | Material | |
| (mm) | (mm) | (mm) | (mm) | (mm) | (mm) | ||
| DCB | 320 | 240 | 80 | 12 | 6 | 12 | Steel |
| SDCB | 600 | 280 | 300 | 20 | 12 | 50 | Aluminum |
2.2 Specimen fabrication
In this work, a similar manufacturing procedure as Biel et al. (2022); Ebrahimijamal et al. (2025) is used. Fabricating DCB and SDCB specimens entails a few general steps. First, the beams must be polished for better adhesion and to avoid crack growth at the interface between the paperboard and the beams. Second, the paperboard and dry-mount tissue are cut into suitable sizes, generally wider than the final width. Third, two beams, two layers of dry-mount tissue, and a paperboard strip are placed and fixed in clamps before being transported into the oven. Considering the easier geometry to handle, ordinary commercial clamps are sufficient for DCB specimens. However, for SDCB specimens, the same custom-designed clamps as in Ebrahimijamal et al. (2025) are used to ensure consistency in width and pressure during curing and among specimens. It is worth mentioning that the C-shaped beams were cut from a single rectangular tube with a wall-thickness of 4 mm. Fourth, all specimens are cured in an oven heated to 90 °C for at least 30 min. At this temperature, the dry-mount tissues are activated, and our experience showed that at least 30 min of curing is necessary for successful adhesion. Fifth, the specimens are immediately transferred into a climate room with a humidity of 50 % ± 2 % and a temperature of 23 °C ± 1 °C. Lastly, the excessive or overlapping portions of the paperboard and dry-mount tissue are trimmed to the final width as specified in the specimen design. This overlapping ensures complete and consistent adhesion along the length of the specimen, which is required to achieve accurate results. At least five DCB and ten SDCB experiments were conducted on each paperboard.
2.3 Test procedure
The same testing machine and equipment as used by Biel et al. (2022); Ebrahimijamal et al. (2025) were used in this research, where the specimens were installed vertically, and the displacement was applied horizontally (see Figure 3). A shaft encoder, two LVDTs, and a load cell on the machine were used to record the rotation at the machine heads, the deformation at the crack tip termed as “separation”, and the corresponding force during the testing process. Unlike the DCB specimens, the weight of the SDCB specimen is considerable. As a result, their weight were balanced out with a few rubber-bands attached to the upper end of the specimens. All specimens were kept in the climate room for at least 24 hours before testing to ensure they reached equilibrium with the room’s climate conditions. The fracture surfaces of specimens were monitored after each experiment to ensure that the crack had initiated and grown inside the thickness of the paperboard, not the gluing interface.
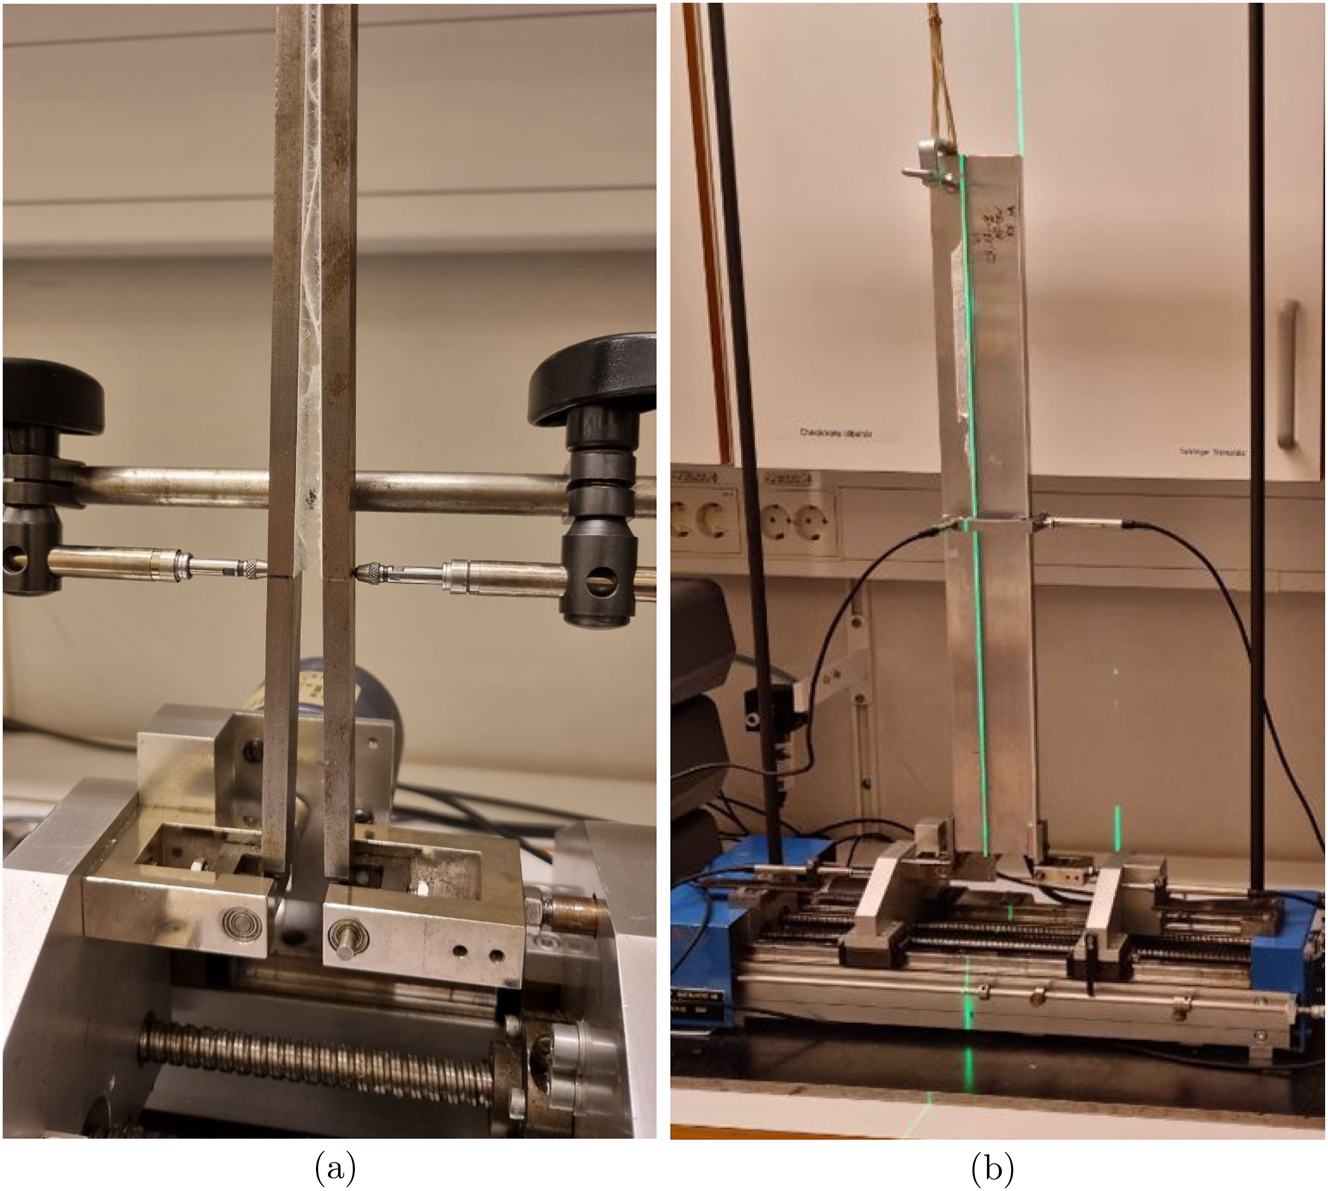
Test procedure. a) DCB test procedure; b) SDCB test procedure.
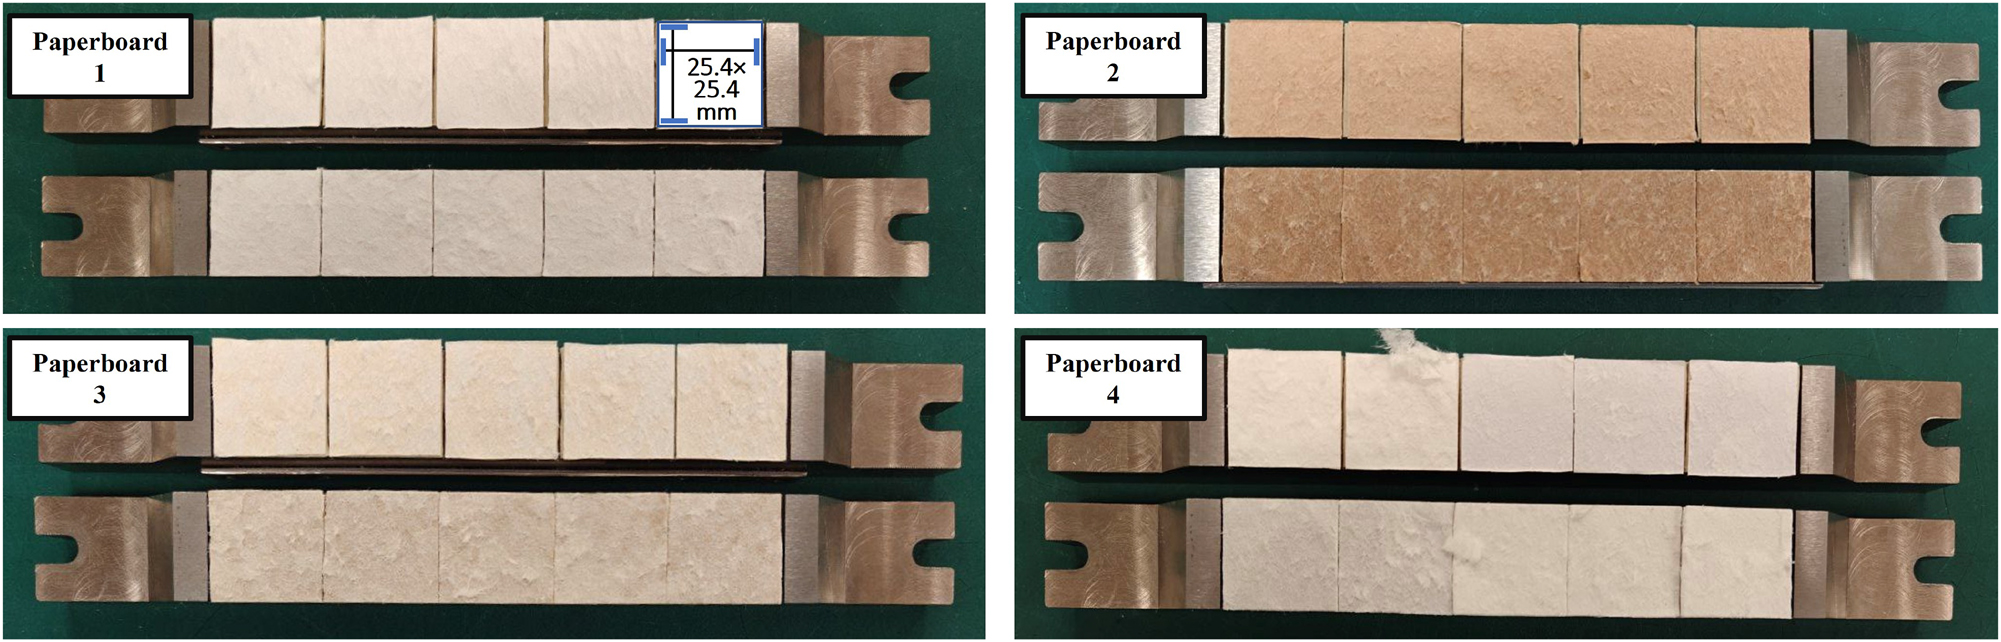
Figure 4 shows post-mortem fracture surfaces from the DCB and SDCB specimens. Paperboards 1, 3, and 4 exhibit similar fracture surfaces in both shear and normal modes. However, Paperboard 2 shows delamination between the middle (brown) and bottom (brown) plies in SDCB tests, while in DCB tests, delamination occurs between the top (white) and middle (brown) plies.
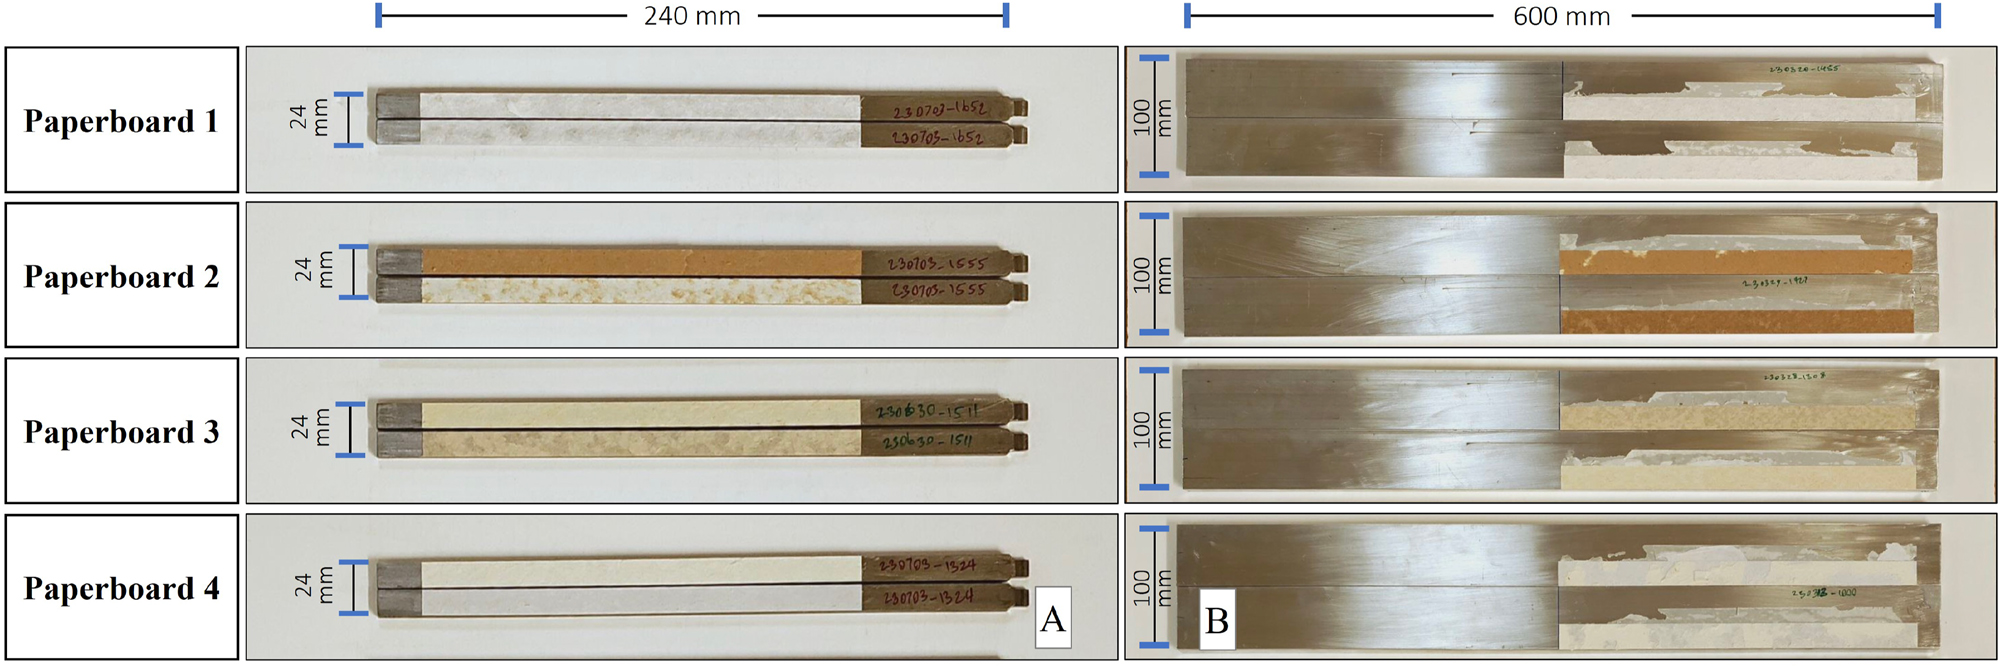
Fracture surfaces. a) DCB fracture surfaces; b) SDCB fracture surface.
ZDT experiments were conducted to supplement the DCB tests; see the ZDT delamination surfaces in Figure 5. For paperboards 1, 3 and 4, ZDT delamination is similar to that observed in the DCB tests, as expected. However, a discrepancy arose in the fracture surfaces between the DCB and ZDT tests for Paperboard 2, which both tests measure normal mode delamination. DCB tests show delamination between the top and middle plies, while ZDT tests align with SDCB results and show delamination between the middle and bottom plies. This difference may be attributed to the higher test speed of ZDT and the increased brittleness of paperboard at higher displacement rates.
ZDT fracture surfaces.
A digital microscope was positioned in front of the DCB test specimens to observe fiber deformation and delamination in the paperboard, facilitating a better understanding of fracture mechanisms during testing. However, conducting a microstructural study on the SDCB specimens was not feasible due to the asymmetry of the specimen geometry and limited microscope access, which prevented reliable imaging of the paperboard. When it comes to high-framerate, high-resolution microscopy, saving each photo introduces latency and larger time intervals as the photo count increases. Thus, resolution and time intervals were determined through trials. Our optimized microscope setting captures a photo every 4 s at a resolution of 2,048×1,536, synchronized with the testing machine so that the initial image is taken before any displacement is applied.
2.4 Experimental data
As mentioned above, the separation, the reaction force, and the rotation of the beams were recorded during the experiments. Note that other parameters have been recorded as well, but they are not part of this analysis. The reaction force-separation and rotation-separation curves for all experiments in both normal and shear mode experiments, DCB and SDCB, respectively, are presented in Figures 6 and 7. The reaction force-separation and rotation-separation trends are similar in both normal and shear modes, but the magnitude differs considerably. Later in this paper, these experimental data are used to derive the traction-separation laws and calibrate our model.
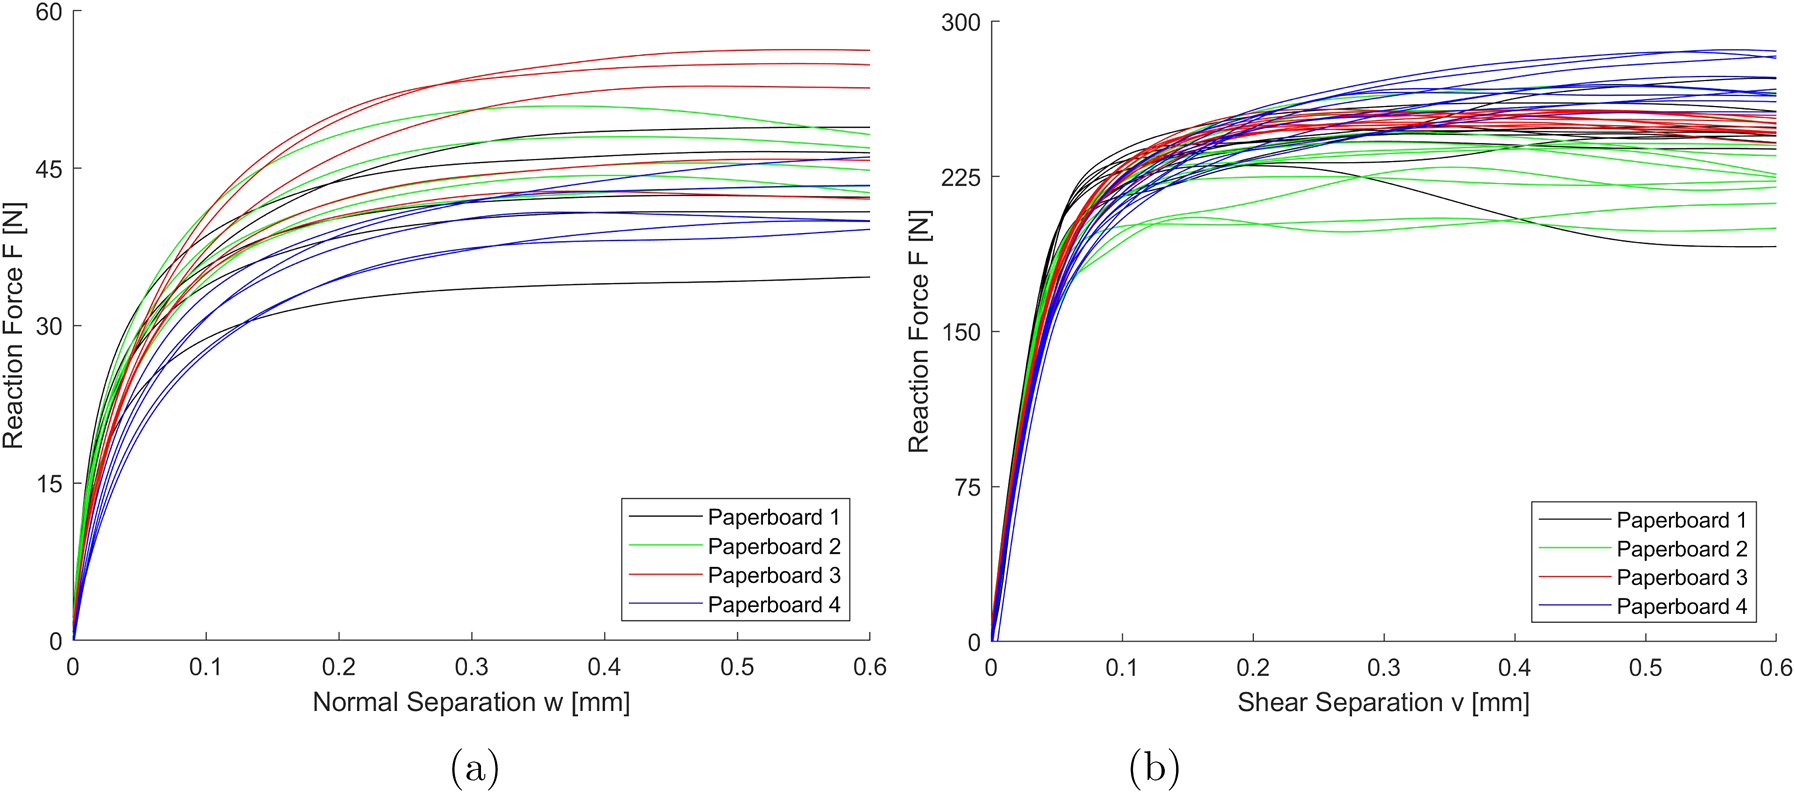
Reaction force-separation curves from all experiments. a) Normal mode (DCB); b) Shear mode (SDCB)..
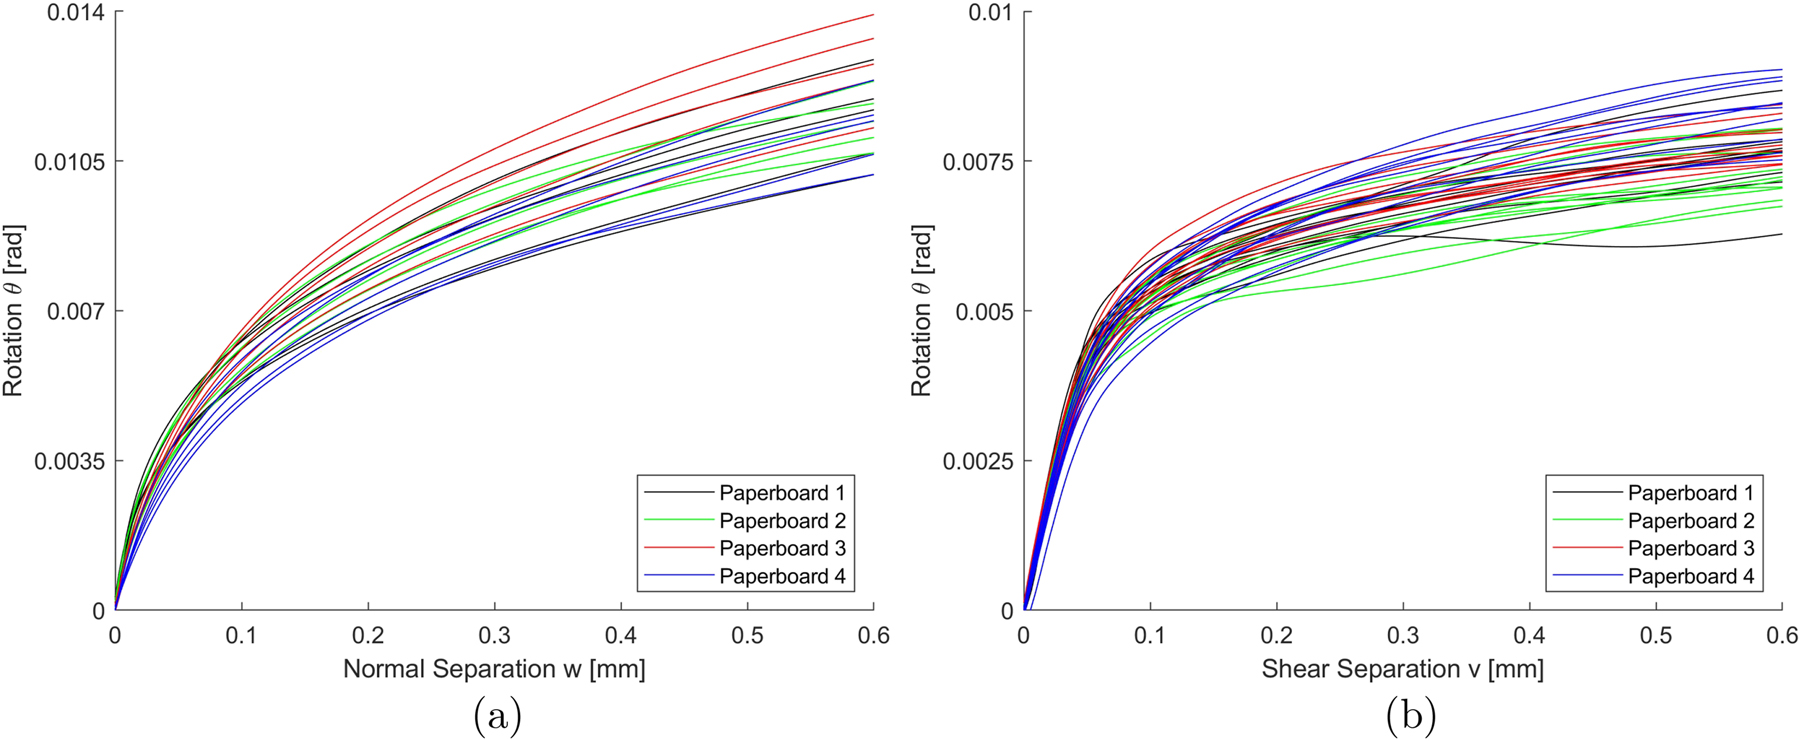
Rotation-separation curves from all experiments. a) Normal mode (DCB); b) Shear mode (SDCB).
2.5 Fracture analysis and calibration
The measurements’ results are analyzed using a fracture resistance approach and a cohesive zone model, complemented by a calibration procedure. The calibration procedure is used to fine-tune the model parameters, ensuring that the predicted behavior aligns with the experimental data.
2.6 Experimental fracture resistance
Fracture resistance data for the normal opening mode (Mode I) were obtained from DCB specimens, while data for the shear sliding mode (Mode III) were derived from SDCB specimens.
For the normal opening mode, the normal fracture resistance J I from DCB specimens can be expressed as13
where F is the applied force, θ is the rotation at the applied force, and b is the width of the paperboard.
Similarly, for the shear mode, the shear fracture resistance J III from SDCB specimens is presented by Biel et al. (2022) as
In Equation (2), F is the applied force, θ is the rotation at the applied force position, b is the paperboard width, and k1 is the initial shear stiffness. The first term in Equation (2) represents the combined contribution from shear stresses τ1 and τ2, while the second term adjusts the τ1 contribution within the first term to accurately account for the influence of shear stress τ2. The formula assumes a linear relationship between shear stress and shear separation, i.e., τ1 = k1v1.
The cohesive law for normal and shear stresses is derived by taking the derivative of the fracture resistance in (1) and (2), respectively with respect to the separation at the crack tip, see Rice (1968).
2.7 Nonlinear cohesive zone model
A theoretical model valid for normal and shear modes is proposed, with material parameters to be determined from experimentally obtained fracture resistance. The primary objective is to identify the optimal material parameters for the theoretical model that minimize the discrepancy between model predictions and experimental observations for both loading conditions.
The traction-separation law is derived by differentiating the fracture resistance with respect to the separation. A schematic traction-separation law is depicted in Figure 8. In Figure 8, the blue curve represents the fracture resistance-separation which is determined from the experimental data, and the red curve shows the derived traction-separation law. The experimental fracture resistance transitions from a convex to a concave curve. The convex portion (δ ≤ δmax) corresponds to an ascending traction-separation response, termed the elastic traction-separation. It must be noted that from a modeling perspective, we assume this concave portion to be non-linearly elastic, as we do not have any unloading data. In contrast, the concave portion (δ > δmax) represents a descending traction-separation response, termed the cohesive traction-separation. During the cohesive fracture, delamination initiates, progresses, and ultimately separates the paperboard into two distinct plies connected by single fibers. Hence, the two fracture resistance sections are mathematically described as follows;
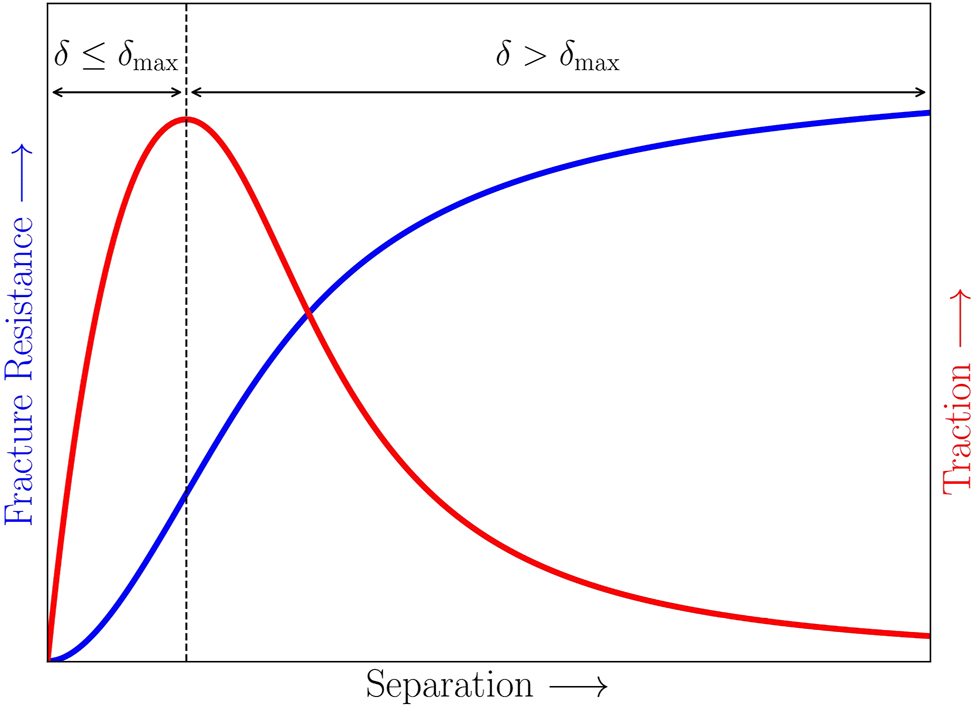
A schematic example of cohesive law derivation. The blue curve shows the fracture resistance-separation, and the red curve shows the traction-separation.
Elastic traction-separation, (δ ≤ δmax): For separation values less than or equal to the threshold δmax (where δ = w for normal mode and δ = v for shear mode), the model uses a normalized non-linear elastic relation f
e
(ϵ
e
) in the interval ϵ
e
∈ [0, 1], with the following criteria: The function is monotonic increasing
A rational function that meets these criteria (Carpinteri et al. 2011) is
The dimensionless parameter a = kδmax/T, where k is the initial stiffness and T is the traction at δmax. The elastic energy function g e (ϵ e , a), representing the convex section of the fracture resistance, is given by the integration of (3) as
Cohesive traction-separation, (δ > δmax): For separation values greater than δmax, the model uses a normalized nonlinear cohesive relation f(ϵ) over the interval ϵ ∈ [0, ∞), with the following criteria: the function is monotonically decreasing (f′(ϵ) ≤ 0), has one inflection point where f′(ϵ) = −1, and satisfies the boundary conditions f (0) = 1 and limϵ→∞f(ϵ) = 0. A rational function that meets these criteria (Biel et al. 2022; Tryding and Ristinmaa 2017) is
where
In (6), the parameter 0 < c < 1 controls the curvature of the nonlinear response, α(c) ensures the fulfillment of the boundary condition f′(ϵ) = −1, and δ N is a normalizing length measure determined by the ratio of the cohesive strength (maximum cohesive traction) and the maximum negative slope of the cohesive traction-separation curve (Biel et al. 2022). The cohesive energy function g (ϵ, c) is the normalized fracture resistance obtained by integration of (5) as (Alzweighi et al. 2023; Biel et al. 2022; Tryding and Ristinmaa 2017)
In Eq. (7), 2F1
The normalized fracture energy, gmax(c), is a U-shaped function within the interval 0 < c < 1 of the shape parameter c. The function reaches its minimum value at gmax (0.413) = 0.973 and tends to infinity as c approaches zero and one.
The nonlinear elastic and cohesive relations are combined into a fracture resistance model to fit the experimental fracture resistance data, determining the optimal parameters a, c, δmax, T, and δ N , which are used for both normal and shear modes. The calibrated parameters minimize the discrepancy between the model and observations, ensuring the model accurately reflects the material’s physical behavior. Combining both regimes, the fracture resistance model is given by
where δ represents w for normal mode or v for shear mode. In (9b), Tδmax g e (1, a) is a constant denoting the onset of cohesive fracture resistance. The traction-separation relation is given by the derivatives of (9) as,
where f e (ϵ e , a) and f (ϵ, c) are given by (3) and (5), respectively.
2.8 Calibration procedure
The Calibration process seeks to determine the set of parameters θ = [a, δ
N
, c] for both normal and shear modes by minimizing the sum of squared errors (SSE) between the theoretical model predictions and the experimental fracture resistance data. The SSE is calculated using
The normal and shear mode parameters θ = [a, δ N , c] are calibrated by minimizing the SSE measure for fracture resistance, with T and δmax values derived directly from the experimental data. Following this, the root mean square error (RMSE) is calculated to assess the quality of the fit.
First, the model was calibrated for each individual experiment to determine θ = [a, δ
N
, c]. To ensure that the solution remains within physically realistic ranges, bounds are applied to θ. Initial guesses for shear parameters are
3 Results and discussion
3.1 CZM calibration
The parameters θ = [a, δ N , c] for both the normal and shear modes were calibrated independently for each measured sample. Figure 9 shows boxplots of the calibrated δ N and c values from the data.
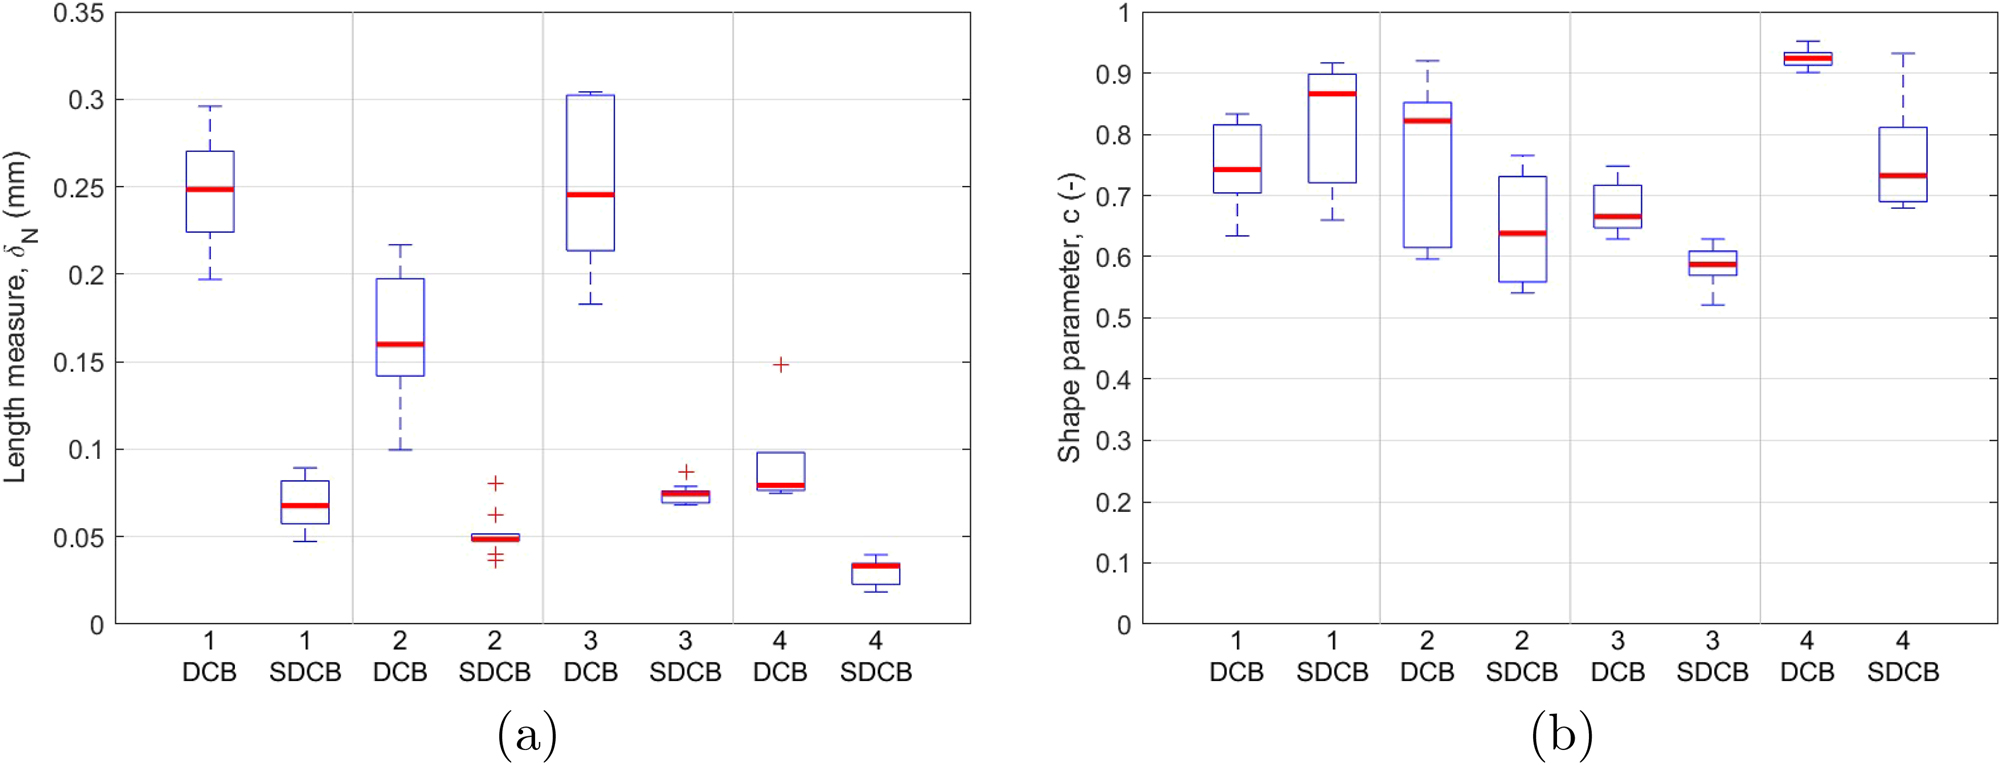
A boxplot with subgroups of paperboard and specimen types. a) Length measure δ N ; b) Shape parameter c. The median values are highlighted by a bold red line. Values that reach the boundary are excluded from the boxplot.
Figure 9a shows a boxplot comparing the length measure δ N across various paperboard qualities. The vertical axis shows length in millimeters (mm), ranging from 0 to 0.35 mm, while the horizontal axis categorizes paperboard from 1 to 4, with each number representing two specimen subcategories: “DCB” and “SDCB.” In Paperboard 1, the DCB specimen has a higher median length measure (around 0.25 mm) and a slightly wider interquartile range, with some outliers above the box. The SDCB specimen shows a lower median measure (just below 0.07 mm) with a narrow interquartile range and some outliers below the box. For Paperboard 2, the DCB median is lower (around 0.16 mm), while the SDCB median is very low (below 0.05 mm), with several outliers below the box. In Paperboard 3, the DCB specimen exhibits a median comparable to Paperboard 1 (close to 0.25 mm) and a large interquartile range. Conversely, the SDCB median with a narrow spread is slightly below 0.08 mm. Finally, in Paperboard 4, the DCB median is around 0.08 mm, showing some variability, while the SDCB specimen has the lowest range and median measure, just above 0.03 mm. The boxplot indicates that the DCB specimens have higher length measures than the SDCB specimens across all paperboard categories, with notable variability in median and interquartile ranges.
Figure 9b shows a boxplot comparing the shape parameter, denoted as c, across different paperboard qualities. The vertical axis represents the shape parameter c, ranging from 0 to 1. The horizontal axis categorizes the paperboards from 1 to 4. In Paperboard 1, the DCB specimen has a median shape parameter close to 0.75 with a relatively narrow interquartile range, while the SDCB specimen has a higher median, around 0.85, with a larger spread. In Paperboard 2, the DCB median is around 0.8, showing a wide interquartile range, while the SDCB median is around 0.65, with a slightly lower spread. For Paperboard 3, the DCB median is just above 0.66, with a narrow spread, whereas the SDCB median is slightly below 0.6, with a narrow interquartile range. In Paperboard 4, the DCB median is slightly above 0.9, with the narrowest interquartile range among all groups, while the SDCB specimen has a median above 0.7 with a similar spread as the SDCB of Paperboard 1 and 2. The boxplot indicates that the DCB and SDCB specimens generally have distinct medians and variability in the shape parameter across paperboards, with the DCB specimen in Paperboard 4 exhibiting the lowest spread.
Figure 9a shows an anisotropy variation between the normal (DCB) and shear (SDCB) loading compared to Figure 9b, which shows a more isotropic behavior in the normal (DCB) and shear (SDCB) loading. The RMSE mean values of the fit to the fracture resistance for the normal and shear modes are
Based on experimental observations that the shape parameter c is nearly isotropic, the hypothesis proposed by Biel et al. (2022) is investigated, suggesting that this parameter remains isotropic, i.e., consistent in both normal and shear modes. The median values of c calibrated for all individual experiments in the normal and shear modes, as shown in Figure 9b, are recorded for paperboards 1 to 4 as 0.815, 0.640, 0.609, and 0.849, respectively. With c fixed, the remaining parameters were re-calibrated using the reduced parameter set θ = [a, δ
N
]. The reduced parameter set was calibrated to fit the mean experimental fracture resistance data achieving RMSE mean values of
Figures 10 show that the theoretical model accurately captures the behavior observed in the experimental data for both modes, with low RMSE values (<2.3 × 10⁻³) indicating a good fit. In addition, the traction–separation curves are plotted in Figure 11 to visualize the response of both modes. Table 3 presents the calibrated parameters for normal and shear fracture modes across four qualities of paperboard: 1, 2, 3, and 4
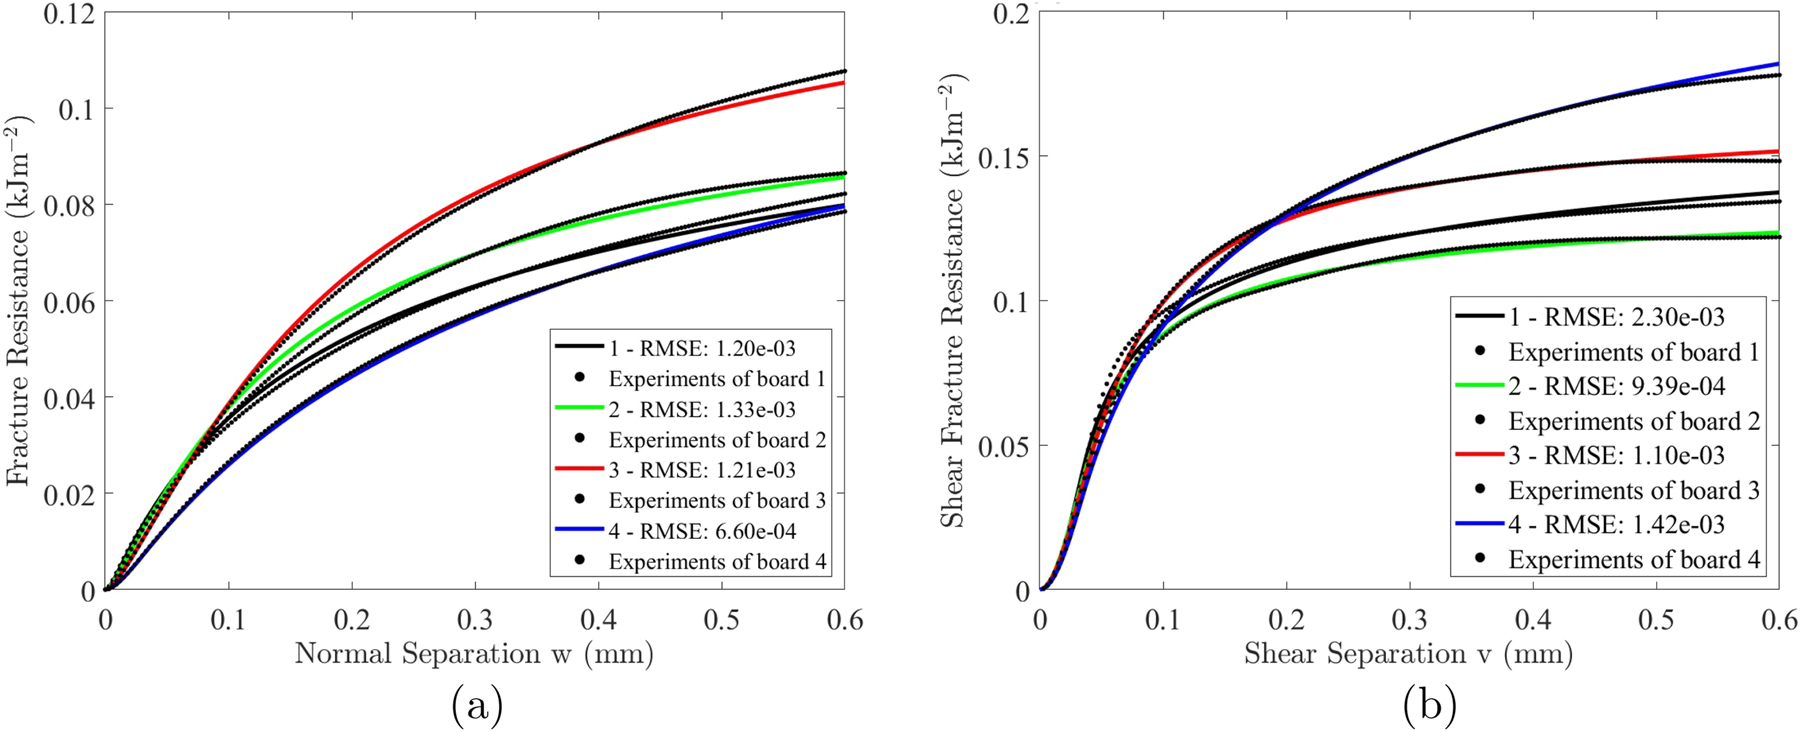
Fracture resistance-separation curves for each paperboard quality. a) Normal mode; b) Shear mode. Solid lines represent calibrated curves, while the experimental curves are depicted as filled black circles.
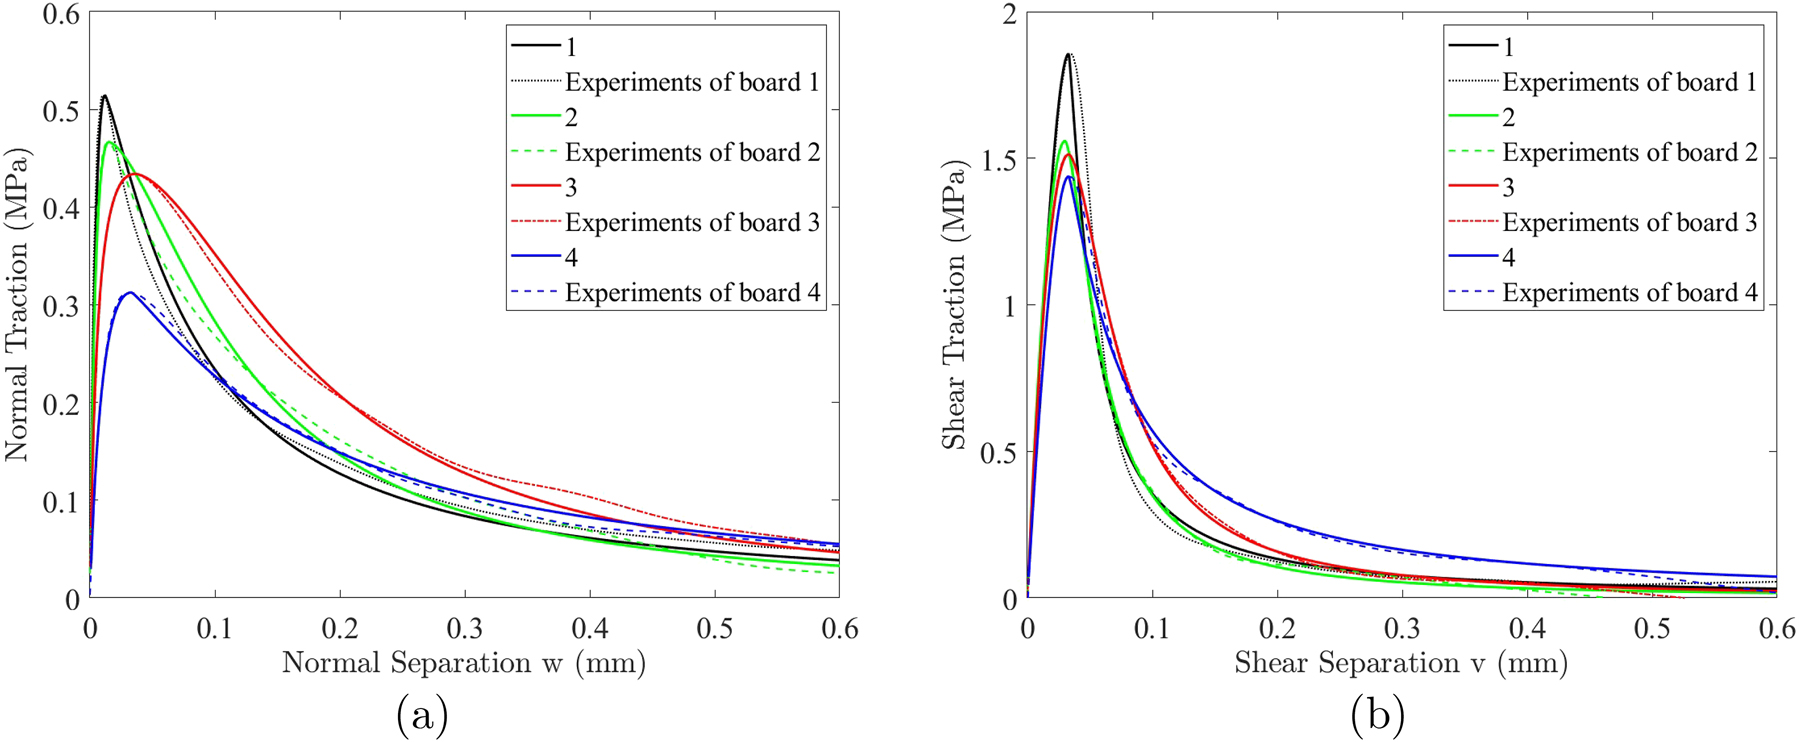
Traction-separation curves for each paperboard quality; a) Normal; b) Shear. Experimental curves are depicted as dashed lines, while solid lines represent calibrated curves.
Calibrated parameters for normal and shear modes are highlighted in bold, with cohesive strength displayed in normal font. The shape parameter, italicized, is the median of the shape parameters in normal and shear modes calculated from the calibrated data in Figure 9b. Maximum separation is set at 0.60 mm for calibration, and use is made of the relation a = kδmax/T.
| Paperboard | Mode | Elastic | Cohesive | ||
|---|---|---|---|---|---|
| Parameter | Parameters | ||||
| k [MPamm−1] | T [MPa] | δ N [mm] | c [−] | ||
| 1 | Normal | 130 | 0.514 | 0.115 | 0.815 |
| 1 | Shear | 85.7 | 1.856 | 0.0312 | 0.815 |
| 2 | Normal | 130 | 0.467 | 0.184 | 0.640 |
| 2 | Shear | 100 | 1.559 | 0.0520 | 0.640 |
| 3 | Normal | 84.6 | 0.434 | 0.254 | 0.609 |
| 3 | Shear | 96.5 | 1.513 | 0.0737 | 0.609 |
| 4 | Normal | 38.4 | 0.313 | 0.222 | 0.849 |
| 4 | Shear | 71.9 | 1.438 | 0.0678 | 0.849 |
Figure 11 shows the normal and shear traction versus displacement for both the model and the mean curves from the experiments, represented by solid and dashed curves, respectively. The model is derived using the parameters from Table 3 in (10). The figure demonstrates that the model (solid curves) closely matches the experimental results (dashed curves), as expected since the fitted reduced parameter set (k, δ N ) for the fracture resistance data yielded low RMSE values (see Figure 10).
A comparison of the shape parameter values in Table 3 and Figure 9b shows that the median values for each mode are fairly similar, except for the normal mode (DCB) in paperboards 1 and 4, which differ noticeably. Despite this discrepancy, the fitted data closely matches the experimental data in Figure 11a for the normal mode in paperboards 1 and 4, with RMSE values lower for these two paperboards than the others.
3.2 Fracture energy, cohesive strength, and initial stiffness
In the normal mode, as presented in Figure 12, the fracture energy, cohesive strength, and initial stiffness of four paperboard qualities were evaluated. The fracture energy is defined as the maximum value of the fracture resistance. The fracture energy mean values for paperboards 1 through 4 were measured at 0.082, 0.086, 0.108, and 0.078 kJm−2, respectively, with corresponding standard deviations of 0.017, 0.007, 0.021, and 0.011 kJm−2. For cohesive strength, the mean values recorded for paperboards 1 through 4 were 0.514, 0.467, 0.434, and 0.313 MPa, with standard deviations of 0.010, 0.068, 0.046, and 0.049 MPa, respectively. As seen in Table 1 and Figure 12, the cohesive strength values from the ZDT and DCB experiments, respectively, are in the same range for Paperboard 1, 3, and 4. However, the results for Paperboard 2 are considerably different, which could be attributed to the delamination position shift, visible in Figures 4 and 5, as a result of the considerably faster ZDT test speed. Initial stiffness measurements revealed mean values of 91, 84, 45, and 29 MPamm−1 for the respective paperboards, with standard deviations of 31, 25, 11, and 12 MPamm−1. These results indicate variability in mechanical performance among the paperboards under normal loading conditions, with Paperboard 3 exhibiting the highest fracture energy and Paperboard 1 showing the highest cohesive strength and initial stiffness.
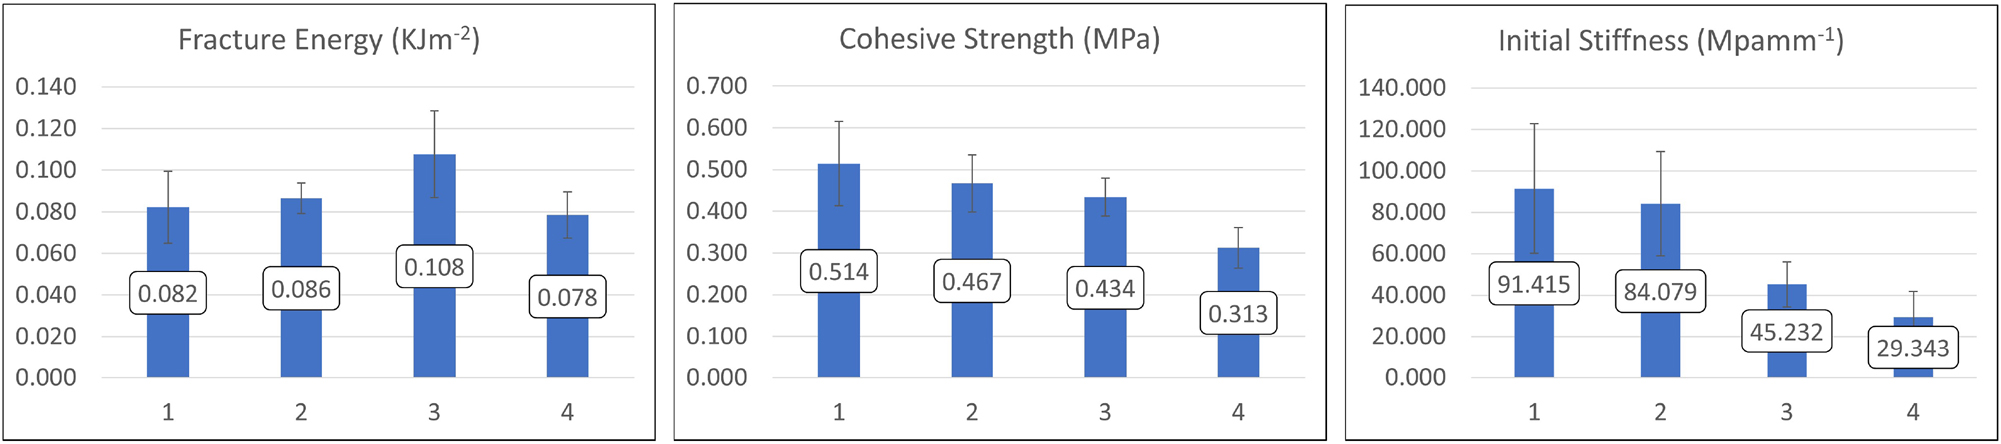
Fracture energy, cohesive strength, and initial stiffness of paperboards in the normal direction.
In the shear mode, illustrated in Figure 13, fracture energy, cohesive strength, and initial stiffness were assessed for the same paperboards. The fracture energy mean values increased to 0.134, 0.122, 0.148, and 0.178 kJm−2 for paperboards 1 through 4, respectively, with standard deviations of 0.018, 0.019, 0.006, and 0.014 kJm−2. Cohesive strength measurements were significantly higher in shear mode, recorded at 1.856, 1.559, 1.513, and 1.438 MPa for paperboards 1 through 4, with standard deviations of 0.122, 0.131, 0.070, and 0.095 MPa. Initial stiffness mean values, except for paperboard 1, were also elevated measured at 78, 85, 85, and 76 MPamm−1 for the respective paperboards, with standard deviations of 19, 15, 7, and 6 MPamm−1. These findings demonstrate that the paperboards exhibit enhanced mechanical properties under shear loading, with paperboards 1 and 4 showing the highest cohesive strength and fracture energy, respectively, in this mode.
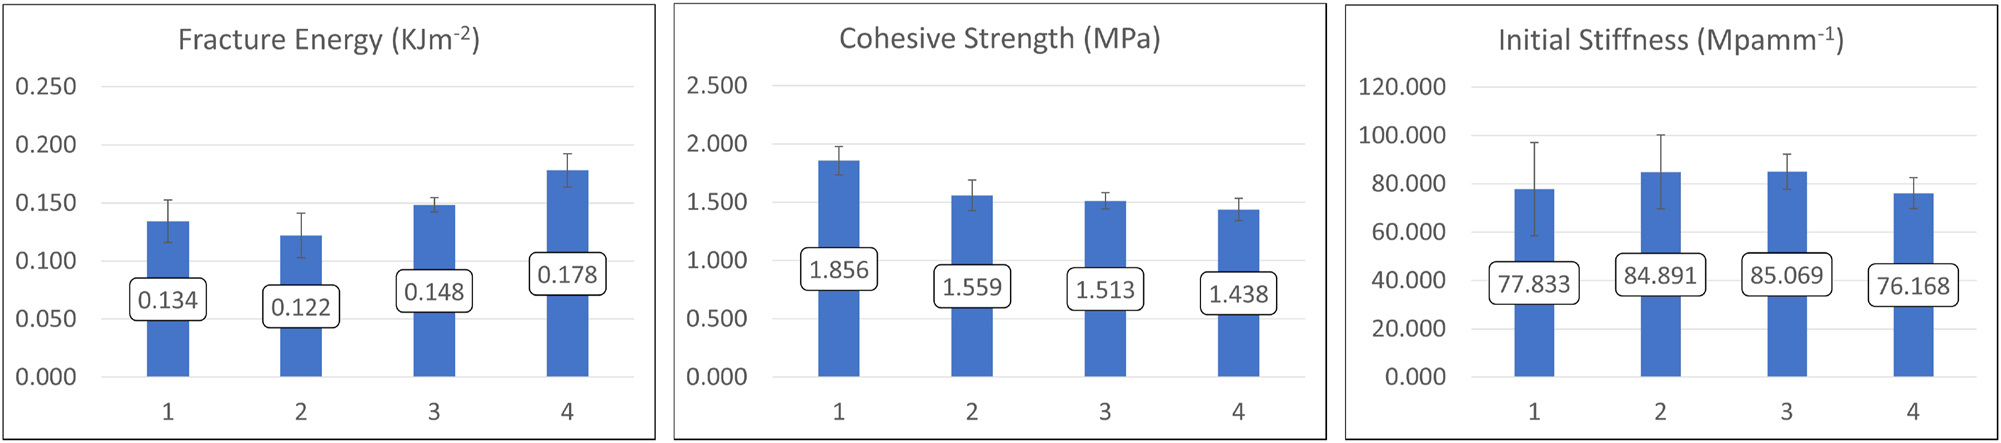
Fracture energy, cohesive strength, and initial stiffness of paperboards in the shear direction.
The comparative analysis between normal and shear modes reveals that all paperboards demonstrate greater fracture energy and cohesive strength when subjected to shear loading. This suggests that the mechanical performance of the paperboards is mode-dependent, with shear mode inducing more substantial material responses than normal mode across all tested paperboard types.
In the normal mode, the calibrated initial stiffness reached the upper bound of 130 MPamm−1 for Paperboards 1 and 2, whereas, for Paperboards 3 and 4, the calibrated initial stiffness values were 85 and 38 MPamm−1, respectively. However, the upper bound constraint on the initial stiffness of Paperboards 1 and 2 has, if any, only a minor effect on the fit, as indicated by the low RMSE shown in Figure 10a. For the shear mode, the calibrated initial stiffness values were 86, 100, 96, and 72 MPamm−1 for paperboards 1 through 4, respectively. Evidently, the initial stiffness values obtained from direct measurements, denoted as K, differ from those determined by the calibration fit (k) for both the normal and shear modes. The calibrated initial stiffness k was measured from the initial linear stress-separation relationship; using the relation a = kδmax/T from (3), the initial stiffness is calculated and denoted as k. A linear regression analysis comparing the different initial stiffness measures was performed, yielding K = 0.88k with an R2 value of 98 %. Values at the boundary were excluded from the analysis. The high coefficient of determination indicates a strong correlation between the two initial stiffness measures, with k showing higher stiffness than the direct measure K. Despite these differences, Figure 11 demonstrates that the traction versus separation curves for each paperboard quality in normal and shear modes exhibit a good fit between the model and the experimental data.
3.3 Microstructural observations
Figures 14 and 15 show microscopic photos of the DCB specimens at 0, 0.1, 0.3, and 0.6 mm separation levels. Figure 11 shows that the peak load for all four paperboards is reached before 0.1 mm of separation. At 0.1 mm separation, the delamination is visible as is illustrated in Figures 14 and 15. Furthermore, it can be seen in Figure 14 that the delamination in Paperboard 1, a single-layer paperboard, exhibits multiple delaminations as microcracks, forming and growing in the core of the paperboard. Similarly, Paperboards 3 and 4, as shown in Figure 15, display distributed delamination through the thickness, although they include multiple plies. Since microcracks are highly distributed between the plies in Paperboards 3 and 4, it is unclear whether the main delamination occurs within the plies or at the interfaces between them. Nevertheless, it can be assumed that the interfaces have similar strength since the microcracks in the delaminated structure do not favor a distinct crack path for initiation and growth. In contrast, Paperboard 2, as seen in Figure 14, composed of two brown (mid and bottom plies) and white (top ply) plies, shows a distinct crack delamination between the mid and top ply interface. It is further observed that the brown fibers are stretched toward the white ply, with no white fibers stretching toward the brown ply.
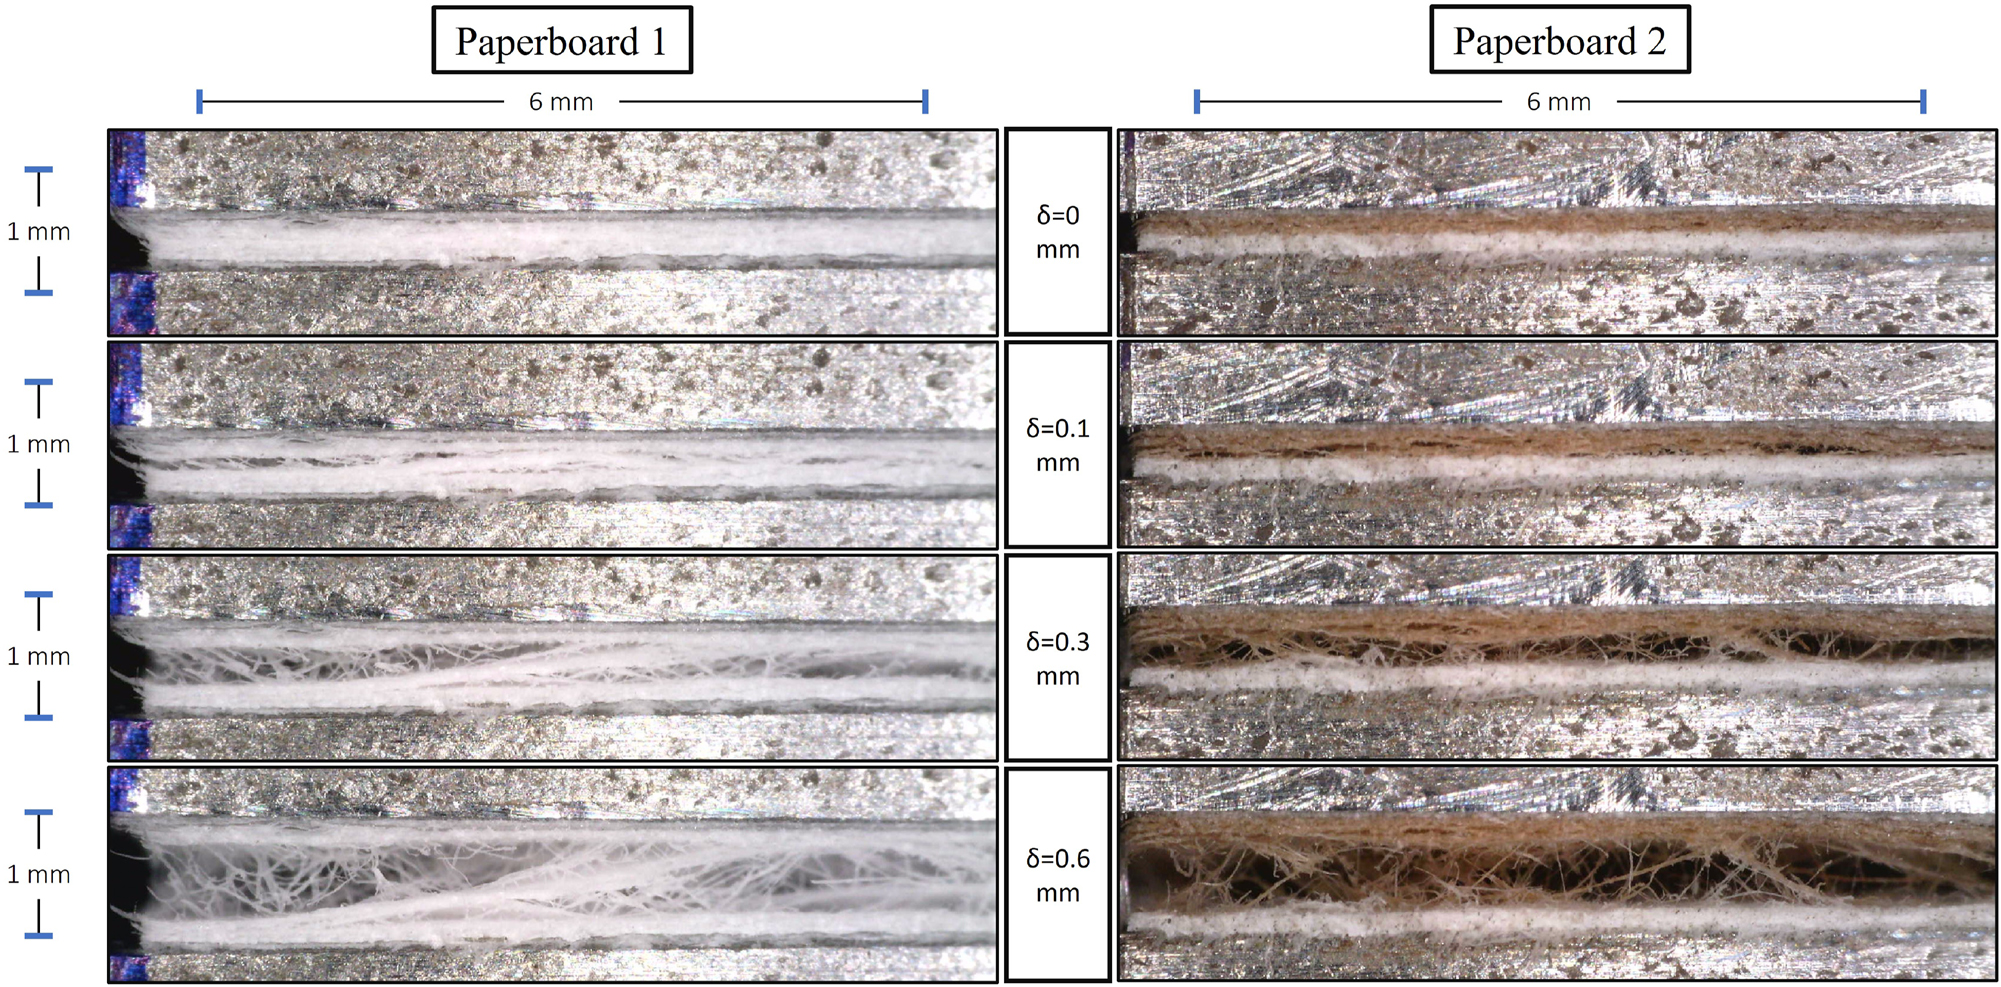
Microscopic photos of the DCB specimens made of Paperboard 1 and 2 at different separation levels.
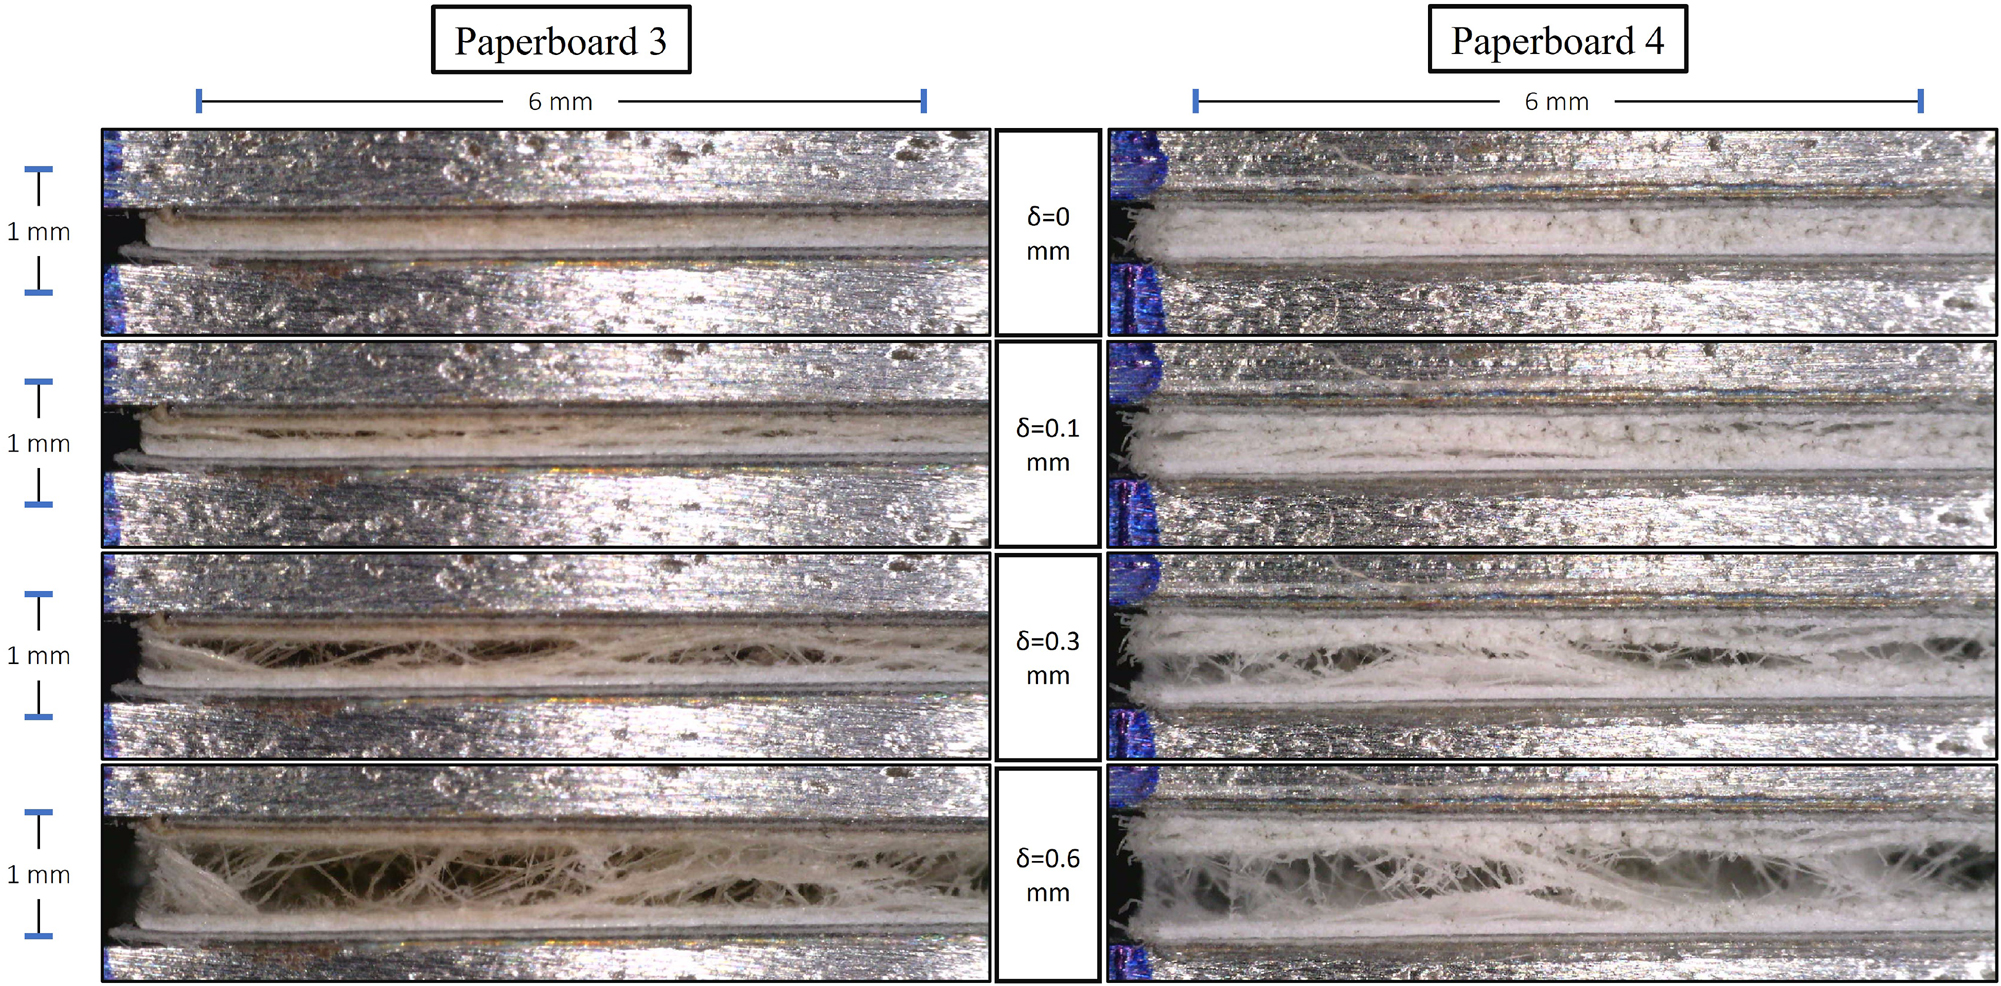
Microscopic photos of the DCB specimens made of Paperboard 3 and 4 at different separation levels.
3.4 Mode-independent shape parameter and near-symmetry
Biel et al. (2022) hypothesized that this shape parameter is the same for normal and shear loading modes. Our experimental data and subsequent calibration support this hypothesis. For each paperboard quality, the calibrated shape parameter c is consistent in both modes, reinforcing the notion of a unified fracture mechanism that governs normal and shear delamination. A mode-independent c for different paperboard qualities can reduce the complexity of the calibration process for predictive models.
The calibration results in Table 3 provide crucial parameters for modeling the fracture behavior of these paperboards under different loading conditions. Understanding these parameters allows us to predict how each material will respond to mechanical stresses, which is essential for applications where material failure could be critical. The calibration process, which aligns the model parameters closely with the experimental data, ensures that simulations and analyses based on these parameters will be accurate and reliable.
Based on the experimental data, Biel et al. (2022) utilized the strain measure ϵ and found that the normalized fracture resistance data for normal g
n
and shear loading g2 closely follow each other. This observation is supported by the analysis conducted on the four paperboard qualities. To validate the calibrated data presented in Table 3, derived using the traction-separation law in (10), the fracture-energy normalization method for DCB and SDCB tests described by Biel et al. (2022) is employed. Figure 16 shows the experimental mean curves of the normalized fracture resistance,
This suggests that g is an invariant parameter, implying that the normalized fracture resistance of the paperboards studied is a material property unaffected by the type of loading applied, whether normal or shear. The experiments further indicate that each paperboard has its unique value of g, but all paperboards obey the relation in (11).
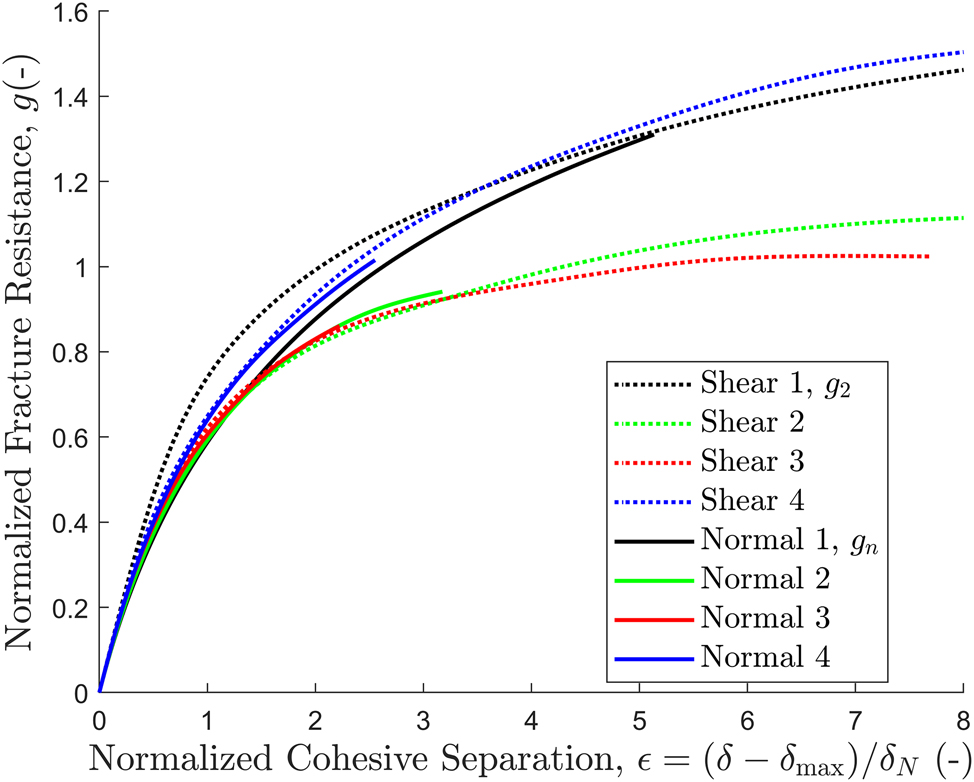
The mean curves of the normalized fracture resistance
The potential near-symmetry between shear and normal cohesive parameters was assessed through analysis of the parameter ratios
Ratios
| Paperboard |
|
|
||
|---|---|---|---|---|
| Mean | Std | Mean | Std | |
| 1 | 17.1 | 5.48 | 20.8 | 7.21 |
| 2 | 9.14 | 2.57 | 9.62 | 2.68 |
| 3 | 5.86 | 0.76 | 6.05 | 1.28 |
| 4 | 4.63 | 1.21 | 5.84 | 0.95 |
Figure 17 illustrates a strong linear correlation between the ratios
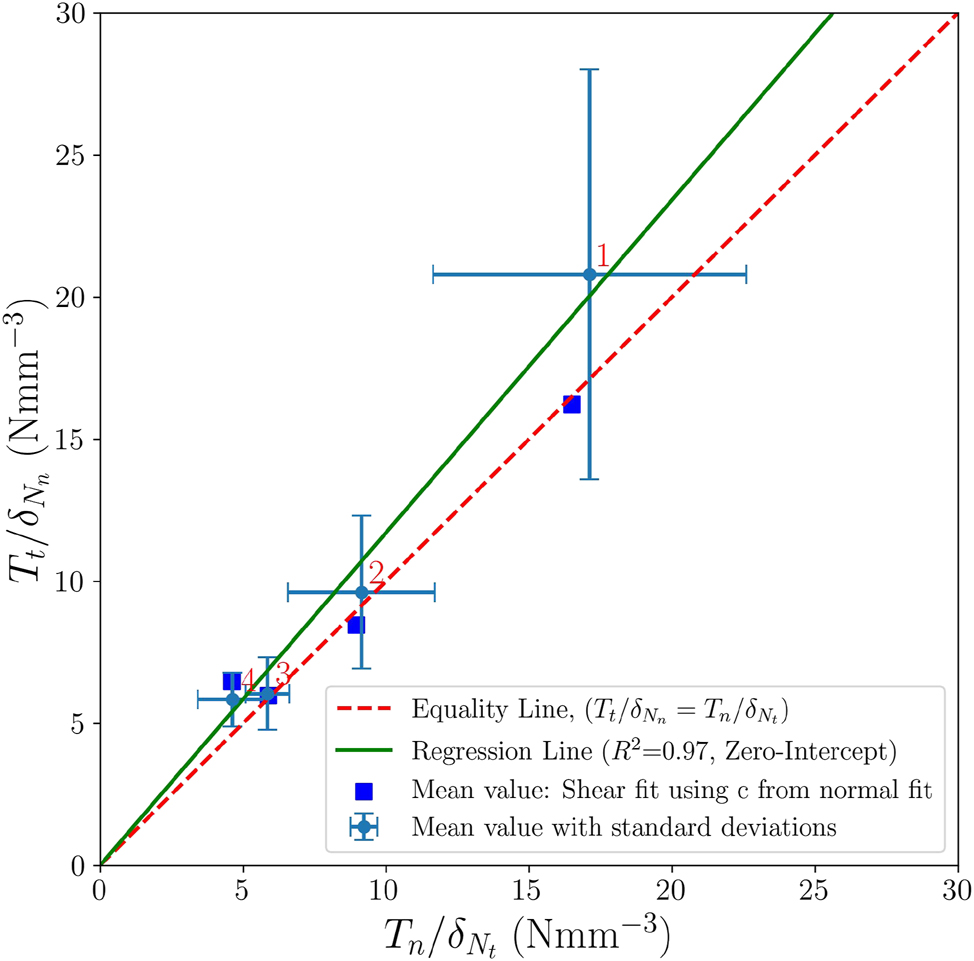
Comparison of
Additionally, Figure 17 includes corresponding ratios from Table 3, marked by blue cubes, closely aligned with the red dashed equality line
The observed proportional relationship simplifies parameter calibration significantly, enabling estimation of shear parameters from normal-mode tests or vice versa. Despite inherent variability in experimental measurements, as represented by the error bars, the consistent linear trend supports material near-symmetry. Hence, the ten parameters needed for calibrating the CZM model reduces to an eight-parameter CZM model.
3.5 Rationale for the selected CZM
In this study, the cohesive zone model (CZM) proposed in (10) was selected due to its demonstrated capability in accurately representing the experimental behavior of paperboard delamination. To validate this selection, a comparative analysis was performed with two alternative CZM approaches: the three-parameter model proposed by Li et al. (2018) and the two-parameter model introduced by Xu and Needleman (1994).
The models developed by Li et al. and Xu and Needleman apply separate parameter sets for normal and shear loading conditions, requiring six and four parameters, respectively. Conversely, the CZM formulation described in (10) employs eight parameters, reduced from ten by using the same shape parameter for both modes and leveraging near-symmetry between the normal and shear loading modes.
Model performance was assessed through root mean square error (RMSE) comparisons. The CZM by Biel et al. yielded maximum RMSE values of 1.2 × 10⁻³ for normal-mode and 2.3 × 10⁻³ for shear-mode fracture resistance. In contrast, the Li et al. model produced RMSE values up to 4.7 × 10⁻³ and 1.5 × 10⁻², and the Xu and Needleman model generated RMSE values of 8.6 × 10⁻³ and 1.5 × 10⁻², for normal and shear fracture resistance, respectively.
These findings indicate that the CZM approach in (10) significantly better represents the experimental data. Despite having more parameters, this model effectively captures the tail behavior of the experimental fracture resistance and traction–separation curves. Although simpler, the alternative models fail to represent the complete experimental behavior accurately, particularly in the cohesive response’s tail region. The nearly one-to-one fitting accuracy and lower RMSE values provided by the selected CZM, alongside its capacity to capture inherent symmetry and tail behavior of the delamination process, demonstrate its effectiveness in reproducing the experimental data. Thus, the selected CZM provides an accurate and physically consistent representation of paperboard delamination behavior.
4 Conclusions
This study characterized the out-of-plane delamination behavior of four paperboard qualities sourced from various geographical regions under normal (DCB) and shear (SDCB) loading conditions. The experimental data were calibrated using a cohesive zone model (CZM) proposed by Biel et al. (2022), demonstrating its effectiveness in simplifying and enhancing the accuracy of delamination predictions. The calibration approach, relying on experimental fracture resistance data, showed excellent agreement between theoretical predictions and observed results, indicated by consistently low RMSE values
Boxplot analyses revealed significant anisotropy in the length measure parameter, δ N , while the shape parameter c exhibited nearly isotropic behavior across both loading modes. The hypothesis proposed by Biel et al. regarding the isotropy of the shape parameter was supported by experimental evidence, confirming that c can reliably be considered mode-independent. This assumption further enabled a near-symmetry between shear and normal cohesive parameters, confirmed through linear regression, thereby simplifying practical modeling by allowing estimation of shear parameters from normal-mode tests.
Comparative analyses highlighted mode-dependent mechanical responses, with shear loading consistently resulting in higher fracture energy and cohesive strength compared to normal loading. These findings emphasize the necessity of considering shear loading mode effects in material design and structural integrity evaluations.
Microstructural observations supported experimental results, illustrating clear differences in delamination behaviors among the tested paperboards, notably influenced by fiber orientation and layering structure.
In conclusion, the initially proposed CZM includes ten parameters. However, due to the identified isotropy in the shape parameters and the observed near-symmetry, the number of parameters required to calibrate the normal and shear modes is reduced from ten to eight. These parameters include the initial stiffnesses k
n
and k
t
(MPa mm−1), the cohesive strengths T
n
and T
t
(MPa), the separations at cohesive strength
These findings provide a robust foundation for accurately predicting paperboard performance under diverse loading scenarios in the paperboard-based packaging industry.
Funding source: Stiftelsen för Kunskaps- och Kompetensutveckling
-
Research ethics: Not applicable.
-
Informed consent: Not applicable.
-
Author contributions: The authors have accepted responsibility for the entire content of this manuscript and approved its submission.
-
Use of Large Language Models, AI and Machine Learning Tools: To improve language.
-
Conflict of interest: We have disclosed any potential conflicts of interest and acknowledged the support of our collaborators and sponsors in the manuscript.
-
Research funding: Billerud, Klabin, Stora Enso, Tetra Pak, WestRock, and Knowledge Foundation.
-
Data availability: The raw data can be obtained on request from the corresponding author.
References
Alzweighi, M., Tryding, J., Mansour, R., Borgqvist, E., and Kulachenko, A. (2023). Anisotropic damage behavior in fiber-based materials – modeling and experimental validation. J. Mech. Phys. Solid. 181: 105430, https://doi.org/10.1016/j.jmps.2023.105430.Search in Google Scholar
Benzeggagh, M. L. and Kenane, M. (1996). Measurement of mixed-mode delamination fracture toughness of unidirectional glass/epoxy composites with mixed-mode bending apparatus. Compos. Sci. Technol. 56: 439–449, https://doi.org/10.1016/0266-3538(96)00005-x.Search in Google Scholar
Biel, A., Tryding, J., Ristinmaa, M., Johansson-Näslund, M., Tuvesson, O., and Stigh, U. (2022). Experimental evaluation of normal and shear delamination in cellulose-based materials using a cohesive zone model. Int. J. Solids Struct. 252: 111755, https://doi.org/10.1016/j.ijsolstr.2022.111755.Search in Google Scholar
Carpinteri, A., Corrado, M., and Paggi, M. (2011). An analytical model based on strain localisation for the study of size-scale and slenderness effects in uniaxial compression tests. Strain 47: 351–362, https://doi.org/10.1111/j.1475-1305.2009.00715.x.Search in Google Scholar
Ebrahimijamal, M., Biel, A., Tryding, J., and Nygårds, M. (2025). Optimized specimen for paperboard shear delamination testing. Exp. Mech., https://doi.org/10.1007/s11340-025-01204-y.Search in Google Scholar
Fellers, C. (1977). Procedure for measuring the interlaminar shear properties of paper. Sven. Papperstidning 80: 89–93.Search in Google Scholar
Fellers, C. and Andersson, C. (2012). Evaluation of the stress-strain properties in the thickness direction — particularly for thin and strong papers. Nord. Pulp Pap Res. J. 27: 287–294, https://doi.org/10.3183/npprj-2012-27-02-p287-294.Search in Google Scholar
Fellers, C., Östlund, S., and Mäkelä, P. (2012). Evaluation of the Scott bond test method. Nord. Pulp Pap Res. J. 27: 231–236.10.3183/npprj-2012-27-02-p231-236Search in Google Scholar
Hutchinson, J. W. and Suo, Z. (1991). Mixed mode cracking in layered materials. In: Hutchinson, J. W. and Wu, T. Y. (Eds.), Advances in applied mechanics, Vol. 29. Elsevier, Amsterdam, pp. 63–191.10.1016/S0065-2156(08)70164-9Search in Google Scholar
Isaksson, P., Gradin, P. A., and Östlund, S. (2010). A simplified treatise of the scott bond testing method. Exp. Mech. 50: 745–751, https://doi.org/10.1007/s11340-009-9269-y.Search in Google Scholar
Jina, W. and Nagasawa, S. (2018). Finite element analysis of the folding process of creased white-coated paperboard using a combined fluffing resistance and shear yield glue model. J. Adv. Mech. Des., Syst., Manuf. 12: 1–15, https://doi.org/10.1299/jamdsm.2018jamdsm0063.Search in Google Scholar
Li, Y., Stapleton, S., Simon, J., and Reese, S. (2016). Experimental and numerical study of paperboard interface properties. Exp. Mech. 56: 1477–1488, https://doi.org/10.1007/s11340-016-0184-8.Search in Google Scholar
Li, Y., Stapleton, S. E., Reese, S., and Simon, J.-W. (2018). Anisotropic elastic-plastic deformation of paper: out-of-plane model. Int. J. Solids Struct. 130-131: 172–182, https://doi.org/10.1016/j.ijsolstr.2017.10.003.Search in Google Scholar
Lundh, A. and Fellers, C. (2001). The Z-toughness method for measuring the delamination resistance of paper. Nord. Pulp Pap Res. J. 16: 298–305, https://doi.org/10.3183/npprj-2001-16-04-p298-305.Search in Google Scholar
Nygårds, M. (2008). Experimental techniques for characterization of elastic-plastic material properties in paperboard. Nord. Pulp Pap Res. J. 23: 432–437, https://doi.org/10.3183/npprj-2008-23-04-p432-437.Search in Google Scholar
Nygårds, M. and Malnory, J. (2010). Measuring the out-of-plane shear strength profiles in different paper qualities. Nord. Pulp Pap Res. J. 25: 366–371.10.3183/npprj-2010-25-03-p366-371Search in Google Scholar
Nygårds, M., Fellers, C., and Östlund, S. (2007). Measuring out-of-plane shear properties of paperboard. J. Pulp Pap. Sci. 33: 105–109.Search in Google Scholar
Olsson, P. and Stigh, U. (1989). On the determination of the constitutive properties of thin interphase layers – an exact inverse solution. Int. J. Fract. 41: R71–R76, https://doi.org/10.1007/bf00018870.Search in Google Scholar
Rice, J. R. (1968). A path independent integral and the approximate analysis of strain concentration by notches and cracks. J. Appl. Mech. 35: 379–386, https://doi.org/10.1115/1.3601206.Search in Google Scholar
Sørensen, B. F. (2016). Modeling damage, fatigue and failure of composite materials; materials. In: Talreja, R. and Varna, J. (Eds.), Woodhead publishing Series in composites Science and engineering. Woodhead Publishing, Amsterdam, pp. 213–240.Search in Google Scholar
Tryding, J. and Ristinmaa, M. (2017). Normalization of cohesive laws for quasi-brittle materials. Eng. Fract. Mech. 178: 333–345, https://doi.org/10.1016/j.engfracmech.2017.03.020.Search in Google Scholar
Tryding, J., Johansson-Näslund, M., Biel, A., Stigh, U., Tuvesson, O., and Ristinmaa, M. (2023). Delamination of cellulose-based materials during loading–unloading conditions: interface model and experimental observations. Int. J. Solids Struct. 279: 112365, https://doi.org/10.1016/j.ijsolstr.2023.112365.Search in Google Scholar
Xia, Q. S. (2002). Mechanics of inelastic deformation and delamination in paperboard, Ph.D. thesis. Massachusetts Institute of Technology, United States of America.Search in Google Scholar
Xu, X.-P. and Needleman, A. (1994). Numerical simulations of fast crack growth in brittle solids. J. Mech. Phy. Solids 42: 1397–1434, https://doi.org/10.1016/0022-5096(94)90003-5.Search in Google Scholar
© 2025 the author(s), published by De Gruyter, Berlin/Boston
This work is licensed under the Creative Commons Attribution 4.0 International License.
Articles in the same Issue
- Frontmatter
- Bleaching
- A new strategy for biological enzyme bleaching: combined effects of laccase, xylanase, and mannanase in the bleaching of softwood kraft pulp – a synergistic effect of enzymes
- Mechanical Pulping
- Characterization of the low consistency pulp refining conducted by the plates with different bar-groove width ratios
- Paper Technology
- On the influence of macro-scale stress variations on the dynamic dewatering of water-saturated polymer fibre networks
- Effects of dispersion hydrophobized MgO nanoparticles in low polarity solvent on aged paper
- Preparation and properties of effective low-cost composite filler for bible paper
- Paper Physics
- Normal and shear delamination of paperboards
- Micro-CT analysis of creased and folded multilayer cardboard
- Paper Chemistry
- Preparation of MgO/CaCO3 nanocomposites and their deacidification properties for paper documents
- Effects of sequential plasma modification and alkali treatment applied to cellulose fibers on the properties of the paper
- Coating
- Production of nano silver and nano silica coated paper to be used in active packaging
- Insights into bibliometric review for natural coatings for paper-based food packaging: trends, perspectives, and future directions
- RSM optimization of spray-coating parameters to enhance paper strength using cellulose nanocrystals extracted from young coconut husks
- Chemical Technology/Modifications
- NSSC pulp treatment with the Fenton reaction: fiber modification for reduced energy consumption in papermaking
- Other
- Fenton degradation of biologically pre-treated pulp and paper effluent using zero-valent iron from commercial steel wool
- Corrigendum
- Corrigendum to: Preparation and synthesis of water-soluble chitosan derivative incorporated in ultrasonic-assistant wheat straw paper for antibacterial food-packaging