Sodium salt scaling in black liquor evaporators and the effects of the addition of tall oil brine
-
Erik Karlsson

 and
Anders Åkesjö
and
Anders Åkesjö

Abstract
Sodium salt scaling, i. e. the formation of doubles salts comprised of sodium, carbonate and sulphate on the heat transfer surfaces, is a common problem that occurs during black liquor evaporation. In this study, experimental results are presented that provide new insights into the formation and composition of such scales and how they are influenced by the addition of tall oil brine. It was found that increased content of sodium carbonate and sodium sulphate in the black liquor increased scaling, while the ratio between carbonate and sulphate had a lesser influence than reported in other studies. Black liquor created loose clay-like scales comprised of aggregated crystals and black liquor, whereas salt solutions created hard mineral-like scales. The scales formed by both the black liquor and the salt solution showed a tendency to fall off during formation after primary nucleation. It was also found that both tall oil soap and alkalized tall oil brine could inhibit the formation of scales. The inhibition effect is stronger if adding the soap or brine just before scaling starts, but also depends on the amount added, the sodium carbonate and sodium sulphate content in the liquor as well as other factors.
Introduction
The Kraft pulping process involves wood being treated in the digester with sodium hydroxide and sodium sulphide. The spent cooking chemicals, together with dissolved wood components (mainly lignin and hemicellulose), are separated from the liberated fibres during the washing step. This spent liquor, known as weak black liquor, is treated in the chemical recovery cycle to regenerate the cooking chemicals, recover energy and generate valuable by products. The first step is to remove most of the water from the weak black liquor in multiple-effect evaporators: the concentration of the liquor is increased step by step to produce a firing liquor that can be combusted in the recovery boiler (Gullichsen and Fogelholm 1999).
Black liquor contains several components that can be precipitated or deposited on the heat transfer surfaces in the evaporator effects, a phenomenon known as fouling or scaling. This is problematic because it decreases their performance by creating an insulating layer on the heat transfer surfaces (Gullichsen and Fogelholm 1999). Among the most abundant compounds present in black liquor are sodium carbonate and sodium sulphate (hereafter referred to as “salt”); the solubility limits of their double salts are exceeded at around 50 % dry solids content (DS) (Grace 1976). This means that evaporator effects operating at higher concentrations need to be designed to handle vast crystallization, often leading to scaling: sodium salt scaling is one of the most common causes of process disturbances during black liquor evaporation (Grace 1975, Haag and Stigson 2003, Schmidl and Frederick 1998). It creates a need not only for an over-design with larger heat transfer surfaces to allow operation also during scaled conditions, but also the addition of an automated washing process. However, even with these measures, scale formation can be so fast that it creates severe process disturbances.
The solution of sodium, carbonate and sulphate can form different double salts (or crystal species) depending on temperature and the concentration ratio between carbonate and sulphate, where the latter is often expressed as a mole fraction of sodium carbonate:
It has been shown that one of the most important factors affecting the degree of sodium salt scaling is the crystal species (Frederick et al. 2004, Verrill and Frederick 2006, Gourdon et al. 2010b). According to Frederick et al. (2004), burkeite crystallises at
Other factors that have been shown to affect scaling are the concentration profile along the heat transfer surface (Gourdon et al. 2010b), DS (Karlsson et al. 2013) and size of the formed bulk crystals (Karlsson et al. 2017). In addition, the solubility is important for when the crystallization starts (Bialik et al. 2008).
Along with the sodium salts, black liquor contains many other organic and inorganic compounds that may have the potential to affect the crystallization of the sodium salts. In addition, different side streams (e. g. recovery boiler ash, spent acids and bio-sludge) are added to the evaporator plant as it is an efficient way of treating residual streams and recovering valuable chemicals, and thereby makes the situation even more complex (Gullichsen and Fogelholm 1999). The crystallisation behaviour of the sodium salts may therefore differ, depending on the prevailing chemical environment of the mill in question: although this is something that is unknown today, the industry does have some practical experience.
Black liquor originating from the processing of softwood contains tall oil soap. It is comprised of wood extractives, mainly fatty acids and resin acids, that become insoluble in the black liquor as the concentration increases and therefore forms a separate phase (Dogaris et al. 2019). As the soap has lower density than the liquor, it will float to the top of the black liquor tanks where it can be separated by skimming: this is normally done to improve the operation of the evaporator but also because it is a valuable by-product (Frederick and DeMartini 2019). The general experience is that soap can cause operational problems in the evaporator in that it increases liquor carryover due to foaming or forms deposits: Gullichsen and Fogelholm (1999) recommend a crude tall oil (CTO) content below 0.5–1 % per dry mass black liquor. Soap is also believed to promote sodium salt scaling, but there are relatively few studies showing this. The most comprehensive study was made by Uloth and Wong (1986), who found that soap accelerated the formation of sodium scales in rising film evaporators. Lamy (1979) found that soap caused fouling, as it had accumulated in deposits that were analysed. In contrast, Grace (1975) found, after analysing operation at various mills, that some soap seemed to reduce problems with fouling in general. A common concern is also that soap can promote calcium carbonate scaling due to it high content of calcium, which was shown by Frederick and Grace (1977). Nowadays, falling film is the dominant technology used for evaporation but no studies were found relating to this. The general recommendation, however, remains: high levels of soap should be avoided during evaporation (Gullichsen and Fogelholm 1999), even though some mills report fewer problems with sodium salt scaling when some soap is allowed in the liquor.
After the soap is separated from the black liquor, it is processed in the tall oil plant (Aro and Fatehi 2017). There it is acidified with sulphuric acid (or sometimes with other spent acid streams from the mill, e. g. from chlorine dioxide production) to protonate the fatty acids and resin acids, and crude tall oil can then be separated. The raw soap consists of about 50 % tall oil (Gullichsen and Fogelholm 1999). The spent acid or brine stream, hereafter denoted tall oil brine, is comprised of a water phase (containing mainly water, sodium and sulphate) and insoluble precipitates (mainly extractives and lignin). Moreover, it has a relatively high content of calcium, which can promote calcium scaling, as well as other different non-process elements (Lindgren et al. 2018). The brine is normally fed to the evaporator plant, but the recommendation is that it is first alkalised to avoid decreasing the pH of the black liquor which, in turn, can cause the lignin in it to precipitate (Gullichsen and Fogelholm 1999). Alkalisation of the brine changes the chemistry: it dissolves lignin and, above pH 10, unrecovered fatty acids and resin acids will be fully saponified and precipitate as metal salts (Green and Hough 1992). These precipitated salts contain about 80 % of the fatty acids and resin acids and, according to Green and Hough (1992), should not be added to the evaporators, at least not to the thin liquor due to its content of fibres and calcium that can accelerate scaling.
Interestingly enough, mills have reported that sodium salt scaling can be reduced by the addition of tall oil brine, especially when fed in close to the scaling effect: feeding it into the thin liquor gives no inhibition. The relationship between sodium salt scaling and the addition of tall oil brine is, however, relatively unknown. Söderhjelm et al. (1985) found that scaling started at lower DS when tall oil brine was added, which was explained by the increased concentration of sodium sulphate in the black liquor. Euhus et al. (2003) studied the addition of brine produced from dissolved electrostatic precipitator ash and observed a decrease in scaling, but this brine is probably not fully comparable to tall oil brine. There were no other studies found in the literature on the topic. Therefore, the aim of this study was to investigate sodium salt scaling during black liquor evaporation and the influence of the addition of tall oil brine. Different fractions of the tall oil brine were tested individually, as well as raw tall oil soap, to evaluate how different chemical components influence the scaling behaviour.
Materials and methods
Scaling was measured in pilot experiments using both black liquor and salt solution. Different fractions of tall oil brine were added to the experiments to investigate the effect on scaling.
Equipment
The experiments were performed in Chalmers’ pilot evaporator, with Figure 1 showing the most important equipment and sensors relevant to this study. The evaporator itself was of the vertical falling film type, with the liquor on the outer side of a vertical tube. It was designed to be large enough to produce results relevant to industrial conditions and simultaneously sufficiently flexible to be able to simulate a high variety of operational conditions. The evaporator tube was 4.5 m long with an outer diameter of 60 mm (

Simplified flowsheet of the pilot falling film evaporator used in the experiments. Sensors: CLD = chord length distribution, D = density, F = flow rate, L = level, P = pressure, R = refractive index, T = temperature and V = viscosity.
The salt solution or black liquor was fed into the top of the evaporator using a circulation pump: an overflow distributor integrated in the top of the tube ensured that a circumferentially uniform distribution of liquid, with a variety of flow rates, was obtained. The vapour and the concentrated liquid flowed from the evaporator tube into a tank serving both as a buffer volume (about 50 l) and vapour-liquid separator. The bottom of the tank was then connected to the circulation pump as shown in Figure 1; the vapour flowed into a condenser controlling the pressure in the system.
The pilot evaporator was equipped with sensors to monitor the operation and acquire data: the most important sensors are shown in Figure 1. The flow rate and density were measured using Endress and Hauser Promass Coriolis meters with a stated accuracy of 0.15 % for flow rate and
Scaling measurements
Scaling was measured in three different ways:
Continuous measurement of the global heat transfer coefficient from the condensate flow rate
Continuous measurement of local heat transfer coefficient in 7 different vertical positions from thermocouple pairs installed in the tube wall
Local thickness in 1 or 2 positions from mechanical measurements made at the end of the experiment (see Figure 1)
where
which, in turn, is used to calculate the heat transfer coefficients of the black liquor:
The measured heat transfer coefficients for black liquor decreased during the experiment for two reasons: scaling and increased viscosity (as the DS increased). The measured values were therefore adjusted for the effect of viscosity to isolate the effect of scaling using the following expression:
Here, μ is the measured viscosity and the parameter −0.41 is as suggested by Johansson et al. (2007). The validity of this formula was also checked by diluting the black liquor at the end of the experiment (see Procedure).
Finally,
Here,
Materials
The chemical composition of each black liquor and salt solution used in the experiments is presented in Table 1. The parameter w denotes the content of salt (i. e. sodium carbonate and sodium sulphate) per dry mass black liquor. The liquors used were sourced from two Swedish mills that process softwood black liquor: three liquors were received from Mill 1 (Liquors 1.1, 1.2 and 1.3, sampled in May 2018, November 2018 and February 2019) and one liquor from Mill 2 (Liquor 2.1, sampled in June 2019). Three different batches of salt solution were prepared by dissolving anhydrous sodium carbonate and sodium sulphate in deionized water. The pH levels of the liquors or solutions were not measured or adjusted since they were taken directly from the evaporation plant at the mills.
Chemical composition of the liquors and salt solutions. All mass fractions are given per dry mass, DM (where applicable).
| Liquor 1.1 | Liquor 1.2 | Liquor 1.3 | Liquor 2.1 | Salt solutions* | Analytical method | |
| DS [wt%] | 34.6 % | 37.4 % | 37.1 % | 30.5 % | 25 % | SCAN-N 22 |
| Ca [mg/kg DM] | 112 | 132 | 125 | 120 | T 211 om-02 | |
| K [g/kg DM] | 20.0 | 16.3 | 17.9 | 20.0 | ICP-OES | |
| Na [g/kg DM] | 210 | 201 | 199 | 204 | ICP-OES | |
| 110.4 | 94.6 | 90.7 | 92.7 | TIC, SCAN-N 32 | ||
| 45.6 | 43.3 | 44.7 | 44.1 | SCAN-N 36 | ||
| w [wt%] | 15.6 % | 13.8 % | 13.5 % | 13.7 % | 100 % | |
| ϕ [mol/mol] | 0.76 | 0.75 | 0.73 | 0.74 | 0.75 and 0.85 |
-
*Prepared by mixing anhydrous
Soap and different fractions of tall oil brine from Mill 1 were used as additives in the experiments (sampled in May 2018). The mill uses a continuous tall oil process with a centrifugal separator (PINOLA TOPP from HEAD Engineering AB), from which the following streams or fractions were sampled:
Soap: the tall oil soap skimmed from the black liquor and fed to the tail oil plant.
Acid: the brine from the centrifuge, excluding residues from cleaning.
Sludge: the liquid produced when the centrifuge has been washed out with hot water.
Mix: the tall oil sent to the evaporator plant, including cleaning residues. It was sampled after being alkalised with sodium hydroxide to pH 12.9.

Appearance of the four additives used in the experiments after 2 months of sedimentation.
The chemical composition of the additives is shown in Table 2. The Sludge had significantly higher contents of magnesium and calcium. The Mix corresponds to a combination of Acid and Sludge, but it also contained some additional cleaning liquids from the tall oil plant (in addition to wash water from the centrifuge). The chemical composition here is comparable to the brine analysed by Lindgren et al. (2018), even though they used another tall oil process (HDS).
Chemical analyses of the brine fractions. All mass fractions are given per dry mass (DM) where applicable.
| Acid | Sludge | Mix | Analytical method | |
| DS [wt%] | 13.2 % | 20.2 % | 14.3 % | TAPPI T 650 om-09 |
| Ash [wt% DM] | 87.5 % | 57.8 % | 75.4 % | T 211 om-02 |
| Ca [g/kg DM] | 2.1 | 46.6 | 4.6 | ICP-OES |
| Mg [g/kg DM] | 2.4 | 7.4 | 1.4 | ICP-OES |
| K [g/kg DM] | 22 | 6 | 16 | ICP-OES |
| Na [g/kg DM] | 271 | 127 | 247 | ICP-OES |
| 54* | 25* | 49 | TIC, SCAN-N 32 | |
| 579* | 272* | 528 | Ion chromatography | |
| w [wt% DM] | 63.3 % | 29.7 % | 57.7 % | |
| ϕ [mol/mol] | 0.11 | 0.11 | 0.11 | |
| Interesting components [wt% DM]** | 30.7 % | 67.5 % | 37.6 % | |
| Organic content [wt% DM]*** | 12.5 % | 42.2 % | 24.6 % |
-
*Estimated from values of Mix using Na content for allocation, assuming the same ϕ.
-
**Content of interesting components calculated as:
-
***Organic content calculated as:
As can be seen in Table 2, the Acid, Sludge and Mix are comprised of components that are already present in large amounts in the black liquor, i. e. water, sodium, carbonate and sulphate. The table also includes the total amounts of other, more interesting, components contained in the additives to provide a more comprehensive comparison.
The Acid and Sludge were also analysed for organic composition using pyrolysis gas chromatography mass spectrometry (Py-GC/MS). The liquid water phase was found to be comprised mainly of dissolved lignin, while the sedimented solid phase (seen in Figure 2) was constituted of fatty acids and resin acids. Although this was true for both the Acid and Sludge, the latter contained a larger proportion of solid phase and its water phase also contained fatty acids and resin acids. This means that most of the unseparated tall oil (or extractives) are found in the Sludge.
Procedure
The study started with 13 pre-experiments with the aim of developing the experimental method and discovering whether or not a change in scaling due to the addition of brine could be detected. Liquor 1.1 was used in the pre-experiments. The main experiments were comprised of 104 experiments using Liquors 1.2, 1.3, 2.1 and three batches of salt solution of two different compositions (see Table 1). Additional sodium carbonate and/or sodium sulphate were added to the black liquor in the main experiments to be able to change chemical composition and crystallizing species: the salts were first dissolved in deionised water and added to the liquor before the experiment began.
Fresh liquor was used in each pre-experiment, which limited the number of experiments that could be performed. In the main experiments, however, the same liquor was used several times when appropriate (being discarded after the addition of an additive) to allow more experiments to be undertaken. The fresh liquor had relatively low DS,
At 40–45 % DS, 1.2 kg (in the base case) of the additive to be tested was fed into the system using a dosage pump. Nucleation normally occurred at 52–54 % DS and evaporation continued to 70–75 % DS. When the experiment had ended, the thickness of the scale was measured at 1.8 (for some experiments) and 3.8 m from the inlet (see Figure 1). The liquor was then diluted with condensate to around 55 % DS while the evaporation was still ongoing: when the heat transfer remained lower than the same DS before nucleation, scaling was confirmed. Samples of scales were collected from the evaporator tube at 1.9 m (for some experiments) and 3.9 m from the inlet. Finally, the black liquor was ejected before the system was washed at 120 °C with condensate overnight. When the same liquor was to be reused in the following experiment, it was diluted to around 40 % DS and then recirculated at 120 °C overnight to dissolve all crystalline material.
Scale samples were taken at the end of an experiment and some of them were analysed using the following methods:
Qualitative chemical composition of dried samples using attenuated total reflection Fourier transform infrared spectroscopy (ATR-FTIR).
Quantitative chemical composition of dissolved samples using the same methods as for black liquors (Table 1).
Physical structure and elemental composition using a scanning electron microscope (SEM) with energy-dispersive X-ray spectroscopy (EDX).
Results
This section is divided into three main parts: pre-experiments, main experiments and appearance and analysis of the scales. Some motivation for the selected experiment and brief discussions of the results found are included to make them easier to understand.
Pre-experiments
The results from the 13 pre-experiments with Liquor 1.1 are presented in Figure 3. Scaling was detected in several experiment and all the three different scale thickness measurements showed the same trend. The mechanical thickness and local heat transfer measurements were generally higher and, as they were obtained mainly from the lower part of the tube, therefore indicated a conical scale distribution with thicker scales in the bottom. This was also confirmed visually and represents the normal situation as reported by Gourdon et al. (2007). These local measurements also showed larger variations as they become more sensitive for local variations in the thickness of the scales.

Experimental results obtained for Liquor 1.1 during the pre-experiments with and without additives. The thickness of the scales from the three methods are shown for all experiments except Exps. 1.1 and 1.2, in which the local heat transfer measurements were unsuccessful.
The first two reference (Ref.) experiments (Exps. 1.1 and 1.2) showed significant scaling (Figure 3). Interestingly enough, scaling was fully reduced in Exps. 1.3 and 1.4 when Mix was added, meaning that the experimental method seems to be able to detect scale inhibition caused by the addition of tall oil brine. Comparing Exps. 1.5 and 1.6, it seems that Soap had no effect on scaling, while Sludge reduced it in Exp. 1.7. It is, however, surprising to see that Acid increased scaling in Exps. 1.8, 1.11 and 1.13. Unfortunately, the reference experiments were not repeatable as the scaling decreased in Exp. 1.5 to none in Exp. 1.9, thus making it difficult for any definite conclusions to be drawn from the pre-experiments. As the scaling was strong in Exp. 1.8, the absence of scaling in Exp. 1.9 is probably not related to insufficient cleaning of the equipment, and all experiments were run within a few weeks so aging effects of the black liquor are also unlikely. No additional experiments could be performed with Liquor 1.1 since it was all consumed during the pre-experiments.
Conditions with predictable scaling in the reference case were necessary in order to improve the repeatability of the main experiments. The solution, as shown in the following section, was to add extra salt to the liquors to increase scaling. Otherwise the experimental method was found successful: scale inhibition could be detected and no additional changes were needed. However, to avoid potential inhomogeneity of the liquor to cause unrepeatable behaviour, extra care was put into ensuring sufficient mixing of the liquor before feeding the evaporator in the main experiments.
Main experiments
The first part of this section shows the results obtained from the main experiments without any additive. The second and third parts report the results obtained with additives, where the latter also includes the results from the pre-experiments.
The influence of carbonate and sulphate contents
Liquors 1.2, 1.3 and 2.1 did not scale at all during the reference experiments but, when additional salt was added, scaling was initiated during nucleation. The weight fraction of salt, w, at which scaling started is summarized in Table 3: it differed for the various liquors and was dependent on ϕ in the liquor. The underlying experimental points are shown in Figure 4. During carbonate-rich conditions (
Salt content required to achieve repeatable scaling depending on the mole fraction of carbonate, ϕ, for the investigated liquors. Liquor 1.1 is included even though it could not be examined by addition of salt.
| Burkeite | Sodium carbonate sulphate | Dicarbonate | |
| Liquor 1.1 | |||
| Liquor 1.2 | 19.5 % | 23 % | 23 % |
| Liquor 1.3 | 17 % | 21 % | 21 % |
| Liquor 2.1 | 23–24 % |

Experimental results from the main experiment without additives, but with sodium carbonate and sodium sulphate added to increase scaling. The colour of the points represents the amount of scaling. The horizontal lines represents the divisions of crystalizing species according to Frederick et al. (2004) and DeMartini and Frederick (2008).
During sulphate-rich conditions,
The influence of additives
Experimental results for black liquors with and without additives are shown in Figure 5, where the experiments without additives are the same as those presented in Figure 4. Under sulphate-rich conditions,

Experimental results for black liquors, with and without additives, at sulphate rich conditions (left), where
At carbonate rich conditions,
Soap is often considered to cause scaling, and therefore two levels of Soap addition were tested for pure Liquor 1.2 (Soap and Soap high in Figure 5 right at
The results of the three batches of salt solution with and without additives are presented in Figure 6. The scale thickness without an additive was in the same range as, or lower than, that of black liquor under scaling conditions. The scale thickness in Batch 3 in particular was very low, which was caused by the scales falling off, and Batch 2 was a milder case where some scales fell off. As with black liquor, scaling was not significantly stronger in the dicarbonate region (Batch 1,

Experimental results of the three batches of salt solutions with and without additives.
The influence of the content and dissolution of the brine
The brine contains large amounts of water, sodium, carbonate and sulphate, all of which cannot be active in scale inhibition since they are already present in large amounts in the black liquor. However, when evaluating the brine addition, only components that are potentially active in the inhibition is of interest, which can be quantified as the addition of interesting components or as organics according to the recalculation in Table 2. Furthermore, as the salt content in the liquor seems to be important, the amount of additive can be calculated per total mass of salt in the system. This way of treating the data also takes into account the fact that the content of interesting components varies between the different additives (Table 2): Acid naturally contains more spent acid (not active) whereas Sludge contains more of other, potentially active, components. The results can be seen in Figure 7, which shows all experiments with additives (except Soap) performed under scaling conditions, with the scaling rate as a function of both added interesting component (A) and organics (B). Both figures are very similar: the only clear difference is that the three experiments with Liquor 1.1 and lowest amount of addition (the pre-experiments with Acid) show lower addition relatively the other points in Figure 7B.
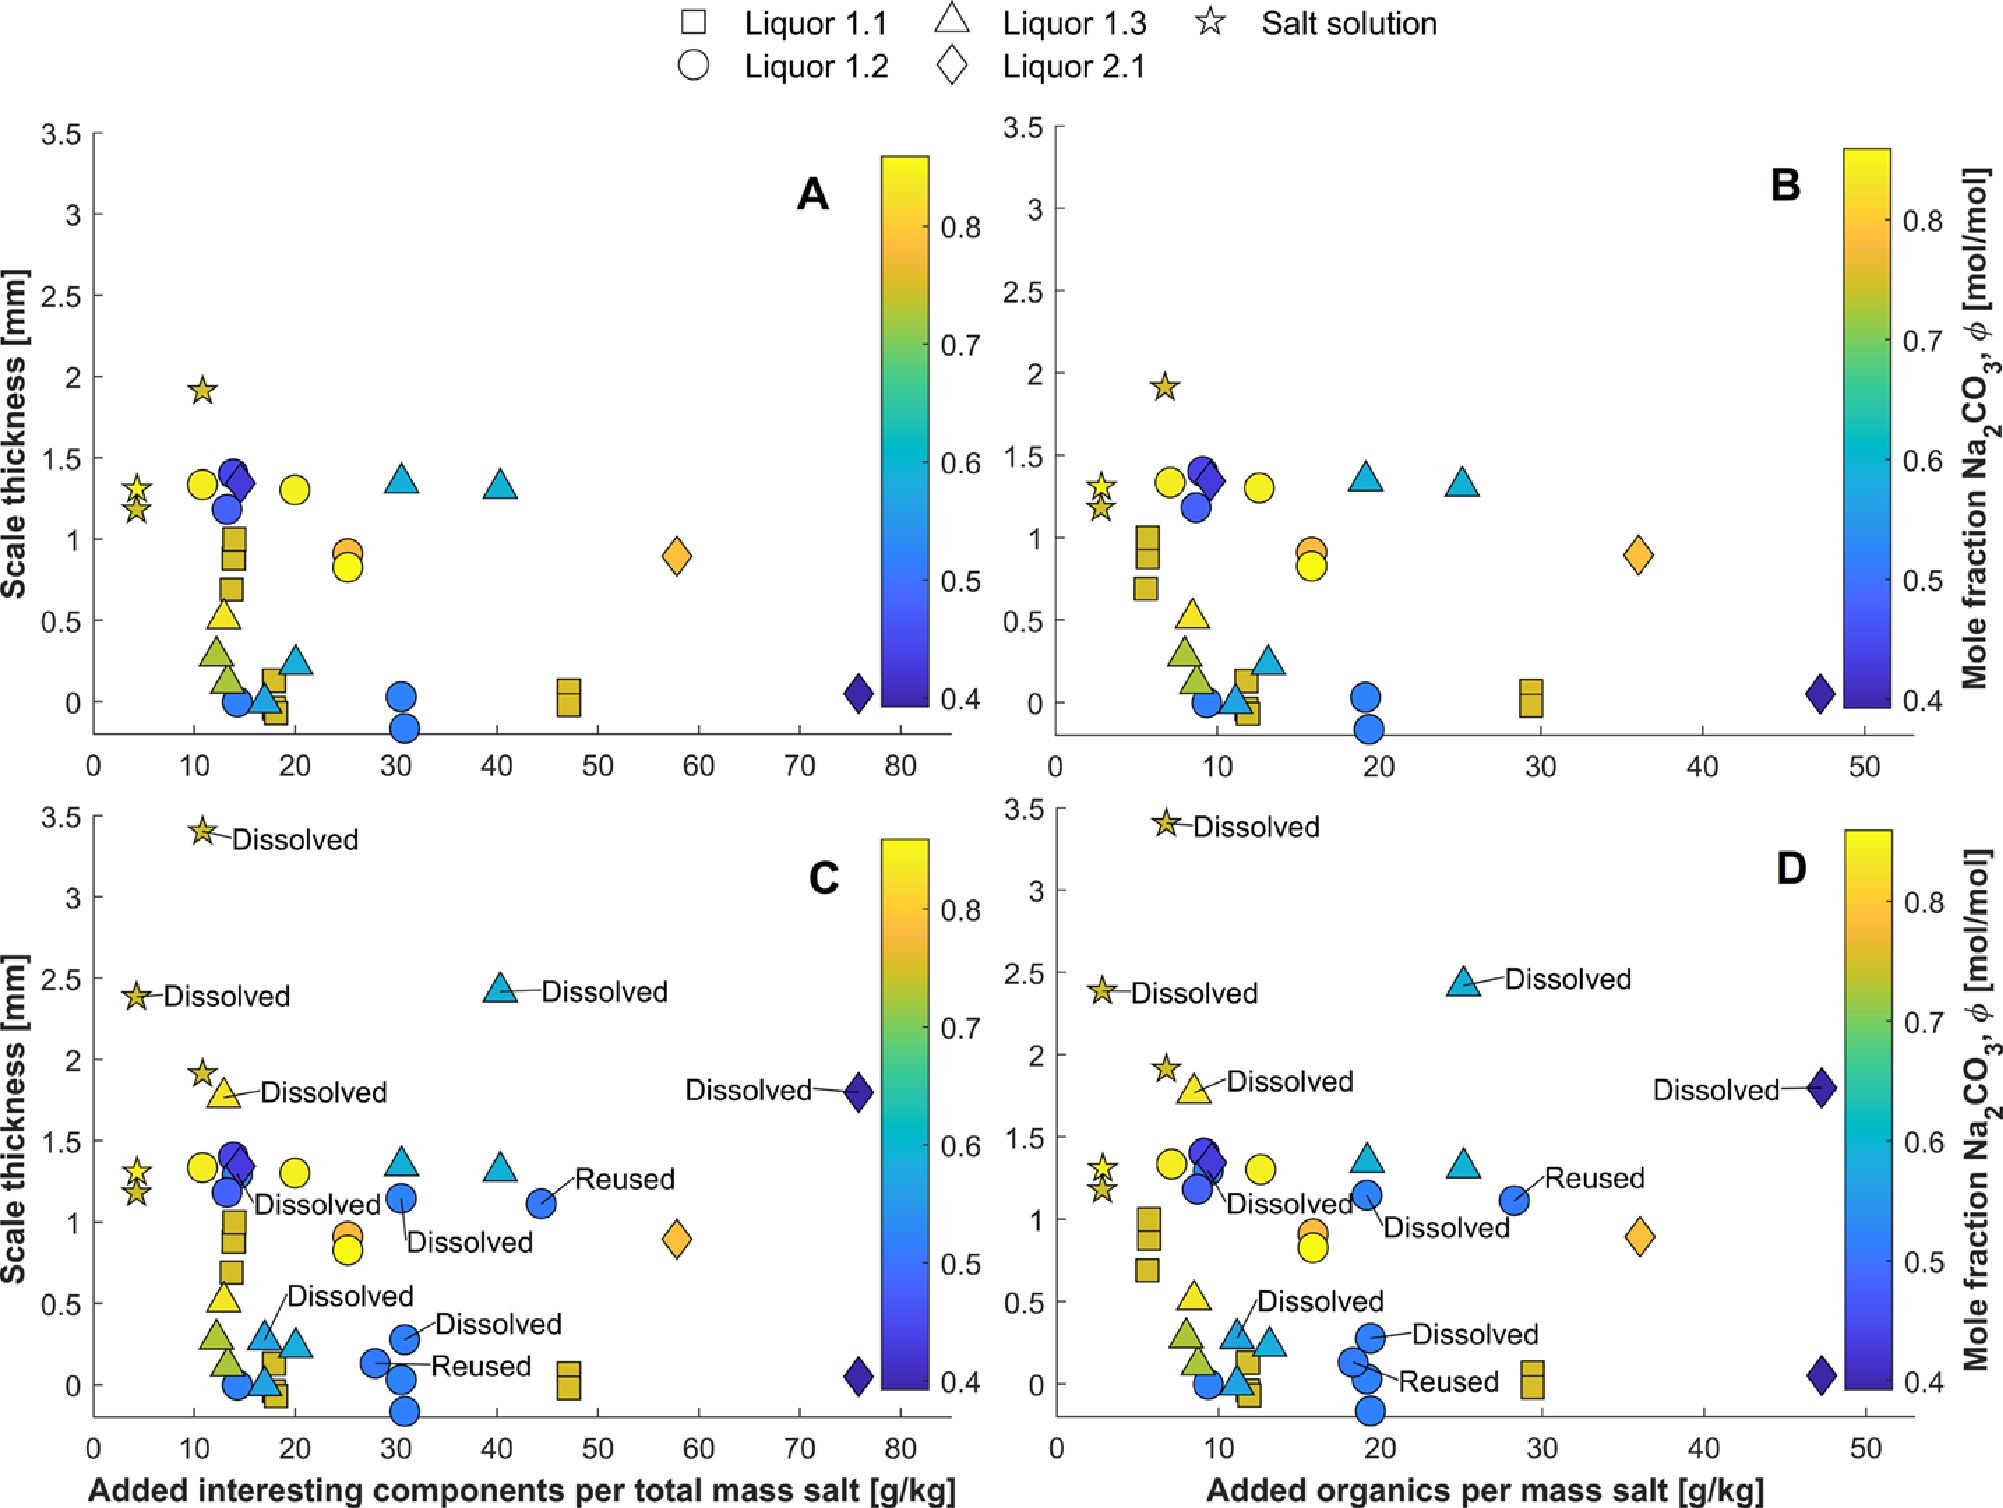
Scaling as a function of the amount of additive (excluding Soap) for all experiments under scaling conditions, i.e. w according to Table 3 or higher. The amount of Acid, Sludge or Mix added were recalculated (according to Table 2) to the addition of interesting components (A and C) and organics (B and D) per total mass of salt in the system. The pre-experiments (Liquor 1.1) and experiments with salt solution are included as well. C and D are the same as A and B, but experiments that were repeated after dilution and dissolving overnight (Dissolved) and experiments where new additive was added the day after overnight dissolution (Reused) are also included.
It appears to be some relationship between scaling and the amount of additive used: bellow around 7 g organics per kg salt, inhibition is unsuccessful (Figure 7B). This means that the reason for the unsuccessful inhibition in the salt experiments, as well as with the addition of Acid in the pre-experiments (Liquor 1.1), can be interpreted as the addition of active component was not enough. From 8 g of organics per kg salt and above, several experiments show a trend of decreased scaling with the addition of more additive. Liquor 1.1 shows a fully consistent trend. Liquors 1.2 and 2.1 show consistent inhibition in the burkeite region, while no clear inhibition in the carbonate rich regions. Liquor 1.3 shows a strange behaviour with more inhibition at lower amounts of additives.
Figures 7C and D also includes the “Dissolved” salt experiments previously seen Figure 6, along with some liquor experiments which were repeated after dilution to

The pilot evaporator tube after experiments with Liquor 1.2 (A before and B after taking scale samples) and salt solution Batch 3,
In the experiments with Soap addition (Figure 5), substantially higher amounts of interesting components and organics were added per mass salt, corresponding to 140–150 g/kg (using the value by Gullichsen and Fogelholm (1999) that half of the Soap is black liquor, implying the other half to be interesting components): the active components are likely to be the same, but the additives might be too different to allow this kind of comparison. The higher amounts can also be interpreted as Soap is less efficient, and as it is also a valuable by-product, Soap might be less attractive as an agent to prevent scaling.
Appearance and behaviour of the scales
Typical appearances of scales, once experiments had ended, are shown in Figure 8. The appearance of the scales was the same, regardless of crystallizing species: they were soft and clay-like for all the liquors tested and easily removed by scraping the surface, so perhaps fouling is a more appropriate term. The salt solutions produced mineral-like scales (i. e. hard and brittle) that had to be cracked during sampling. Mineral-like scales have also been found for black liquor, e. g. by Gourdon et al. (2008) and Karlsson et al. (2017) using the same pilot evaporator.
As mentioned previously, scales fell off at varying degrees for the reference experiments with salt solution. When Mix and Sludge were added to the salt solutions, however, this behaviour ceased: the scales appeared to be stronger and the overall degree of scaling become more severe. It was common that scales also fell off during the black liquor experiments, and especially so immediately after being formed during the primary nucleation phase. This was detected by the local heat transfer measurements, which first decreased strongly and then suddenly returned to the nonscaled value. If the scaling was strong, new scales were formed and the heat transfer decreased again, sometimes causing an uneven distribution. This is exemplified in Figures 8A (black liquor) and 8C (salt solution), where parts of the tube are free from scales or have significantly thinner scales. Liquor 1.1, however, showed low tendency to fall off, so this was not the reason for the low repeatability in the pre-experiments.
In the case of the pure black liquors, no scaling was formed at all (except for Liquor 1.1, which had the highest content of natural salt). However, at intermediate levels of w (still below the values required to achieve repeatable scaling, as shown in Table 3) scales were actually formed, although most either fell off directly after formation or were just formed locally and were therefore not detected in the final scale thickness measurements. These results imply that, as the salt concentration increased, the system became more prone to form scales and, as they also attach more strongly, the behaviour changed quite drastically from non-scaling to scaling conditions.
Composition and structure of the scales
Compositions of ten scale samples collected at the end of the experiments.
| Sample | 1 | 2* | 3* | 4 | 5 | 6 | 7 | 8* | 9* | 10* |
| Experimental conditions | ||||||||||
| Liquor/fluid | L. 1.1 | L. 1.2 | L. 1.2 | L. 1.2 | L. 1.2 | L. 1.3 | Salt B1 | Salt B2 | Salt B3 | Salt B3 |
| Additive | Acid | Sludge dissolved | Sludge | |||||||
| w [wt%] | 15.9 % | 24.8 % | 22.5 % | 19.5 % | 19.7 % | 21.0 % | 100.0 % | 100.0 % | 100.0 % | 98.9 % |
| ϕ [mol/mol] | 0.75 | 0.85 | 0.45 | 0.52 | 0.52 | 0.74 | 0.85 | 0.75 | 0.75 | 0.75 |
| K [g/kg DM] | 19.9 | 14.2 | 14.6 | 15.2 | 15.1 | 16.4 | 0.0 | 0.0 | 0.0 | 0.0 |
| Composition of the scales | ||||||||||
| DS [wt%] | 92.0 % | 82.3 % | 88.9 % | 84.5 % | 85.8 % | 85.0 % | 98.5 % | 96.9 % | 95.3 % | 99.7 % |
| Ca [mg/kg DM] | 713 | 371 | 549 | 467 | 861 | 224 | 592 | 376 | 388 | 999 |
| K [g/kg DM] | 6.3 | 6.3 | 6.1 | 6.2 | 7.1 | 6.1 | 0 | 0 | 0 | 0 |
| Na [g/kg DM] | 336 | 320 | 308 | 289 | 287 | 316 | 403 | 382 | 382 | 365 |
| 480 | 494 | 199 | 251 | 247 | 436 | 646 | 510 | 538 | 443 | |
| 251 | 132 | 456 | 364 | 333 | 216 | 299 | 452 | 428 | 532 | |
| w [wt%] | 73.1 % | 62.6 % | 65.4 % | 61.5 % | 58.0 % | 65.2 % | 94.4 % | 96.2 % | 96.6 % | 97.5 % |
| φ [mol/mol] | 0.72 | 0.83 | 0.37 | 0.48 | 0.50 | 0.73 | 0.74 | 0.60 | 0.63 | 0.53 |
-
*Analysed also by SEM.
A total of ten scale samples were analysed: six from black liquor experiments and four from salt solution experiments. They were first analysed by ATR-FTIR, which confirmed that they were comprised mainly of sodium carbonate and sodium sulphate. Two of the four scales from the salt solution experiments also contained traces of sodium bicarbonate (
The chemical composition of these ten samples of scales were also analysed quantitatively; the results are reported in Table 4 together with general experimental conditions. Although the level of calcium was significantly higher in the samples from experiments with additives (Samples 1, 5 and 10), it was still not more than by a factor of 2–3. The amounts of sodium carbonate and sodium sulphate (w) were above 94 % in the scales from salt solution (Samples 7–10) while around 60–70 % in those from black liquor (Samples 1–6): this relates to the mineral-like verses clay-like appearance discussed in the previous section. In addition to the results in Table 4, the ash content of another sample of scales from black liquor was measured to 80.8 %, confirming the presence of significant amounts of organics.
For the salt solution experiments, ϕ in the scales and solution generally agrees with the literature: a solution with
In the case of Batch 3 (Sample 9) in the salt solution experiments, most of the scales fell off when there was no additive, as mentioned previously. The data in Table 4, however, shows no significant difference to Batch 2 (Sample 7), where only minor parts of the scales fell off, that can explain the difference in behaviour. It is not known if the higher calcium content or lower ϕ in Sample 10 is connected to the strong scaling of Batch 3 with addition of Sludge.
More insight into the structural differences between scales from black liquor and salt solution was obtained using SEM (Scanning Electron Microscopy). Figure 9 shows the different appearances at 100 and 1000× magnification: the black liquor scales (Sample 2) were crumbly and fell apart easily, whereas the salt solution scales (Sample 10) were hard and dense. The large voids in the black liquor scale were probably created when it was fragmented during sample preparation and does not reflect its true structure.

SEM secondary electrons images at 100 and 1000× magnification, of a fragment of black liquor scale from Sample 2 (A and C) and a fracture surface of salt solution scale from Sample 10 (B and D). The large voids in the black liquor scale fragment were probably formed when the fragment was broken.
Figure 10 shows the SEM images of the black liquor scales (Sample 3). As for Sample 2 (Figure 9), the scales seem to be comprised of particles in the micrometre range, partly attached to each other in some form of aggregates. The images from the backscattered electrons (Figures 10B and D), in combination with EDX (Energy-Dispersive X-ray spectroscopy), show that the sample is not homogenous: brighter areas contained mainly sodium, sulphur and oxygen (i. e.

SEM images of black liquor scale from Sample 3 at 1000 and 3000× magnification. A and C show the surface structure by detecting the secondary electrons, while B and D show the contrast in atomic number (larger atoms are brighter) by detecting backscattered electrons.

SEM secondary electrons images of salt solution scale Sample 10, showing the surface facing towards the evaporator tube at 50× (left) and 3000× (right) magnification.
The structure of the salt solution scales was dependent on the surface being investigated. The fracture surface perpendicular to the evaporator tube had a layered structure (Figure 9); the surface towards the evaporator tube, Figure 11 (left), was smooth but had a few cavities (especially in the left and right part of the left image). At 3000× magnification (right image), however, the surface is no longer smooth and appears instead to consist of agglomerated particles in the range of 1 μm upwards. This is likely related to how the crystals adhere to the tube steel surface and, during sampling, it was clear that this adhesion was weaker than the strength of the scale itself.
Calcium carbonate deposits
Insoluble scales built up slowly on the evaporator tube during the course of the experiments. Figure 12 shows the appearance after the 13 pre-experiments: the tube was dotted with fur-like deposits (needle crystals) that XRD analysis confirmed to be calcium carbonate (calcite) scales. This type of deposit has not been observed before on the pilot evaporator tube and must be caused by the high calcium content of the tall oil brine. Calcium carbonate scales were also formed during the main experiments: however, they did not seem to affect the scaling behaviour of the sodium salts. The tube was still cleaned three times, using sulphamic acid solution, over the course of the experimental campaign to avoid interference. The acid washing effectively removed all calcium carbonate scales.

Traces of calcium carbonate scaling found on the evaporator tube after the pre-experiments. The scales were subsequently dissolved and removed using a sulphamic acid solution.
The risk of calcium carbonate scaling occurring when tall oil brine is introduced is already known (e. g. as reported by Gullichsen and Fogelholm 1999), but whether or not it leads to actual problems probably depends on the situation at each mill. The two mills that were contacted in connection to this study did not reported any particular problems with calcium carbonate scaling caused by tall oil brine. It should be mentioned that the type of crystal species affects the scaling behaviour of calcium carbonate, and it has been shown that lignin can have a pronounced inhibiting effect on the calcium carbonate crystallisation (Wikander et al. 2006).
Discussion
The results are discussed in this section not only to summarise and generalise all the findings of this study but also to highlight their industrial significance.
Formation of scales
The results obtained for both black liquor and salt solutions are interesting in that they show a behaviour that differs to what has been reported previously, i. e. that dicarbonate scales much more than burkeite. Euhus et al. (2002) detected strong scaling of dicarbonate at around 70 % DS (burkeite started to crystallize at around 55 % DS, leading to the depletion of sulphate and a shift in ϕ to the dicarbonate region), but no such second nucleation event was observed in the present study. Gourdon et al. (2008) reported strong dicarbonate scaling with black liquor at 55 % DS but they used additional salt, giving
The reason for strong scaling in the dicarbonate region given by Frederick et al. (2004) is that finer crystals are produced there leading to agglomerate on the heat transfer surface, whereas burkeite gives rise to larger crystals that remain in the bulk phase. It was also shown by Karlsson et al. (2017) that larger crystals (>40 μm for salt solution) were necessary to avoid strong scaling. All black liquor scales in the current study had the same appearance; the SEM images show that they were loose aggregates with crystals sizes down to a mere few micrometres, but other components from the black liquor were also incorporated. This means that adhesion by weak intermolecular forces (in contrast to the strong ionic bonds in mineral-like scales) was the mechanism of scale formation for both dicarbonate and burkeite in this study.
The solubility is important for when crystallization starts, but it is not known if it also influences the scaling behaviour (i. e. crystallization kinetics). The additional sodium carbonate and sodium sulphate added in the experiments in this study influenced the solubility, which is also connected to the residual alkali (the concentration of sodium ions) due to the common ion effect. It is, however, unlikely that these changes are the reason for the deviation between the results here and previous studies.
The present study shows that scales can actually fall off the surface of the tube: this can be considered a new finding, as it does not seem to have been reported previously. In the case of black liquor, there was some kind of transition region where lower additions of salt triggered the initiation of scaling, but scales fell off the tube due to weak adhesion. When the salt content was increased even further, scaling was stronger and became permanent. Although a tempting explanation for this behaviour is the soft and loose appearance of the black liquor scales, the scales from salt solutions also fell off despite their being hard and mineral-like. Again, there must be an additional unknown factor that affects the crystallization process and alters the strength of the scales. It is also unknown why the black liquor scales in this study were clay-like whilst they were mineral-like in other experiments performed in the same pilot evaporator. Scales in industry, however, are often more clay-like (Lagerberg-Nilsson 2012).
When the metastable concentration limit is passed, crystallization is initiated due to primary nucleation. The liquor is then supersaturated, and the scaling is usually the fastest (Karlsson et al. 2013). This means that the scaling rate is not constant, which is especially true during batch evaporation as in the current study, and, in addition, if scales are also falling of the rate will fluctuate considerably. These are the reasons for why the scaling is presented as the accumulated thickness after the whole experiment in the result section: it was found more robust than a rate (e. g. mm/h) often used in previous studies. The experimental runtime under crystallizing conditions was 30–60 min without scaling and 70–100 min with scaling (more scales gave lower evaporation rate), but was also dependent on the solubility limit (i. e. at which DS scaling started). This means that the avarage scaling rate in this study for the experiments with high scaling are was in the order of 1 mm/h, which can be used for comparisions with other studies. Under industrial conditions, the startup procedure after washing implies operation at increasing DS with potentially no seed crystals and resembles the operation procedure in the current study. However, when operational steady state conditions have been resched, the scaling rate can be expected to be lower.
Inhibition of scaling
It is clear in the present study that tall oil brine and soap has the potential of inhibiting sodium salt scaling, although it seems as a minimum concentration is necessary in relation to the amount of salt crystalizing out. The inhibition is more efficient at the lowest ϕ, but there are still two experiments in the burkeite region without inhibition despite high amount of additive. The inhibiting effect also varies between different liquors, meaning that there are also other factors affecting the behaviour. As the mechanism of scale formation seems to be aggregation, the active component(s) in the tall oil brine or soap probably cause a weakening of the bonds between the crystals or prevent aggregation completely. It seems important that the active component(s) has the correct form as shown by the fact that the inhibition effect decreases when brine is added to the black liquor in advance: the active component(s) probably then dissolve or change form in another way. Taking all the results into consideration, the most likely active component appears to be one or several fatty acids or resin acids, and they should maybe not be dissolved if they are to have the ability to inhibit scaling. Sodium soaps are more soluble than calcium and magnesium soaps (which is a common problem when using hand soap in hard water) and, as tall oil brine generally contains less magnesium, calcium soaps are the most likely to precipitate. These results might seem, at first, to contradict Green and Hough (1992), who believed that the precipitates in brine increase scaling, but they discussed mainly calcium scaling (and fibres), which is actually in agreement with the present study.
An alternative active component that should be mentioned is calcium ions: calcium is abundant in tall oil brine and soap, but its solubility is complex as the ions interact with organic material. Shi et al. (2003) showed that calcium can inhibit the crystallization of burkeite, and Euhus et al. (2003) found that the addition of lime mud (calcium carbonate) reduced scaling. Further research is, however, needed to isolate the active component(s) and to gain an understanding of the mechanisms which, in turn, will provide a great opportunity for finding new, effective measures for controlling scaling.
Industrial significance
This study has shown that the amount of salt in the liquor (w) seems to be more important than the ratio between carbonate and sulphate (ϕ). In industry, it is common that ash from the recovery boiler, which consists mainly of the same salts but with a low fraction of sodium carbonate (
The amount of additive used in the experiments corresponds to the amount of brine added to the evaporator in Mill 1; depending on the salt content of the liquor, the amount of ash added and the crystallizing species, it might then be close to the limit required to achieve inhibition. The scaling in Effect 1C in this mill, operating at around 60 % DS, was investigated by Karlsson (2020): scaling generally disappeared when brine was added, but there were also periods when there was no inhibiting effect. There seems to be a potential for improving the situation in the mill by increasing the addition of brine and reducing the amount of salt. This is, nevertheless, not an easy task: the production of brine is dependent on the amount of soap, and the amount of salt in the liquor is controlled by other parts of the mill. Positive action that can be taken is to have a high degree of soap separation as possible (i. e. have a high production of tall oil) and operate the tall oil plant as smoothly as possible. Another, more unconventional idea, would be to add soap to Effect 1C. Adding ash above the solubility limit can also be considered, as mentioned previously.
The results also show that the way in which the brine is added is important if the inhibiting effect is to be retained: it should be added as close as possible to the scaling evaporator. This has also been confirmed in industry by personnel in several mills, interviewed by the authors of this study, who reported a clear decrease in scaling when the addition of brine was changed from the thin liquor to Effect 1. There is also a potential for reducing problems of calcium carbonate scaling when the brine is added to Effect 1: fewer effects are exposed to the high levels of calcium, and because Effect 1 is often less sensitive to scaling.
Conclusions
The method used in this work has shown to provide repeatable scaling after adding additional salt to the black liquor. It can therefore be used to evaluate scaling behaviour and how it is affected by the addition of tall oil brine.
The following conclusions can be drawn regarding scaling behaviour:
Increased total concentrations of sodium carbonate and sodium sulphate in black liquor increase scaling. Adding ash from the recovery boiler can therefore increase scaling if it is dissolved in the liquor.
Under the conditions investigated, scaling was more prone in the burkeite region than in the dicarbonate region: this is in direct contrast to previous reports.
The sodium carbonate sulphate and dicarbonate regions showed similar scaling behaviours.
The black liquor scales can be soft and clay-like aggregates of micrometre-sized crystals, with dried black liquor in between. Salt solution scales, on the other hand, are hard and mineral-like.
Scales can fall off during their formation, making the scaling process more unpredictable.
The scaling behaviour cannot be explained by only the ratio between and content of sodium carbonate and sodium sulphate: other unknown factors in the liquor composition have strong influence as well.
Tall oil brine can inhibit sodium salt scaling, but the inhibition effect is dependent on the amount of active component added, as well as the salt content and its ratio in the liquor. The liquors tested behaved differently, so there are probably also other chemical properties that affect inhibition.
Sodium sulphate is not the active component in the brine, since this increases scaling. The likely candidates are fatty acids and resin acids.
Soap shows similar inhibition effect as brine, which also indicates that some fatty acids or resin acids are the active components, but it might be less efficient considering the amounts of these acids added. The results contradict the general believe that soap increases scaling.
The form of the active component is important: the inhibition effect seems to decrease after the brine or soap is dissolved in hot black liquor overnight, indicating dissolution or degradation of active component. Under some conditions, scaling might even increase by addition of brine.
Tall oil brine can increase calcium carbonate scaling.
Funding source: Energimyndigheten
Funding source: Stora Enso
Funding statement: This work was co-funded by the Swedish Energy Agency, Stora Enso, Södra and Valmet, grant number P42332-1.
Acknowledgments
Thanks are due to Sue Mao at the University of Toronto and Södra Innovation for analysing the brine.
-
Conflict of interest: The authors have no conflict of interest regarding this submission.
Nomenclature
Abbreviations
- DS
-
Dry solids content
- DM
-
Dry mass
- HT
-
Heat transfer
Definitions
- Acid
-
Spent acid fraction of the tall oil brine, i. e. brine excluding cleaning residues
- Agglomerate
-
Structure consisting of smaller crystals cemented by crystalline bridges (according to the definition by Mersmann (2001), but there is inconsistency on how the term is defined in the literature)
- Aggregate
-
Structure consisting of smaller crystals bound together by lose intermolecular forces
- Brine
-
Tall oil brine, residual stream from the production of tall oil
- Dissolved
-
Repetitions of a previous experiment with an additive after dilution and dissolution overnight to dissolve all crystals
- Mix
-
The specific tall oil brine taken at Mill 1, incl. all cleaning residues
- Reused
-
A “dissolved” experiment, diluted and dissolved overnight again and fresh Mix added according to the normal method day three
- Salt
-
Sodium carbonate and sodium sulphate
- Sludge
-
Cleaning liquid, resulting from cleaning the centrifuge in the tall oil plant with hot water
- Soap
-
Tall oil soap separated from the black liquor
Symbols
- A
-
Area [
-
Inner area of the evaporator tube [
-
Logarithmic mean area [
-
Outer area of the evaporator tube [
-
Inner diameter of the evaporator tube [m]
-
Outer diameter of the evaporator tube [m]
-
Adjusted heat transfer coefficient of the black liquor falling film [
-
Heat transfer coefficient of the black liquor falling film [
-
Heat transfer coefficient of the black liquor falling film under clean conditions [
-
Heat transfer coefficient of the condensing steam [
-
Heat transfer coefficient of the black liquor falling film under scaled conditions [
-
Thermal conductivity of the scales [
-
Thermal conductivity of the tube wall [
-
Heat flux measured from condensate flow rate [
-
Local heat flux measured from thermocouples [
- t
-
Time [s]
-
Mixed cup temperature of the black liquor [°C]
-
Temperature of the saturated steam heating the evaporator [°C]
- U
-
Overall heat transfer coefficient [
- w
-
Mass fraction of sodium carbonate and sodium sulphate in the black liquor DM [%]
-
Temperature difference between the pairs of thermocouples in the tube wall [°C]
- δ
-
Apparent scale thickness [mm]
- μ
-
Viscosity [Pas]
- ϕ
-
Molar ratio of sodium carbonate in solution, Equation (1)
- φ
-
Molar ratio of sodium carbonate in crystals, equivalent to Equation (1)
References
Aro, T., Fatehi, P. (2017) Tall oil production from black liquor: Challenges and opportunities. Sep. Purif. Technol. 175:469–480.10.1016/j.seppur.2016.10.027Search in Google Scholar
Bialik, M.A., Theliander, H., Sedin, P., Verrill, C.L., DeMartini, N. (2008) Solubility and solid-phase composition in
DeMartini, N., Frederick, W.J. (2008) Review of sodium salt scaling in the liquid streams of the chemical recovery cycle of kraft pulp mills. In: TAPPI Engineering, Pulping and Environmental Conference. TAPPI Press, Portland, USA. pp. 1824–1833.Search in Google Scholar
DeMartini, N., Verrill, C.L. (2007) Minimizing soluble scales in black liquor evaporators: Application of metastable and solubility limit data for the Na-CO3-SO4 system. In: International Chemical Recovery Conference, Quebec City, Canada. pp. 479–483.Search in Google Scholar
Dogaris, I., Henriksson, G., Lindström, M. (2019) Tall oil solubility in industrial liquors, Energiforsk, Report 2019:582.Search in Google Scholar
Euhus, D.D., Rousseau, R.W., Frederick, W.J., Schmidl, W., Lien, S.J., Thorn, P.A., Smith, P.K. (2003) Eliminating sodium salt fouling in black liquor concentrators: Crystallization behavior and fouling in pilot evaporation trials. In: TAPPI Fall Technical Conference, Chicago, USA. pp. 1043–1057.Search in Google Scholar
Euhus, D.D., Shi, B., Frederick, W.J. (2002) Control of soluble scale in black liquor evaporators and concentrators: Part 1. Pilot plant studies. In: TAPPI Fall Technical Conference and Trade Fair, San Diego, USA, September 2002.Search in Google Scholar
Frederick, J.W., DeMartini, N. Black Liquor Evaporation. TAPPI Press, 2019.Search in Google Scholar
Frederick, W.J., Grace, T.M. A study of evaporator scaling: Calcium carbonate scales, Project 3234, Progress Report III. Institute of Paper Chemistry, Appleton, USA, 1977.Search in Google Scholar
Frederick, W.J., Shi, B., Euhus, D.D., Rousseau, R.W. (2004) Crystallization and control of sodium salt scales in black liquor concentrators. Tappi J. 3:7–13.Search in Google Scholar
Gourdon, M. Sodium Salt Scaling in Black Liquor Evaporators. Chalmers University of Technology, Gothenburg, Sweden, 2009.Search in Google Scholar
Gourdon, M., Vamling, L., Andersson, U., Olausson, L. (2010a) Crystallization in a pilot evaporator: Aqueous solutions of
Gourdon, M., Vamling, L., Andersson, U., Olausson, L. (2010b) Sodium salt scaling in black liquor evaporators - Pilot plant results and industrial significance. J. Pulp Pap. Sci. 36:98–106.Search in Google Scholar
Gourdon, M., Vamling, L., Olausson, L. (2007) Fouling layer growth in black liquor falling film evaporation. In: International Chemical Recovery Conference, Quebec City, Canada, May 29–June 1. TAPPI. pp. 473–477.Search in Google Scholar
Gourdon, M., Vamling, L., Strömblad, D., Olausson, L. (2008) Scale formation and growth when evaporating black liquor with high carbonate to sulphate ratio. Nord. Pulp Pap. Res. J. 23:231–239.10.3183/npprj-2008-23-02-p231-239Search in Google Scholar
Grace, T.M. (1976) Solubility limits in black liquors. AIChE Symp. Ser. 72:73–82.Search in Google Scholar
Grace, T.M. A survey of evaporator scaling in the alkaline pulp industry, IPST Project Reports. Institute of Paper Chemistry, Georgia Institute of Technology, Atlanta, USA, 1975.Search in Google Scholar
Green, G., Hough, R.P. Chemical Recovery in the Alkaline Pulping Processes. TAPPI Press, Atlanta, USA, 1992.Search in Google Scholar
Guimaraes, M., Tran, H., Cardoso, M. (2014) A novel method for determining the internal recycled dust load in kraft recovery boilers. Tappi J. 13:27–34.10.32964/TJ13.8.27Search in Google Scholar
Gullichsen, J., Fogelholm, C.-J. Chemical Pulping. Fapet Oy, Helsinki, Finland, 1999.Search in Google Scholar
Haag, J., Stigson, S. (2003) Lutlagring och lutföringens inverkan på inkrustering i indunstningsapparater och cisterner. Värmeforsk, Stockholm, Sweden.Search in Google Scholar
Johansson, M. Heat Transfer and Hydrodynamics in Falling Film Evaporation of Black Liquor. Chalmers University of Technology, Gothenburg, Sweden, 2008.Search in Google Scholar
Johansson, M., Vamling, L., Olausson, L. An implementation-oriented heat transfer model for black liquor evaporation. In: Proceedings of the International Chemical Recovery Conference 2007, Quebec City, Canada, May 29–June 1, 2007, 2007. pp. 155–158.Search in Google Scholar
Karlsson, E. The Formation and Dissolution of Sodium Salt Scales in Black Liquor Evaporators. Chalmers University of Technology, Gothenburg, Sweden, 2017.10.3183/npprj-2017-32-02-p299-308Search in Google Scholar
Karlsson, E. (2020) Evaluation of sodium salt scaling in black liquor evaporators using existing process data. Nord. Pulp Pap. Res. J., accepted for publication.10.1515/npprj-2020-0038Search in Google Scholar
Karlsson, E., Gourdon, M., Olausson, L., Vamling, L. (2013) Crystallization fouling of sodium salts in black liquor falling film evaporators – development of experimental method and first results. Nord. Pulp Pap. Res. J. 28:506.10.3183/npprj-2013-28-04-p506-513Search in Google Scholar
Karlsson, E., Gourdon, M., Vamling, L. (2017) The effect of bulk crystals on sodium salt scaling in black liquor evaporators. Nord. Pulp Pap. Res. J. 32:299.10.3183/npprj-2017-32-02-p299-308Search in Google Scholar
Lagerberg-Nilsson, E. Study of Black Liquor Evaporator Fouling at Södra Cell Värö. Chalmers University of Technology, Göteborg, 2012.Search in Google Scholar
Lamy, E.J. (1979) Concentrator fouling. In: CPPA Technical Section Pacific Coast and Western Branch Spring Conference, Harrison, USA, pp. 72–79.Search in Google Scholar
Lindgren, K., Kulander, I., Torngren, P., Bialik, M. (2018) Soap separation – A new option for removal of NPEs. In: Pulping Engineering and Environmental Recycling Sustainability Conference, PEERS 2018: Technical Solutions for Today and Beyond. Portland, USA. pp. 272–277.Search in Google Scholar
Mersmann, A. Crystallization Technology Handbook. Dekker, Inc., New York, USA, 2001.10.1201/9780203908280Search in Google Scholar
Numrich, R., Müller, J. (2010) Filmwise condensation of pure vapors. In: VDI-GVC (ed.), VDI Heat Atlas. Springer, Berlin.10.1007/978-3-540-77877-6_58Search in Google Scholar
Schmidl, W., Frederick, W.J. Current trends in evaporator fouling. In: International Chemical Recovery Conference, Tampa, USA. TAPPI Press, 1998. pp. 367–377.Search in Google Scholar
Shi, B., Frederick, W.J., Rousseau, R.W. (2003) Effects of calcium and other ionic impurities on the primary nucleation of burkeite. Ind. Eng. Chem. Res. 42:2861–2869.10.1021/ie020845eSearch in Google Scholar
Smith, J.B. Sodium Salt Scaling in Falling Film Black Liquor Evaporators. Georgia Institute of Technology, Atlanta, USA, 2000.Search in Google Scholar
Söderhjelm, L., Virkola, N.-E., Fagerström, P. Evaluation of black liquor fouling tendency by a laboratory method. In: International Chemical Recovery Conference. TAPPI Press, New Orleans, USA, 1985.Search in Google Scholar
Uloth, V.C., Wong, A. (1986) The effect of black liquor soap content on evaporator capacity: Part 1 – Na2CO3–Na2SO4 scaling. Pulp Pap. Can. 87:T267–T273.Search in Google Scholar
Verrill, C.L., Frederick, W.J. (2006) Evaporator fouling 101 - Sodium salt crystallization and soluble-scale fouling. In: TAPPI Engineering, Pulping, Environmental Conference, Philadelphia, USA.Search in Google Scholar
Verrill, C.L., Giehl, F.T., Ratnieks, E. Manipulation of crystallization to resolve severe concentrator scaling. In: International Chemical Recovery Conference, Charleston, USA, 6–10 June. TAPPI Press, 2004.Search in Google Scholar
Wikander, K., Kjellin, P., Holmberg, K. (2006) The effect of lignin on calcium carbonate scaling. Nord. Pulp Pap. Res. J. 21:286–289.10.3183/npprj-2006-21-03-p286-289Search in Google Scholar
Åkesjö, A. Hydrodynamics and Heat Transfer in Vertical Falling Films with Smooth and Modified Heat-Transfer Surfaces – An Experimental and Numerical Investigation. Chalmers University of Technology, Gothenburg, Sweden, 2018.Search in Google Scholar
© 2021 Karlsson and Åkesjö, published by De Gruyter
This work is licensed under the Creative Commons Attribution 4.0 International License.
Articles in the same Issue
- Frontmatter
- Chemical pulping
- Sodium salt scaling in black liquor evaporators and the effects of the addition of tall oil brine
- Bleaching
- Characterization of fibers after xylanase and modified laccase-glutamate system biobleaching of old newsprint pulp
- Mechanical pulping
- Low-consistency refining of CTMP targeting high strength and bulk: effect of filling pattern and trial scale
- Paper technology
- Model and optimal operational windows for hydrodynamic fiber fractionation
- Paper physics
- Full-field hygro-expansion characterization of single softwood and hardwood pulp fibers
- Paper chemistry
- Selective addition of C-PVAm to improve dry strength of TMP mixed tissue paper
- A transparent polyurethane based on nanosilica in reinforcing papers
- Packaging
- Laboratory measurement method for the mechanical interaction between a tactile sensor and a cartonboard package – presentation and evaluation
- Environmental impact
- Concentrated sulfuric acid production from non-condensable gases and its effect on alkali and sulfur balances in pulp mills
- Recycling
- Characterization of recycled waste papers treated with starch/organophosphorus-silane biocomposite flame retardant
- Nanotechnology
- Effects of lignin content and acid concentration on the preparation of lignin containing nanofibers from alkaline hydrogen peroxide mechanical pulp
- Rice straw paper sheets reinforced with bleached or unbleached nanofibers
- Chemical technology/modifications
- Preparation and characterization of cellulose bromo-isobutyl ester based on filter paper
- Preparation and thermostability of hydrophobic modified nanocrystalline cellulose
- Hardwood kraft pulp fibre oxidation using acidic hydrogen peroxide