The influence of shot noise on the performance of phase singularity-based refractometric sensors
-
Valeria Maslova
 ,
Valentyn S. Volkov
,
Valentyn S. Volkov


Abstract
Topological singularities of optical response functions – such as reflection amplitudes – enable elegant practical applications ranging from analog signal processing to novel molecular sensing approaches. A phase singularity-based refractometric sensor monitors the rapidly evolving argument of the optical field near the point of phase singularity, in contrast to the reflection zero in traditional surface plasmon polariton sensors. This raises a natural question: What happens with the sensitivity and resolution of such a sensor when it operates close to a zero of the response function, where the detected signal may be greatly influenced by various noise sources? In this paper, we systematically study the effect of the shot noise on the performance of a generic phase singularity-based refractometric sensor. We develop a theoretical model of a spectroscopic ellipsometry-based system operating near a phase singularity and couple the macroscopic optical picture of the detection with a quantum shot noise model. Within the developed model, we illustrate how the shot noise of the detector comes into play and study its effect on the sensitivity and resolution of the refractometric sensor. Our results suggest that such an ellipsometry-based phase singularity sensor remains stable even in the presence of shot noise near the point of zero reflection.
1 Introduction
The ability to detect trace amounts of various organic and inorganic substances, viruses, and microscopic living organisms is crucial for effective health monitoring [1], [2]. Nanophotonics, the study of light-matter interaction at the nanometer scale, offers a range of techniques for such detection. These include surface-enhanced Raman scattering [3], [4], [5], surface plasmon resonance [6], [7], [8], [9], [10], [11], [12], dielectric nanoparticle resonance [13], [14], [15], high-Q lasing structures [16], and metasurface-assisted hyperspectral infrared imaging [17], [18], [19], [20]. Many of these methods are refractometric, measuring changes in the refractive index of the surrounding analyte medium induced by the substance, thereby allowing the evaluation of the substance’s concentration. One should separately mention various approaches and challenges in chiral sensing, where changes in circular dichroism are monitored in order to evaluate the imbalance between right-handed and left-handed enantiomers of a chiral racemic [21], [22], [23], [24], [25], [26], [27].
Novel generalizations of the existing approaches also appear, such as nonlinear plasmonic sensing [28] or quantum sensing [10], [29]. Recently, more exotic approaches based on exceptional points of non-Hermitian systems [30], [31], [32], [33], [34], [35] and phase singularities of optical fields have been intensively explored [36], [37]. The latter relies on a linear optical system with a phase singularity of its response function, such as reflection – the point in the parameter space of wavelength and incidence angle with zero amplitude and undetermined phase [38], [39], [40], [41], [42], [43]. The argument of the signal varies rapidly in the vicinity of this point, thus allowing enhanced sensitivity [44], [45], [46], [47], [48]. The realization of phase singularities is feasible in simple planar structures [46], and even at a single anisotropic interface [48], rendering the idea suitable for widespread use.
Despite the intuitive appeal of the idea, the use of a phase singularity comes at the cost of low intensity of the signal close to the point of zero reflection. The optical signal is subject to noises of various origins, including the thermal noise of the background [49], the fluctuating density of the analyte medium [50], or the shot noise due to the discrete nature of photons [10], [50], [51], [52]. Correspondingly, these noises may introduce significant uncertainties in the argument of the detected signal at the point of zero response, thus completely diminishing the sensitivity, which is a common challenge of the exceptional points-based sensors [53], [54], [55], [56]. As a result, it poses a fundamental question of the robustness of a phase singularity-based sensor against such noises.
In this paper, we address the issue of shot noise and its impact on the performance of a generic phase singularity-based refractometric sensor. To this end, we develop a universal theoretical model of the phase singularity-based sensor that incorporates the shot noise arising at the detection stage, and takes into account the experimental details of commercial detection schemes. Using this model, we study the effect of finite exposure and the choice of the initial calibration curve on the sensitivity and resolution of the detector. Our results indicate that this type of optical sensing is robust against shot noises. Furthermore, our model has predictive capabilities for finding optimal phase singularity-based sensor parameters. Therefore, our findings provide an advanced tool for the development of current and next-generation biosensors.
2 Results
2.1 Basic principles of phase singularity-based sensors
We begin by outlining of the basic principles underlying the topological phase singularity-based sensing. Essentially, the refractometric sensor is represented by a linear reflecting structure covered with an optically thick water solution of the sensing medium (analyte), Figure 1a. A change in the concentration of the sensing medium induces a variation of the analyte refractive index, which in turn causes a change of the reflection intensity that can be detected. The idea of the ellipsometry-assisted sensing, in contrast to the common surface plasmon–polariton schemes, is to monitor the changes in the ratio of reflected s- and p-polarized waves ρ = r p /r s , which can be routinely assessed with spectroscopic ellipsometry [41], [45], [46].
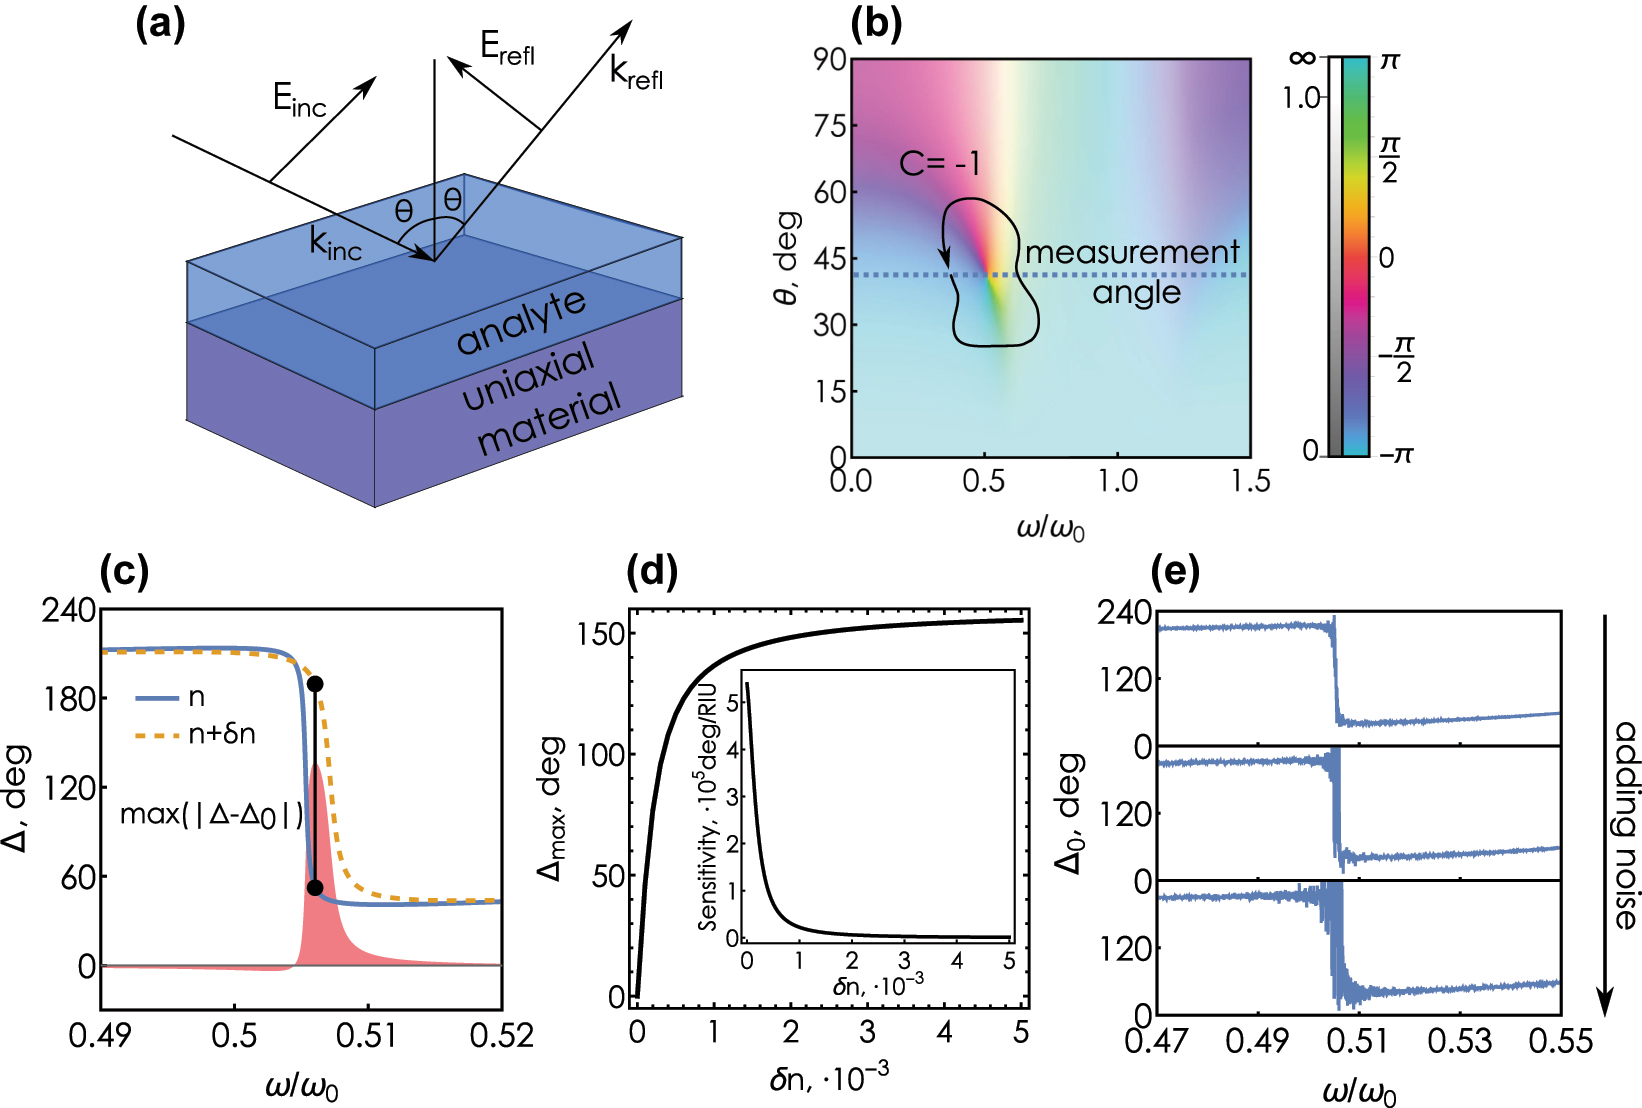
Basic picture of of phase singularity sensing. (a) Sketch of the refractometric sensor under study: a uniaxial absorbing material covered with an optically thick layer of analyte. The system is illuminated with a combination of s- and p-polarized waves; the amplitude and the phase of the reflected wave is read out using spectroscopic ellipsometry. (b) Plot of the complex-valued ellipsometric response function ρ = r p /r s for the system in (a) calculated for water reference solution, n = 1.33, and the uniaxial material is characterized by ɛ ∞ = 1, f = 0.5, γ = 0.1, ɛ ‖ = 1.5 + 0.1i. The color saturation encodes the magnitude of the ellipsometric response, the hue encodes the argument (see the colorbar on the right). (c) Frequency dependence of the ellipsometric phase of the reference solution (n = 1.33), and the analyte refractive index n = 1.33 + δn, δn = 0.001, calculated at an incidence angle slightly away from the phase singularity θ = θ PS + δθ, δθ = −0.05°. The shaded area shows the difference Δ − Δ0; the black line corresponds to the maximal difference of |Δ − Δ0|. (d) Maximum shift of the ellipsometric phase Δmax as a function of the analyte refractive index shift δn. Inset: sensitivity S = ∂Δmax/∂δn as a function of δn. (e) The influence of noise on the optical phase near the PS according to the model, Eq. (7).
In our study we examine a system consisting of an anisotropic absorbing substrate and an optically thick water solution of the sensing medium with refractive index n, placed on it, Figure 1a. Optical anisotropy of the substrate will play the crucial role in the behavior of the ellipsometric response ρ. As a model of the anisotropic substrate we consider a uniaxial absorbing crystal with the optical axis perpendicular to the interface. The in-plane permittivity ɛ xx = ɛ yy ≡ɛ ⊥ is described by the Lorentz model:
where ɛ ∞ is the high-frequency permittivity, f is the oscillator strength of the resonant transition of the medium, ω 0 is its resonant frequency, and γ describes its non-radiative decay rate. The permittivity along the optical axis is a complex-valued constant, ɛ zz ≡ɛ ‖ = const.
The substrate–analyte interface is illuminated by a linearly polarized plane wave incident at an angle θ, Figure 1a. Since in real experiments the thickness of the analyte substantially exceeds the coherence length of optical radiation, reflection from the analyte–substrate interface can be considered as reflection at the interface of two semi-infinite media and described by Fresnel formulas for s- and p-polarized wave:
where
As shown previously, a semi-infinite absorbing uniaxial crystal may exhibit points of zero reflection for p-polarized excitation [43], [57] (see Supplementary Material, Figure S1). Owing to the point of zero reflection, the ellipsometric response ρ exhibits a phase singularity at a point {ω PS , θ PS } of the frequency-incidence angle space {ω, θ}, where the ellipsometric phase Δ = arg ρ becomes undetermined, Figure 1b. Furthermore, the non-zero roundtrip of the argument around the singularity, Figure 1b, gives it a conserved integer winding number:
where the integration contour encloses the singularity. This winding number renders the singularity topologically protected against small perturbations of the system [46]. By the same token, the very presence of this topological point guarantees that the response function of interest (such as the ellipsometric phase ρ) does necessarily reach either zero (r p = 0) or a pole (r s = 0) at some point of the parameter space inside the loop encircling the singularity.
At a fixed incidence angle close to θ PS the argument of complex-valued ρ demonstrates a rapid variation in a narrow frequency range in the vicinity of the singularity. This implies that a weak change of the optical environment (e.g., the analyte index) may lead to a substantial change of the response function argument, Figure 1c. The core idea of the topological singularity-based sensor is thus to take advantage of this rapid variation of the ellipsometric phase near the point of zero reflection of p-polarized wave.
In order to detect a change of the analyte refractive index, one (i) measures the ellipsometric phase Δ(ω) near the phase jump, and (ii) calculates the difference between the measured values and the initial calibration curve Δ0(ω) corresponding to the analyte refractive index, Figure 1c. Next, we create the correspondence between the known refractive index shift of the analyte δn and the maximum absolute deviation of the ellipsometric phase max(|Δ(ω) − Δ0(ω)|) over a range of frequencies:
where the range ω min to ω max is determined by the experimental limitations. For this study we chose ω min = 0.49 ω 0 and ω max = 0.52 ω 0 (ω PS ≈ 0.505 ω 0). This correspondence allows us to determine δn given an experimentally measured value of Δmax, as Figure 1d demonstrates. Tangent of the curve locally determines the sensitivity S of the system to the changes of the analyte index:
One could naively incorporate noises in this model by adding a randomly distributed noise term to the real and imaginary parts of s- and p-polarized reflection amplitudes:
where δ i is a randomly distributed noise-induced quantity added to the real and imaginary parts of the corresponding amplitude. Close to zero of r p the numerator of (6) behaves as δ 1 + iδ 2; as long as r s does not approach zero, the denominator behaves as r s in the limit of weak noise. Thus, the whole expression can be approximated as:
As expected, the argument of the remaining noise term produces a highly distorted magnitude of Δ close to the phase singularity, Figure 1e. In reality, however, incorporating noise sources into the ellipsometric scheme is a more non-trivial problem compared to the naive approach. In the following sections, we describe in more details the process of acquisition of phase information in ellipsometry and develop a theoretical model that accurately accounts for the presence of shot noise in a realistic measurement.
2.2 Phase measurement in ellipsometry
To offer a more accurate picture of the noise mechanism arising in a sensing experiment, we first briefly discuss the key steps of ellipsometric spectroscopy, schematically illustrated in Figure 2a. The end goal of ellipsometry is obtaining ρ = r p /r s ≡ tan Ψ exp(iΔ), where.
is the parameterization of the response function magnitude, and
is the ellipsometric phase. These quantities are assessed in the following fashion. An unpolarized light from a lamp source passes through a monochromator and next through a polarizer set at an angle θ P , thus becoming linearly polarized and acquiring both s and p components with respect to the substrate. In the following calculations we set θ P to π/4, such that transmitted light has equally weighted s and p-polarized components. After reflection from the substrate, the wave passes through an analyzer with a rotating axis characterized by the angle θ A . Power of the signal reaching the detector reads:
where P 0 is the power of the lamp source, and α and β are expressed via the desired ellipsometric parameters:

Ellipsometry basics. (a) The principal scheme of spectroscopic ellipsometry measurement process. An unpolarized quasi-monochromatic light from the source passes through a polarizer, reflects off of the interrogated substrate, passes through an analyzer and gets recorded at the detector. (b) Recorded power P D at the phase singularity frequency ω = ω PS for different incidence angles: θ = θ PS and θ = θ PS + δθ, where δθ is set to be δθ = −2°. (c) The ellipsometric phase behavior near ω = ω PS for the same incidence angles as in (b).
The detector records the signal for different analyzer angles. Figure 2b shows an example of detected signal as a function of the analyzer angle. Applying the Fourier transform to this data allows one to determine the coefficients α and β in Eq. (6), which in turns allows us to calculate the desired ellipsometric magnitude and phase:
The choice of the incidence angle profoundly affects the initial calibration curve Δ0(ω). As can be seen from Figure 2b and c, a deviation of the incidence angle from the exact phase singularity θ PS only slightly alters the power P D , but that leads to a noticeable change of the calibration curve. Indeed, the signal power at each analyzer position characterizes the amplitude of the complex response function, which is a continuous value in the vicinity of the singularity and changes weakly with a small change in parameters such as the incidence angle. On the contrary, the phase is determined by a set of measurements for all analyzer positions and its change becomes noticeable near the topological point, upon approaching which the phase change becomes very rapid. As we will see in the following, the choice of the calibration curve profoundly affects the trade-off between the sensitivity and the resolution of the ellipsometry-assisted refractometric sensor.
2.3 Noise model
Next we develop an analytical model of noise that can be adopted for modeling the refractometric sensing process, illustrated in Figure 3a. Assume the detector is subject to an incoming photon stream reflected from the substrate with constant power P D given by Eq. (10). Since photoelectron excitation is a probabilistic process, the number of recorded counts varies. This variation of the detected photon counts is the manifestation of shot noise [51]. The process of counting photoelectrons is described by the probability density p(n, τ) that describes the probability of recording n photoelectrons during the measurement time interval τ.

Shot noise model. (a) Probabilistic registration of photoelectrons: incoming photon flux in each time interval δτ can excite a photoelectron with probability p 0, which results in n detected photoelectrons during the entire measurement interval. (b) Probability density of recording n photoelectrons over a finite period time τ having a Poisson distribution for different expected values ⟨N 1⟩ < ⟨N 2⟩ < ⟨N 3⟩. (c) Signal recorded by the detector near the singularity as a function of the analyzer angle θ A in the presence of shot noise (blue dots). Red curve in the inset shows the signal behavior of the ideal noise-free model.
To determine the probability density p(n, τ), following [58] we divide the measurement interval τ into M infinitesimal intervals δt = τ/M, such that in each interval it is possible to register at most one photoelectron with elementary probability p 0 = ηP D δt/(ℏω) where ℏω is the photon energy and η is the detector quantum efficiency. Probability of recording n photoelectrons during the whole measurement interval τ is determined by the statistics of M independent events and is described by the binomial distribution:
In the limit δt → 0, M → ∞ this approaches the Poisson distribution (Figure 3b):
where the expected number ⟨N⟩ of registered photon counts reads:
The probabilistic distribution of detected photoelectrons leads to the variation of the signal recorded by the detector as a function of the analyzer angle, Figure 3c. The relative uncertainty of these variations is particularly noticeable around θ
A
= πn, where the analyzer passes only (vanishingly small due to phase singularity) p-polarized component of the reflected field. This large relative uncertainty
This noise in the number of detected photoelectrons leads to uncertainties in determining the Fourier coefficients α and β, Eq. (11), which in turn determine the magnitude tan Ψ and the sought for ellipsometric phase Δ. However, as we will see in the following, it is performing the ensemble of measurements for different analyzer angles that enables stable evaluation of the analyte index despite the seeming issue of absent photon flux at the phase singularity.
2.4 The effect of noise in the experiment simulation
To render the combined numerical-theoretical simulations more realistic and to grasp the scale of the physical parameters where the influence of noise becomes significant, we will set the numerical values of the quantities characterizing the actual experiment. A lamp with a monochromator is used as a quasi-monochromatic light source. In simulations, we consider the typical range of spectral power densities P ranging from 1 μW/nm to 100 μW/nm at the wavelength of the phase singularity λ PS = 600 nm. The monochromator filters out a narrow wavelength band from the entire spectrum of bandwidth Δλ = 5 nm centered at a given wavelength.
Now we are in a position to analyze the influence of the spectral power and the incidence angle on the performance of the ellipsometry-based refractometric sensing close to the phase singularity point. To that end we run a set of numerical “experiments” characterized by different spectral powers and incidence angles and fixed measurement interval τ = 0.2 s, Figure 4. For each combination of incident power and incidence angle we run the simulation repeatedly many times (in our calculations, the number of repetitions is 500). For each δn, we obtain a set of values of the maximum ellipsometric phase shift Δmax, for which we can calculate the mean ⟨Δmax⟩ and standard deviation σ
Δ (see Supplementary Material, Figures S2 and S3). Notably, the mean measured value ⟨Δmax⟩ deviates substantially from the etalon phase shift

The effect of shot noise on refractometric sensing. Behavior of noisy sensitivity with increasing spectral power P (from left to right) and increasing deviation |δθ| of the incidence angle θ = θ PS + δθ from the angle of phase singularity θ PS (from top to bottom). Each dot represents the result of a single simulated experiment. The gray area represents the corridor of values into which each point falls with a probability of 95 %. The red curve shows the ideal phase shift Δmax obtained in the noise-free model. Inset: example of distribution of Δmax for δn = 4 ⋅ 10−4 (vertical gray line) obtained from a numerical simulation of the experiment for P = 1 μW/nm and |δθ| = 0.05° in comparison with the normal distribution (red curve).
As we find from our numerical simulations, the probability distribution of Δmax for each δn follows the normal distribution with a reasonable accuracy (see Supplementary Material, Figures S4–S9). The mean values and standard deviations can be approximated by smooth curves that are functions of the analyte medium refractive index shift δn and characterize the impact of shot noise on the measurement. This approximation allows us to visualize for each δn an interval
Interestingly, the authors of the pioneering work on phase singularity-assisted sensing [36] also detuned the incidence angle from the zero reflection point to ensure sufficient light intensity reaching the detector at the resonant minimum. However, the effect of angular detuning was not analyzed in details.
This observation allows one to use a phase singularity-based sensor even with a low-power optical source. However, deviating the incidence angle away from the singularity to achieve the required accuracy comes at the cost of reduced sensitivity. Figure 5b shows the behavior of the sensitivity S (see Eq. (4)) on δn for a few different values of the incidence angles close to the phase singularity. Deviating the incidence angle away from θ PS results in a smoother sensitivity behavior. At the same time, in the region of weak variation of the analyte refractive index (δn < 3 ⋅ 10−4), the sensitivity drops from 2 ⋅ 105 deg/RIU to 0.5 ⋅ 105 deg/RIU upon a slight 0.5° deviation of the incidence angle.

The trade-off of sensitivity and resolution in the ellipsometry-based sensor. (a) Incidence angles θ = θ PS + δθ characterized by different deviations |δθ| from the angle θ PS and defining calibration curves. The color saturation encodes the magnitude of the ellipsometric response, the hue encodes the argument. (b) The sensitivity of the sensor as a function of δn for deviation angles corresponding to the incidence angles shown in (a). (c) Graphic definition of the noise-induced resolution res(δn)shot. (d) The resolution of δn for the incidence angles shown in (a) for a source spectral power P = 1 μW/nm. (e) Same as (d) for P = 10 μW/nm (f) (e) Same as (d) for P = 100 μW/nm.
Next, we study the effect of the incidence angle and the source power on the resolution of the refractometric sensor. We define the shot noise-limited resolution res(δn)shot for a given measured value ⟨Δmax⟩ as the width of the region bounded by the curves ⟨Δmax⟩± σ
Δ, Figure 5c. Figure 5d–f show the behavior of the noise-limited resolution at different incidence angles and source spectral powers. Expectedly, increasing the source power improves the noise-limited resolution for any incidence angle. Increasing the deviation angle for a fixed power improves the resolution from
As a final step of our analysis, we note that sensitivity imposes another potential constraint on the resolution of our system even in the absence of shot noises. As a rule of thumb, an ellipsometer can reliably detect an ellipsometric phase shift Δmax ≳ 1° [46]. This imposes another constraint on the resolution that can be easily estimated as
with S being the sensitivity of the setup, Eq. (5). As shown above, while increasing |δθ| improves the noise-limited resolution res(δn)shot, it at the same time reduces the sensitivity. This causes the sensitivity, not the shot noise, to be the decisive factor determining the resolution at relatively large |δθ|. For our model system an increase of |δθ| up to 0.5° significantly reduces the sensitivity and becomes the decisive resolution factor at source powers exceeding P = 10 μW/nm (see Supplementary Material, Figure S10). Nevertheless, even then the sensitivity is sufficient to detect a refractive index variation of
Figure 6 illustrates the resulting trade-off between the noise-limited and the sensitivity-limited resolution of our system as a function of the incidence angle for various source powers and analyte index shift. The pair of noise- and sensitivity-limited curves combined exhibit the characteristic “valley” behavior: detuning the incidence angle from the phase singularity improves the noise-limited resolution, until it equalizes with the sensitivity-limited one at the point of optimal resolution. Indeed, as can be observed, a further deviation from the topological point leads to a degradation in resolution due to a decrease in sensor sensitivity. Thus, at the angle at which both contributions become equal, the system exhibits the best resolution and reaches the optimal regime.

The trade-off of noise- and sensitivity-limited resolutions in the ellipsometry-based sensor. (a) Behavior of the sensor’s noise-limited (solid lines) and sensitivity-limited (dashed line) resolution with the analyte refractive index shift δn = 0.0002 for different source powers. The asterisks indicate the optimal incidence angle at which the sensor exhibits the optimal resolution. (b) Same as (a) for δn = 0.0005. (c) Same as (a) for δn = 0.001.
3 Conclusions
To conclude, we have developed an accurate model of an ellipsometry-based refractometric sensor operating close to a topological phase singularity at the point of zero reflection. The developed model accounts for the shot noise caused by the discrete nature of the detected photon stream. Our results suggest that such an ellipsometry-based refractometric sensor remains robust even in the presence of shot noise near the point of zero reflection. This approach allows one to use a phase singularity-based refractometric sensor even at relatively low source powers, making the system robust against noise and offering a route toward their implementation in wearable compact devices.
The results reveal that the incidence angle provides a convenient control knob to manipulate the sensitivity and resolution of the sensing process. However, it is crucial to note that deviation from the phase singularity reduces the sensitivity of the system, which in turn inhibits the resolution. This introduces a complex balance between the sensitivity and the resolution of the ellipsometric sensor. When considering an actual system with specified characteristics, the developed model will allow choosing the optimal value of the incidence angle and determining the minimum possible recorded value of refractive index change with the desired accuracy.
Funding source: Basis Foundation
Award Identifier / Grant number: 22-1-3-2-1
Award Identifier / Grant number: 24-1-5-136-1
Funding source: Russian Science Foundation
Award Identifier / Grant number: 23-72-10005
Acknowledgment
We would like to thank Valentin Solovei for his assistance with graphical visualization.
-
Research funding: This work was supported by the Ministry of Science and Higher Education of the Russian Federation (FSMG-2024-0014). DGB and VM acknowledge support from Russian Science Foundation (grant No. 23-72-10005). DGB acknowledges support from BASIS Foundation (grant No. 22-1-3-2-1). VM acknowledges support from BASIS Foundation (grant No. 24-1-5-136-1). ESA acknowledges the support of the Foundation for the Advancement of Theoretical Physics and Mathematics BASIS.
-
Author contributions: DGB conceived the idea of the study. DGB, AVA, and VSV supervised the project. VM developed the theoretical framework and performed the analysis. GE and ESA provided theoretical support. VM and DGB wrote the manuscript with the contributions of all authors. All authors have accepted responsibility for the entire content of this manuscript and consented to its submission to the journal, reviewed all the results and approved the final version of the manuscript.
-
Conflict of interest: Authors state no conflict of interest.
-
Research ethics: The conducted research is not related to either human or animals use.
-
Data availability: The datasets generated and/or analyzed during the current study are available from the corresponding author upon reasonable request.
References
[1] S. M. Borisov and O. S. Wolfbeis, “Optical biosensors,” Chem. Rev., vol. 108, no. 2, pp. 423–461, 2008, https://doi.org/10.1021/cr068105t.Suche in Google Scholar PubMed
[2] A. P. Turner, “Biosensors: Sense and sensibility,” Chem. Soc. Rev., vol. 42, no. 8, pp. 3184–3196, 2013, https://doi.org/10.1039/c3cs35528d.Suche in Google Scholar PubMed
[3] B. Sharma, R. R. Frontiera, A.-I. Henry, E. Ringe, and R. P. Van Duyne, “Sers: Materials, applications, and the future,” Mater. Today, vol. 15, nos. 1-2, pp. 16–25, 2012, https://doi.org/10.1016/s1369-7021(12)70017-2.Suche in Google Scholar
[4] R. Pilot, R. Signorini, C. Durante, L. Orian, M. Bhamidipati, and L. Fabris, “A review on surface-enhanced Raman scattering,” Biosensors, vol. 9, no. 2, p. 57, 2019, https://doi.org/10.3390/bios9020057.Suche in Google Scholar PubMed PubMed Central
[5] J. Langer, et al.., “Present and future of surface-enhanced Raman scattering,” ACS Nano, vol. 14, no. 1, pp. 28–117, 2019, https://doi.org/10.1021/acsnano.9b04224.Suche in Google Scholar PubMed PubMed Central
[6] J. N. Anker, W. P. Hall, O. Lyandres, N. C. Shah, J. Zhao, and R. P. Van Duyne, “Biosensing with plasmonic nanosensors,” Nat. Mater., vol. 7, no. 6, pp. 442–453, 2008, https://doi.org/10.1038/nmat2162.Suche in Google Scholar PubMed
[7] A. V. Kabashin, et al.., “Plasmonic nanorod metamaterials for biosensing,” Nat. Mater., vol. 8, no. 11, pp. 867–871, 2009, https://doi.org/10.1038/nmat2546.Suche in Google Scholar PubMed
[8] K. M. Mayer and J. H. Hafner, “Localized surface plasmon resonance sensors,” Chem. Rev., vol. 111, no. 6, pp. 3828–3857, 2011, https://doi.org/10.1021/cr100313v.Suche in Google Scholar PubMed
[9] W. Zhang and O. J. Martin, “A universal law for plasmon resonance shift in biosensing,” ACS Photonics, vol. 2, no. 1, pp. 144–150, 2015, https://doi.org/10.1021/ph500355d.Suche in Google Scholar
[10] C. Lee, F. Dieleman, J. Lee, C. Rockstuhl, S. A. Maier, and M. Tame, “Quantum plasmonic sensing: beyond the shot-noise and diffraction limit,” ACS Photonics, vol. 3, no. 6, pp. 992–999, 2016, https://doi.org/10.1021/acsphotonics.6b00082.Suche in Google Scholar
[11] K. V. Sreekanth, et al.., “Extreme sensitivity biosensing platform based on hyperbolic metamaterials,” Nat. Mater., vol. 15, no. 6, pp. 621–627, 2016, https://doi.org/10.1038/nmat4609.Suche in Google Scholar PubMed PubMed Central
[12] H.-H. Jeong, et al.., “Dispersion and shape engineered plasmonic nanosensors,” Nat. Commun., vol. 7, no. 1, p. 11331, 2016, https://doi.org/10.1038/ncomms11331.Suche in Google Scholar PubMed PubMed Central
[13] N. Bontempi, et al.., “Highly sensitive biosensors based on all-dielectric nanoresonators,” Nanoscale, vol. 9, no. 15, pp. 4972–4980, 2017, https://doi.org/10.1039/c6nr07904k.Suche in Google Scholar PubMed
[14] N. Bosio, H. §ípová-Jungová, N. O. Länk, T. J. Antosiewicz, R. Verre, and M. Käll, “Plasmonic versus all-dielectric nanoantennas for refractometric sensing: A direct comparison,” ACS Photonics, vol. 6, no. 6, pp. 1556–1564, 2019, https://doi.org/10.1021/acsphotonics.9b00434.Suche in Google Scholar
[15] A. Krasnok, M. Caldarola, N. Bonod, and A. Alú, “Spectroscopy and biosensing with optically resonant dielectric nanostructures,” Adv. Opt. Mater., vol. 6, no. 5, p. 1701094, 2018, https://doi.org/10.1002/adom.201701094.Suche in Google Scholar
[16] L. He, S. K. Özdemir, J. Zhu, W. Kim, and L. Yang, “Detecting single viruses and nanoparticles using whispering gallery microlasers,” Nat. Nanotechnol., vol. 6, no. 7, pp. 428–432, 2011, https://doi.org/10.1038/nnano.2011.99.Suche in Google Scholar PubMed
[17] A. Tittl, et al.., “Imaging-based molecular barcoding with pixelated dielectric metasurfaces,” Science, vol. 360, no. 6393, pp. 1105–1109, 2018, https://doi.org/10.1126/science.aas9768.Suche in Google Scholar PubMed
[18] A. Leitis, et al.., “Angle-multiplexed all-dielectric metasurfaces for broadband molecular fingerprint retrieval,” Sci. Adv., vol. 5, no. 5, p. eaaw2871, 2019, https://doi.org/10.1126/sciadv.aaw2871.Suche in Google Scholar PubMed PubMed Central
[19] F. Yesilkoy, et al.., “Ultrasensitive hyperspectral imaging and biodetection enabled by dielectric metasurfaces,” Nat. Photonics, vol. 13, no. 6, pp. 390–396, 2019, https://doi.org/10.1038/s41566-019-0394-6.Suche in Google Scholar
[20] M. L. Tseng, Y. Jahani, A. Leitis, and H. Altug, “Dielectric metasurfaces enabling advanced optical biosensors,” ACS Photonics, vol. 8, no. 1, pp. 47–60, 2021, https://doi.org/10.1021/acsphotonics.0c01030.Suche in Google Scholar
[21] Y. Tang and A. E. Cohen, “Enhanced enantioselectivity in excitation of chiral molecules by superchiral light,” Science, vol. 332, no. 6027, pp. 333–336, 2011, https://doi.org/10.1126/science.1202817.Suche in Google Scholar PubMed
[22] E. Hendry, et al.., “Ultrasensitive detection and characterization of biomolecules using superchiral fields,” Nat. Nanotechnol., vol. 5, no. 11, pp. 783–787, 2010, https://doi.org/10.1038/nnano.2010.209.Suche in Google Scholar PubMed
[23] A. O. Govorov, Z. Fan, P. Hernandez, J. M. Slocik, and R. R. Naik, “Theory of circular dichroism of nanomaterials comprising chiral molecules and nanocrystals: Plasmon enhancement, dipole interactions, and dielectric effects,” Nano Lett., vol. 10, no. 4, pp. 1374–1382, 2010, https://doi.org/10.1021/nl100010v.Suche in Google Scholar PubMed
[24] F. Graf, J. Feis, X. Garcia-Santiago, M. Wegener, C. Rockstuhl, and I. Fernandez-Corbaton, “Achiral, helicity preserving, and resonant structures for enhanced sensing of chiral molecules,” ACS Photonics, vol. 6, no. 2, pp. 482–491, 2019, https://doi.org/10.1021/acsphotonics.8b01454.Suche in Google Scholar
[25] R. M. Kim, et al.., “Enantioselective sensing by collective circular dichroism,” Nature, vol. 612, no. 7940, pp. 470–476, 2022, https://doi.org/10.1038/s41586-022-05353-1.Suche in Google Scholar PubMed
[26] L. A. Warning, A. R. Miandashti, L. A. McCarthy, Q. Zhang, C. F. Landes, and S. Link, “Nanophotonic approaches for chirality sensing,” ACS Nano, vol. 15, no. 10, pp. 15 538–15 566, 2021, https://doi.org/10.1021/acsnano.1c04992.Suche in Google Scholar PubMed
[27] S. Both, M. Sch”aferling, F. Sterl, E. A. Muljarov, H. Giessen, and T. Weiss, “Nanophotonic chiral sensing: how does it actually work?,” ACS Nano, vol. 16, no. 2, pp. 2822–2832, 2022, https://doi.org/10.1021/acsnano.1c09796.Suche in Google Scholar PubMed
[28] M. Mesch, B. Metzger, M. Hentschel, and H. Giessen, “Nonlinear plasmonic sensing,” Nano Lett., vol. 16, no. 5, pp. 3155–3159, 2016, https://doi.org/10.1021/acs.nanolett.6b00478.Suche in Google Scholar PubMed
[29] W. Fan, B. J. Lawrie, and R. C. Pooser, “Quantum plasmonic sensing,” Phys. Rev. A, vol. 92, no. 5, p. 053812, 2015, https://doi.org/10.1103/physreva.92.053812.Suche in Google Scholar
[30] J. Wiersig, “Enhancing the sensitivity of frequency and energy splitting detection by using exceptional points: Application to microcavity sensors for single-particle detection,” Phys. Rev. Lett., vol. 112, no. 20, p. 203901, 2014, https://doi.org/10.1103/physrevlett.112.203901.Suche in Google Scholar
[31] J. Wiersig, “Sensors operating at exceptional points: General theory,” Phys. Rev. A, vol. 93, no. 3, p. 033809, 2016, https://doi.org/10.1103/physreva.93.033809.Suche in Google Scholar
[32] W. Chen, Ş. Kaya Özdemir, G. Zhao, J. Wiersig, and L. Yang, “Exceptional points enhance sensing in an optical microcavity,” Nature, vol. 548, no. 7666, pp. 192–195, 2017.10.1038/nature23281Suche in Google Scholar PubMed
[33] H. Hodaei, et al.., “Enhanced sensitivity at higher-order exceptional points,” Nature, vol. 548, no. 7666, pp. 187–191, 2017, https://doi.org/10.1038/nature23280.Suche in Google Scholar PubMed
[34] H. Jing, H. Lü, S. Özdemir, T. Carmon, and F. Nori, “Nanoparticle sensing with a spinning resonator,” Optica, vol. 5, no. 11, pp. 1424–1430, 2018, https://doi.org/10.1364/optica.5.001424.Suche in Google Scholar
[35] J. Xu, et al.., “Single-cavity loss-enabled nanometrology,” Nat. Nanotechnol., vol. 19, p. 1472, 2024. https://doi.org/10.1038/s41565-024-01729-8.Suche in Google Scholar PubMed
[36] V. G. Kravets, et al.., “Singular phase nano-optics in plasmonic metamaterials for label-free single-molecule detection,” Nat. Mater., vol. 12, no. 4, pp. 304–309, 2013, https://doi.org/10.1038/nmat3537.Suche in Google Scholar PubMed
[37] L. Malassis, et al.., “Topological darkness in self-assembled plasmonic metamaterials,” Adv. Mater., vol. 26, no. 2, pp. 324–330, 2014, https://doi.org/10.1002/adma.201303426.Suche in Google Scholar PubMed
[38] K. V. Sreekanth, S. Han, and R. Singh, “Ge2sb2te5-based tunable perfect absorber cavity with phase singularity at visible frequencies,” Adv. Mater., vol. 30, no. 21, p. 1706696, 2018, https://doi.org/10.1002/adma.201706696.Suche in Google Scholar PubMed
[39] A. Berkhout and A. F. Koenderink, “Perfect absorption and phase singularities in plasmon antenna array etalons,” ACS Photonics, vol. 6, no. 11, pp. 2917–2925, 2019, https://doi.org/10.1021/acsphotonics.9b01019.Suche in Google Scholar
[40] M. Liu, et al.., “Spectral phase singularity and topological behavior in perfect absorption,” Phys. Rev. B, vol. 107, no. 24, p. L241403, 2023, https://doi.org/10.1103/physrevb.107.l241403.Suche in Google Scholar
[41] P. A. Thomas, K. S. Menghrajani, and W. L. Barnes, “All-optical control of phase singularities using strong light-matter coupling,” Nat. Commun., vol. 13, no. 1, p. 1809, 2022, https://doi.org/10.1038/s41467-022-29399-x.Suche in Google Scholar PubMed PubMed Central
[42] E. Cusworth, V. G. Kravets, and A. N. Grigorenko, “Topological darkness in optical heterostructures: Prediction and confirmation,” ACS Photonics, vol. 10, no. 10, pp. 3715–3722, 2023, https://doi.org/10.1021/acsphotonics.3c00879.Suche in Google Scholar PubMed PubMed Central
[43] V. Maslova, P. Lebedev, and D. G. Baranov, “Topological phase singularities in light reflection from non-hermitian uniaxial media,” Adv. Opt. Mater., no. 17, p. 2303263, 2024. https://doi.org/10.1002/adom.202303263.Suche in Google Scholar
[44] B. Vasić and R. Gajić, “Enhanced phase sensitivity of metamaterial absorbers near the point of darkness,” J. Appl. Phys., vol. 116, no. 2, 2014, https://doi.org/10.1063/1.4886897.Suche in Google Scholar
[45] K. V. Sreekanth, et al.., “Biosensing with the singular phase of an ultrathin metal-dielectric nanophotonic cavity,” Nat. Commun., vol. 9, no. 1, p. 369, 2018, https://doi.org/10.1038/s41467-018-02860-6.Suche in Google Scholar PubMed PubMed Central
[46] G. Ermolaev, et al.., “Topological phase singularities in atomically thin high-refractive-index materials,” Nat. Commun., vol. 13, no. 1, p. 2049, 2022. https://doi.org/10.1038/s41467-022-29716-4.Suche in Google Scholar PubMed PubMed Central
[47] G. I. Tselikov, A. Danilov, V. O. Shipunova, S. M. Deyev, A. V. Kabashin, and A. N. Grigorenko, “Topological darkness: How to design a metamaterial for optical biosensing with ultrahigh sensitivity,” ACS Nano, vol. 17, no. 19, pp. 19 338–19 348, 2023, https://doi.org/10.1021/acsnano.3c06655.Suche in Google Scholar PubMed PubMed Central
[48] S. Zhu, et al.., “Label-free biosensing with singular-phase-enhanced lateral position shift based on atomically thin plasmonic nanomaterials,” Light Sci. Appl., vol. 13, no. 1, p. 2, 2024, https://doi.org/10.1038/s41377-023-01345-6.Suche in Google Scholar PubMed PubMed Central
[49] D. G. Baranov, Y. Xiao, I. A. Nechepurenko, A. Krasnok, A. Alù, and M. A. Kats, “Nanophotonic engineering of far-field thermal emitters,” Nat. Mater., vol. 18, no. 9, pp. 920–930, 2019, https://doi.org/10.1038/s41563-019-0363-y.Suche in Google Scholar PubMed
[50] T. J. Antosiewicz and M. Käll, “A multiscale approach to modeling plasmonic nanorod biosensors,” J. Phys. Chem. C, vol. 120, no. 37, pp. 20 692–20 701, 2016, https://doi.org/10.1021/acs.jpcc.6b01897.Suche in Google Scholar
[51] E. Mandel, Leonard, and Wolf, Optical Coherence and Quantum Optics, New York, Cambridge University Press, 1995.10.1017/CBO9781139644105Suche in Google Scholar
[52] Y. Chong, H. Cao, and A. D. Stone, “Noise properties of coherent perfect absorbers and critically coupled resonators,” Phys. Rev. A, vol. 87, no. 1, p. 013843, 2013, https://doi.org/10.1103/physreva.87.013843.Suche in Google Scholar
[53] H. K. Lau and A. A. Clerk, “Fundamental limits and non-reciprocal approaches in non-Hermitian quantum sensing,” Nat. Commun., vol. 9, no. 1, p. 4320, 2018, https://doi.org/10.1038/s41467-018-06477-7.Suche in Google Scholar PubMed PubMed Central
[54] W. Langbein, “No exceptional precision of exceptional-point sensors,” Phys. Rev. A, vol. 98, no. 2, p. 023805, 2018, https://doi.org/10.1103/physreva.98.023805.Suche in Google Scholar
[55] N. A. Mortensen, P. A. D. Gonçalves, M. Khajavikhan, D. N. Christodoulides, C. Tserkezis, and C. Wolff, “Fluctuations and noise-limited sensing near the exceptional point of parity-time-symmetric resonator systems,” Optica, vol. 5, no. 10, p. 1342, 2018, https://doi.org/10.1364/optica.5.001342.Suche in Google Scholar
[56] R. Duggan, S. A. Mann, and A. Alù, “Limitations of sensing at an exceptional point,” ACS Photonics, vol. 9, no. 5, pp. 1554–1566, 2022, https://doi.org/10.1021/acsphotonics.1c01535.Suche in Google Scholar
[57] D. G. Baranov, J. H. Edgar, T. Hoffman, N. Bassim, and J. D. Caldwell, “Perfect interferenceless absorption at infrared frequencies by a van der Waals crystal,” Phys. Rev. B, vol. 92, no. 20, p. 201405(R), 2015, https://doi.org/10.1103/physrevb.92.201405.Suche in Google Scholar
[58] H. Carmichael, An Open Systems Approach to Quantum Optics: Lectures Presented at the Université Libre de Bruxelles, October 28 to November 4, 1991, vol. 18, Berlin, Springer Science & Business Media, 2009.Suche in Google Scholar
Supplementary Material
This article contains supplementary material (https://doi.org/10.1515/nanoph-2025-0101).
© 2025 the author(s), published by De Gruyter, Berlin/Boston
This work is licensed under the Creative Commons Attribution 4.0 International License.
Artikel in diesem Heft
- Frontmatter
- Review
- Design strategies, manufacturing, and applications of radiative cooling technologies
- Letters
- Achieving long-term water stability and strong exciton–photon coupling in CsPbBr3 quantum dots via MOF encapsulation
- Heat generation in spatially confined solids through electronic light scattering
- Research Articles
- Microsphere-assisted generation of localized optical emitters in 2D hexagonal boron nitride
- Monolithic integration of one VCSEL on a single mode fiber
- Ensemble emission of isolated organic chromophores incorporated into an organometallic single crystal
- From dark modes to topology: light-induced skyrmion generation in a plasmonic nanostructure through the inverse faraday effect
- The influence of shot noise on the performance of phase singularity-based refractometric sensors
- Near-field refractometry of van der Waals crystals
- Plasmon–exciton polaritonic emission lifetime dynamics under strong coupling
- Experimental demonstration of dual-polarization multiplexed optical phased array empowered by inverse design