Four-dimensional experimental characterization of partially coherent light using incoherent modal decomposition
-
Xingyuan Lu

 ,
Qiwen Zhan
and
Yangjian Cai
,
Qiwen Zhan
and
Yangjian Cai

Abstract
The intensity distributions and statistics of partially coherent light fields with random fluctuations have proven to be more robust than for coherent light. However, its full potential in practical applications has not been realized due to the lack of four-dimensional optical field measurement. Here, a general incoherent modal decomposition method of partially coherent light field is proposed and demonstrated experimentally. The decomposed random modes can be used to, but not limited to, reconstruct average intensity, cross-spectral density, and orthogonal decomposition properties of the partially coherent light fields. The versatility and flexibility of this method allows it to reveal the invariance of light fields and to retrieve embedded information after propagation through complex media. The Gaussian-shell-model beam and partially coherent Gaussian array are used as examples to demonstrate the reconstruction and even prediction of second-order statistics. This method is expected to pave the way for applications of partially coherent light in optical imaging, optical encryption, and antiturbulence optical communication.
1 Introduction
Invariance in intensity [1], coherence [2], and polarization [3] always attracts great interest, especially when a light beam passes through a complex media. However, different from the intensity, invariance in polarization and coherence is difficult to measure. Recently, with the benefit of basis-independent measurement scheme, the polarization inhomogeneity, which defines vectorial structured light, has been proven to be invariant even in turbulence. However, for a randomly fluctuating partially coherent light field [4], the invariance in coherence structures is only found for specially designed model [2]. For general partially coherent light, the research into its propagation invariance has been hindered by the lack of genuine four-dimensional optical field measurement scheme.
The four-dimensional cross-spectral density function in the space-frequency domain, that is, the statistical average of the fluctuating electric fields [5], has been proposed for characterizing partially coherent beam. Due to the unique advantages of high signal-to-noise ratio [6–8], high-resolution imaging [9], and antiturbulence transmission [10], plenty of schemes for generating partially coherent light with novel coherence structures have been proposed, such as those based on Van Cittert–Zernike theorem [11], modal superposition [12, 13], rotating diffusers, light emitting diodes, lithium niobate [14], and disorder-engineered statistical photonic platform [15].
To characterize partially coherent light field, various methods have been proposed to measure the complex-valued cross-spectral density distribution, such as Young’s double slit [15], generalized Hanbury Brown–Twiss experiment [16, 17], diffraction through obstacles [18], and holography [19, 20]. Existing methods generally focus on measuring two-dimensional coherence structures of a certain point to the whole surface. Even the best measurement of the partially coherent light field only determines finite two-dimensional slices of coherence features [19, 20], which cannot be regarded as a genuine four-dimensional characterization of the partially coherent light field. Its importance is analogous to the difference between measuring the electric field and detecting the intensity for coherent light field. Because of the loss of information in incomplete measurements, the measurement cannot yield characteristics of the field beyond the measurement planes.
In this work, inspired by modal superposition, an experimental incoherent modal decomposition scheme is proposed and demonstrated. The flexibility of characterizing the four-dimensional partially coherent beam with decomposed random modes is shown with a Gaussian-shell-model (GSM) beam and a partially coherent Gaussian array beam. The second-order statistics, including but not limited to average intensity and cross-spectral density, can be freely reconstructed with decomposed modes. No reference arm is introduced, and no prior knowledge of light field is required. The unique advantage that distinguishes it from two-dimensional measurement is that the second-order statistic on the source plane or any other transmission planes can be retrieved with angular spectrum propagation. In addition, the interference properties predicted with the decomposed modes are highly consistent with the experimentally captured ones. This work has potential applications in the measurement of second-order statistics properties [21], coherence manipulation [22], optical imaging [23, 24], topological charge measurement [25, 26], and optical information encryption [2, 27].
2 Theory
Consider a scalar partially coherent source that propagates closely along the z axis. The second-order statistical properties of the source field can be characterized in the space-frequency domain by an electric cross-spectral density function
Partially coherent beams can be regarded as incoherent superposition of fully coherent beams [28]. Thus, in general, one can represent the cross-spectral density function of a statistically stationary partially coherent source with orthogonal decomposition, or random modal decomposition as [12],
Here,
Figure 1 shows a diagram of the diffraction for a partially coherent beam illuminating an object. The partially coherent light composed of mixed modes λ1E1, λ2E2, … λ
n
E
n
illuminates an object
where ρ is the coordinate on the detector plane and
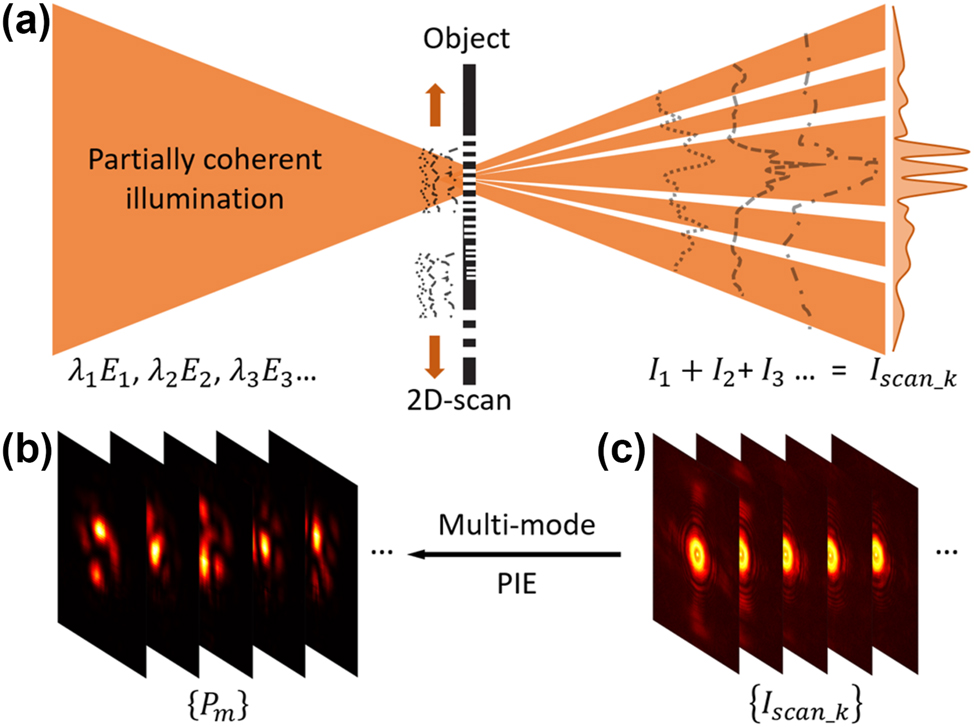
Principle and diagram of modal decomposition of a partially coherent beam. (a) A partially coherent light composed of fluctuating modes
Based on Eq. (2), the average diffraction intensity is highly related to the object and illumination. Thus, we introduced the multi-mode ptychography iterative engine (PIE) to reconstruct the object
Here, the update factor β is set as 0.9 in the following data analysis.
where
For any linear and time invariant system whose transmission matrix is measurable,
3 Results
3.1 Experimental set-up
A proof-of-principle experiment was conducted with GSM beam and partially coherent Gaussian array beam. It will be demonstrated that the measured modes
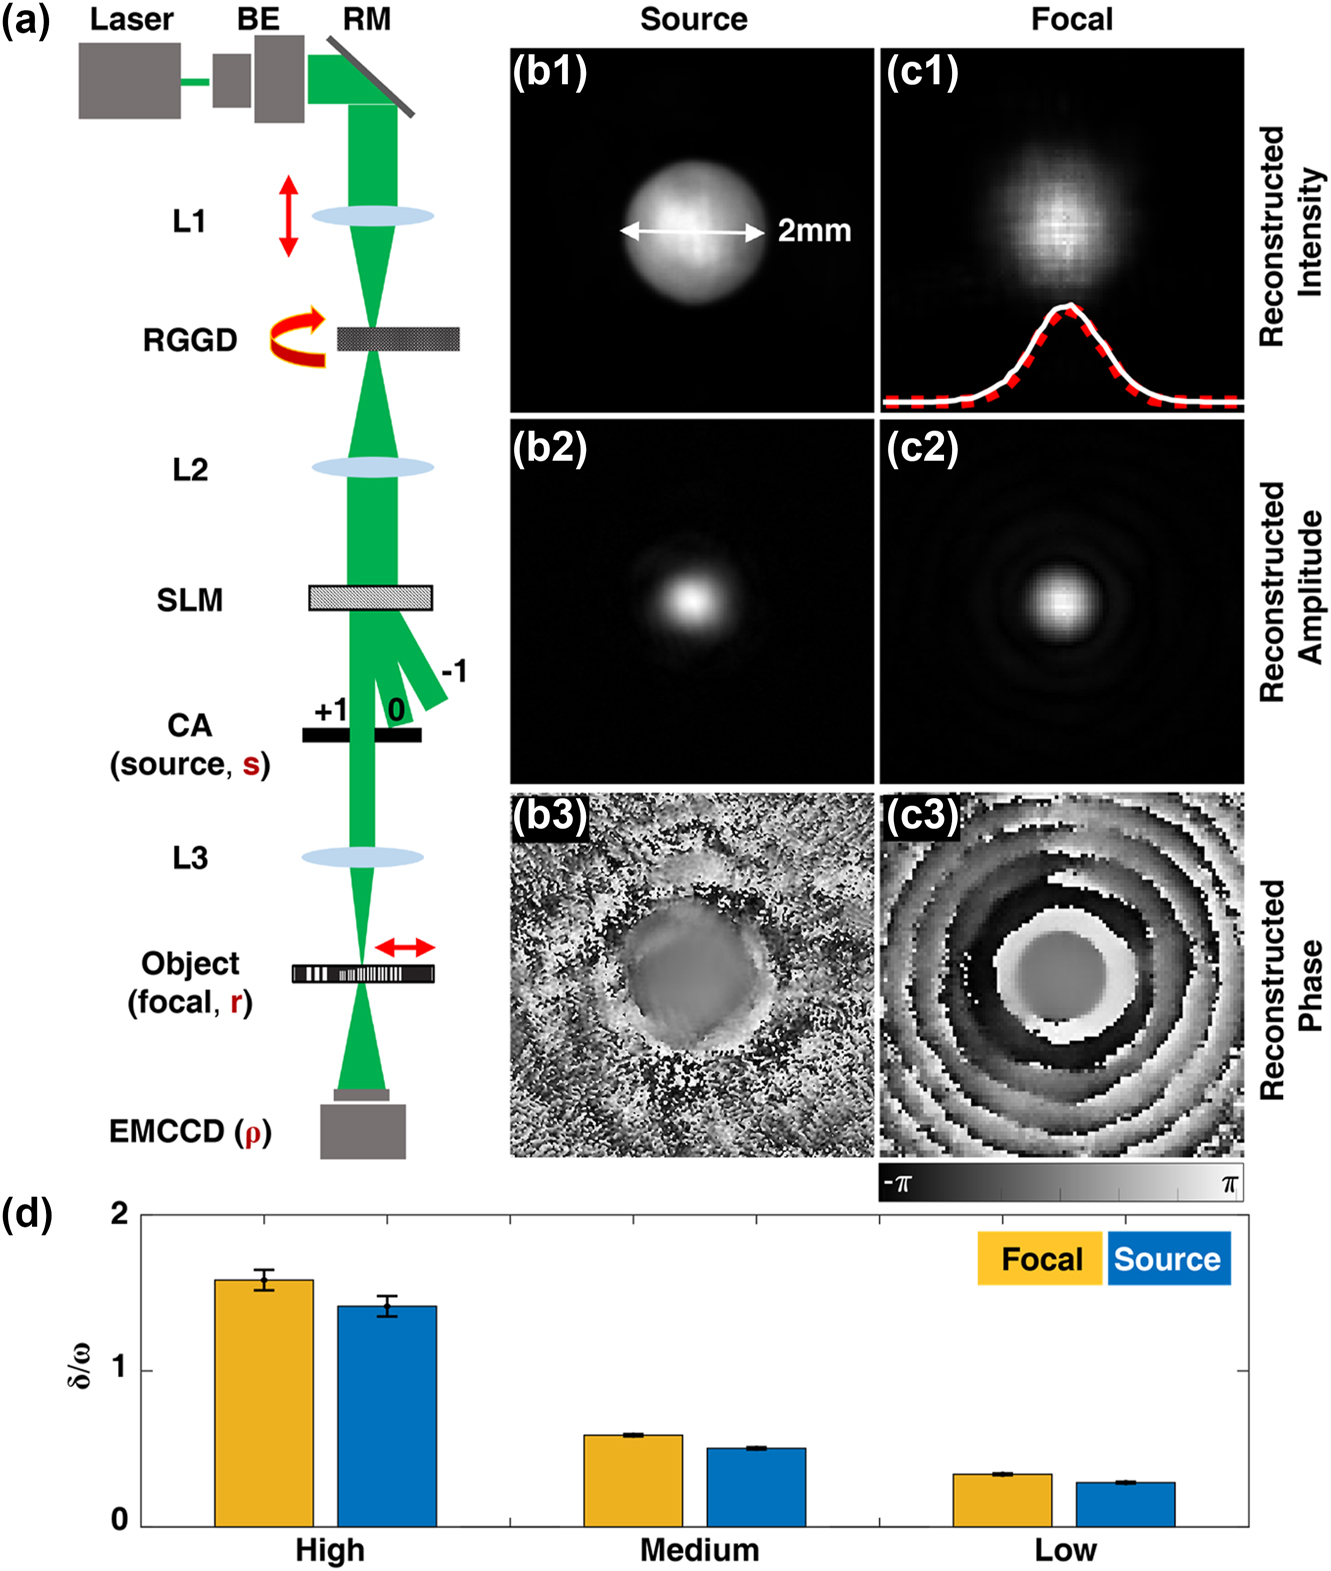
Second-order statistics reconstruction of partially coherent GSM from experimentally decomposed modes. (a) Schematic diagram of the experimental setup. BE, beam expander; RM, reflective mirror; RGGD, rotating ground glass disk; SLM, spatial light modulator; CA, circular aperture; s, r, and ρ denote vector coordinates on the source, object, and detection plane, respectively. Focal average intensity, cross-spectral density amplitude and cross-spectral density phase patterns of a GSM on the (b1–b3) source and (c1–c3) focal plane. Illustration in (c1) shows a fitting of actually captured intensity (white-solid curve) and reconstructed intensity (red-dashed curve). (d) Shows the reconstructed ratio of beam waist ω and spatial coherent width δ for cases with high to low coherence. The error bars represent the standard deviation of ten measurement results.
Taking the back focal plane of lens L3 as the region of interest, an object (USAF resolution test chart) is placed perpendicular to optical axis, after which the diffractive intensities are captured with a camera (EMCCD, iXon Life, Oxford). The distance of the object to the camera is set as 146 mm. In order to collect more diffraction information, overlap scanning is performed by fixing the object on a two-dimensional mobile stage (CONEX-MFACC Newport). A total of 400 raw diffraction patterns were captured via 20 × 20 two-dimensional (2D) overlap scanning. The probe beam width is around 200 μm, and the shifting step size is set as 40 μm. After 100 iterations, a set of probes
To demonstrate the modal decomposition of a GSM beam, a Gaussian amplitude mask with beam waist ω0 = 1 mm is loaded on the SLM. The theoretical model of a GSM on the source plane is
From 20 × 20 diffraction patterns (examples shown in Figure 1(c)), in total 64 random modes (examples shown in Figure 1(b)) are reconstructed and
A focusing lens can be regarded as a linear and time invariant system and the transmission matrix is measurable. Thus, the modes
As the initial coherence width decreases, the focal and source intensities maintain Gaussian profile, while the focal beam waist will increase gradually. Figure 2(d) shows the measured ratio of coherence/beam-waist (that is δ/ω) for different levels of coherence (high, medium, and low). Ten datasets are analyzed for each case and the height of each bar is set as the mean value of ten measurements. It shows that, the source ratio is nearly the same as that on the focal plane, which is consistent with the theoretical prediction. The error bar shows the measurement error will decrease as the coherence decreases. The slight increase from source to focal plane is caused by the aperture applied on the source GSM.
3.2 Inverse propagation of complex partially coherent light
To further evaluate the generality of the proposed measurement method, the second-order statistics for a partially coherent Gaussian array beam [31] are measured, as shown in Figure 3. The Gaussian array mask is loaded on the SLM, and the modulated +1 order is then selected with a circular aperture (or a 4f lens system). The beam waist of each Gaussian spot is 0.3 mm and the center-to-center distance is set as 0.8 mm. Four kinds of array layouts are shown here. Each focused partially coherent Gaussian array beam illuminates the object plane, and their corresponding modes are measured. Similar with previous calculation, the intensity and cross-spectral density are reconstructed with these measured modes. It can be found that, the focal properties (Figure 3(a–d)) evolve into distributions totally different from the source plane (Figure 3(e–h)).
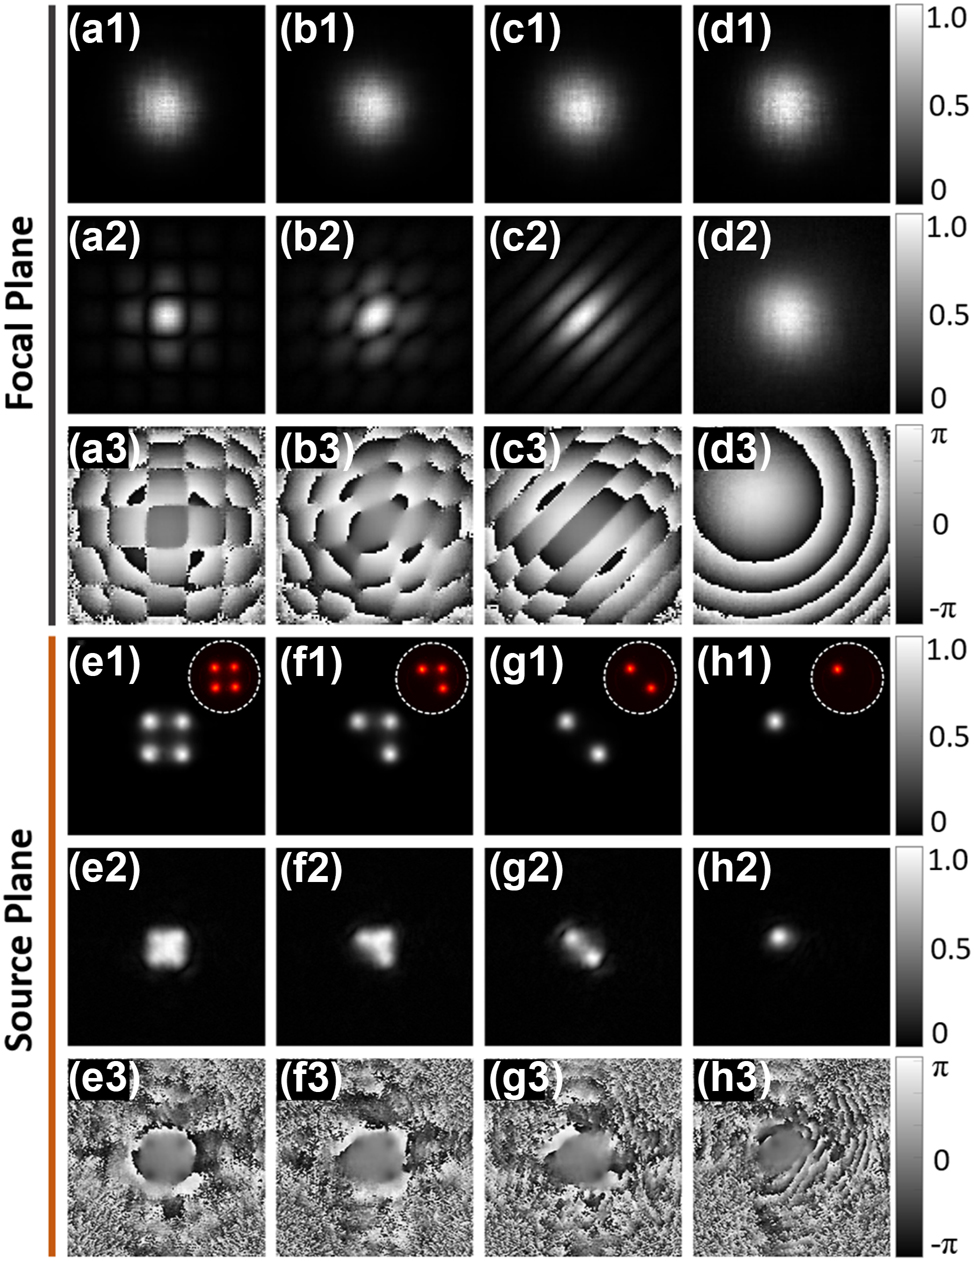
Second-order statistics reconstruction of low coherence Gaussian array from experimentally decomposed modes. (a1–d1) Focal average intensity, (a2–d2) cross-spectral density amplitude, and (a3–d3) cross-spectral density phase are reconstructed with measured focal modes
For high coherence light source, the focal pattern differs as the Gaussian array changes due to the interference. However, as the coherence decreases, all these focal intensities tend to be Gaussian distributed, as shown in Figure 3(a1–d1). Different from GSM beam, the cross-spectral density of partially coherent Gaussian array is complex valued, whose structure has more features. For the single Gaussian spot case, the focal intensity and cross-spectral density amplitude are similar with that shown in Figure 2, while the phase shows difference due to the off-center of Gaussian spot on the source plane. Furthermore, the intensity and cross-spectral density information on the source plane are also calculated by inverse propagation of focal plane modes to the source plane. The actually captured intensities are shown in illustrations (white dashed circle) of Figure 3(e1–h1). Obviously, the Gaussian array structures are reconstructed very well, even the focal intensity has no more features to distinguish the array layout. The proposed method is also effective for more complicated light fields, such as vortex beams with different degrees of coherence (Supplementary Figure S1). This study may find applications in optical encrypted transmission.
3.3 Prediction of interference properties
After reconstructing the source modes
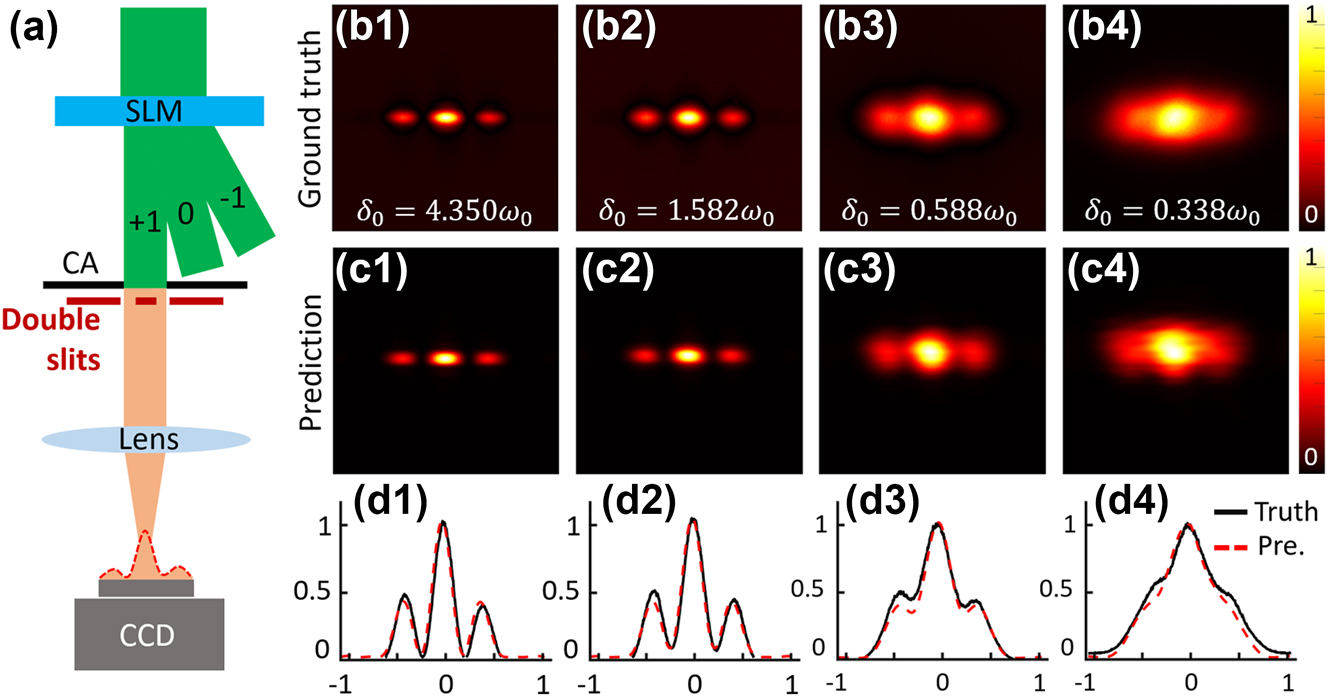
Interference prediction of a GSM beam passing through a double-slit. (a) Diagram of double-slit interference. (b1–b4) Experimentally captured interference fringes of a GSM beam passing through a double-slit under different spatial coherence. (c1–c4) Corresponding prediction results with reconstructed source modes. (d1–d4) Cross lines of predicted intensity (red dotted lines) and real-captured intensity (black lines).
4 Discussions
The solution of the incoherent decomposition for a four-dimensional partially coherent light field is not unique. Thus, the correctness evaluation criterion is not the single mode itself, but the recovered statistical properties using all the modes, such as intensity and cross spectral density. The main influence of the correctness is the number of modes used in the reconstruction. Supplementary Figure S1 shows the relationship between the correlation coefficient of the reconstruction results relative to the truth and the number of modes used for reconstruction. Meanwhile, the oversampling ratio defined with the ratio of known pixels (e.g., 400 diffraction patterns) over unknown pixels (e.g., 64 complex-valued modes to be reconstructed) larger than 2 is the basic condition to be followed. Otherwise, the correlation coefficient will not increase even the number of modes increase. In other words, another solution to improve the correctness is using higher scattering objects. When choosing the scattering object, the purpose should be improving the richness of the diffraction patterns to ensure the oversampling ratio is larger than 2 [32, 33].
Theoretically, when the degree of coherence is reduced, the number of modes (M) will increase [12]. In the simulation of GSM modal superposition, when M equals 25 for high coherence light source and M equals 64 for lower coherence cases, the superimposed intensity and cross-spectral density matches well with that calculated with GSM Mathematica model. The experimental reconstruction error metric (commonly called R factor) can be calculated with the captured intensity Iscan_k and the calculated intensity
5 Conclusions
To summarize, experimental modal decomposition of partially coherent beam has been demonstrated via scanning an object with the beam to be measured. This method provides a flexible and high-precision way to fully characterize the second-order statistical properties of randomly fluctuated partially coherent beams. This scheme integrates all the functions of the existing measurement schemes of partially coherent beam, while the experimental setup is uniaxial. Only a scattering object and a camera are needed. In addition, the decomposed modes can be inversely propagated to the source plane, or any other transverse planes of a linear and time invariant optical system, as long as the transmission matrix is known or measurable. Therefore, the statistical properties of un-occurring diffraction or interference can be predicted.
In this work, we designed several experiments to demonstrate the effectiveness of the measured modes in characterizing or predicting the second-order statistics, e.g., intensity and cross-spectral density. In addition, these decomposed modes are expected to play important roles in practical application scenarios. For low coherence beam whose intensity contains few information or the beam whose information is hidden in the source cross-spectral density distribution, the modal decomposition scheme demonstrated in this work is powerful and indispensable. It has potential applications in the characterization of the superimposed partially coherent beam with complex-valued screens, such as modal-weight measurement by orthogonal decomposition. Then, the encryption of partially coherent light will become implementable. The idea of iterative reconstruction is also expected to be feasible in designing minimal-mode partially coherent light source in micro–nano system where lithium niobate crystal [34] or meta-surface [15] could be used. Furthermore, the results in Figure 4 provide inspiration that the evolution features of partially coherent light fields, which initially require three-dimensional scanning to be reconstructed, can be transformed into two-dimensional scans on a single plane. It also paves the way for the study of invariance in partially coherent beams after propagating through a complex media, such as turbulence atmosphere.
Funding source: Tang Scholar
Funding source: Local Science and Technology Development Project of the Central Government
Award Identifier / Grant number: YDZX20203700001766
Funding source: Key Lab of Modern Optical Technologies of Jiangsu Province
Award Identifier / Grant number: KJS2138
Funding source: National Key Research and Development Program of China
Award Identifier / Grant number: 2019YFA0705000
Award Identifier / Grant number: 2022YFA1404800
Funding source: National Natural Science Foundation of China
Award Identifier / Grant number: 11974218
Award Identifier / Grant number: 12174280
Award Identifier / Grant number: 12192254
Award Identifier / Grant number: 12204340
Award Identifier / Grant number: 92050202
Award Identifier / Grant number: 92250304
Funding source: China Postdoctoral Science Foundation
Award Identifier / Grant number: 2022M722325
-
Research funding: National Key Research and Development Program of China (No. 2022YFA1404800, No. 2019YFA0705000), National Natural Science Foundation of China (No. 12204340, No. 12174280, No. 12192254, No. 11974218, No. 92250304, No. 92050202), China Postdoctoral Science Foundation (2022M722325), Priority Academic Program Development of Jiangsu Higher Education Institutions, Tang Scholar, Local Science and Technology Development Project of the Central Government (No. YDZX20203700001766), Key Lab of Modern Optical Technologies of Jiangsu Province (KJS2138).
-
Author contributions: All authors have accepted responsibility for the entire content of this manuscript and approved its submission. X.L. and Z.W. contributed equally to this work.
-
Conflict of interest statement: The authors declare no conflicts of interest regarding this article.
-
Data availability statement: The datasets generated and/or analysed during the current study are available from the corresponding author upon reasonable request.
References
[1] J. Durnin, J. J. MiceliJr., and J. H. Eberly, “Diffraction-free beams,” Phys. Rev. Lett., vol. 58, no. 15, p. 1499, 1987. https://doi.org/10.1103/physrevlett.58.1499.Search in Google Scholar PubMed
[2] Y. Liu, Z. Dong, Y. Chen, et al.., “Research advances of partially coherent beams with novel coherence structures: engineering and applications,” Opto-Electron. Eng., vol. 49, no. 11, pp. 220178-1–220178-28, 2022.Search in Google Scholar
[3] I. Nape, K. Singh, A. Klug, et al.., “Revealing the invariance of vectorial structured light in complex media,” Nat. Photonics, vol. 16, no. 7, pp. 538–546, 2022. https://doi.org/10.1038/s41566-022-01023-w.Search in Google Scholar
[4] E. Wolf, Introduction to the Theory of Coherence and Polarization of Light, New York, Cambridge University Press, 2007.Search in Google Scholar
[5] L. Mandel and E. Wolf, Optical Coherence and Quantum Optics, New York, Cambridge University Press, 1995.10.1017/CBO9781139644105Search in Google Scholar
[6] Y. Peng, S. Choi, J. Kim, and G. Wetzstein, “Speckle-free holography with partially coherent light sources and camera-in-the-loop calibration,” Sci. Adv., vol. 7, no. 46, p. eabg5040, 2021. https://doi.org/10.1126/sciadv.abg5040.Search in Google Scholar PubMed PubMed Central
[7] B. Redding, M. A. Choma, and H. Cao, “Speckle-free laser imaging using random laser illumination,” Nat. Photonics, vol. 6, no. 6, pp. 355–359, 2012. https://doi.org/10.1038/nphoton.2012.90.Search in Google Scholar PubMed PubMed Central
[8] D. Kip, M. Soljacic, M. Segev, E. Eugenieva, and D. N. Christodoulides, “Modulation instability and pattern formation in spatially incoherent light beams,” Science, vol. 290, no. 5491, pp. 495–498, 2000. https://doi.org/10.1126/science.290.5491.495.Search in Google Scholar PubMed
[9] S. Knitter, C. Liu, B. Redding, M. K. Khokha, M. A. Choma, and H. Cao, “Coherence switching of a degenerate VECSEL for multimodality imaging,” Optica, vol. 3, no. 4, pp. 403–406, 2016. https://doi.org/10.1364/optica.3.000403.Search in Google Scholar
[10] T. Shirai, A. Dogariu, and E. Wolf, “Mode analysis of spreading of partially coherent beams propagating through atmospheric turbulence,” J. Opt. Soc. Am. A, vol. 20, no. 6, pp. 1094–1102, 2003. https://doi.org/10.1364/josaa.20.001094.Search in Google Scholar PubMed
[11] J. W. Goodman, Statistical optics, Hoboken, J. Wiley, and Sons, 2015.Search in Google Scholar
[12] F. Wang, H. Lv, Y. Chen, Y. Cai, and O. Korotkova, “Three modal decompositions of Gaussian Schell-model sources: comparative analysis,” Opt. Express, vol. 29, no. 19, pp. 29676–29689, 2021. https://doi.org/10.1364/oe.435767.Search in Google Scholar
[13] H. Wang, X. Peng, H. Zhang, et al.., “Experimental synthesis of partially coherent beam with controllable twist phase and measuring its orbital angular momentum,” Nanophotonics, vol. 11, no. 4, pp. 689–696, 2022. https://doi.org/10.1515/nanoph-2021-0432.Search in Google Scholar
[14] A. Efimov, “Gigabit per second modulation and transmission of a partially coherent beam through laboratory turbulence,” in Free-Space Laser Communication and Atmospheric Propagation XXVIII, vol. 9739, SPIE, 2016, pp. 163–168.10.1117/12.2208752Search in Google Scholar
[15] L. Liu, W. Liu, F. Wang, et al.., “Spatial coherence manipulation on the disorder-engineered statistical photonic platform,” Nano Lett., vol. 22, no. 15, pp. 6342–6349, 2022. https://doi.org/10.1021/acs.nanolett.2c02115.Search in Google Scholar PubMed
[16] Z. Huang, Y. Chen, F. Wang, S. A. Ponomarenko, and Y. Cai, “Measuring complex degree of coherence of random light fields with generalized Hanbury Brown–Twiss experiment,” Phys. Rev. Appl., vol. 13, no. 4, p. 044042, 2020. https://doi.org/10.1103/physrevapplied.13.044042.Search in Google Scholar
[17] X. Liu, Q. Chen, J. Zeng, Y. Cai, and C. Liang, “Measurement of optical coherence structures of random optical fields using generalized Arago spot experiment,” Opto-Electron. Sci., vol. 2, no. 2, p. 220024, 2023. https://doi.org/10.29026/oes.2023.220024.Search in Google Scholar
[18] J. K. Wood, K. A. Sharma, S. Cho, T. G. Brown, and M. A. Alonso, “Using shadows to measure spatial coherence,” Opt. Lett., vol. 39, no. 16, pp. 4927–4930, 2014. https://doi.org/10.1364/ol.39.004927.Search in Google Scholar
[19] Y. Shao, X. Lu, S. Konijnenberg, C. Zhao, Y. Cai, and H. P. Urbach, “Spatial coherence measurement and partially coherent diffractive imaging using self-referencing holography,” Opt. Express, vol. 26, no. 4, pp. 4479–4490, 2018. https://doi.org/10.1364/oe.26.004479.Search in Google Scholar
[20] L. Waller, G. Situ, and J. W. Fleischer, “Phase-space measurement and coherence synthesis of optical beams,” Nat. Photonics, vol. 6, no. 7, pp. 474–479, 2012. https://doi.org/10.1038/nphoton.2012.144.Search in Google Scholar
[21] M. Leonetti, L. Pattelli, S. D. Panfilis, D. S. Wiersma, and G. Ruocco, “Spatial coherence of light inside three-dimensional media,” Nat. Commun., vol. 12, no. 1, p. 4199, 2021. https://doi.org/10.1038/s41467-021-23978-0.Search in Google Scholar PubMed PubMed Central
[22] M. Liu, J. Chen, Y. Zhang, Y. Shi, C. L. Zhao, and S. Z. Jin, “Generation of coherence vortex by modulating the correlation structure of random lights,” Photonics Res., vol. 7, no. 12, pp. 1485–1492, 2019. https://doi.org/10.1364/prj.7.001485.Search in Google Scholar
[23] P. Thibault and A. Menzel, “Reconstructing state mixtures from diffraction measurements,” Nature, vol. 494, no. 7435, pp. 68–71, 2013. https://doi.org/10.1038/nature11806.Search in Google Scholar PubMed
[24] W. Yu, S. Wang, S. Veetil, S. Gao, C. Liu, and J. Zhu, “High-quality image reconstruction method for ptychography with partially coherent illumination,” Phys. Rev. B, vol. 93, no. 24, p. 241105, 2016. https://doi.org/10.1103/physrevb.93.241105.Search in Google Scholar
[25] X. Lu, C. Zhao, Y. Shao, et al.., “Phase detection of coherence singularities and determination of the topological charge of a partially coherent vortex beam,” Appl. Phys. Lett., vol. 114, no. 20, p. 201106, 2019. https://doi.org/10.1063/1.5095713.Search in Google Scholar
[26] P. Ma, X. Liu, Q. Zhang, et al.., “Universal orbital angular momentum detection scheme for any vortex beam,” Opt. Lett., vol. 47, no. 22, pp. 6037–6040, 2022. https://doi.org/10.1364/ol.475818.Search in Google Scholar PubMed
[27] D. Peng, Z. Huang, Y. Liu, et al.., “Optical coherence encryption with structured random light,” PhotoniX, vol. 2, no. 1, pp. 1–15, 2021. https://doi.org/10.1186/s43074-021-00027-z.Search in Google Scholar PubMed PubMed Central
[28] E. Wolf, “New spectral representation of random sources and of the partially coherent fields that they generate,” Opt. Commun., vol. 38, no. 1, pp. 3–6, 1981. https://doi.org/10.1016/0030-4018(81)90295-9.Search in Google Scholar
[29] A. Rana, J. Zhang, M. Pham, et al.., “Potential of attosecond coherent diffractive imaging,” Phys. Rev. Lett., vol. 125, no. 8, p. 086101, 2020. https://doi.org/10.1103/physrevlett.125.086101.Search in Google Scholar PubMed
[30] P. D. Santis, F. Gori, G. Guattari, and C. Palma, “An example of a Collett-Wolf source,” Opt. Commun., vol. 29, no. 3, pp. 256–260, 1979. https://doi.org/10.1016/0030-4018(79)90094-4.Search in Google Scholar
[31] Y. Cai, Q. Lin, Y. Baykal, and H. T. Eyyuboğlu, “Off-axis Gaussian Schell-model beam and partially coherent laser array beam in a turbulent atmosphere,” Opt. Commun., vol. 278, no. 1, pp. 157–167, 2007. https://doi.org/10.1016/j.optcom.2007.05.046.Search in Google Scholar
[32] J. Miao, D. Sayre, and H. N. Chapman, “Phase retrieval from the magnitude of the Fourier transforms of nonperiodic objects,” JOSA A, vol. 15, no. 6, pp. 1662–1669, 1998. https://doi.org/10.1364/josaa.15.001662.Search in Google Scholar
[33] J. Miao, T. Ishikawa, E. H. Anderson, and K. O. Hodgson, “Phase retrieval of diffraction patterns from noncrystalline samples using the oversampling method,” Phys. Rev. B, vol. 67, no. 17, p. 174104, 2003. https://doi.org/10.1103/physrevb.67.174104.Search in Google Scholar
[34] H. Hemmati and D. M. Boroson, “Free-space laser communication and atmospheric propagation XXVIII,” Proc. of SPIE, vol. 9739, p. 973901, 2017.10.1117/12.2239310Search in Google Scholar
Supplementary Material
This article contains supplementary material (https://doi.org/10.1515/nanoph-2023-0288).
© 2023 the author(s), published by De Gruyter, Berlin/Boston
This work is licensed under the Creative Commons Attribution 4.0 International License.
Articles in the same Issue
- Frontmatter
- Research Articles
- Broadband synchronization of ultrafast pulse generation with double-walled carbon nanotubes
- Noncontractible loop states from a partially flat band in a photonic borophene lattice
- Experimental investigation of a near-field focusing performance of the IP-Dip polymer based 2D and 3D Fresnel zone plate geometries fabricated using 3D laser lithography coated with hyperbolic dispersion surface layered metamaterial
- 100-Gbps per-channel all-optical wavelength conversion without pre-amplifiers based on an integrated nanophotonic platform
- Multi-height metasurface for wavefront manipulation fabricated by direct laser writing lithography
- Enabling infinite Q factors in absorbing optical systems
- Erbium emitters in commercially fabricated nanophotonic silicon waveguides
- Four-dimensional experimental characterization of partially coherent light using incoherent modal decomposition
- Fine-tuning biexcitons-plasmon coherent states in a single nanocavity
- Möbius edge band and Weyl-like semimetal flat-band in topological photonic waveguide array by synthetic gauge flux
- Dual-band optical collimator based on deep-learning designed, fabrication-friendly metasurfaces
- Thickness insensitive nanocavities for 2D heterostructures using photonic molecules
- Beam-steering metasurfaces assisted coherent optical wireless multichannel communication system
- Asymmetric metasurface photodetectors for single-shot quantitative phase imaging
- Room-temperature unidirectional routing of valley excitons of monolayer WSe2 via plasmonic near-field interference in symmetric nano-slits